Bekaert: first half year 2017 results
28 Juillet 2017 - 7:00AM

Bekaert achieves
strong sales and profits
Highlights
Bekaert achieved a 15% increase in
consolidated revenue, reaching a record € 2 095 million in first
half sales. The growth stemmed from strong organic sales (+6.5%),
M&A (+6.5%) reflecting the incremental impact of the Bridon
integration within the Bridon-Bekaert Ropes Group, and favorable
currency movements (+2%).
Underlying EBIT increased 12% to € 176
million at a margin of 8.4%.
The main factors contributing to the
strong performance in the first half of 2017 were:
- firm demand from automotive,
industrial steel wire and construction markets;
- a turn-around in profitability in
North America;
- incremental benefits from the
transformation programs which all focus on creating value.
The margin was slightly down from 8.6%
in the first half of 2016 due to:
- the incorporation of the Bridon
activities in Bridon-Bekaert Ropes Group at lower than average
margins;
- increased difficulty in passing on
wire rod price increases to customers;
- a deterioration of Latin American
markets due to political and economic instability;
- tailing off demand in various markets
at the end of the second quarter due to stock reduction
actions.
Key
Financials
- Consolidated sales of € 2.1 billion
(+15%) and combined sales of € 2.4 billion (+14%)
- Currency impact: € +36 million (+2%)
on consolidated sales; € +97 million (+5%) on combined sales
- Underlying gross profit of € 382
million (18% margin) compared with € 347 million (19% margin)
- Underlying EBIT of € 176 million
(8.4% margin) compared with € 157 million (8.6% margin)
- EBIT of € 197 million (9.4% margin)
compared with € 143 million (7.9% margin)
- Underlying EBITDA of € 277 million
(13.2% margin) compared with € 259 million (14.2% margin)
- EBITDA of € 297 million (14.2%
margin) compared with € 242 million (13.3% margin)
- Underlying ROCE of 13.1% compared
with 12.7% and ROCE of 14.6% compared with 11.6%
- Net debt of € 1 230 million. Net debt
on underlying EBITDA was 2.2, unchanged from the same period last
year and slightly up from 2.1 at year-end 2016
Press release in PDF
This
announcement is distributed by Nasdaq Corporate Solutions on behalf
of Nasdaq Corporate Solutions clients.
The issuer of this announcement warrants that they are solely
responsible for the content, accuracy and originality of the
information contained therein.
Source: Bekaert via Globenewswire
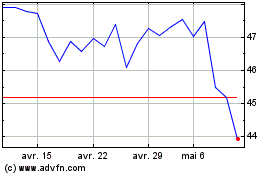
NV Bekaert (EU:BEKB)
Graphique Historique de l'Action
De Mar 2024 à Avr 2024

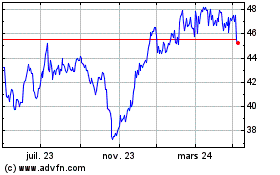
NV Bekaert (EU:BEKB)
Graphique Historique de l'Action
De Avr 2023 à Avr 2024
