FTSE 100 Index Ends the Week 0.65% Lower at 7494.13 -- Data Talk
21 Janvier 2022 - 7:00PM
Dow Jones News
The FTSE 100 Index is down 48.82 points or 0.65% this week to
7494.13
--Largest one week point and percentage decline since the week
ending Nov. 26, 2021
--Snaps a four week winning streak
--Today it is down 90.88 points or 1.20%
--Largest one day point and percentage decline since Friday,
Nov. 26, 2021
--Down for two consecutive trading days
--Down 95.53 points or 1.26% over the last two trading days
--Largest two day point and percentage decline since Monday,
Nov. 29, 2021
--Down three of the past four trading days
--Off 4.87% from its record close of 7877.45 hit Tuesday, May
22, 2018
--Up 18.24% since the pre-Brexit vote level of 6338.10 hit
Thursday, June 23, 2016
--Lowest closing value since Tuesday, Jan. 11, 2022
--Off 1.54% from its 52-week high of 7611.23 hit Monday, Jan.
17, 2022
--Up 16.96% from its 52-week low of 6407.46 hit Friday, Jan. 29,
2021
--Rose 11.94% from 52 weeks ago
--Off 1.54% from its 2022 closing high of 7611.23 hit Monday,
Jan. 17, 2022
--Up 0.66% from its 2022 closing low of 7445.25 hit Monday, Jan.
10, 2022
--Month-to-date it is up 1.48%
--Year-to-date it is up 109.59 points or 1.48%
Source: Dow Jones Market Data, FactSet
(END) Dow Jones Newswires
January 21, 2022 12:45 ET (17:45 GMT)
Copyright (c) 2022 Dow Jones & Company, Inc.
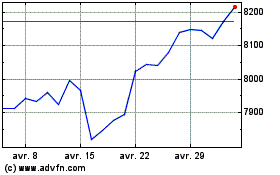
FTSE 100 (FTSE:UKX)
Graphique Historique de l'Index
De Mar 2024 à Avr 2024

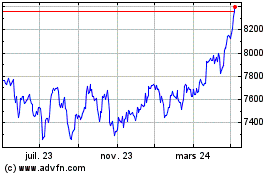
FTSE 100 (FTSE:UKX)
Graphique Historique de l'Index
De Avr 2023 à Avr 2024
