- Total revenue growth of 8.8% and organic growth1 of
6.5%
- Workforce grew by 4.3% relative to Q1 2021, including 12.2%
growth in India
Regulatory News:
Sopra Steria (Paris:SOP) generated revenue of €1,267.7
million in the first quarter of 2022, representing growth of 8.8%.
At constant scope and exchange rates, revenue grew 6.5%.
Sopra Steria: Consolidated revenue – Q1 2022 €m / %
Q1 2022
Q1 2021
Organic growth
Total growth
Revenue
1,267.7
1,165.2
6.5%
8.8%
Cyril Malargé, Chief Executive Officer of Sopra Steria Group,
commented:
“We turned in a strong first quarter, slightly exceeding our
initial expectations. Market conditions were buoyant, still driven
by our clients’ digital transformation projects. Growth was
particularly strong in the defence and aeronautics vertical
markets, which made up around 20% of our revenue. In the current
context in which major investments are being made in digital, we
expanded our resources and the added value delivered to our
clients, reflected in particular in an increase in our sales
prices. As such, we began the year in step with our short- and
medium-term targets. The invasion of Ukraine has made the European
economic environment more uncertain. I’d like to reiterate that the
Group does not have any direct exposure to Russia or Ukraine, and
our presence in the manufacturing sector is very limited. At this
stage, we have not observed any changes in purchasing decisions
among our major clients. Our core strengths in this context are the
close relationships we have with our clients and our large share of
revenue from recurring activities (more than 40%).”
Comments on Q1 2022 business activity
Revenue came to €1,267.7 million, a total increase of 8.8%
relative to Q1 2021. Changes in scope had a positive impact of
€11.8 million, and currency fluctuations had a positive impact of
€13.4 million. At constant scope and exchange rates, revenue grew
6.5%.
In France (40% of the Group total), revenue came to
€513.2 million, equating to organic growth of 9.6%.
Consulting activities performed well, achieving growth of more than
10%. The defence and aeronautics sectors were particularly robust,
both showing double-digit growth. The banking sector was also very
active, with growth of around 10%, while the energy, telecoms,
transport and social services vertical markets grew less
quickly.
In the United Kingdom (17% of Group total), revenue was
virtually stable (up 0.3%) at constant scope and exchange rates,
amounting to €219.0 million. The basis for comparison in Q1 2021
was very high, with revenue having grown by 16.8% in that quarter.
The joint ventures specialising in business process services for
the public sector (NHS SBS and SSCL) saw slightly negative growth
on average, while the rest of the public sector posted slightly
positive growth. The defence & aeronautics vertical market
posted growth of more than 10%. The private sector saw negative
growth, but to a lesser extent than in 2021. This sector is
expected to return to positive growth in the second half of the
year, in particular thanks to the implementation of the new debt
collection service.
The Other Europe reporting unit posted €365.0 million in
revenue (29% of the Group total). Organic revenue growth for the
reporting unit was 8.1%. This performance was driven by Scandinavia
and Bénélux, with these two geographic regions seeing double-digit
growth.
Revenue for Sopra Banking Software (8% of Group revenue)
came to €103.2 million, equating to slight growth with
respect to Q1 2021 (up 0.8%). As in previous quarters, the
reporting unit continued to invest in product development, focusing
in particular on digital layers. The gradual transformation of
R&D continued according to plan.
The Other Solutions reporting unit (5% of Group revenue)
posted revenue of €67.3 million, representing organic growth of
5.9%. Human resources solutions posted growth of 9.1%. Revenue from
property management solutions was relatively stable.
Workforce
3,585 new employees joined the Group in the first quarter
of 2022, representing around a third of the annual recruitment
target.
At end-March 2022, the Group’s net workforce was up 4.3%
compared with Q1 2021, with 12.2% of this increase in India. The
Group had a total workforce of 48,114 people, compared with 47,437
people at 31 December 2021 and 45,959 people at 31 March 2021.
Staff employed at international service centres (India, Poland,
Spain, etc.) represented 18.3% of the total workforce (17.5% at 31
March 2021).
The number of subcontractors was up 738 people at
end-March 2022 compared with end-December 2021.
The workforce attrition rate came to 20%, a level similar
to Q1 2019.
Outlook
The macroeconomic environment has deteriorated since the
invasion of Ukraine on 24 February 2022. However, the first quarter
was dynamic and slightly exceeded the Group’s initial expectations.
Given this situation and based on the information currently
available, the targets previously reported on 24 February 2022
remain valid.
Recap of targets for 2022 reported on 24 February
2022
- Organic revenue growth of between 5% and 6%
- Operating margin on business activity of between 8.5% and
9.0%
- Free cash flow of around €250 million
Q1 2022 revenue presentation meeting
Revenue for the first quarter of 2022 will be presented to
financial analysts and investors via a bilingual (French and
English) conference call to be held on 29 April 2022 at 8:00 a.m.
CET:
- French-language phone number: +33 (0)1 70 71 01 59 – PIN:
66479034#
- English-language phone number: +44 (0)207 194 37 59 – PIN:
86559732#
Practical information about this conference call can be found in
the ‘Investors’ section of the Group’s website:
https://www.soprasteria.com/investors
Upcoming financial publications
Wednesday, 1 June 2022 (2:30 p.m.): General Meeting of
Shareholders
Thursday, 28 July 2022 (before market open): Publication of H1
2022 results
Friday, 28 October 2022 (before market open): Publication of Q3
2022 revenue
Glossary
- Restated revenue: Revenue
for the prior year, expressed on the basis of the scope and
exchange rates for the current year.
- Organic revenue growth:
Increase in revenue between the period under review and restated
revenue for the same period in the prior financial year.
- EBITDA: This measure, as
defined in the Universal Registration Document, is equal to
consolidated operating profit on business activity after adding
back depreciation, amortisation and provisions included in
operating profit on business activity.
- Operating profit on business
activity: This measure, as defined in the Universal
Registration Document, is equal to profit from recurring operations
adjusted to exclude the share-based payment expense for stock
options and free shares and charges to amortisation of allocated
intangible assets.
- Profit from recurring
operations: This measure is equal to operating profit
before other operating income and expenses, which includes any
particularly significant items of operating income and expense that
are unusual, abnormal, infrequent or not foreseeable, presented
separately in order to give a clearer picture of performance based
on ordinary activities.
- Basic recurring earnings per
share: This measure is equal to basic earnings per share
before other operating income and expenses net of tax.
- Free cash flow: Free cash
flow is defined as the net cash from operating activities; less
investments (net of disposals) in property, plant and equipment,
and intangible assets; less lease payments; less net interest paid;
and less additional contributions to address any deficits in
defined-benefit pension plans.
- Downtime: Number of days
between two contracts (excluding training, sick leave, other leave
and pre-sale) divided by the total number of business days.
Disclaimer
This document contains forward-looking information subject to
certain risks and uncertainties that may affect the Group’s future
growth and financial results. Readers are reminded that licence
agreements, which often represent investments for clients, are
signed in greater numbers in the second half of the year, with
varying impacts on end-of-year performance. Actual outcomes and
results may differ from those described in this document due to
operational risks and uncertainties. More detailed information on
the potential risks that may affect the Group’s financial results
can be found in the 2021 Universal Registration Document filed with
the Autorité des Marchés Financiers (AMF) on 17 March 2022 (see
pages 38 to 44 in particular). Sopra Steria does not undertake any
obligation to update the forward-looking information contained in
this document beyond what is required by current laws and
regulations. The distribution of this document in certain countries
may be subject to the laws and regulations in force. Persons
physically present in countries where this document is released,
published or distributed should enquire as to any applicable
restrictions and should comply with those restrictions.
About Sopra Steria
Sopra Steria, a European leader in the field of technology,
renowned for its consulting, digital services and software
development, helps its clients drive their digital transformation
and obtain tangible and sustainable benefits. It provides
end-to-end solutions to make large companies and organisations more
competitive by combining in-depth knowledge of a wide range of
business sectors and innovative technologies with a fully
collaborative approach. Sopra Steria places people at the heart of
everything it does and is committed to putting digital to work for
its clients in order to build a positive future for all. With
47,000 employees in nearly 30 countries, the Group generated
revenue of €4.7 billion in 2021. The world is how we shape
it. Sopra Steria (SOP) is listed on Euronext Paris (Compartment
A) – ISIN: FR0000050809 For more information, visit us at
www.soprasteria.com
Annexes
Sopra Steria: Impact on revenue of changes in scope and exchange
rates – Q1 2022 €m
Q1 2022
Q1 2021
Growth
Revenue
1,267.7
1,165.2
+8.8% Changes in exchange rates
13.4
Revenue at constant exchange rates
1,267.7
1,178.6
+7.6% Changes in scope
11.8
Revenue at constant scope and exchange rates
1,267.7
1,190.4
+6.5% Sopra Steria: Changes in exchange rates – Q1
2022 For €1 / %
Average rate Q1 2022
Average rate Q1 2021
Change
Pound sterling
0.8364
0.8739
+4.5% Norwegian krone
9.9247
10.2584
+3.4% Swedish krona
10.4807
10.1202
-3.4%
Danish krone
7.4407
7.4372
-0.0%
Swiss franc
1.0364
1.0913
+5.3%
Sopra Steria: Revenue by reporting unit – Q1 2022
€m / %
Q1 2022
Q1 2021 Restated*
Q1 2021
Organic growth
Total growth
France
513.2
468.5
460.2
+9.6% +11.5% United Kingdom
219.0
218.3
208.9
+0.3% +4.9% Other Europe
365.0
337.6
331.2
+8.1% +10.2% Sopra Banking Software
103.2
102.4
101.4
+0.8% +1.8% Other Solutions
67.3
63.5
63.5
+5.9% +6.0%
Sopra Steria Group
1,267.7
1,190.4
1,165.2
+6.5% +8.8% * Revenue at 2022 scope and exchange
rates
Sopra Steria: Workforce breakdown – 31/03/2022
31/03/2022
31/03/2021
France
20,067
19,861
United Kingdom
7,045
6,654
Other Europe
11,726
10,886
Rest of the World
470
508
X-Shore
8,806
8,050
Total
48,114
45,959
1 Alternative performance measures are defined in the glossary
at the end of this document.
View source
version on businesswire.com: https://www.businesswire.com/news/home/20220428005797/en/
Investor Relations Olivier Psaume
olivier.psaume@soprasteria.com +33 (0)1 40 67 68 16
Press Relations Caroline Simon (Image 7)
caroline.simon@image7.fr +33 (0)1 53 70 74 65
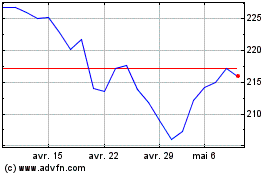
Sopra Steria (EU:SOP)
Graphique Historique de l'Action
De Mar 2024 à Avr 2024

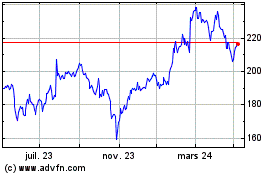
Sopra Steria (EU:SOP)
Graphique Historique de l'Action
De Avr 2023 à Avr 2024
