Altria Down Over 7%, Worst Performer in the S&P 500 So Far Today -- Data Talk
10 Mai 2022 - 5:44PM
Dow Jones News
Altria Group Inc (MO) is currently at $51.15, down $4.11 or
7.44%
--Would be lowest close since March 14, 2022, when it closed at
$50.54
--On pace for largest percent decrease since March 23, 2020,
when it fell 8.46%
--Currently down three of the past four days
--Currently down two consecutive days; down 9.58% over this
period
--Worst two day stretch since the two days ending April 20,
2021, when it fell 9.79%
--Down 7.95% month-to-date
--Up 7.93% year-to-date
--Down 34.18% from its all-time closing high of $77.71 on June
19, 2017
--Up 1.43% from 52 weeks ago (May 11, 2021), when it closed at
$50.43
--Down 9.58% from its 52-week closing high of $56.57 on May 6,
2022
--Up 19.96% from its 52-week closing low of $42.64 on Nov. 30,
2021
--Traded as low as $51.05; lowest intraday level since March 16,
2022, when it hit $50.44
--Down 7.62% at today's intraday low; largest intraday percent
decrease since April 20, 2021, when it fell as much as 7.99%
--Worst performer in the S&P 500 today
All data as of 11:10:14 AM ET
Source: Dow Jones Market Data, FactSet
(END) Dow Jones Newswires
May 10, 2022 11:29 ET (15:29 GMT)
Copyright (c) 2022 Dow Jones & Company, Inc.
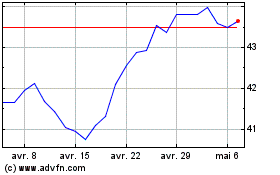
Altria (NYSE:MO)
Graphique Historique de l'Action
De Mar 2024 à Avr 2024

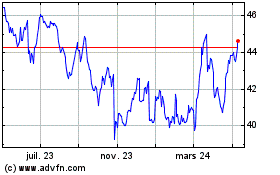
Altria (NYSE:MO)
Graphique Historique de l'Action
De Avr 2023 à Avr 2024
