Solana Sees Sharp Decline To $146, Will SOL Overcome Latest Hurdles?
17 Juin 2024 - 8:00PM
NEWSBTC
SOL, the native token of Solana, a leading blockchain platform
renowned for its high-speed transactions and innovative technology,
is currently facing significant price hurdles. As the
cryptocurrency market experiences volatility, Solana’s price has
encountered resistance levels that pose challenges to its bullish
trajectory. Investors and analysts are closely watching these
developments, trying to gauge what lies ahead for SOL. This
article explores the current price hurdles facing Solana, delves
into future outlooks, and offers predictions on how these obstacles
could impact its market performance. Understanding these dynamics
is crucial for investors seeking to navigate the uncertain terrain
of Solana’s price movements. As of the time of writing, SOL has a
market capitalization of over $67 billion, a trading volume of over
$1.3 billion, and a price drop of 5.40%, trading at around $146
over the past 24 hours. Despite the price decline, its market
capitalization and trading volume increased by 0.64% and 40.90%,
respectively. Current Market Analysis For Solana Currently, on the
4-hour chart, the price of SOL after attempting to move upward has
begun to drop again with two bearish candlesticks dropped. Also,
Solana is trading below the 100-day Simple Moving Average (SMA)
indicating that the price might remain bearish. Although the
composite trend oscillator indicator on the 4-hour chart indicates
that SOL’s price may move upward as both the signal line and the
SMA of the indicator are heading toward the zero line, it should be
noted that this is only a short-term measure because the price will
eventually drop even further. Meanwhile, on the 1-day chart, it can
be observed that Solana is bearish as it is trading below the
100-day SMA and also attempting to drop a bearish candlestick with
strong momentum. Also, the signal line and SMA of the 1-day
composite trend oscillator have broken below the zero line and are
moving toward the oversold zone, which suggests that the price of
SOL may move very bearish. Expert Opinions On SOL’s Price Outlook
As of right now, Solana’s price is moving downward toward the $140
support level. If SOL breaks below this level, it will continue to
move downward to test the $118 support level and may move on to
challenge the $99 support level if it breaks below the $118 level.
Nonetheless, prices may begin to increase in the direction of the
$160 resistance level if it is unable to cross any of the
previously mentioned levels. If it breaks above this $160 level, it
will continue to rise and challenge the resistance level at $188.
Furthermore, should SOL break above this level, it can also see a
higher price move to challenge the $205 resistance level on the
chart. Featured image from Adobe Stock, chart from Tradingview.com
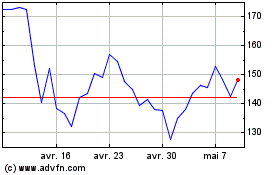
Solana (COIN:SOLUSD)
Graphique Historique de l'Action
De Mai 2024 à Juin 2024

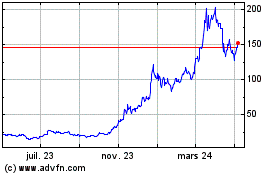
Solana (COIN:SOLUSD)
Graphique Historique de l'Action
De Juin 2023 à Juin 2024
