ETFs as an investment avenue are often associated with passive
fund management style which enables them to be more cost effective
(in terms of expense ratios) than their mutual fund cousins.
However, with the growth of the ETF industry as a whole, ETF
managers are continuously striving for flexibility and new
investors in order to capture more assets.
This paves the way for actively managed ETFs to take center
stage, especially in a highly dynamic market environment. Having
said this, it is prudent to note that there are a number of
actively managed ETFs available in the market today.
However, this article highlights some of the positives of three
such bond ETFs which investors could consider for stability as well
income, especially in this ultra low interest rate environment.
So far this year investors have been fairly upbeat on the bond
ETFs space. In fact some of the biggest names in this front like
iShares iBoxx $ Investment Grade Corporate Bond
(LQD), iShares iBoxx $ High Yield
Corporate Bond (HYG) and Vanguard
Total Bond Market (BND)
have witnessed significant popularity this year in terms of asset
accumulation.
There clearly has been a reversal in investor risk appetite in
the third quarter as investors shifted focus from the traditional
‘low risk’ fixed income ETFs which was pretty much the way to go
for investors in the second quarter, to ETFs tracking riskier asset
classes. However, by no means does it imply that investor appetite
has subsided in the bond ETF space (see Q3 ETF Asset Report:
Investors Back in the Market?).
Yet this is by no means limited to the passive market, as the
actively managed bond ETF space, many products have seen
significant inflows in their asset base in fiscal 2012. In fact the
WisdomTree Emerging Markets Local Debt ETF
(ELD), Peritus High Yield ETF
(HYLD) and PIMCO Total Return ETF
(BOND) have witnessed
positive inflows of around $200 million, $69 million and $2.67
billion respectively in their asset bases so far this year (source:
Index Universe).
The WisdomTree Emerging Markets Local Debt ETF
(ELD) seeks exposure in
sovereign debt securities of emerging markets denominated in their
local currency. ELD is exposed to a variety of emerging markets,
however, it is fairly upbeat on Mexico (10.63%) and Brazil
(10.50%).
Also, allocating a substantial portion of its assets in
countries with stronger balance sheets such as Malaysia (10.27%)
and Russia (7.00%) giving ELD a relatively low amount of worries on
the currency front (read Buy These Emerging Asia ETFs to Beat
China, India).
However, ELD will be subject to number of emerging market
currencies in total, so the risk is by no means removed.
Additionally, investors should note that the product has an
effective portfolio duration of 4.73 years and an average maturity
of 6.15 years, suggesting that it tracks the intermediate term of
the yield curve and will be subject to moderate levels of interest
rate risk.
The ETF goes beyond tracking an index and strives for steady
income and capital appreciation. A one year look suggests that it
has managed to deliver as it is up by 12.64% on a one year basis as
of September 30th 2012.
Additionally the yield is quite solid as it has a distribution
yield of 4.25%. Lastly, even though it is an actively managed ETF,
it charges just 55 basis points in fees and expenses.
From the actively managed high yield ETF space we have the
Peritus High Yield ETF
(HYLD) which primarily
aims at consistently high levels of cash flow streams in the form
of interest income.
It invests in a variety of non-investment grade corporate debt
securities by primarily employing a bottom up approach of
securities selection. Some of the features of its highly active
portfolio management are to select value creating securities and at
the same time ensure minimum exposure to default risk.
It does this by eliminating risky leveraged buy outs (LBOs)
based bonds which the company sees as not worth the headaches.
Additionally, as a means of managing risk, it develops trigger
points which exhibit a ‘position sell’ for individual securities in
its portfolio when it violates a particular level, thereby managing
losses.
Furthermore, as a hedge against negative market movements it can
invest in U.S. Treasuries as and when the need arises (see Two
Intriguing Financial ETFs with a REIT Focus).
Thanks to the active management employed by HYLD, it charges a
hefty expense ratio of 1.36%. Nevertheless, the high costing seems
justified when the one year return (as of 30th September 2012) of
15.48% is taken into account.
Moreover, thanks to the ultra low rate policy of the Fed, it is
an appropriate choice for income starved investors as it pays out a
solid distribution yield of 8.27%. However, it comes at the expense
of credit quality. The product has amassed an asset base of $137.73
million and an average daily volume of about 31,000 shares.
The PIMCO Total Return ETF
(BOND) is the ETF
version of PIMCO’s flagship blockbuster mutual fund the
PIMCO Total Return Institutional Fund
(PTTRX). However, the
$3.21 billion ETF has been outperforming its gigantic $169.32
billion mutual fund cousin since its inception in March of
2012.
The ETF has returned 9.93% since its inception while the mutual
fund has returned 6.23% for the same time period. While having a
much lower asset base certainly has allowed BOND to do well, one
has to wonder if this outperformance can continue into the
future.
Still, just to highlight the disparity between the two, BOND and
PTTRX have a correlation of just 65% between the two since the
launch of the ETF. Also, their one month rolling correlation has
never increased 87% and has even gone to the extent of hitting a
low of 30%, although there is admittedly a small sample size.
The ETF targets to maintain its weighted average duration in
alignment with that of the Barclays Capital U.S. Aggregate Bond
Index, with a maximum deviation of two years either way. The ETF
measures the performance of investment grade debt securities which
are issued by corporates, government and other institutions (see
more in the Zacks ETF Center).
Interestingly, around 86% of the total assets of the ETF is
allocated to Mr. Gross’ “Ring of fire”
(i.e. countries with highest levels of fiscal deficit as a
percentage of their GDP) countries. These are U.S 76%, France 1%,
Japan 2%, Spain 3% and United Kingdom 4%(source xtf.com) (read Time
to Consider Chinese Yuan ETFs?).
Nevertheless the ETF could be an appropriate core holding for
investors seeking an exposure to total bond markets. It charges
investors 55 basis points in fees and expenses and has been one of
the highest asset accumulating ETFs this year.
On average, the product does about 477,000 shares daily and
targets the intermediate end of the yield curve, thereby
maintaining an effective duration of 5.2 years. The ETF has a 30
Day SEC yield of 2.09% so it isn’t exactly a big yielder although
it arguably is a more stable choice in the segment.
Want the latest recommendations from Zacks Investment Research?
Today, you can download 7 Best Stocks for the Next 30
Days. Click to get this free report >>
VANGD-TOT BOND (BND): ETF Research Reports
PIMCO-TOT RETRN (BOND): ETF Research Reports
WISDMTR-EM LDF (ELD): ETF Research Reports
ISHARS-IBX HYCB (HYG): ETF Research Reports
PERITUS-HIGH YL (HYLD): ETF Research Reports
To read this article on Zacks.com click here.
Zacks Investment Research
Want the latest recommendations from Zacks Investment Research?
Today, you can download 7 Best Stocks for the Next 30 Days. Click
to get this free report
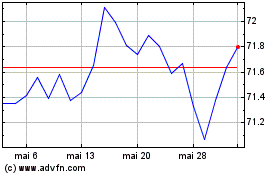
Vanguard Total Bond Market (NASDAQ:BND)
Graphique Historique de l'Action
De Avr 2024 à Mai 2024

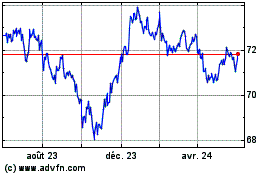
Vanguard Total Bond Market (NASDAQ:BND)
Graphique Historique de l'Action
De Mai 2023 à Mai 2024
