0001823144
false
0001823144
2023-08-14
2023-08-14
0001823144
us-gaap:CommonStockMember
2023-08-14
2023-08-14
0001823144
CMPO:RedeemableWarrantSeachWholeWarrantExercisableForOneShareOfClassACommonStockMember
2023-08-14
2023-08-14
iso4217:USD
xbrli:shares
iso4217:USD
xbrli:shares
UNITED STATES
SECURITIES AND EXCHANGE
COMMISSION
WASHINGTON, D.C. 20549
FORM 8-K
CURRENT REPORT
Pursuant to Section 13
or 15(d)
of the Securities Exchange
Act of 1934
Date of Report
(Date of earliest event reported): August 14, 2023
CompoSecure, Inc.
(Exact Name of Registrant
as Specified in its Charter)
| Delaware |
|
001-39687 |
|
85-2749902 |
(State or Other Juris-
diction of Incorporation) |
|
(Commission
File Number) |
|
(IRS Employer
Identification No.) |
|
309 Pierce Street
Somerset, New Jersey |
|
08873 |
| (Address of Principal Executive Offices) |
|
(Zip Code) |
Registrant’s telephone number, including
area code: 908 518-0500
Not Applicable
(Former Name or Former
Address, if Changed Since Last Report)
Check the appropriate box below if the Form 8-K filing is intended
to simultaneously satisfy the filing obligation of the registrant under any of the following provisions (see General Instruction
A.2. below):
| ¨ |
Written communications pursuant to Rule 425 under the Securities Act (17 CFR 230.425) |
| ¨ |
Soliciting material pursuant to Rule 14a-12 under the Exchange Act (17 CFR 240.14a-12) |
| ¨ |
Pre-commencement communications pursuant to Rule 14d-2(b) under the Exchange Act (17 CFR 240.14d-2(b)) |
| ¨ |
Pre-commencement communications pursuant to Rule 13e-4(c) under the Exchange Act (17 CFR 240.13e-4(c)) |
Securities registered pursuant to Section 12(b) of the Act:
| Title
of each class |
|
Trading
Symbol(s) |
|
Name
of each exchange on which registered |
| Class
A Common Stock, $0.0001 par value |
|
CMPO |
|
Nasdaq Global Market |
| |
|
|
|
|
| Redeemable
warrants, each whole warrant exercisable for one share of Class A Common Stock |
|
CMPOW |
|
Nasdaq Global Market |
Indicate by check mark whether the registrant is an emerging growth
company as defined in Rule 405 of the Securities Act of 1933 (§ 230.405 of this chapter) or Rule 12b-2 of the Securities
Exchange Act of 1934 (§ 240.12b-2 of this chapter).
Emerging growth company x
If an emerging growth company, indicate by check mark if the registrant
has elected not to use the extended transition period for complying with any new or revised financial accounting standards provided pursuant
to Section 13(a) of the Exchange Act.
| Item
2.02 |
Results of Operation and Financial Condition |
On August 14, 2023, CompoSecure,
Inc. (the “Company”) issued a press release announcing its financial results for the quarter ended June 30, 2023 and provided
an investor presentation to accompany the press release. Copies of the press release and the investor presentation are furnished herewith
as Exhibits 99.1 and 99.2, respectively.*
| Item
7.01 |
Regulation FD Disclosure |
The information included under
Item 2.02 of this Current Report on Form 8-K is incorporated into this Item 7.01 by reference.*
(d) Exhibits
* The information
in Items 2.02 and 7.01 of this Form 8-K shall not be deemed “filed” for purposes of Section 18 of the Securities Exchange
Act of 1934, as amended (the “Exchange Act”) or otherwise subject to the liabilities of that section, nor shall it be deemed
incorporated by reference in any filing under the Securities Act of 1933 or the Exchange Act, except as expressly set forth by specific
reference in such a filing.
SIGNATURE
Pursuant to the requirements of the Securities
Exchange Act of 1934, the registrant has duly caused this report to be signed on its behalf by the undersigned hereunto duly authorized.
| |
COMPOSECURE, INC. |
| |
|
| Date: August 14, 2023 |
By: |
/s/Timothy Fitzsimmons |
| |
|
Timothy Fitzsimmons |
| |
|
Chief Financial Officer |
Exhibit 99.1

CompoSecure Reports
Second Quarter 2023 Financial Results
– Secures Long-Term Contract
Renewal for One of Its Largest Customers –
– Reaffirms 2023 Net Sales
and Adjusted EBITDA Guidance –
SOMERSET, N.J., August 14, 2023 --
CompoSecure, Inc. (Nasdaq: CMPO), a leader in metal payment cards, security, and authentication solutions, today announced its
financial and operating results for the second quarter ended June 30, 2023.
“We continue to demonstrate the performance
and consistency of our business as our second quarter results were in-line with our expectations despite continued macroeconomic uncertainties,”
said Jon Wilk, President and CEO of CompoSecure. “General sentiment from our customers around the premium payment card market remained
positive during the quarter. We are poised to continue to drive growth and cash flow generation for the remainder of the year, delivering
new and innovative products to market while executing on our sales and profitability objectives.”
“We are also pleased to announce a five-year contract extension
through December 2028 as the exclusive provider of metal cards for one of our largest customers that was set to expire at the end of this
year (see filed 8-K). We have now signed long-term renewals with our top two customers.”
“Throughout our 20 year history, our company has been driven
by delivering unmatched value and business impact as well as innovation, while establishing long-term partnerships across the market,
and I am proud that we continue to demonstrate that unique value proposition.”
Q2 2023 Financial Highlights (vs. Q2 2022)
| · | Net Sales: Net Sales increased 1% to $98.5 million compared to $97.2 million, with the increase primarily driven by continued
domestic growth in the Company’s metal payment card business, which was up 11%. This was partially offset by lower international
sales, which is a more variable market due to customer mix and a smaller sales base. International sales remained in-line with the Company’s
targeted revenue mix of approximately 20%. |
| · | Gross Profit: Gross Profit was $53.9 million or 54.7% of Net Sales, compared to $58.9 million or 60.5%. The decrease was primarily
due to higher material costs resulting from inflationary pressures and product mix. Gross margin was in-line with the Company’s
previously stated mid-50% target. |
| · | Net Income/EPS: Net Income was $32.7 million compared to $60.7 million. The decrease was primarily driven by a $25.4 million
change in non-cash mark to market adjustments related to the fair value of warrant liabilities, earnout consideration liability and derivative
liability. Net Income per share attributable to class A common stockholders was $0.31 (Basic) and $0.29 (Diluted), compared to $0.56 (Basic)
and $0.52 (Diluted) in the year-ago period. |
| · | Adjusted Net Income/Adjusted EPS: Adjusted Net Income (a non-GAAP measure) was $22.9 million compared to $25.3 million in the
year-ago period. Adjusted EPS (a non-GAAP measure), which includes both class A and class B shares, was $0.29 (Basic) and
$0.25 (Diluted) compared to $0.33 (Basic) and $0.29 (Diluted) in the year-ago period (see reconciliation
of non-GAAP measures shown in table below). |
| · | Adjusted EBITDA: Adjusted EBITDA (a non-GAAP measure) was $36.9 million compared to $39.7 million, with the decrease primarily
driven by lower gross margin. |
Recent Operational Highlights
| · | Continued metal payment card momentum including Barclays UK, Citizen’s Bank, Mars (a Turkish based Fintech), and Step
Financial. |
| · | Signed new Arculus customers for the quarter including Plug Wallet, an online crypto wallet, and Radix DeFi, a decentralized network,
among others. |
| · | Arculus was nominated for the Pay Tech Awards, Tech of the Future – Fighting Fraud & Financial Crime award. |
| · | Named a New Jersey Top Workplace by NJ.com for the fourth year in a row. |
2023 Financial Outlook
The Company is reaffirming its guidance for
full year 2023 results, with net sales expected to be in the range of $400-$425 million and adjusted EBITDA in the range of $145-$155
million.
Conference Call
The Company will host a conference call and
live audio webcast today at 5:00 p.m. Eastern time to discuss its financial and operational results, followed by a question-and-answer
period.
Date: Wednesday, August 14, 2023
Time: 5:00 p.m. Eastern time
Dial-in registration link: here
Live webcast registration link: here
If you have any difficulty registering or
connecting with the conference call, please contact Elevate IR at (720) 330-2829.
A live webcast and replay of the conference
call will be available on the investor relations section of the Company’s website at https://ir.composecure.com/news-events/events.
About CompoSecure
Founded in 2000, CompoSecure (Nasdaq: CMPO)
is a technology partner to market leaders, fintechs and consumers enabling trust for millions of people around the globe. The company
combines elegance, simplicity and security to deliver exceptional experiences and peace of mind in the physical and digital world. CompoSecure’s
innovative payment card technology and metal cards with Arculus security and authentication capabilities deliver unique, premium branded
experiences, enable people to access and use their financial and digital assets, and ensure trust at the point of a transaction. For more
information, please visit www.CompoSecure.com and www.GetArculus.com.
Forward-Looking Statements
This press release contains forward-looking
statements as defined by the Private Securities Litigation Reform Act of 1995. These statements are based on the beliefs and assumptions
of management. Although the Company believes that its plans, intentions, and expectations reflected in or suggested by these forward-looking
statements are reasonable, the Company cannot assure you that it will achieve or realize these plans, intentions, or expectations. Forward-looking
statements are inherently subject to risks, uncertainties, and assumptions. Generally, statements that are not historical facts, including
statements concerning the Company’s possible or assumed future actions, business strategies, events, or results of operations, are
forward-looking statements. In some instances, these statements may be preceded by, followed by or include the words “believes,”
“estimates,” “expects,” “projects,” “forecasts,” “may,” “will,”
“should,” “seeks,” “plans,” “scheduled,” “anticipates” or “intends”
or the negatives of these terms or variations of them or similar terminology. Forward-looking statements are not guarantees of performance.
You should not put undue reliance on these statements which speak only as of the date hereof. You should understand that the following
important factors, among others, could affect the Company’s future results and could cause those results or other outcomes to differ
materially from those expressed or implied in the Company’s forward-looking statements: the ability of the Company to grow
and manage growth profitably, maintain relationships with customers, compete within its industry and retain its key employees; the possibility
that the Company may be adversely impacted by other economic, business, and/or competitive factors; the outcome of any legal proceedings
that may be instituted against the Company or others; future exchange and interest rates; and other risks and uncertainties, including
those under “Risk Factors” in filings that have been made or will be made with the Securities and Exchange
Commission. The Company undertakes no obligations to update or revise publicly any forward-looking statements, whether as a result of
new information, future events or otherwise, except as required by law.
Use of Non-GAAP Financial Measures
This press release includes certain non-GAAP
financial measures that are not prepared in accordance with accounting principles generally accepted in the United States (“GAAP”)
and that may be different from non-GAAP financial measures used by other companies. The Company believes EBITDA, Adjusted EBITDA, Adjusted
Net Income and Adjusted EPS are useful to investors in evaluating the Company’s financial performance. The Company uses these measures
internally to establish forecasts, budgets and operational goals to manage and monitor its business, as well as evaluate its underlying
historical performance and to measure incentive compensation, as we believe that these non-GAAP financial measures depict the true performance
of the business by encompassing only relevant and controllable events, enabling the Company to evaluate and plan more effectively for
the future. Due to the forward-looking nature of the financial guidance included above, specific quantification of the charges excluded
from the non-GAAP financial measures included in such financial guidance, including with respect to depreciation, amortization, interest,
and taxes, that would be required to reconcile the non GAAP financial measures included in such financial guidance to GAAP measures are
not available, so it is not feasible to provide accurate forecasted non-GAAP reconciliations without unreasonable effort. Consequently,
no disclosure of estimated comparable GAAP measures is included, and no reconciliation of the forward looking non-GAAP financial measures
is included. In addition, the Company’s debt agreements contain covenants that use a variation of these measures for purposes of
determining debt covenant compliance. The Company believes that investors should have access to the same set of tools that its management
uses in analyzing operating results. EBITDA, Adjusted EBITDA, Adjusted Net Income and Adjusted EPS should not be considered as measures
of financial performance under U.S. GAAP, and the items excluded from EBITDA, Adjusted EBITDA, Adjusted Net Income and Adjusted EPS are
significant components in understanding and assessing the Company’s financial performance. Accordingly, these key business metrics
have limitations as an analytical tool. They should not be considered as an alternative to net income or any other performance measures
derived in accordance with U.S. GAAP or as an alternative to cash flows from operating activities as a measure of the Company’s
liquidity and may be different from similarly titled non-GAAP measures used by other companies. Please refer to the tables below for the
reconciliation of GAAP measures to these non-GAAP measures for the quarter ended June 30, 2023.
Corporate Contact
Anthony Piniella
Head of Communications, CompoSecure
(908) 898-8887
apiniella@composecure.com
Investor Relations Contact
Sean Mansouri, CFA
Elevate IR
(720) 330-2829
ir@composecure.com
CompoSecure, Inc.
Consolidated Statements of Operations
(in thousands, except per share amounts)
(unaudited)
| | |
Three Months Ended June 30, | | |
Six Months Ended June 30, | |
| | |
2023 | | |
2022 | | |
2023 | | |
2022 | |
| Net sales | |
$ | 98,527 | | |
$ | 97,199 | | |
$ | 193,843 | | |
$ | 181,382 | |
| | |
| | | |
| | | |
| | | |
| | |
| Operating expenses: | |
| | | |
| | | |
| | | |
| | |
| Cost of sales | |
| 44,590 | | |
| 38,347 | | |
| 86,552 | | |
| 73,771 | |
| Selling, General and administrative | |
| 23,588 | | |
| 24,433 | | |
| 47,532 | | |
| 43,209 | |
| Total operating expenses | |
| 68,178 | | |
| 62,780 | | |
| 134,084 | | |
| 116,980 | |
| | |
| | | |
| | | |
| | | |
| | |
| Income from operations | |
| 30,349 | | |
| 34,419 | | |
| 59,759 | | |
| 64,402 | |
| | |
| | | |
| | | |
| | | |
| | |
| Total other income (expense), net | |
| 3,331 | | |
| 29,041 | | |
| (16,605 | ) | |
| 26,509 | |
| Income before income taxes | |
| 33,680 | | |
| 63,460 | | |
| 43,154 | | |
| 90,911 | |
| Income tax (expense) benefit | |
| (970 | ) | |
| (2,802 | ) | |
| 293 | | |
| (3,345 | ) |
| Net income | |
| 32,710 | | |
| 60,658 | | |
| 43,447 | | |
| 87,566 | |
| | |
| | | |
| | | |
| | | |
| | |
| Net income attributable to non-controlling interests | |
| 26,973 | | |
| 52,184 | | |
| 35,347 | | |
| 75,628 | |
| Net income attributable to CompoSecure, Inc | |
$ | 5,737 | | |
$ | 8,474 | | |
$ | 8,100 | | |
$ | 11,938 | |
| | |
| | | |
| | | |
| | | |
| | |
| Net income per share attributable to Class A common stockholders -basic | |
$ | 0.31 | | |
$ | 0.56 | | |
$ | 0.45 | | |
$ | 0.80 | |
| Net income per share attributable to Class A common stockholders - diluted | |
$ | 0.29 | | |
$ | 0.52 | | |
$ | 0.41 | | |
$ | 0.75 | |
| | |
| | | |
| | | |
| | | |
| | |
| Weighted average shared used to compute net income per share attributable to Class A common stockholders - basic (in thousands) | |
| 18,537 | | |
| 15,052 | | |
| 18,087 | | |
| 14,993 | |
| Weighted average shared used to compute net income per share attributable to Class A common stockholders - diluted (in thousands) | |
| 35,528 | | |
| 32,363 | | |
| 35,155 | | |
| 32,341 | |
CompoSecure, Inc.
Condensed Consolidated Balance Sheet
Data
(in thousands)
| | |
June 30, 2023 | | |
December 31, 2022 | |
| | |
(unaudited) | | |
| |
| ASSETS | |
| | | |
| | |
| Cash and cash equivalents | |
$ | 22,614 | | |
$ | 13,642 | |
| Accounts Receivable, net | |
| 36,534 | | |
| 37,272 | |
| Inventories, net | |
| 48,889 | | |
| 42,374 | |
| Prepaid expenses and other current assets | |
| 4,096 | | |
| 3,824 | |
| Property and equipment, net | |
| 24,182 | | |
| 22,655 | |
| Right of use assets operating, net | |
| 8,427 | | |
| 8,932 | |
| Deferred tax asset | |
| 27,968 | | |
| 25,569 | |
| Derivative asset - interest rate swap | |
| 8,329 | | |
| 8,651 | |
| Deposits and other assets | |
| 24 | | |
| 24 | |
| TOTAL ASSETS | |
$ | 181,063 | | |
$ | 162,943 | |
| | |
| | | |
| | |
| LIABILITIES AND STOCKHOLDERS' EQUITY | |
| | | |
| | |
| Current portion of long-term debt | |
$ | 18,750 | | |
$ | 14,372 | |
| Current portion of lease liabilities | |
| 1,892 | | |
| 1,846 | |
| Current portion of tax receivable agreement liability | |
| 1,668 | | |
| 2,367 | |
| Accounts payable | |
| 6,635 | | |
| 7,127 | |
| Accrued expenses | |
| 10,766 | | |
| 10,154 | |
| Commission payable | |
| 5,361 | | |
| 3,317 | |
| Bonus payable | |
| 5,779 | | |
| 8,177 | |
| Long-term debt, net of deferred finance costs | |
| 207,343 | | |
| 216,276 | |
| Convertible notes, net of debt discount | |
| 127,586 | | |
| 127,348 | |
| Derivative liability - convertible notes | |
| 798 | | |
| 285 | |
| Warrant liability | |
| 24,309 | | |
| 16,341 | |
| Earnout consideration liability | |
| 10,869 | | |
| 15,090 | |
| Lease liabilities | |
| 7,257 | | |
| 7,766 | |
| Tax receivable agreement liability | |
| 23,952 | | |
| 24,475 | |
| Total stockholders' (deficit) | |
| (271,902 | ) | |
| (291,998 | ) |
| TOTAL LIABILITIES AND STOCKHOLDERS' EQUITY | |
$ | 181,063 | | |
$ | 162,943 | |
CompoSecure, Inc.
Consolidated Statements of Cash Flows
(in thousands)
(unaudited)
| | |
Six Months Ended June 30, | |
| | |
2023 | | |
2022 | |
| CASH FLOWS FROM OPERATING ACTIVITES: | |
| | | |
| | |
| Net income | |
$ | 43,447 | | |
$ | 87,566 | |
| Adjustments to reconcile net income to net cash provided by operating activities | |
| | | |
| | |
| Depreciation | |
| 4,171 | | |
| 4,567 | |
| Stock-based compensation expense | |
| 8,415 | | |
| 4,020 | |
| Amortization of deferred finance costs | |
| 700 | | |
| 1,252 | |
| Change in fair value of earnout consideration liability | |
| (4,221 | ) | |
| (19,041 | ) |
| Revaluation of warrant liability | |
| 7,968 | | |
| (18,041 | ) |
| Change in fair value of derivative liability | |
| 513 | | |
| 61 | |
| Deferred tax (benefit) expense | |
| (1,770 | ) | |
| 3,094 | |
| Changes in assets and liabilities | |
| | | |
| | |
| Accounts receivable | |
| 738 | | |
| (17,282 | ) |
| Inventories | |
| (6,515 | ) | |
| (2,938 | ) |
| Prepaid expenses and other assets | |
| (272 | ) | |
| (1,144 | ) |
| Accounts payable | |
| (492 | ) | |
| (201 | ) |
| Accrued expenses | |
| 612 | | |
| 10,262 | |
| Other liabilities | |
| (313 | ) | |
| (784 | ) |
| Net cash provided by operating activities | |
| 52,981 | | |
| 51,391 | |
| CASH FLOWS FROM INVESTING ACTIVITIES: | |
| | | |
| | |
| Acquisition of property and equipment | |
| (5,697 | ) | |
| (3,504 | ) |
| Net cash used in investing activities | |
| (5,697 | ) | |
| (3,504 | ) |
| CASH FLOWS FROM FINANCING ACTIVITIES: | |
| | | |
| | |
| Proceeds from employee stock purchase plan and exercise of equity awards | |
| 389 | | |
| - | |
| Payments for taxes related to net share settlement of equity awards | |
| (2,483 | ) | |
| - | |
| Proceeds from line of credit | |
| - | | |
| 10,000 | |
| Payment of Tax receivable agreement liability | |
| (2,193 | ) | |
| - | |
| Payment of term loan | |
| (5,017 | ) | |
| (16,878 | ) |
| Distributions | |
| (29,008 | ) | |
| (25,729 | ) |
| Payment of issuance cost related to business combination | |
| - | | |
| (23,833 | ) |
| Net cash used in financing activities | |
| (38,312 | ) | |
| (56,440 | ) |
| Net increase (decrease) in cash and cash equivalents | |
| 8,972 | | |
| (8,553 | ) |
| Cash and cash equivalents, beginning of period | |
| 13,642 | | |
| 21,944 | |
| Cash and cash equivalents, end of period | |
$ | 22,614 | | |
$ | 13,391 | |
| | |
| | | |
| | |
| Supplementary disclosure of cash flow information | |
| | | |
| | |
| Cash paid for interest expense | |
$ | 13,626 | | |
$ | 9,638 | |
| Supplemental disclosure of non-cash financing activity: | |
| | | |
| | |
| Derivative asset - interest rate swap | |
$ | 8,329 | | |
$ | 5,590 | |
CompoSecure, Inc.
Non-GAAP Adjusted EBITDA Reconciliation
(in thousands)
(unaudited)
| | |
Three Months Ended June 30, | | |
Six Months Ended June 30, | |
| | |
2023 | | |
2022 | | |
2023 | | |
2022 | |
| Net income | |
$ | 32,710 | | |
$ | 60,658 | | |
$ | 43,447 | | |
$ | 87,566 | |
| Add (less): | |
| | | |
| | | |
| | | |
| | |
| Depreciation | |
| 2,131 | | |
| 2,217 | | |
| 4,171 | | |
| 4,567 | |
| Interest expense, net (1) | |
| 5,849 | | |
| 5,547 | | |
| 12,345 | | |
| 10,513 | |
| Income tax expense (benefit) | |
| 970 | | |
| 2,802 | | |
| (293 | ) | |
| 3,345 | |
| EBITDA | |
$ | 41,660 | | |
$ | 71,224 | | |
$ | 59,670 | | |
$ | 105,991 | |
| Stock-based compensation | |
| 4,393 | | |
| 3,014 | | |
| 8,415 | | |
| 4,020 | |
| Mark to market adjustments (2) | |
| (9,180 | ) | |
| (34,586 | ) | |
| 4,260 | | |
| (37,021 | ) |
| Adjusted EBITDA | |
$ | 36,873 | | |
$ | 39,652 | | |
$ | 72,345 | | |
$ | 72,990 | |
(1) Includes amortization of deferred financing cost
for the three and six months ended June 30, 2023 and 2022, respectively.
(2) Includes the changes in fair value of warrant liability,
derivative liabilities and earnout consideration liability for the three and six months ended June 30, 2023 and June 30, 2022.
CompoSecure, Inc.
Non-GAAP Adjusted EPS Reconciliation
(in thousands)
(unaudited)
| | |
Three Months Ended June 30, | | |
Six Months Ended June 30, | |
| | |
2023 | | |
2022 | | |
2023 | | |
2022 | |
| | |
| | |
| | |
| | |
| |
| | |
(in thousands) except per share amounts | |
| Basic and Diluted: | |
| | | |
| | | |
| | | |
| | |
| Net income | |
$ | 32,710 | | |
$ | 60,658 | | |
$ | 43,447 | | |
$ | 87,566 | |
| Add (less): provision (benefit) for income taxes | |
| 970 | | |
| 2,802 | | |
| (293 | ) | |
| 3,345 | |
| Income before Income taxes | |
| 33,680 | | |
| 63,460 | | |
| 43,154 | | |
| 90,911 | |
| Income tax expense (1) | |
| (6,190 | ) | |
| (6,745 | ) | |
| (11,771 | ) | |
| (12,166 | ) |
| Adjusted net income before adjustments | |
| 27,490 | | |
| 56,715 | | |
| 31,383 | | |
| 78,745 | |
| (Less) add: mark-to-market adjustments (2) | |
| (8,985 | ) | |
| (34,399 | ) | |
| 3,747 | | |
| (37,082 | ) |
| Add: stock-based compensation | |
| 4,393 | | |
| 3,014 | | |
| 8,415 | | |
| 4,020 | |
| Adjusted net income | |
$ | 22,898 | | |
$ | 25,330 | | |
$ | 43,545 | | |
$ | 45,683 | |
| Common shares outstanding used in computing earnings per share, basic: | |
| | | |
| | | |
| | | |
| | |
| Class A and Class B common shares (3) | |
| 78,496 | | |
| 76,039 | | |
| 78,046 | | |
| 76,105 | |
| Common shares outstanding used in computing earnings per share, diluted: | |
| | | |
| | | |
| | | |
| | |
| Warrants (Public and Private) (4) | |
| 8,094 | | |
| 8,094 | | |
| 8,094 | | |
| 8,094 | |
| Equity awards | |
| 3,991 | | |
| 4,312 | | |
| 4,068 | | |
| 4,349 | |
| Total Shares outstanding used in computing adjusted earnings per share - diluted | |
| 90,581 | | |
| 88,445 | | |
| 90,208 | | |
| 88,548 | |
| | |
| | | |
| | | |
| | | |
| | |
| Adjusted net income per share- basic | |
$ | 0.29 | | |
$ | 0.33 | | |
$ | 0.56 | | |
$ | 0.60 | |
| Adjusted net income per share- diluted | |
$ | 0.25 | | |
$ | 0.29 | | |
$ | 0.48 | | |
$ | 0.52 | |
1) Calculated using the Company's blended tax rate.
2) Includes the changes in fair value of warrant liability
and earnout consideration liability.
3) Assumes both Class A shares and Class B shares
participate in earnings and are outstanding at the end of the period.
4) Assumes treasury stock method, valuation at assumed fair
market value of $18.00.
5) The Company did not include the effect of Exchangeable
Notes to its total shares outstanding used in diluted adjusted net income per share.
###
Exhibit 99.2

| August 14, 2023 |

| 2 Disclaimers
Forward Looking Statements
This presentation contains forward-looking statements as defined by the Private Securities Litigation Reform Act of 1995. These statements are based on the beliefs and assumptions of management.
Although the Company believes that its plans, intentions, and expectations reflected in or suggested by these forward-looking statements are reasonable, the Company cannot assure you that it will
achieve or realize these plans, intentions, or expectations. Forward-looking statements are inherently subject to risks, uncertainties, and assumptions. Generally, statements that are not historical
facts, including statements concerning the Company’s possible or assumed future actions, business strategies, events, or results of operations, are forward-looking statements. In some instances,
these statements may be preceded by, followed by or include the words “believes,” “estimates,” “expects,” “projects,” “forecasts,” “may,” “will,” “should,” “seeks,” “plans,” “scheduled,” “anticipates” or
“intends” or the negatives of these terms or variations of them or similar terminology. Forward-looking statements are not guarantees of performance. You should not put undue reliance on these
statements which speak only as of the date hereof. You should understand that the following important factors, among others, could affect the Company’s future results and could cause those results
or other outcomes to differ materially from those expressed or implied in the Company’s forward-looking statements: the ability of the Company to grow and manage growth profitably, maintain
relationships with customers, compete within its industry and retain its key employees; the possibility that the Company may be adversely impacted by other economic, business, and/or competitive
factors; the outcome of any legal proceedings that may be instituted against the Company or others; future exchange and interest rates; and other risks and uncertainties indicated in this report,
including those under “Risk Factors” in filings that have been made or will be made with the SEC. The Company undertakes no obligations to update or revise publicly any forward-looking statements,
whether as a result of new information, future events or otherwise, except as required by law.
Non-GAAP Financial Measures
This presentation includes certain non-GAAP financial measures that are not prepared in accordance with accounting principles generally accepted in the United States (“GAAP”) and that may be
different from non-GAAP financial measures used by other companies. The Company believes EBITDA, Adjusted EBITDA, Adjusted Net Income and Adjusted EPS are useful to investors in evaluating
the Company’s financial performance. The Company uses these measures internally to establish forecasts, budgets and operational goals to manage and monitor its business, as well as evaluate its
underlying historical performance and to measure incentive compensation, as we believe that these non-GAAP financial measures depict the true performance of the business by encompassing only
relevant and controllable events, enabling the Company to evaluate and plan more effectively for the future. Due to the forward-looking nature of the financial guidance included below, specific
quantification of the charges excluded from the non-GAAP financial measures included in such financial guidance, including with respect to depreciation, amortization, interest, and taxes, that would
be required to reconcile the non GAAP financial measures included in such financial guidance to GAAP measures are not available, so it is not feasible to provide accurate forecasted non-GAAP
reconciliations without unreasonable effort. Consequently, no disclosure of estimated comparable GAAP measures is included, and no reconciliation of the forward-looking non-GAAP financial
measures is included. In addition, the Company’s debt agreements contain covenants that use a variation of these measures for purposes of determining debt covenant compliance. The Company
believes that investors should have access to the same set of tools that its management uses in analyzing operating results. EBITDA, Adjusted EBITDA, Adjusted Net Income and Adjusted EPS should
not be considered as measures of financial performance under U.S. GAAP, and the items excluded from EBITDA, Adjusted EBITDA, Adjusted Net Income and Adjusted EPS are significant components
in understanding and assessing the Company’s financial performance. Accordingly, these key business metrics have limitations as an analytical tool. They should not be considered as an alternative to
net income or any other performance measures derived in accordance with U.S. GAAP or as an alternative to cash flows from operating activities as a measure of the Company’s liquidity and may be
different from similarly titled non-GAAP measures used by other companies. Please refer to the tables below for the reconciliation of net income to EBITDA, Adjusted EBITDA, Adjusted Net Income and
Adjusted EPS.
Industry and Market Information
Statements in this presentation concerning our industry and the markets in which we operate, including our general expectations and competitive position, business opportunity and market size,
growth and share, are based on information from independent industry organizations and other third-party sources, data from our internal research and management estimates. Management
estimates are derived from publicly available information and the information and data referred to above and are based on assumptions and calculations made by us based upon our interpretation of
such information and data. The information and data referred to above are imprecise and may prove to be inaccurate because the information cannot always be verified with complete certainty due to
the limitations on the availability and reliability of raw data, the voluntary nature of the data gathering process and other limitations and uncertainties. As a result, please be aware that the data and
statistical information in this presentation may differ from information provided by our competitors or from information found in current or future studies conducted by market research institutes,
consultancy firms or independent sources. |
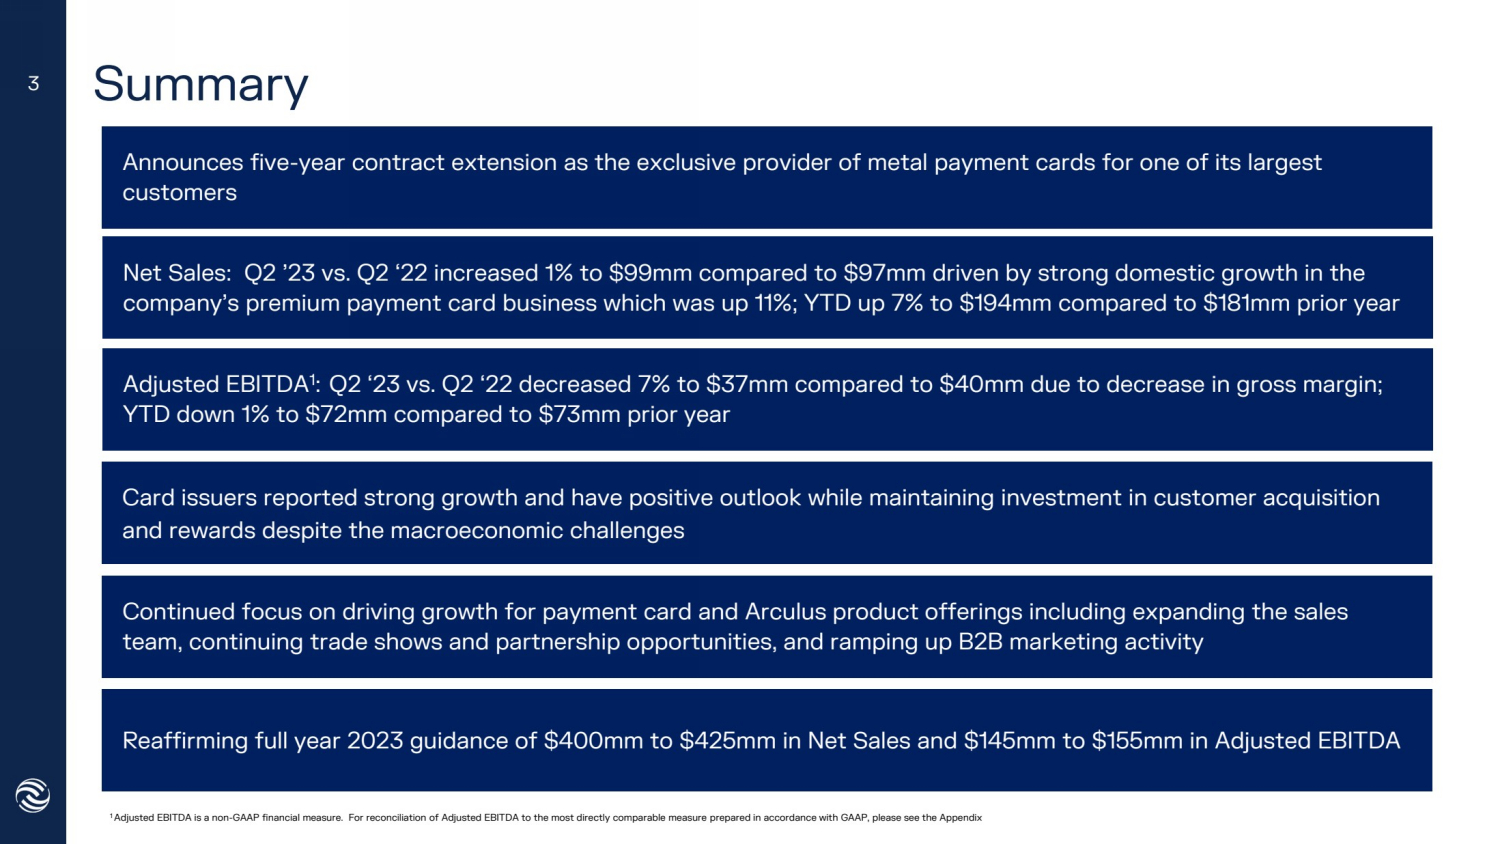
| Summary
Net Sales: Q2 ’23 vs. Q2 ‘22 increased 1% to $99mm compared to $97mm driven by strong domestic growth in the
company’s premium payment card business which was up 11%; YTD up 7% to $194mm compared to $181mm prior year
Continued focus on driving growth for payment card and Arculus product offerings including expanding the sales
team, continuing trade shows and partnership opportunities, and ramping up B2B marketing activity
Reaffirming full year 2023 guidance of $400mm to $425mm in Net Sales and $145mm to $155mm in Adjusted EBITDA
Card issuers reported strong growth and have positive outlook while maintaining investment in customer acquisition
and rewards despite the macroeconomic challenges
Announces five-year contract extension as the exclusive provider of metal payment cards for one of its largest
customers
1 Adjusted EBITDA is a non-GAAP financial measure. For reconciliation of Adjusted EBITDA to the most directly comparable measure prepared in accordance with GAAP, please see the Appendix
3
Adjusted EBITDA1
:
Q2 ‘23 vs. Q2 ‘22 decreased 7% to $37mm compared to $40mm due to decrease in gross margin;
YTD down 1% to $72mm compared to $73mm prior year |

| 4 Key Highlights
Customer & Conference News
➢ Announced a five-year contract extension through December 2028 as the exclusive provider of metal cards for one of our
largest customers that was set to expire at the end of this year (see filed 8-K). We have now signed long-term renewals with
both of our top two customers
➢ Launching new metal card programs with top global issuers, Citizens Bank and Barclays UK
➢ Strong presence at Bitcoin 2023 (May) & Money 20/20 Europe (June); planning for Finovate Fall (Sept), Money 20/20 USA (Oct),
& Singapore FinTech Festival (Nov)
Awards & Recognition
➢ CompoSecure named a “New Jersey Top Workplace” by NJ.com for the fourth year in a row
➢ President and CEO, Jon Wilk, recognized with “Large Business Leadership Award” by NJ.com
➢ Chief Revenue Officer, Amanda Gourbault, named winner of “Woman in PayTech – Spearheading Growth” category by FinTech
Futures PayTech Awards 2023
➢ Chief Product and Innovation Officer, Adam Lowe, finalist in “Innovator of the Year” category by Finovate |
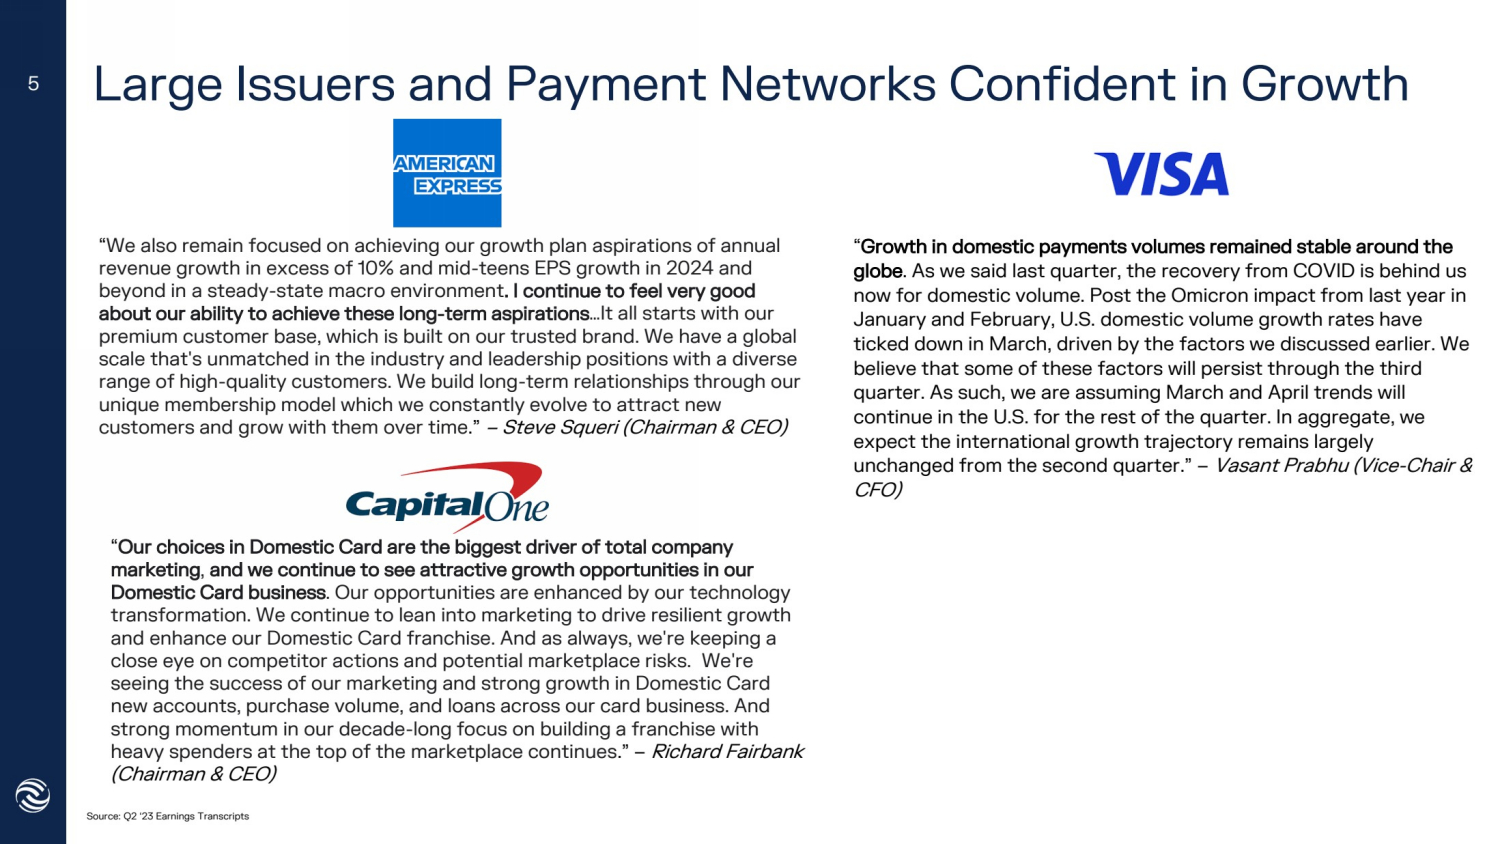
| Large Issuers and Payment Networks Confident in Growth
Source: Q2 ‘23 Earnings Transcripts
“We also remain focused on achieving our growth plan aspirations of annual
revenue growth in excess of 10% and mid-teens EPS growth in 2024 and
beyond in a steady-state macro environment. I continue to feel very good
about our ability to achieve these long-term aspirations…It all starts with our
premium customer base, which is built on our trusted brand. We have a global
scale that's unmatched in the industry and leadership positions with a diverse
range of high-quality customers. We build long-term relationships through our
unique membership model which we constantly evolve to attract new
customers and grow with them over time.” – Steve Squeri (Chairman & CEO)
5
“Our choices in Domestic Card are the biggest driver of total company
marketing, and we continue to see attractive growth opportunities in our
Domestic Card business. Our opportunities are enhanced by our technology
transformation. We continue to lean into marketing to drive resilient growth
and enhance our Domestic Card franchise. And as always, we're keeping a
close eye on competitor actions and potential marketplace risks. We're
seeing the success of our marketing and strong growth in Domestic Card
new accounts, purchase volume, and loans across our card business. And
strong momentum in our decade-long focus on building a franchise with
heavy spenders at the top of the marketplace continues.” – Richard Fairbank
(Chairman & CEO)
“Growth in domestic payments volumes remained stable around the
globe. As we said last quarter, the recovery from COVID is behind us
now for domestic volume. Post the Omicron impact from last year in
January and February, U.S. domestic volume growth rates have
ticked down in March, driven by the factors we discussed earlier. We
believe that some of these factors will persist through the third
quarter. As such, we are assuming March and April trends will
continue in the U.S. for the rest of the quarter. In aggregate, we
expect the international growth trajectory remains largely
unchanged from the second quarter.” – Vasant Prabhu (Vice-Chair &
CFO) |
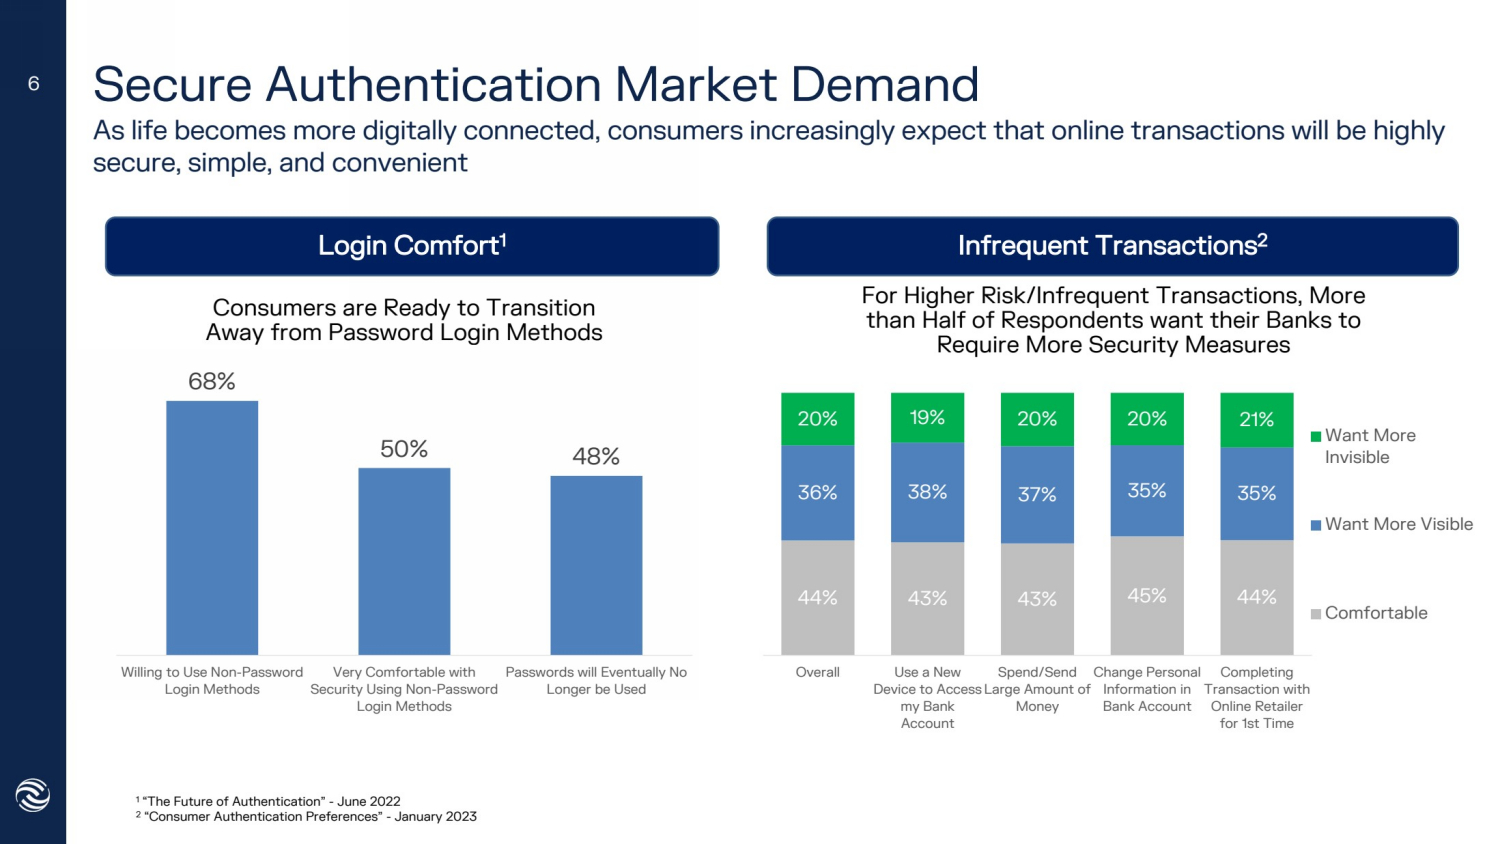
| Secure Authentication Market Demand
As life becomes more digitally connected, consumers increasingly expect that online transactions will be highly
secure, simple, and convenient
6
Consumers are Ready to Transition
Away from Password Login Methods
Login Comfort1
68%
50% 48%
Willing to Use Non-Password
Login Methods
Very Comfortable with
Security Using Non-Password
Login Methods
Passwords will Eventually No
Longer be Used
1
“The Future of Authentication” - June 2022
2
“Consumer Authentication Preferences” - January 2023
44% 43% 43% 45% 44%
36% 38% 37% 35% 35%
20% 19% 20% 20% 21%
Overall Use a New
Device to Access
my Bank
Account
Spend/Send
Large Amount of
Money
Change Personal
Information in
Bank Account
Completing
Transaction with
Online Retailer
for 1st Time
Want More
Invisible
Want More Visible
Comfortable
For Higher Risk/Infrequent Transactions, More
than Half of Respondents want their Banks to
Require More Security Measures
Infrequent Transactions
2 |
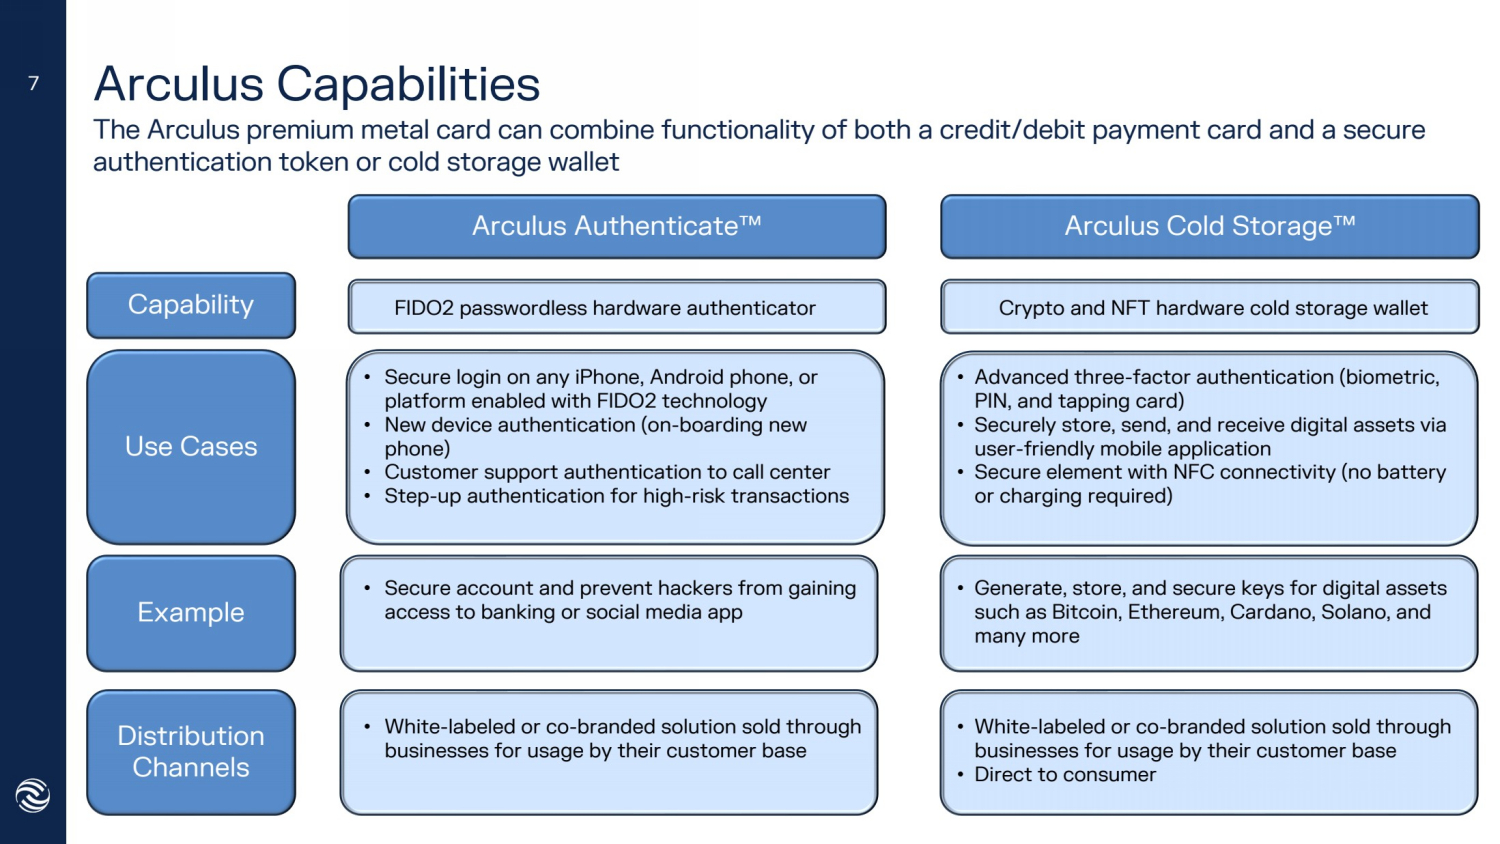
| Arculus Capabilities
The Arculus premium metal card can combine functionality of both a credit/debit payment card and a secure
authentication token or cold storage wallet
7
Arculus Authenticate™ Arculus Cold Storage™
FIDO2 passwordless hardware authenticator
• Secure login on any iPhone, Android phone, or
platform enabled with FIDO2 technology
• New device authentication (on-boarding new
phone)
• Customer support authentication to call center
• Step-up authentication for high-risk transactions
• Secure account and prevent hackers from gaining
access to banking or social media app
• White-labeled or co-branded solution sold through
businesses for usage by their customer base
• Generate, store, and secure keys for digital assets
such as Bitcoin, Ethereum, Cardano, Solano, and
many more
• White-labeled or co-branded solution sold through
businesses for usage by their customer base
• Direct to consumer
Capability
Use Cases
Example
Distribution
Channels
Crypto and NFT hardware cold storage wallet
• Advanced three-factor authentication (biometric,
PIN, and tapping card)
• Securely store, send, and receive digital assets via
user-friendly mobile application
• Secure element with NFC connectivity (no battery
or charging required) |
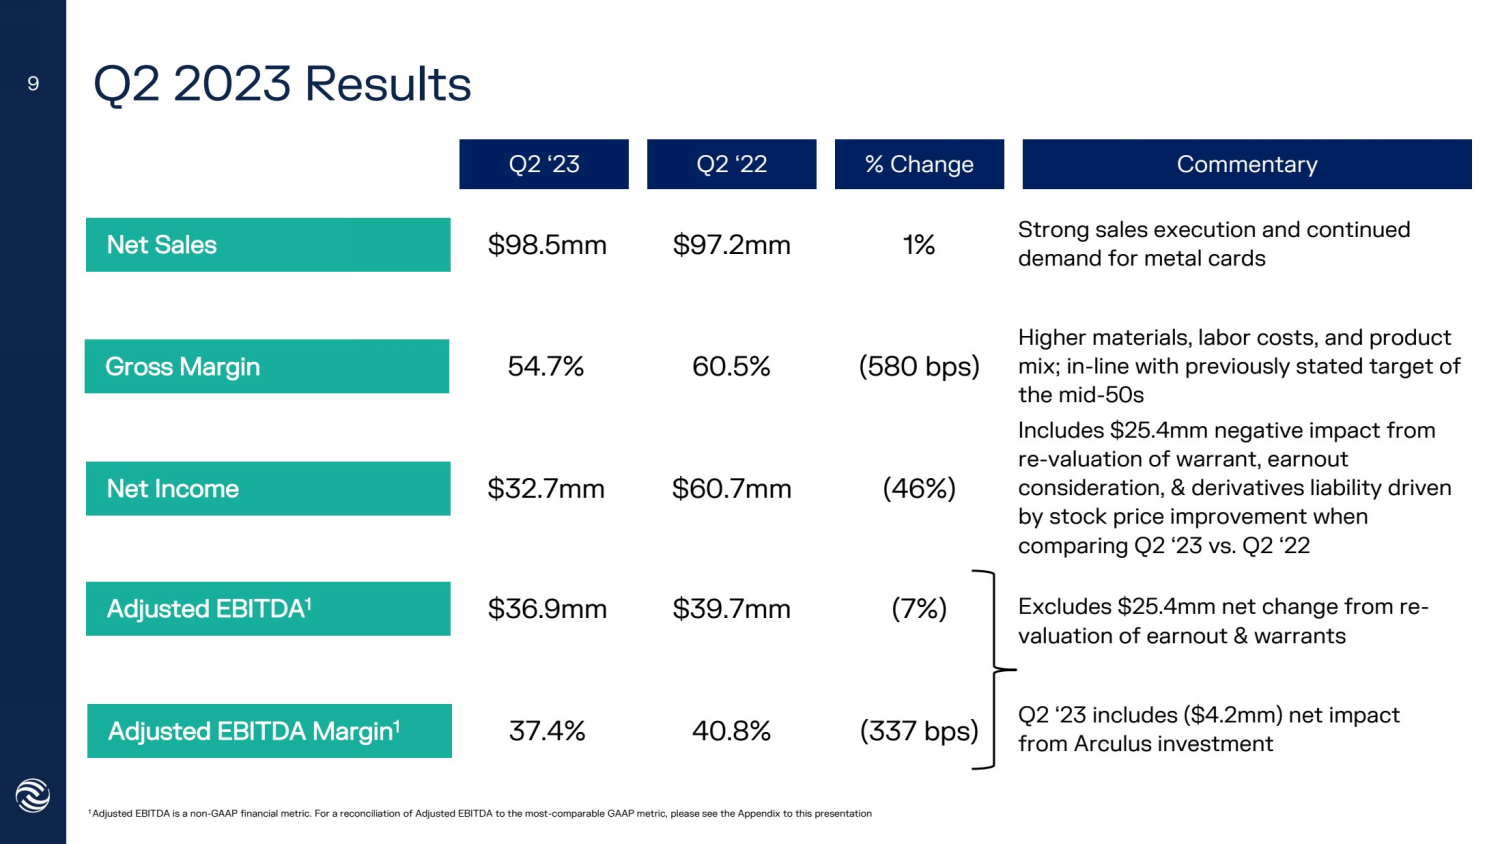
| Q2 2023 Results
$36.9mm
Q2 ‘23 Q2 YTD
‘22
Net Sales $98.5mm
37.4%
$32.7mm
54.7%
$97.2mm
$60.7mm
60.5%
$39.7mm
40.8%
1%
Strong sales execution and continued
demand for metal cards
(46%)
(580 bps)
(7%)
(337 bps)
Net Income
Gross Margin
Adjusted EBITDA1
Adjusted EBITDA Margin1
Q2 ‘22 % Change Commentary
1 Adjusted EBITDA is a non-GAAP financial metric. For a reconciliation of Adjusted EBITDA to the most-comparable GAAP metric, please see the Appendix to this presentation
Higher materials, labor costs, and product
mix; in-line with previously stated target of
the mid-50s
Includes $25.4mm negative impact from
re-valuation of warrant, earnout
consideration, & derivatives liability driven
by stock price improvement when
comparing Q2 ‘23 vs. Q2 ‘22
Excludes $25.4mm net change from re-valuation of earnout & warrants
Q2 ‘23 includes ($4.2mm) net impact
from Arculus investment
9 |
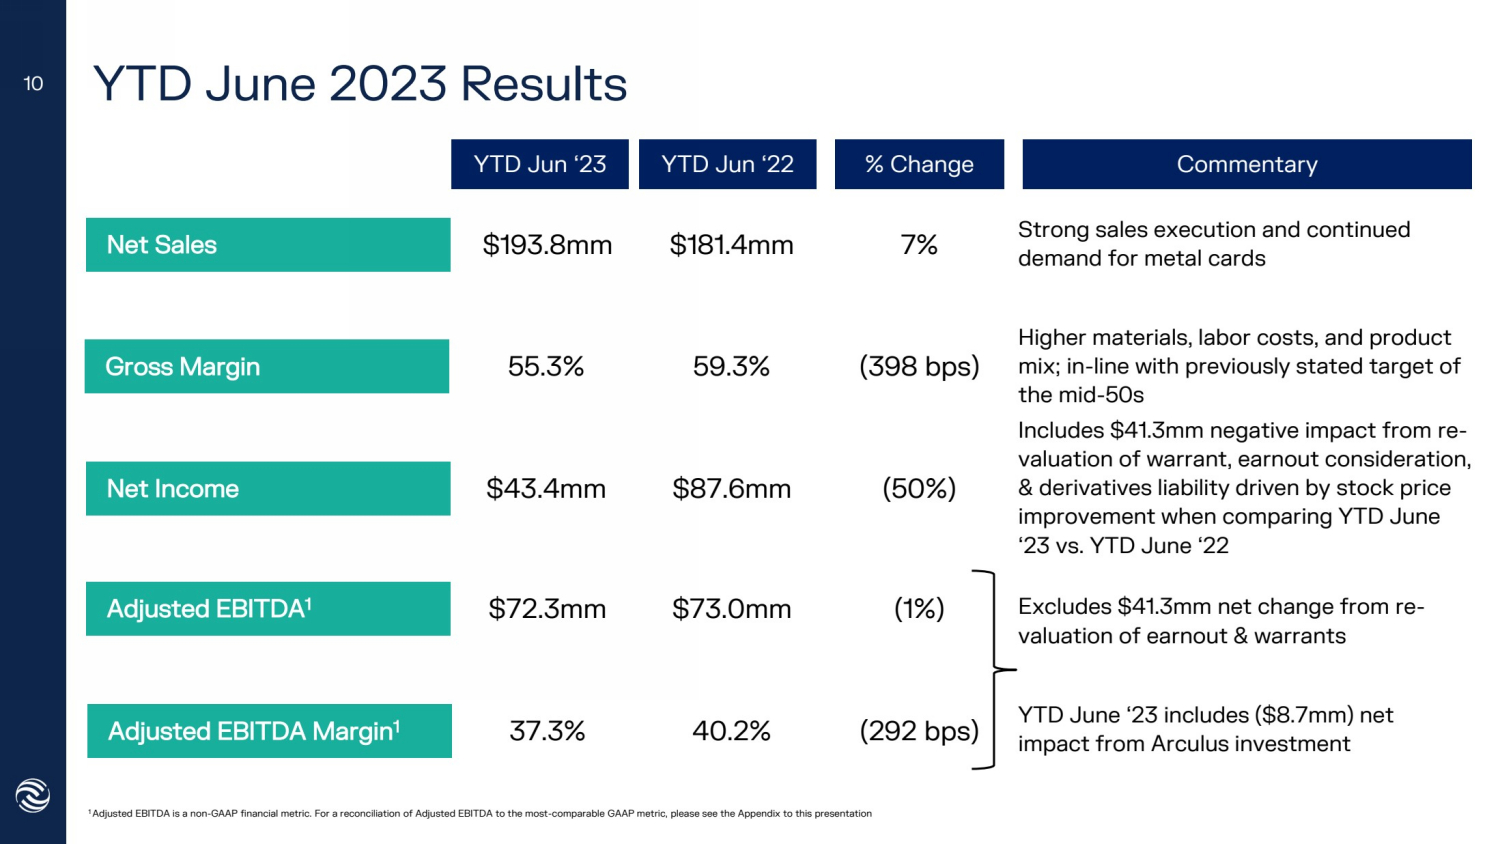
| YTD June 2023 Results
$72.3mm
YTD Jun ‘23 Q2 YTD
‘22
Net Sales $193.8mm
37.3%
$43.4mm
55.3%
$181.4mm
$87.6mm
59.3%
$73.0mm
40.2%
7%
Strong sales execution and continued
demand for metal cards
(50%)
(398 bps)
(1%)
(292 bps)
Net Income
Gross Margin
Adjusted EBITDA1
Adjusted EBITDA Margin1
YTD Jun ‘22 % Change Commentary
1 Adjusted EBITDA is a non-GAAP financial metric. For a reconciliation of Adjusted EBITDA to the most-comparable GAAP metric, please see the Appendix to this presentation
Excludes $41.3mm net change from re-valuation of earnout & warrants
YTD June ‘23 includes ($8.7mm) net
impact from Arculus investment
10
Includes $41.3mm negative impact from re-valuation of warrant, earnout consideration,
& derivatives liability driven by stock price
improvement when comparing YTD June
‘23 vs. YTD June ‘22
Higher materials, labor costs, and product
mix; in-line with previously stated target of
the mid-50s |
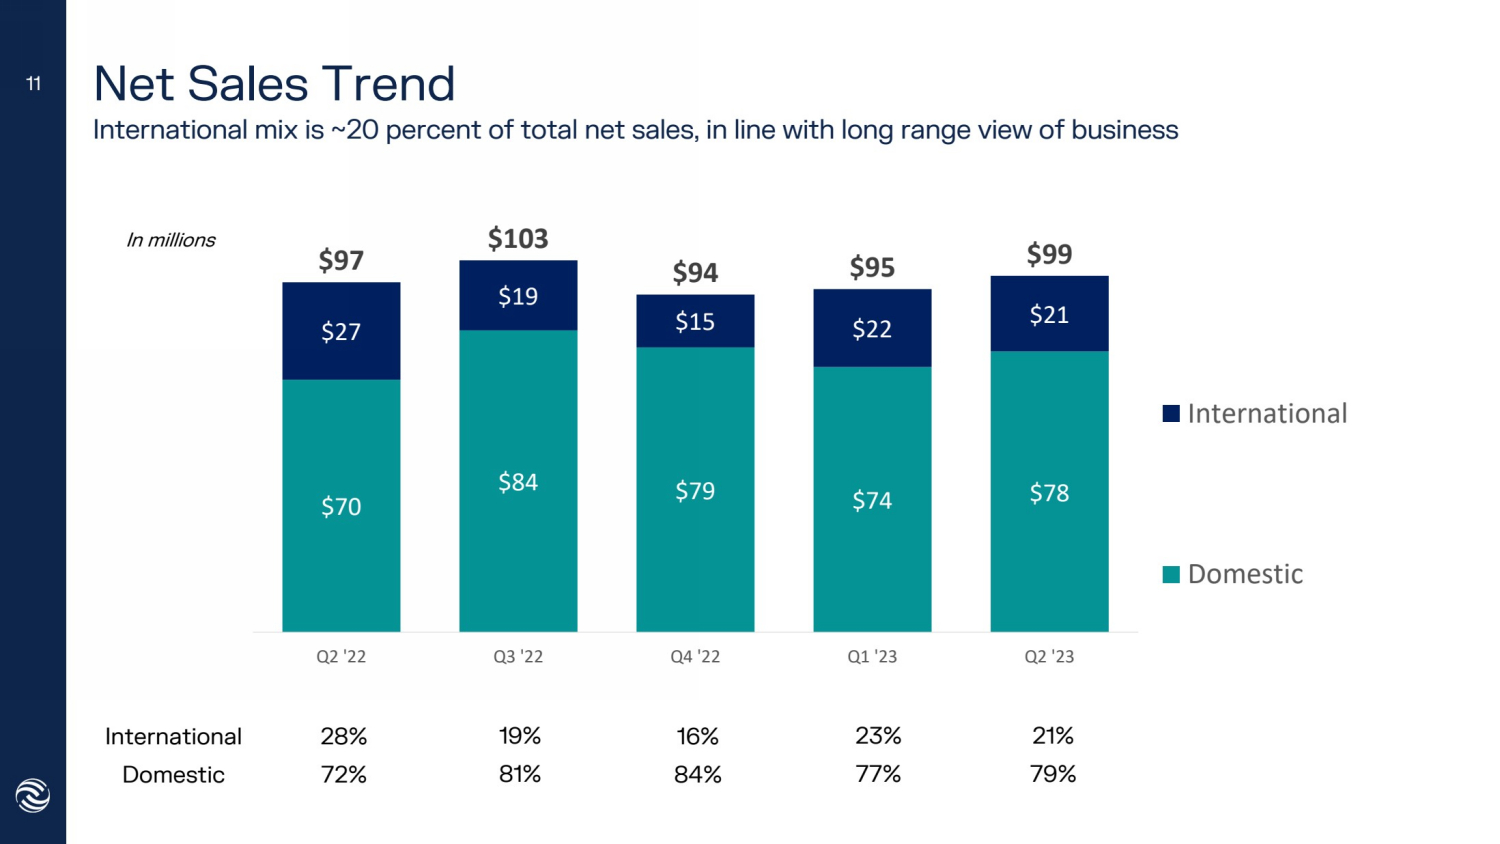
| $70
$84 $79 $74
$78
$27
$19
$15 $22
$21
$97 $103
$94 $95
$99
Q2 '22 Q3 '22 Q4 '22 Q1 '23 Q2 '23
International
Domestic
Net Sales Trend
International mix is ~20 percent of total net sales, in line with long range view of business
In millions
International
Domestic
28%
72%
21%
79%
19%
81%
16%
84%
11
23%
77% |
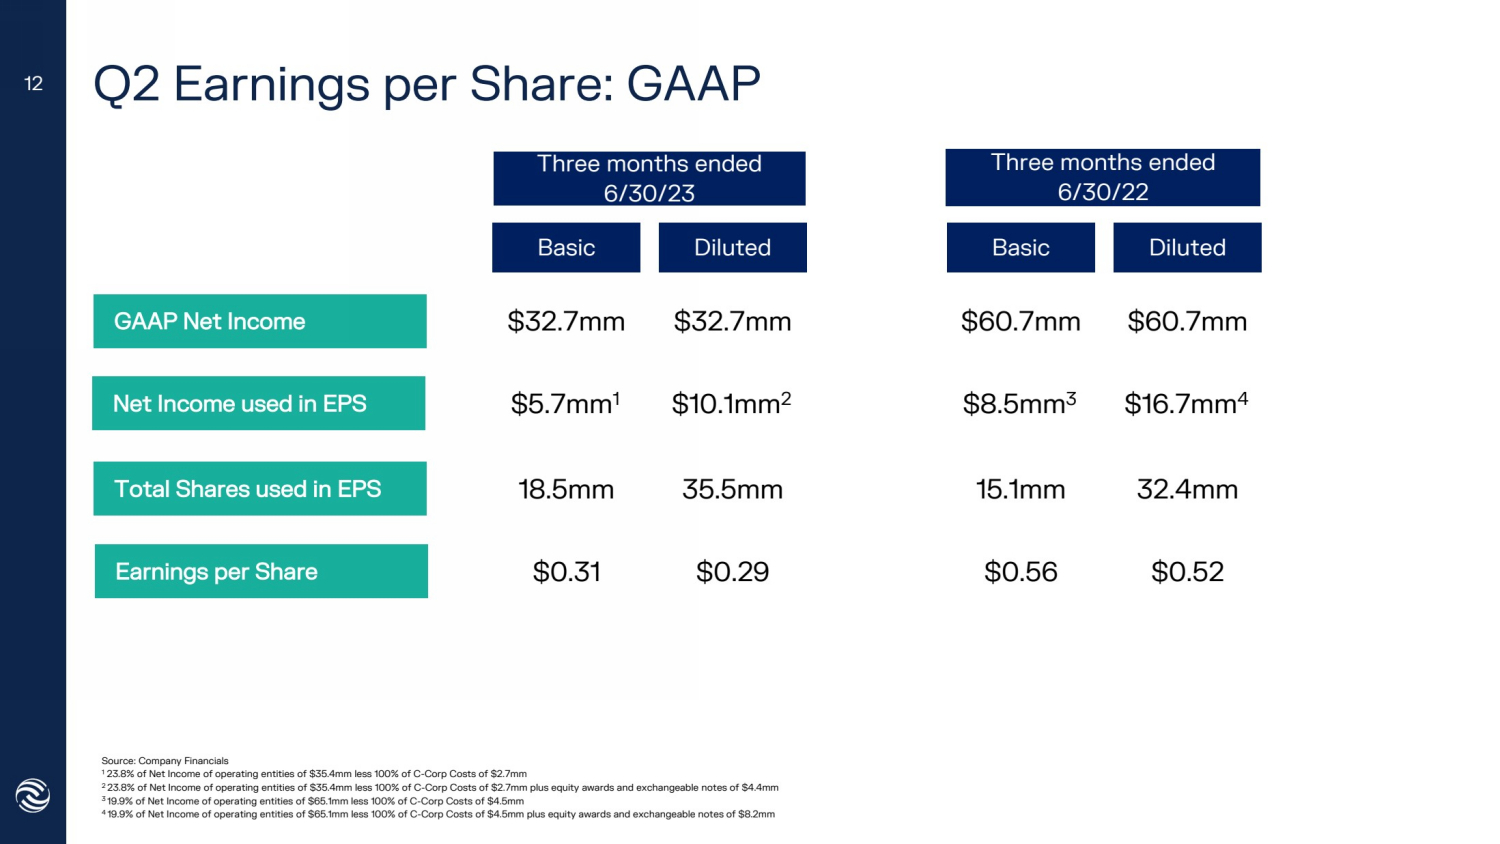
| Q2 Earnings per Share: GAAP
18.5mm
Basic
Q2 YTD
‘22
GAAP Net Income $32.7mm
$0.31
$5.7mm1
Three months ended
6/30/23
Three months ended
6/30/22
$32.7mm
$10.1mm2
35.5mm
$0.29
$60.7mm $60.7mm
$8.5mm3 $16.7mm4
15.1mm 32.4mm
$0.56 $0.52
Net Income used in EPS
Total Shares used in EPS
Earnings per Share
Diluted Basic Diluted
Source: Company Financials
1 23.8% of Net Income of operating entities of $35.4mm less 100% of C-Corp Costs of $2.7mm
2 23.8% of Net Income of operating entities of $35.4mm less 100% of C-Corp Costs of $2.7mm plus equity awards and exchangeable notes of $4.4mm
3 19.9% of Net Income of operating entities of $65.1mm less 100% of C-Corp Costs of $4.5mm
4 19.9% of Net Income of operating entities of $65.1mm less 100% of C-Corp Costs of $4.5mm plus equity awards and exchangeable notes of $8.2mm
12 |
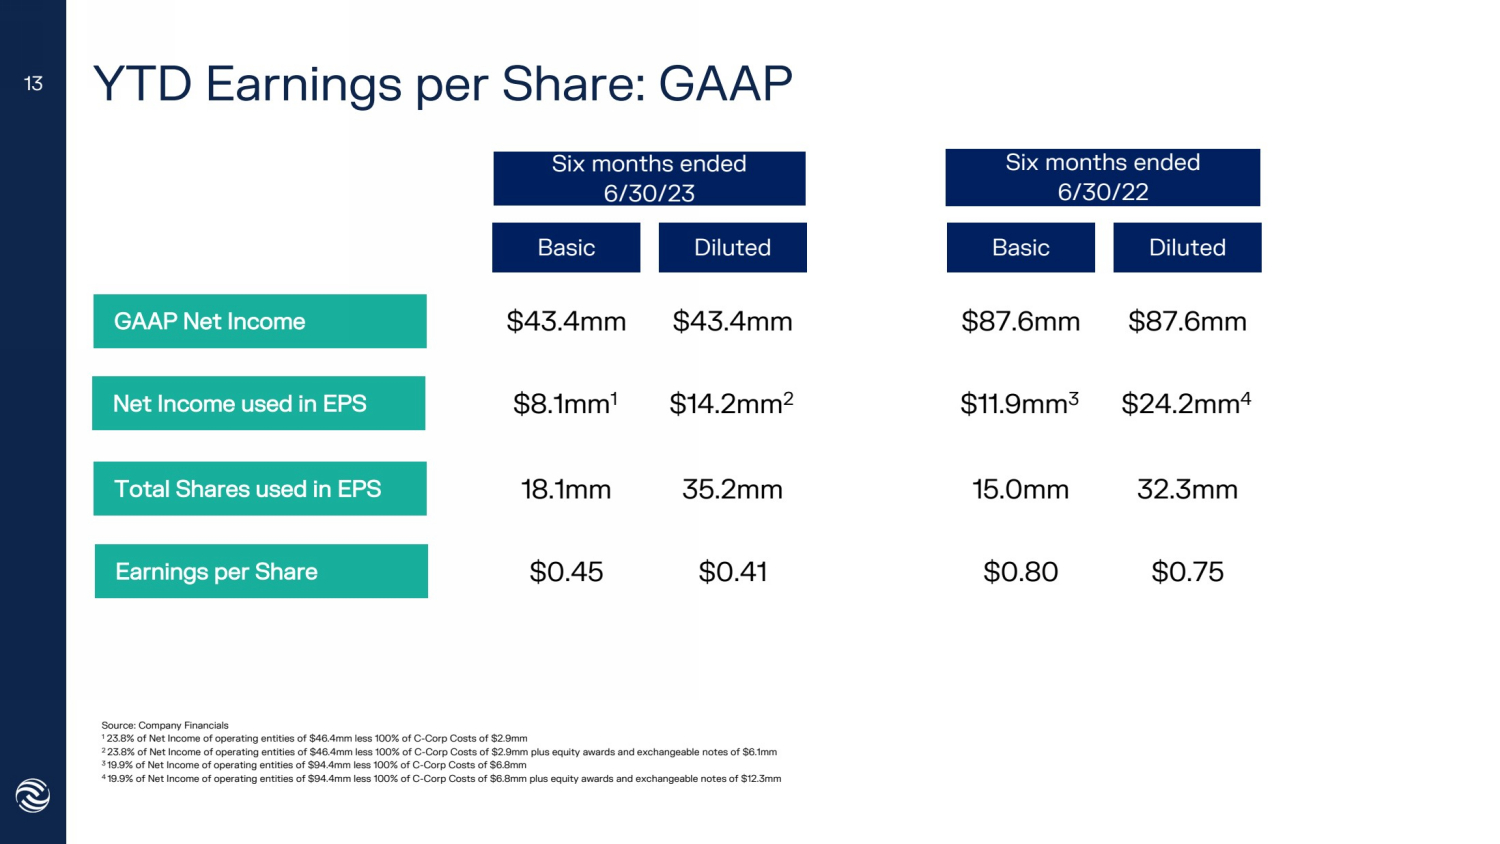
| YTD Earnings per Share: GAAP
18.1mm
Basic
Q2 YTD
‘22
GAAP Net Income $43.4mm
$0.45
$8.1mm1
Six months ended
6/30/23
Six months ended
6/30/22
$43.4mm
$14.2mm2
35.2mm
$0.41
$87.6mm $87.6mm
$11.9mm3 $24.2mm4
15.0mm 32.3mm
$0.80 $0.75
Net Income used in EPS
Total Shares used in EPS
Earnings per Share
Diluted Basic Diluted
Source: Company Financials
1 23.8% of Net Income of operating entities of $46.4mm less 100% of C-Corp Costs of $2.9mm
2 23.8% of Net Income of operating entities of $46.4mm less 100% of C-Corp Costs of $2.9mm plus equity awards and exchangeable notes of $6.1mm
3 19.9% of Net Income of operating entities of $94.4mm less 100% of C-Corp Costs of $6.8mm
4 19.9% of Net Income of operating entities of $94.4mm less 100% of C-Corp Costs of $6.8mm plus equity awards and exchangeable notes of $12.3mm
13 |
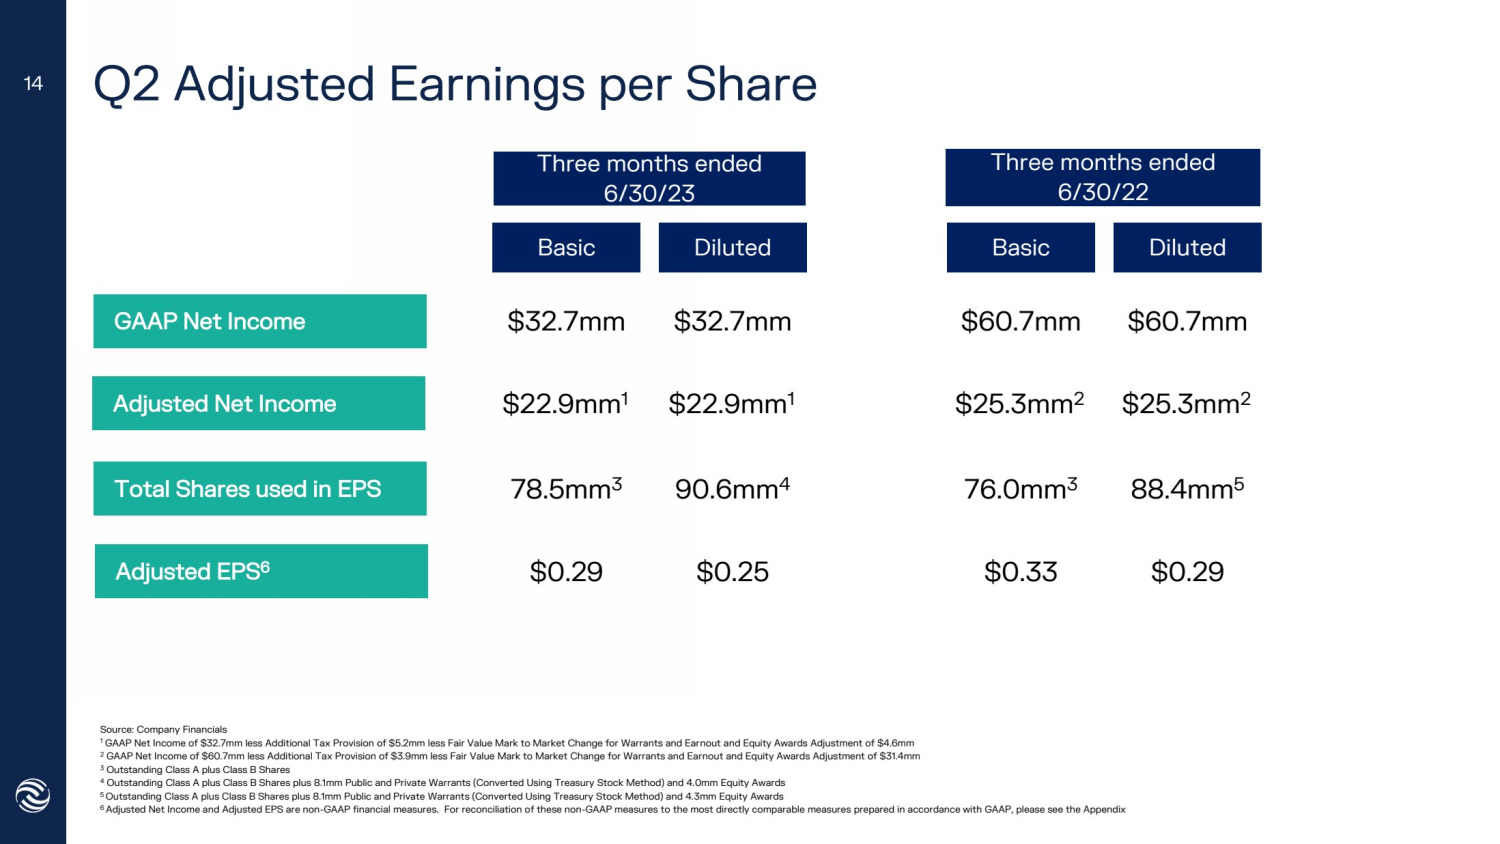
| Q2 Adjusted Earnings per Share
Source: Company Financials
1 GAAP Net Income of $32.7mm less Additional Tax Provision of $5.2mm less Fair Value Mark to Market Change for Warrants and Earnout and Equity Awards Adjustment of $4.6mm
2 GAAP Net Income of $60.7mm less Additional Tax Provision of $3.9mm less Fair Value Mark to Market Change for Warrants and Earnout and Equity Awards Adjustment of $31.4mm
3 Outstanding Class A plus Class B Shares
4 Outstanding Class A plus Class B Shares plus 8.1mm Public and Private Warrants (Converted Using Treasury Stock Method) and 4.0mm Equity Awards
5 Outstanding Class A plus Class B Shares plus 8.1mm Public and Private Warrants (Converted Using Treasury Stock Method) and 4.3mm Equity Awards
6 Adjusted Net Income and Adjusted EPS are non-GAAP financial measures. For reconciliation of these non-GAAP measures to the most directly comparable measures prepared in accordance with GAAP, please see the Appendix
78.5mm3
Basic
Q2 YTD
‘22
GAAP Net Income $32.7mm
$0.29
$22.9mm1
Three months ended
6/30/23
Three months ended
6/30/22
$32.7mm
$22.9mm1
90.6mm4
$0.25
$60.7mm $60.7mm
$25.3mm2 $25.3mm2
76.0mm3 88.4mm5
$0.33 $0.29
Adjusted Net Income
Total Shares used in EPS
Adjusted EPS6
Diluted Basic Diluted
14 |

| YTD Adjusted Earnings per Share
Source: Company Financials
1 GAAP Net Income of $43.4mm less Additional Tax Provision of $12.1mm add Fair Value Mark to Market Change for Warrants and Earnout and Equity Awards Adjustment of $12.2mm
2 GAAP Net Income of $87.6mm less Additional Tax Provision of $8.8mm less Fair Value Mark to Market Change for Warrants and Earnout and Equity Awards Adjustment of $33.1mm
3 Outstanding Class A plus Class B Shares
4 Outstanding Class A plus Class B Shares plus 8.1mm Public and Private Warrants (Converted Using Treasury Stock Method) and 4.1mm Equity Awards .
5 Outstanding Class A plus Class B Shares plus 8.1mm Public and Private Warrants (Converted Using Treasury Stock Method) and 4.3mm Equity Awards
6 Adjusted Net Income and Adjusted EPS are non-GAAP financial measures. For reconciliation of these non-GAAP measures to the most directly comparable measures prepared in accordance with GAAP, please see the Appendix
78.0mm3
Basic
Q2 YTD
‘22
GAAP Net Income $43.4mm
$0.56
$43.5mm1
Six months ended
6/30/23
Six months ended
6/30/22
$43.4mm
$43.5mm1
90.2mm4
$0.48
$87.6mm $87.6mm
$45.7mm2 $45.7mm2
76.1mm3 88.5mm5
$0.60 $0.52
Adjusted Net Income
Total Shares used in EPS
Adjusted EPS6
Diluted Basic Diluted
15 |

| 2023 Guidance
Reaffirming full year net sales and adjusted EBITDA guidance
Net Sales
Adjusted EBITDA1
2022
$378mm
$136mm
1 Adjusted EBITDA is a non-GAAP financial metric. For a reconciliation of Adjusted EBITDA to the most-comparable GAAP metric, please see the Appendix to this presentation
$400mm - $425mm
$145mm - $155mm
2023E
B/(W) vs. ‘22 +6% / +12%
B/(W) vs. ’22 +7% / +14%
16 |

| Strategic Priorities
A leader in Metal Payment Cards, Security, Storage, and Authentication Technology
Drive premium payment card sales through continued domestic growth, international expansion, and FinTechs
Deliver innovative new card constructs and leverage our scale and existing relationships
Enhance Arculus capabilities (blockchain support, payment card integration, & channel expansion) to drive adoption
across key B2B verticals given demand for multi-factor authentication security solutions
Optimize investment in product lines across advertising initiatives, talent, software development, and partnerships to
accelerate growth
Focus on process efficiencies, materials procurement, and upsell opportunities to maintain strong margins
17 |

| Investor Relations Contact
ir.composecure.com
Sean Mansouri
720-330-2829
ir@composecure.com
18
18 |
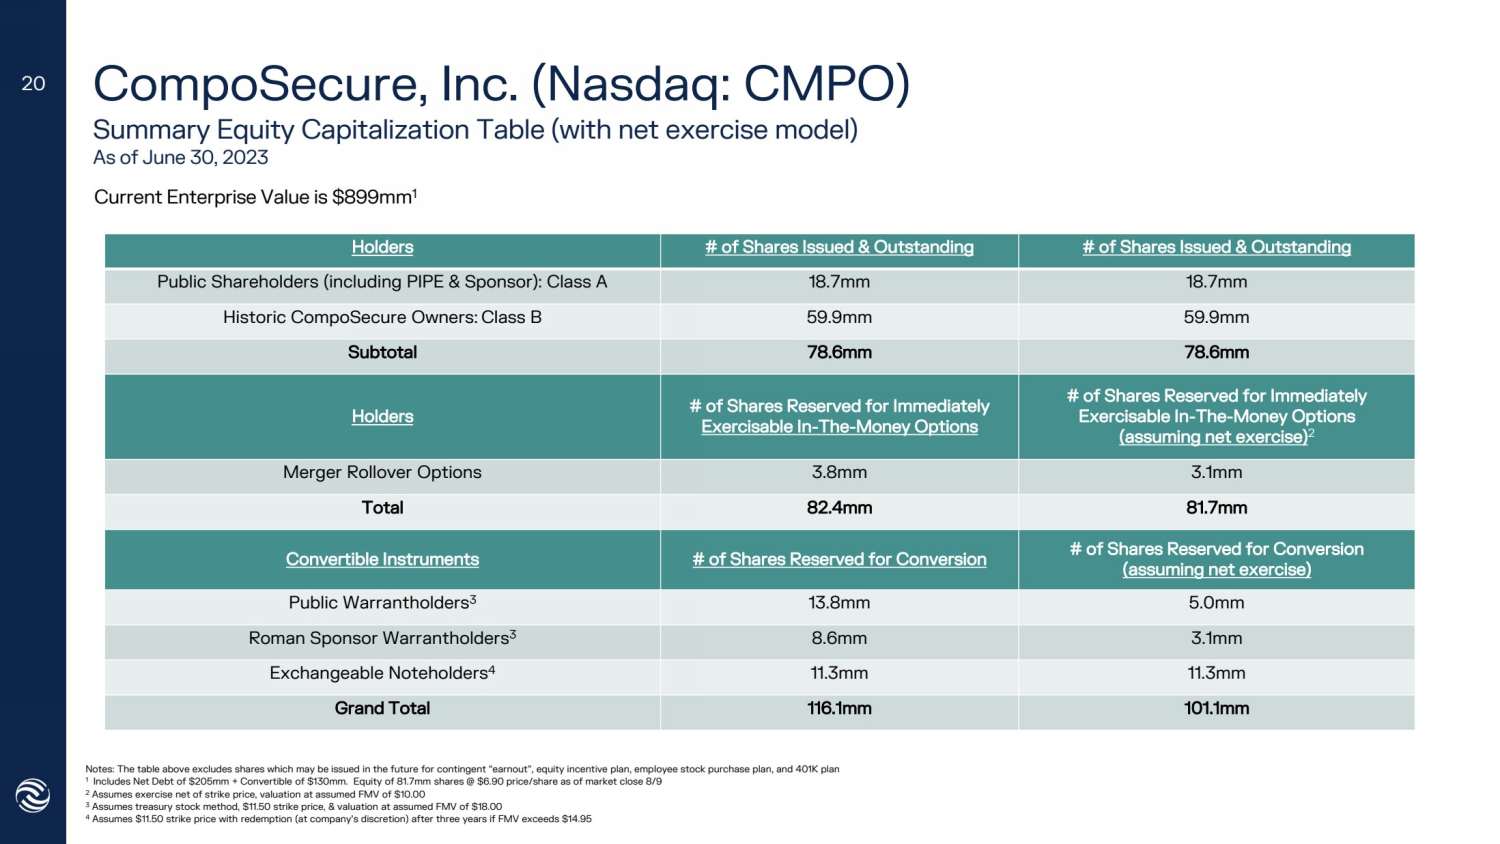
| CompoSecure, Inc. (Nasdaq: CMPO)
Summary Equity Capitalization Table (with net exercise model)
As of June 30, 2023
Holders # of Shares Issued & Outstanding # of Shares Issued & Outstanding
Public Shareholders (including PIPE & Sponsor): Class A 18.7mm 18.7mm
Historic CompoSecure Owners: Class B 59.9mm 59.9mm
Subtotal 78.6mm 78.6mm
Holders # of Shares Reserved for Immediately
Exercisable In-The-Money Options
# of Shares Reserved for Immediately
Exercisable In-The-Money Options
(assuming net exercise)
2
Merger Rollover Options 3.8mm 3.1mm
Total 82.4mm 81.7mm
Convertible Instruments # of Shares Reserved for Conversion
# of Shares Reserved for Conversion
(assuming net exercise)
Public Warrantholders3 13.8mm 5.0mm
Roman Sponsor Warrantholders3 8.6mm 3.1mm
Exchangeable Noteholders4 11.3mm 11.3mm
Grand Total 116.1mm 101.1mm
Notes: The table above excludes shares which may be issued in the future for contingent “earnout”, equity incentive plan, employee stock purchase plan, and 401K plan
1
Includes Net Debt of $205mm + Convertible of $130mm. Equity of 81.7mm shares @ $6.90 price/share as of market close 8/9
2 Assumes exercise net of strike price, valuation at assumed FMV of $10.00
3 Assumes treasury stock method, $11.50 strike price, & valuation at assumed FMV of $18.00
4 Assumes $11.50 strike price with redemption (at company’s discretion) after three years if FMV exceeds $14.95
Current Enterprise Value is $899mm1
20 |
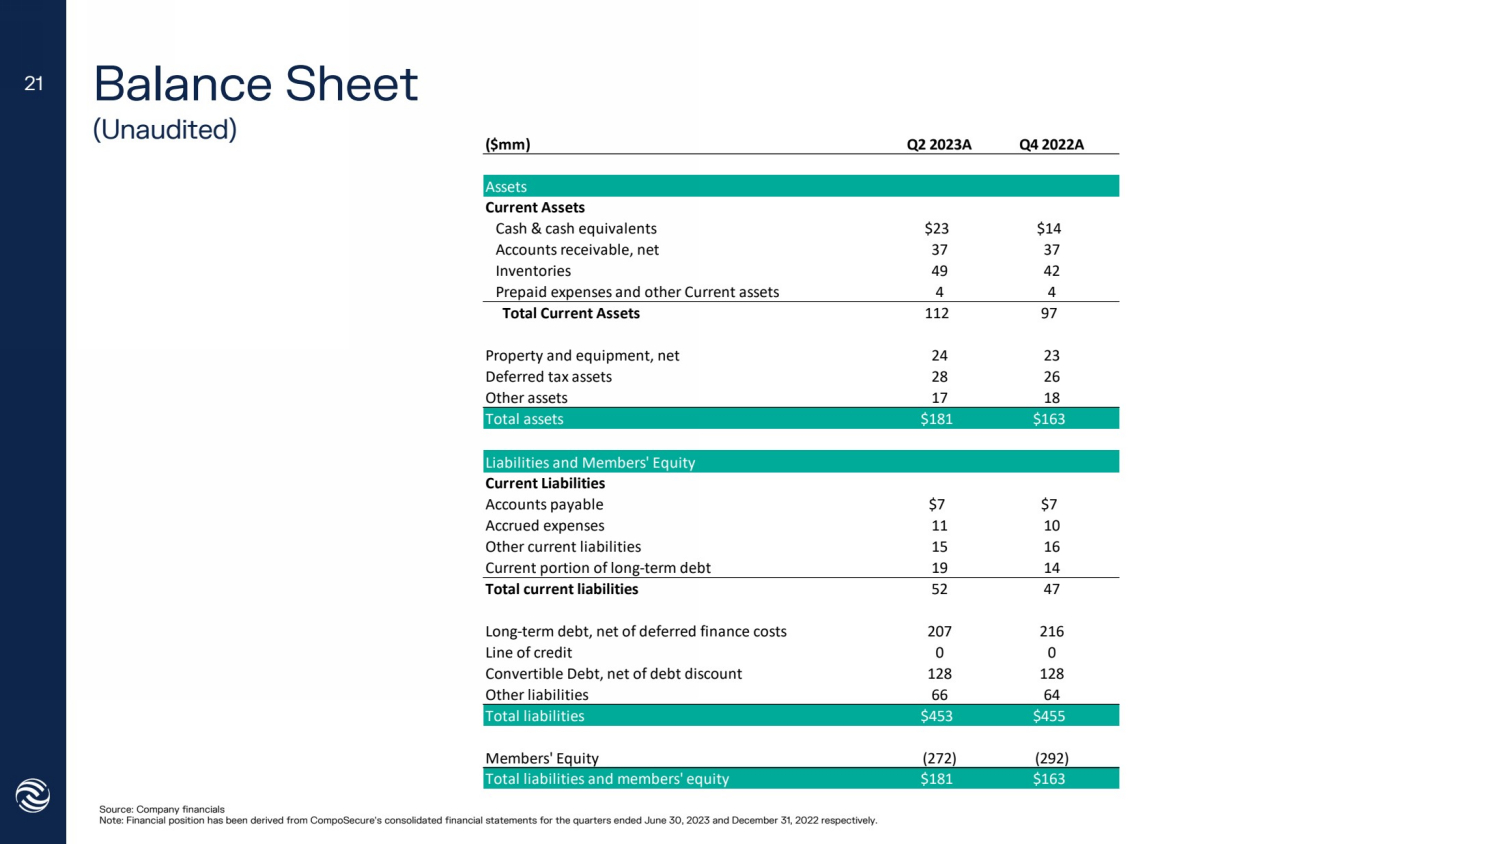
| Balance Sheet
(Unaudited)
Source: Company financials
Note: Financial position has been derived from CompoSecure’s consolidated financial statements for the quarters ended June 30, 2023 and December 31, 2022 respectively.
21
($mm) Q2 2023A Q4 2022A
Assets
Current Assets
Cash & cash equivalents $23 $14
Accounts receivable, net 37 37
Inventories 49 42
Prepaid expenses and other Current assets 4 4
Total Current Assets 112 97
Property and equipment, net 24 23
Deferred tax assets 28 26
Other assets 17 18
Total assets $181 $163
Liabilities and Members' Equity
Current Liabilities
Accounts payable $7 $7
Accrued expenses 11 10
Other current liabilities 15 16
Current portion of long-term debt 19 14
Total current liabilities 52 47
Long-term debt, net of deferred finance costs 207 216
Line of credit 0 0
Convertible Debt, net of debt discount 128 128
Other liabilities 66 64
Total liabilities $453 $455
Members' Equity (272) (292)
Total liabilities and members' equity $181 $163 |
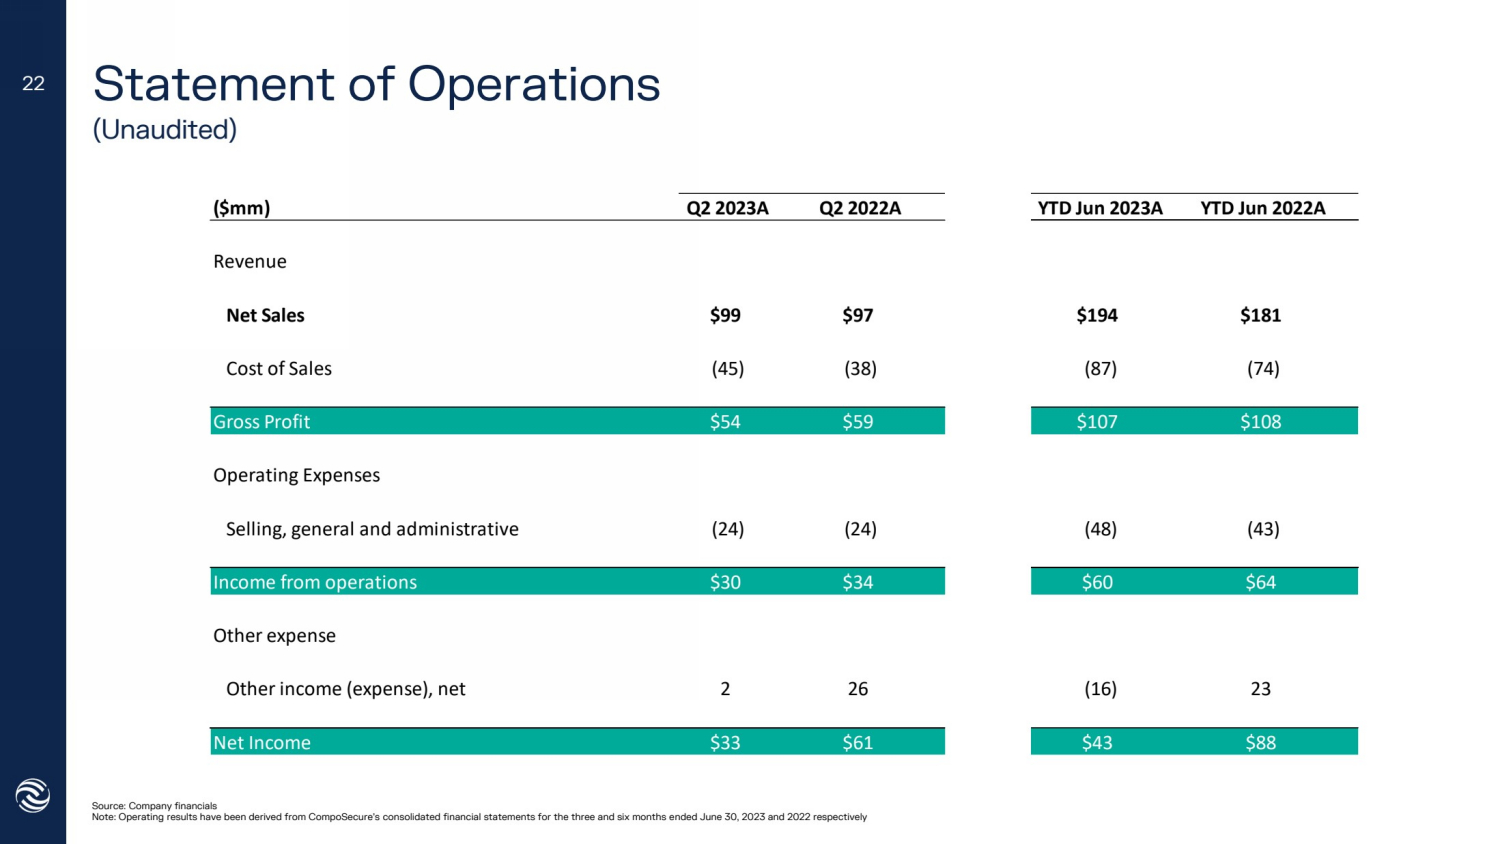
| Statement of Operations
(Unaudited)
Source: Company financials
Note: Operating results have been derived from CompoSecure’s consolidated financial statements for the three and six months ended June 30, 2023 and 2022 respectively
22
($mm) Q2 2023A Q2 2022A YTD Jun 2023A YTD Jun 2022A
Revenue
Net Sales $99 $97 $194 $181
Cost of Sales (45) (38) (87) (74)
Gross Profit $54 $59 $107 $108
Operating Expenses
Selling, general and administrative (24) (24) (48) (43)
Income from operations $30 $34 $60 $64
Other expense
Other income (expense), net 2 26 (16) 23
Net Income $33 $61 $43 $88 |
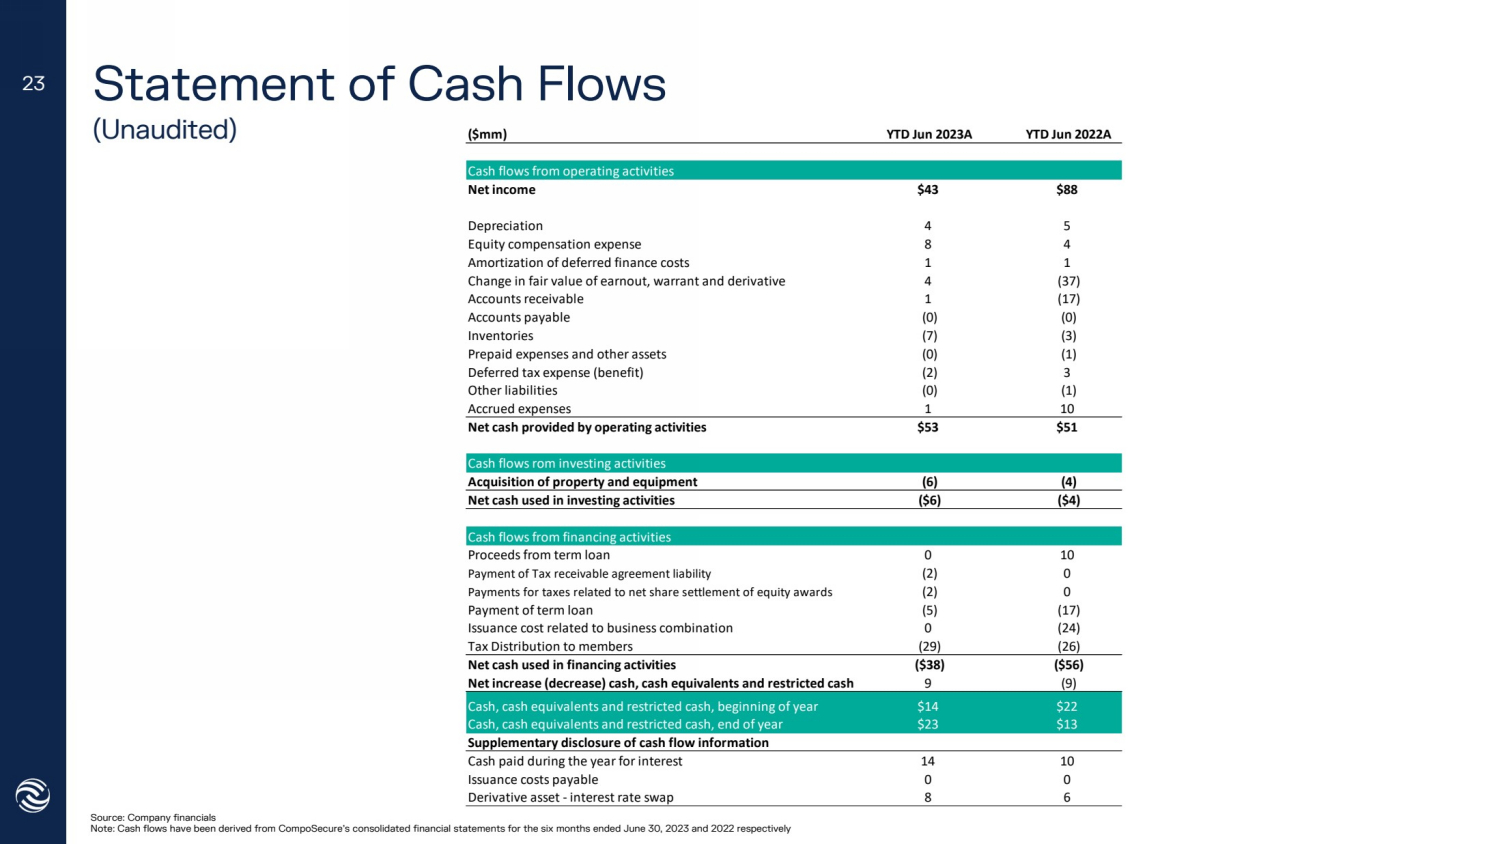
| Statement of Cash Flows
(Unaudited)
Source: Company financials
Note: Cash flows have been derived from CompoSecure’s consolidated financial statements for the six months ended June 30, 2023 and 2022 respectively
23
($mm) YTD Jun 2023A YTD Jun 2022A
Cash flows from operating activities
Net income $43 $88
Depreciation 4 5
Equity compensation expense 8 4
Amortization of deferred finance costs 1 1
Change in fair value of earnout, warrant and derivative 4 (37)
Accounts receivable 1 (17)
Accounts payable (0) (0)
Inventories (7) (3)
Prepaid expenses and other assets (0) (1)
Deferred tax expense (benefit) (2) 3
Other liabilities (0) (1)
Accrued expenses 1 10
Net cash provided by operating activities $53 $51
Cash flows rom investing activities
Acquisition of property and equipment (6) (4)
Net cash used in investing activities ($6) ($4)
Cash flows from financing activities
Proceeds from term loan 0 10
Payment of Tax receivable agreement liability (2) 0
Payments for taxes related to net share settlement of equity awards (2) 0
Payment of term loan (5) (17)
Issuance cost related to business combination 0 (24)
Tax Distribution to members (29) (26)
Net cash used in financing activities ($38) ($56)
Net increase (decrease) cash, cash equivalents and restricted cash 9 (9)
Cash, cash equivalents and restricted cash, beginning of year $14 $22
Cash, cash equivalents and restricted cash, end of year $23 $13
Supplementary disclosure of cash flow information
Cash paid during the year for interest 14 10
Issuance costs payable 0 0
Derivative asset - interest rate swap 8 6 |

| Non-GAAP Adjusted EBITDA Reconciliation
(Unaudited)
Source: Company financials
Non-Cash Equity Awards:
Equity based expenses related to the
equity incentive plan
Non-Cash Mark-to-Market Adjustments:
Related to changes in fair value of liabilities
for warrants, earnouts and derivatives
assets.
1
2
1
2
24
$mm Q2 2023A Q2 2022A YTD Jun 2023A YTD Jun 2022A
Net Income $33 $61 $43 $88
Interest Expense 6 6 12 11
Depreciation and Amortization 2 2 4 5
Taxes 1 3 0 3
Unadjusted EBITDA $42 $71 $60 $106
Non-Cash Equity Awards Expense 4 3 8 4
Mark-to-market Adjustments - 9 -35 4 -37
Total EBITDA Adjustments ($5) ($32) $13 ($33)
Adjusted EBITDA $37 $40 $72 $73
Adjusted EBITDA % 37% 41% 37% 40% |
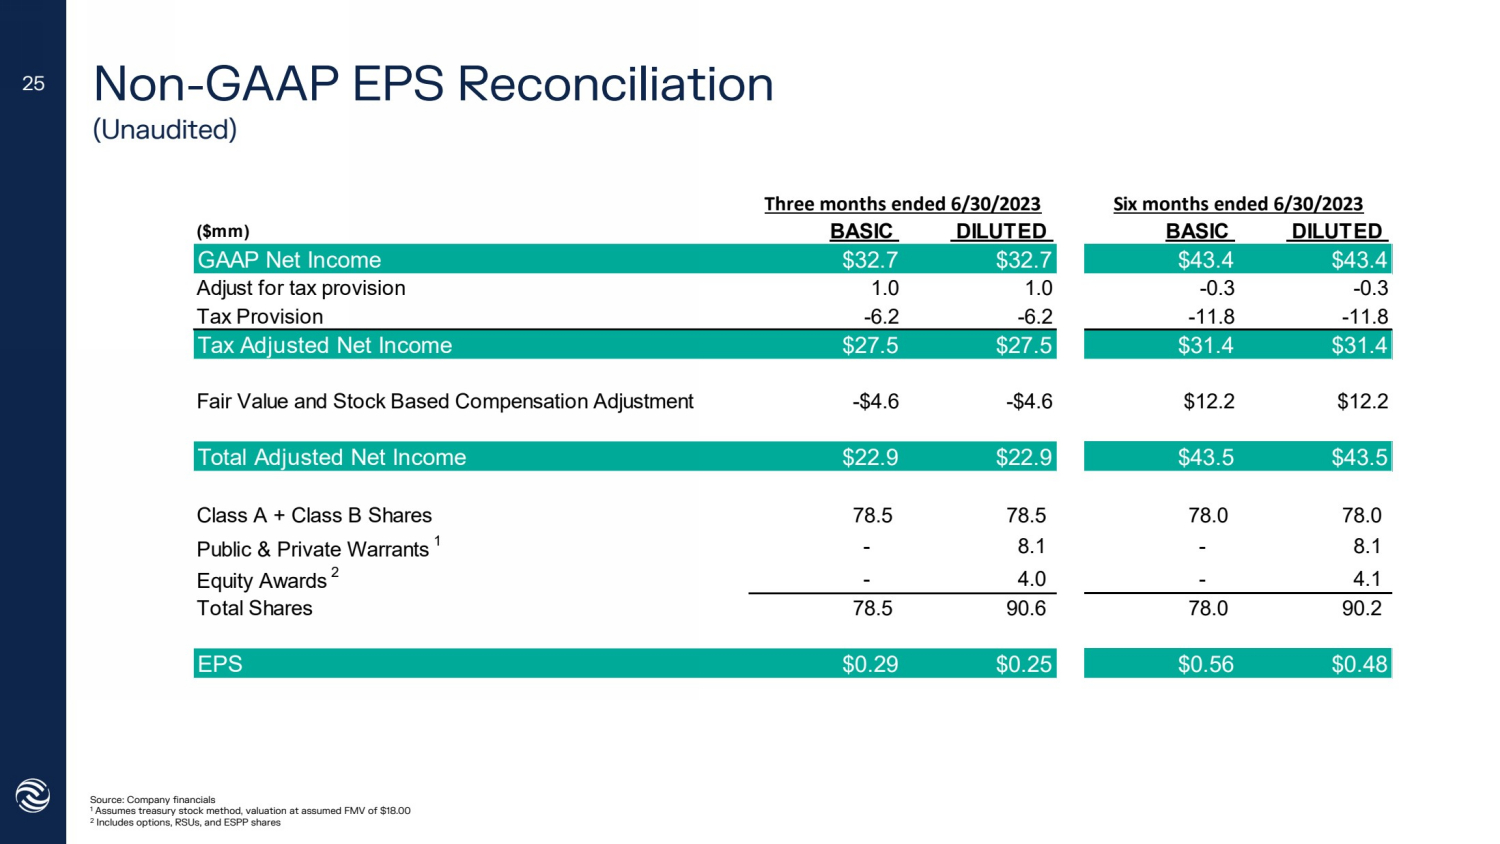
| Non-GAAP EPS Reconciliation
(Unaudited)
Source: Company financials
1 Assumes treasury stock method, valuation at assumed FMV of $18.00
2 Includes options, RSUs, and ESPP shares
25
($mm) BASIC DILUTED BASIC DILUTED
GAAP Net Income $32.7 $32.7 $43.4 $43.4
Adjust for tax provision 1.0 1.0 -0.3 -0.3
Tax Provision -6.2 -6.2 -11.8 -11.8
Tax Adjusted Net Income $27.5 $27.5 $31.4 $31.4
Fair Value and Stock Based Compensation Adjustment -$4.6 -$4.6 $12.2 $12.2
Total Adjusted Net Income $22.9 $22.9 $43.5 $43.5
Class A + Class B Shares 78.5 78.5 78.0 78.0
Public & Private Warrants 1
- 8.1 - 8.1
Equity Awards 2
- 4.0 - 4.1
Total Shares 78.5 90.6 78.0 90.2
EPS $0.29 $0.25 $0.56 $0.48
Three months ended 6/30/2023 Six months ended 6/30/2023 |
Cover
|
Aug. 14, 2023 |
| Document Type |
8-K
|
| Amendment Flag |
false
|
| Document Period End Date |
Aug. 14, 2023
|
| Entity File Number |
001-39687
|
| Entity Registrant Name |
CompoSecure, Inc.
|
| Entity Central Index Key |
0001823144
|
| Entity Tax Identification Number |
85-2749902
|
| Entity Incorporation, State or Country Code |
DE
|
| Entity Address, Address Line One |
309 Pierce Street
|
| Entity Address, City or Town |
Somerset
|
| Entity Address, State or Province |
NJ
|
| Entity Address, Postal Zip Code |
08873
|
| City Area Code |
908
|
| Local Phone Number |
518-0500
|
| Written Communications |
false
|
| Soliciting Material |
false
|
| Pre-commencement Tender Offer |
false
|
| Pre-commencement Issuer Tender Offer |
false
|
| Entity Emerging Growth Company |
true
|
| Elected Not To Use the Extended Transition Period |
false
|
| Common Stock [Member] |
|
| Title of 12(b) Security |
Class
A Common Stock, $0.0001 par value
|
| Trading Symbol |
CMPO
|
| Security Exchange Name |
NASDAQ
|
| Redeemable warrants, each whole warrant exercisable for one share of Class A Common Stock [Member] |
|
| Title of 12(b) Security |
Redeemable
warrants, each whole warrant exercisable for one share of Class A Common Stock
|
| Trading Symbol |
CMPOW
|
| Security Exchange Name |
NASDAQ
|
| X |
- DefinitionBoolean flag that is true when the XBRL content amends previously-filed or accepted submission.
| Name: |
dei_AmendmentFlag |
| Namespace Prefix: |
dei_ |
| Data Type: |
xbrli:booleanItemType |
| Balance Type: |
na |
| Period Type: |
duration |
|
| X |
- DefinitionFor the EDGAR submission types of Form 8-K: the date of the report, the date of the earliest event reported; for the EDGAR submission types of Form N-1A: the filing date; for all other submission types: the end of the reporting or transition period. The format of the date is YYYY-MM-DD.
| Name: |
dei_DocumentPeriodEndDate |
| Namespace Prefix: |
dei_ |
| Data Type: |
xbrli:dateItemType |
| Balance Type: |
na |
| Period Type: |
duration |
|
| X |
- DefinitionThe type of document being provided (such as 10-K, 10-Q, 485BPOS, etc). The document type is limited to the same value as the supporting SEC submission type, or the word 'Other'.
| Name: |
dei_DocumentType |
| Namespace Prefix: |
dei_ |
| Data Type: |
dei:submissionTypeItemType |
| Balance Type: |
na |
| Period Type: |
duration |
|
| X |
- DefinitionAddress Line 1 such as Attn, Building Name, Street Name
| Name: |
dei_EntityAddressAddressLine1 |
| Namespace Prefix: |
dei_ |
| Data Type: |
xbrli:normalizedStringItemType |
| Balance Type: |
na |
| Period Type: |
duration |
|
| X |
- Definition
+ References
+ Details
| Name: |
dei_EntityAddressCityOrTown |
| Namespace Prefix: |
dei_ |
| Data Type: |
xbrli:normalizedStringItemType |
| Balance Type: |
na |
| Period Type: |
duration |
|
| X |
- DefinitionCode for the postal or zip code
| Name: |
dei_EntityAddressPostalZipCode |
| Namespace Prefix: |
dei_ |
| Data Type: |
xbrli:normalizedStringItemType |
| Balance Type: |
na |
| Period Type: |
duration |
|
| X |
- DefinitionName of the state or province.
| Name: |
dei_EntityAddressStateOrProvince |
| Namespace Prefix: |
dei_ |
| Data Type: |
dei:stateOrProvinceItemType |
| Balance Type: |
na |
| Period Type: |
duration |
|
| X |
- DefinitionA unique 10-digit SEC-issued value to identify entities that have filed disclosures with the SEC. It is commonly abbreviated as CIK. Reference 1: http://www.xbrl.org/2003/role/presentationRef
-Publisher SEC
-Name Exchange Act
-Number 240
-Section 12
-Subsection b-2
| Name: |
dei_EntityCentralIndexKey |
| Namespace Prefix: |
dei_ |
| Data Type: |
dei:centralIndexKeyItemType |
| Balance Type: |
na |
| Period Type: |
duration |
|
| X |
- DefinitionIndicate if registrant meets the emerging growth company criteria. Reference 1: http://www.xbrl.org/2003/role/presentationRef
-Publisher SEC
-Name Exchange Act
-Number 240
-Section 12
-Subsection b-2
| Name: |
dei_EntityEmergingGrowthCompany |
| Namespace Prefix: |
dei_ |
| Data Type: |
xbrli:booleanItemType |
| Balance Type: |
na |
| Period Type: |
duration |
|
| X |
- DefinitionCommission file number. The field allows up to 17 characters. The prefix may contain 1-3 digits, the sequence number may contain 1-8 digits, the optional suffix may contain 1-4 characters, and the fields are separated with a hyphen.
| Name: |
dei_EntityFileNumber |
| Namespace Prefix: |
dei_ |
| Data Type: |
dei:fileNumberItemType |
| Balance Type: |
na |
| Period Type: |
duration |
|
| X |
- DefinitionTwo-character EDGAR code representing the state or country of incorporation.
| Name: |
dei_EntityIncorporationStateCountryCode |
| Namespace Prefix: |
dei_ |
| Data Type: |
dei:edgarStateCountryItemType |
| Balance Type: |
na |
| Period Type: |
duration |
|
| X |
- DefinitionThe exact name of the entity filing the report as specified in its charter, which is required by forms filed with the SEC. Reference 1: http://www.xbrl.org/2003/role/presentationRef
-Publisher SEC
-Name Exchange Act
-Number 240
-Section 12
-Subsection b-2
| Name: |
dei_EntityRegistrantName |
| Namespace Prefix: |
dei_ |
| Data Type: |
xbrli:normalizedStringItemType |
| Balance Type: |
na |
| Period Type: |
duration |
|
| X |
- DefinitionThe Tax Identification Number (TIN), also known as an Employer Identification Number (EIN), is a unique 9-digit value assigned by the IRS. Reference 1: http://www.xbrl.org/2003/role/presentationRef
-Publisher SEC
-Name Exchange Act
-Number 240
-Section 12
-Subsection b-2
| Name: |
dei_EntityTaxIdentificationNumber |
| Namespace Prefix: |
dei_ |
| Data Type: |
dei:employerIdItemType |
| Balance Type: |
na |
| Period Type: |
duration |
|
| X |
- DefinitionLocal phone number for entity.
| Name: |
dei_LocalPhoneNumber |
| Namespace Prefix: |
dei_ |
| Data Type: |
xbrli:normalizedStringItemType |
| Balance Type: |
na |
| Period Type: |
duration |
|
| X |
- DefinitionBoolean flag that is true when the Form 8-K filing is intended to satisfy the filing obligation of the registrant as pre-commencement communications pursuant to Rule 13e-4(c) under the Exchange Act. Reference 1: http://www.xbrl.org/2003/role/presentationRef
-Publisher SEC
-Name Exchange Act
-Number 240
-Section 13e
-Subsection 4c
| Name: |
dei_PreCommencementIssuerTenderOffer |
| Namespace Prefix: |
dei_ |
| Data Type: |
xbrli:booleanItemType |
| Balance Type: |
na |
| Period Type: |
duration |
|
| X |
- DefinitionBoolean flag that is true when the Form 8-K filing is intended to satisfy the filing obligation of the registrant as pre-commencement communications pursuant to Rule 14d-2(b) under the Exchange Act. Reference 1: http://www.xbrl.org/2003/role/presentationRef
-Publisher SEC
-Name Exchange Act
-Number 240
-Section 14d
-Subsection 2b
| Name: |
dei_PreCommencementTenderOffer |
| Namespace Prefix: |
dei_ |
| Data Type: |
xbrli:booleanItemType |
| Balance Type: |
na |
| Period Type: |
duration |
|
| X |
- DefinitionTitle of a 12(b) registered security. Reference 1: http://www.xbrl.org/2003/role/presentationRef
-Publisher SEC
-Name Exchange Act
-Number 240
-Section 12
-Subsection b
| Name: |
dei_Security12bTitle |
| Namespace Prefix: |
dei_ |
| Data Type: |
dei:securityTitleItemType |
| Balance Type: |
na |
| Period Type: |
duration |
|
| X |
- DefinitionName of the Exchange on which a security is registered. Reference 1: http://www.xbrl.org/2003/role/presentationRef
-Publisher SEC
-Name Exchange Act
-Number 240
-Section 12
-Subsection d1-1
| Name: |
dei_SecurityExchangeName |
| Namespace Prefix: |
dei_ |
| Data Type: |
dei:edgarExchangeCodeItemType |
| Balance Type: |
na |
| Period Type: |
duration |
|
| X |
- DefinitionBoolean flag that is true when the Form 8-K filing is intended to satisfy the filing obligation of the registrant as soliciting material pursuant to Rule 14a-12 under the Exchange Act. Reference 1: http://www.xbrl.org/2003/role/presentationRef
-Publisher SEC
-Name Exchange Act
-Section 14a
-Number 240
-Subsection 12
| Name: |
dei_SolicitingMaterial |
| Namespace Prefix: |
dei_ |
| Data Type: |
xbrli:booleanItemType |
| Balance Type: |
na |
| Period Type: |
duration |
|
| X |
- DefinitionTrading symbol of an instrument as listed on an exchange.
| Name: |
dei_TradingSymbol |
| Namespace Prefix: |
dei_ |
| Data Type: |
dei:tradingSymbolItemType |
| Balance Type: |
na |
| Period Type: |
duration |
|
| X |
- DefinitionBoolean flag that is true when the Form 8-K filing is intended to satisfy the filing obligation of the registrant as written communications pursuant to Rule 425 under the Securities Act. Reference 1: http://www.xbrl.org/2003/role/presentationRef
-Publisher SEC
-Name Securities Act
-Number 230
-Section 425
| Name: |
dei_WrittenCommunications |
| Namespace Prefix: |
dei_ |
| Data Type: |
xbrli:booleanItemType |
| Balance Type: |
na |
| Period Type: |
duration |
|
| X |
- Details
| Name: |
us-gaap_StatementClassOfStockAxis=us-gaap_CommonStockMember |
| Namespace Prefix: |
|
| Data Type: |
na |
| Balance Type: |
|
| Period Type: |
|
|
| X |
- Details
| Name: |
us-gaap_StatementClassOfStockAxis=CMPO_RedeemableWarrantSeachWholeWarrantExercisableForOneShareOfClassACommonStockMember |
| Namespace Prefix: |
|
| Data Type: |
na |
| Balance Type: |
|
| Period Type: |
|
|
CompoSecure (NASDAQ:CMPO)
Graphique Historique de l'Action
De Mai 2024 à Juin 2024

CompoSecure (NASDAQ:CMPO)
Graphique Historique de l'Action
De Juin 2023 à Juin 2024
