false
0001823144
0001823144
2024-03-01
2024-03-01
0001823144
us-gaap:CommonStockMember
2024-03-01
2024-03-01
0001823144
CMPO:RedeemableWarrantSeachWholeWarrantExercisableForOneShareOfClassACommonStockMember
2024-03-01
2024-03-01
iso4217:USD
xbrli:shares
iso4217:USD
xbrli:shares
UNITED STATES
SECURITIES AND EXCHANGE
COMMISSION
WASHINGTON, D.C. 20549
FORM 8-K
CURRENT REPORT
Pursuant to Section 13
or 15(d)
of the Securities Exchange
Act of 1934
Date of Report
(Date of earliest event reported): March 1, 2024
CompoSecure, Inc.
(Exact Name of Registrant
as Specified in its Charter)
| Delaware |
|
001-39687 |
|
85-2749902 |
(State or Other Juris-
diction of Incorporation) |
|
(Commission
File Number) |
|
(IRS Employer
Identification No.) |
|
309 Pierce Street
Somerset, New Jersey |
|
08873 |
| (Address of Principal Executive Offices) |
|
(Zip Code) |
Registrant’s telephone number, including
area code: (908) 518-0500
Not Applicable
(Former Name or Former
Address, if Changed Since Last Report)
Check the appropriate box below if the Form 8-K filing is intended
to simultaneously satisfy the filing obligation of the registrant under any of the following provisions (see General Instruction
A.2. below):
| ¨ |
Written communications pursuant to Rule 425 under the Securities Act (17 CFR 230.425) |
| ¨ |
Soliciting material pursuant to Rule 14a-12 under the Exchange Act (17 CFR 240.14a-12) |
| ¨ |
Pre-commencement communications pursuant to Rule 14d-2(b) under the Exchange Act (17 CFR 240.14d-2(b)) |
| ¨ |
Pre-commencement communications pursuant to Rule 13e-4(c) under the Exchange Act (17 CFR 240.13e-4(c)) |
Securities registered pursuant to Section 12(b) of the Act:
| Title
of each class |
|
Trading
Symbol(s) |
|
Name
of each exchange on which registered |
| Class
A Common Stock, $0.0001 par value |
|
CMPO |
|
Nasdaq Global Market |
| |
|
|
|
|
| Redeemable
warrants, each whole warrant exercisable for one share of Class A Common Stock |
|
CMPOW |
|
Nasdaq Global Market |
Indicate by check mark whether the registrant is an emerging growth
company as defined in Rule 405 of the Securities Act of 1933 (§ 230.405 of this chapter) or Rule 12b-2 of the Securities
Exchange Act of 1934 (§ 240.12b-2 of this chapter).
Emerging growth company x
If an emerging growth company, indicate by check mark if the registrant
has elected not to use the extended transition period for complying with any new or revised financial accounting standards provided pursuant
to Section 13(a) of the Exchange Act.
| Item 1.01 |
Entry into a Material Definitive Agreement |
On
March 1, 2024, CompoSecure Holdings, L.L.C. (“Holdings”), CompoSecure, L.L.C. (“CompoSecure”), Arculus Holdings,
L.L.C. (“Arculus” and collectively with Holdings and CompoSecure, the “Companies”), JPMorgan Chase Bank, National
Association, as administrative agent (“JPMC”), and the lenders party thereto, entered into Amendment No. 2 to Third Amended
and Restated Credit Agreement (the “Second Amendment”). The Second Amendment amended the Third Amended and Restated Credit
Agreement, dated as of December 21, 2021, as amended by Amendment No. 1 to Third Amended and Restated Credit Agreement, dated
as of February 28, 2023 (as amended, the “Amended Credit Agreement”).
Subject
to certain conditions, the Second Amendment allows CompoSecure, Inc. (the “Company”) (or its applicable subsidiary)
to repurchase outstanding shares of common stock, outstanding warrants to purchase shares of common stock and/or outstanding
convertible notes in an aggregate amount not to exceed $40,000,000 at any time.
The foregoing is a summary
of the material terms and conditions of the Second Amendment and not a complete discussion of the document. Accordingly, the foregoing
is qualified in its entirety by reference to the full text of the Second Amendment, which will be filed as an exhibit to the Company’s
Quarterly Report on Form 10-Q for the fiscal quarter ending March 31, 2024.
| Item
2.02 |
Results of Operation and Financial Condition |
On
March 6, 2024, the Company issued a press release announcing its financial results for the full year 2023 and the three months ended
December 31, 2023, and provided an investor presentation to accompany the press release. The press release and business presentation
provide business updates, including the approval of a repurchase program for up to $40 million of the Company’s outstanding shares
of common stock, warrants and/or notes exchangeable for shares of common stock (the “Repurchase Program”). The Repurchase
Program will be effective March 7, 2024 through March 7, 2027. Copies of the press release and the investor presentation are
furnished herewith as Exhibits 99.1 and 99.2, respectively.*
| Item
7.01 |
Regulation FD Disclosure |
The information included
under Item 2.02 of this Current Report on Form 8-K is incorporated into this Item 7.01 by reference.*
(d) Exhibits
* The information in Items 2.02 and 7.01 of this Form 8-K shall not be deemed “filed” for purposes of Section 18
of the Securities Exchange Act of 1934, as amended (the “Exchange Act”) or otherwise subject to the liabilities of that section,
nor shall it be deemed incorporated by reference in any filing under the Securities Act of 1933, as amended, or the Exchange Act, except
as expressly set forth by specific reference in such a filing.
SIGNATURE
Pursuant to the requirements of the Securities
Exchange Act of 1934, the registrant has duly caused this report to be signed on its behalf by the undersigned hereunto duly authorized.
| |
COMPOSECURE, INC. |
| |
|
| Date: March 6, 2024 |
By: |
/s/Timothy Fitzsimmons |
| |
|
Timothy Fitzsimmons |
| |
|
Chief Financial Officer |
Exhibit 99.1

CompoSecure Reports
Fourth Quarter and Full Year 2023 Financial Results
Q4 Net Sales up 7% to $100 Million; Q4 Net
Income up 39% to $31 Million; Q4 Adj. EBITDA up 22% to $37 Million
Issues 2024 Guidance of Net Sales Between $408-$428
Million; Adj. EBITDA Between $147-$157 Million
Announces up to $40 Million Securities Repurchase
Program to Capitalize on Strong Financial Position
SOMERSET,
N.J., March 6, 2024 – CompoSecure, Inc. (Nasdaq: CMPO), a leader in metal payment cards, security,
and authentication solutions, today announced its financial and operating results for the fourth quarter and full year ended December 31,
2023.
“Our fourth quarter provided a strong
close to 2023, capping off another year of record revenue and profitability. In addition, profitability was in-line with our original
guidance issued in March 2023,” said Jon Wilk, President and CEO of CompoSecure. “Sustained U.S. customer demand continued
to drive our domestic net sales, which highlighted a record quarter and was up 9% for the year."
“We have a long history of delivering
profitable growth while maintaining our leadership position in the global metal payment card market, which we do not believe is fully
reflected in the valuation of our securities. I am excited to announce that the CompoSecure board of directors has approved a repurchase
program for up to $40 million of the Company’s outstanding shares of common stock, warrants and/or convertible notes over the next
three years to provide us with a new mechanism to unlock shareholder value.”
Mr. Wilk added: “Looking ahead,
we expect to maintain a strategic approach to capital allocation that continues to focus on driving organic growth and paying down debt
but now also includes additional flexibility to repurchase securities or other opportunities to deliver shareholder value. We
believe CompoSecure is well-positioned for another record year as we execute on our growth and profitability objectives.”
Q4 2023 Financial Highlights (vs. Q4 2022)
| • | Net
Sales: Net Sales increased 7% to $99.9 million compared to $93.8 million. The increase
was driven by continued domestic growth in CompoSecure’s metal payment card business,
partially offset by select clients more tightly managing inventory, and lower international
sales which is a more variable market due to global economic uncertainty. |
| • | Gross
Profit: Gross Profit increased to $52.9 million or 52.9% of Net Sales, compared to $50.3
million or 53.6%. |
| • | Net
Income/EPS: Net Income increased 39% to $31.0 million compared to $22.4 million. The
increase was primarily driven by prudent operating expense controls, as reflected by a reduction
in selling, general and administrative expenses, as well as changes to the fair value of
warrant liabilities, earnout consideration liability and derivative liability. Net Income
per share attributable to class A common shareholders was $0.17 (Basic) and (Diluted), compared
to $0.14 (Basic) and (Diluted) in the year-ago period. |
| • | Adjusted
Net Income/Adjusted EPS: Adjusted Net Income (a non-GAAP measure) increased 30% to $23.1
million compared to $17.7 million in the year-ago period. Adjusted EPS (a non-GAAP measure),
which includes both class A and class B shares, was $0.29 (Basic) and $0.26 (Diluted) compared
to $0.23 (Basic) and $0.20 (Diluted) in the year-ago period (see reconciliation of non-GAAP
measures shown in table below). |
| • | Adjusted
EBITDA: Adjusted EBITDA (a non-GAAP measure) increased 22% to $37.2 million compared
to $30.6 million, with the increase driven by net sales growth and operating expense reductions. |
FY 2023 Financial Highlights (vs. FY 2022)
| • | Net
Sales: Net Sales increased 3% to $390.6 million compared to $378.5 million. The increase
was primarily driven by continued domestic growth in CompoSecure’s metal payment card
business, which was up 9%. This was offset by lower international sales. |
| • | Gross
Profit: Gross Profit was $209.1 million or 53.5% of Net Sales, compared to $219.6 million
or 58.0%. The decrease was primarily due to lower production efficiencies from new and innovative
card constructions, as well as the impact of inflationary pressure on wages and materials. |
| • | Net
Income/EPS: Net Income was $112.5 million compared to $131.8 million. The decrease was
due to lower gross profit, changes to the fair value of warrant liabilities, earnout consideration
liability and derivative liability, offset by a decrease in operating expenses. Net Income
per share attributable to class A common stockholders was $1.03 (Basic) and $0.96 (Diluted),
compared to $1.21 (Basic) and $1.13 (Diluted) in the year-ago period. |
| • | Adjusted
Net Income/Adjusted EPS: Adjusted Net Income (a non-GAAP measure) was $88.0 million compared
to $83.0 million in the year-ago period. Adjusted EPS (a non-GAAP measure), which includes
both class A and class B shares, was $1.12 (Basic) and $0.97 (Diluted) compared to $1.10
(Basic) and $0.94 (Diluted) in the year-ago period (see reconciliation of non-GAAP measures
shown in table below). |
| • | Adjusted
EBITDA: Adjusted EBITDA (a non-GAAP measure) increased 6% to $145.0 million compared
to $136.2 million. |
Liquidity and Capital Structure
| • | Balance
Sheet: At December 31, 2023, CompoSecure had $41.2 million of cash and cash equivalents
and $340.3 million of total debt, which included $210.3 million of term loan, and $130.0
million of exchangeable notes. This compares to cash and cash equivalents of $13.6 million
and total debt of $363.1 million at December 31, 2022. CompoSecure’s secured debt
leverage ratio has decreased to 1.39x at December 31, 2023 compared to 1.62x at December 31,
2022 and 2.8x at December 31, 2021. |
| • | Shares
Outstanding: At December 31, 2023, CompoSecure had 79.4 million shares outstanding
which included 19.4 million class A shares and 60.0 million class B shares (for more information
on shares outstanding, both Basic and Diluted, please refer to CompoSecure’s 10-K and
the accompanying earnings presentation). |
Full Year Operational Highlights
| • | Extended
long-term agreements with CompoSecure’s two largest customers: JP Morgan Chase and
American Express |
| • | Produced
over 31 million metal payment cards that helped support more than 150 new and ongoing card
programs |
| • | Ranked
the #1 metal payment card provider by ABI Research, a global technology market intelligence
firm |
| • | 2023
product and innovation highlights: |
| • | Echo
Mirror™ Card – a stainless-steel
payment card with a mirror-like finish |
| • | LED
Card – LED lights illuminate the card
when a contactless transaction is initiated |
| • | Lux
Glass™ Card – a transparent payment
card with a metal bezel |
| • | Arculus
Authenticate hardware passkeys received official designation as a Microsoft FIDO2 security
key vendor |
| • | Arculus
cross-chain DeFi capabilities via WalletConnect across major chains |
| • | Arculus
cold storage wallet cryptographic support for more than 10K coins across additional
chains |
2024 Financial Outlook
CompoSecure expects net sales for the full
year to range between $408-$428 million and expects adjusted EBITDA to range between $147-$157 million.
Securities Repurchase Program
CompoSecure has a long history of delivering profitable growth and
leading the global market for metal payment cards, which the Company does not believe is fully reflected in the valuation of its securities.
To provide a new mechanism to unlock investor value, an independent committee of CompoSecure’s board of directors has approved
a repurchase program for up to $40 million of the Company’s outstanding shares of common stock, warrants and/or notes exchangeable
for shares of common stock. The repurchase program is effective March 7, 2024 through March 7, 2027.
Repurchases under this program may be made
from time to time in the open market, through privately negotiated transactions, tender offers, or otherwise, and will be made as permitted
by the terms and conditions of the Company’s senior credit facility and indenture for its exchangeable notes, as applicable. Repurchases
of common stock will be conducted in accordance with Rule 10b-18 of the Exchange Act. To facilitate equity repurchases, the Company
expects to enter into a Rule 10b5-1 repurchase plan with a third-party broker to allow the Company to repurchase equity at times
when it otherwise might be prevented from doing so under insider trading laws or because of trading blackout periods imposed under the
Company’s Insider Trading Policy. Any exchangeable note or warrant repurchases will be conducted in accordance with applicable
insider trading laws and the Company’s Insider Trading Policy.
Any shares of common stock repurchased under
the program may either be returned to the status of authorized but unissued shares of common stock or held as treasury stock of the Company.
Subject to applicable law, the Company may elect to amend or cancel the repurchase program or amend the terms thereof.
The Company also entered into an amendment to the Company’s
senior credit facility which enables the Company to implement the repurchase program in compliance with the senior credit facility.
Conference Call
CompoSecure will host a conference call and
live audio webcast today at 5:00 p.m. Eastern time to discuss its financial and operational results, followed by a question-and-answer
period.
Date: Wednesday, March 6, 2024
Time: 5:00 p.m. Eastern time
Dial-in
registration link: here
Live
webcast registration link: here
If you have any difficulty registering or
connecting with the conference call, please contact Elevate IR at (720) 330-2829.
A
live webcast and replay of the conference call will be available on the investor relations section of CompoSecure’s website at
https://ir.composecure.com/news-events/events.
About CompoSecure
Founded
in 2000, CompoSecure (Nasdaq: CMPO) is a technology partner to market leaders, fintechs and consumers enabling trust for millions of
people around the globe. The company combines elegance, simplicity and security to deliver exceptional experiences and peace of mind
in the physical and digital world. CompoSecure’s innovative payment card technology and metal cards with Arculus security and authentication
capabilities deliver unique, premium branded experiences, enable people to access and use their financial and digital assets, and ensure
trust at the point of a transaction. For more information, please visit www.CompoSecure.com and www.GetArculus.com.
Forward-Looking Statements
This
press release contains forward-looking statements as defined by the Private Securities Litigation Reform Act of 1995. These statements
are based on the beliefs and assumptions of management. Although CompoSecure believes that its plans, intentions, and expectations reflected
in or suggested by these forward-looking statements are reasonable, CompoSecure cannot assure you that it will achieve or realize these
plans, intentions, or expectations. Forward-looking statements are inherently subject to risks, uncertainties, and assumptions. Generally,
statements that are not historical facts, including statements concerning CompoSecure’s possible or assumed future actions, business
strategies, events, or results of operations, are forward-looking statements. In some instances, these statements may be preceded by,
followed by or include the words “believes,” “estimates,” “expects,” “projects,” “forecasts,”
“may,” “will,” “should,” “seeks,” “plans,” “scheduled,” “anticipates”
or “intends” or the negatives of these terms or variations of them or similar terminology. Forward-looking statements are
not guarantees of performance. You should not put undue reliance on these statements which speak only as of the date hereof. You should
understand that the following important factors, among others, could affect CompoSecure’s future results and could cause those
results or other outcomes to differ materially from those expressed or implied in CompoSecure’s forward-looking statements: the
ability of CompoSecure to implement the repurchase program as contemplated
consistent with CompoSecure’s strategic initiatives described above and the impact of the repurchase program on CompoSecure;
the ability of CompoSecure to grow and manage growth profitably, maintain relationships with customers, compete within its industry and
retain its key employees; the possibility that CompoSecure may be adversely impacted by other global economic, business, competitive
and/or other factors; the outcome of any legal proceedings that may be instituted against CompoSecure or others; future exchange and
interest rates; and other risks and uncertainties, including those under “Risk Factors” in filings that have been
made or will be made with the Securities and Exchange Commission. CompoSecure undertakes no obligations to update or revise publicly
any forward-looking statements, whether as a result of new information, future events or otherwise, except as required by law.
Use of Non-GAAP Financial Measures
This press release includes certain non-GAAP
financial measures that are not prepared in accordance with accounting principles generally accepted in the United States (“GAAP”)
and that may be different from non-GAAP financial measures used by other companies. CompoSecure believes EBITDA, Adjusted EBITDA,
Adjusted Net Income, Adjusted EPS, and Free Cash Flow are useful to investors in evaluating CompoSecure’s financial performance.
CompoSecure uses these measures internally to establish forecasts, budgets and operational goals to manage and monitor its business,
as well as evaluate its underlying historical performance and/or to measure incentive compensation, as we believe that these non-GAAP
financial measures depict the true performance of the business by encompassing only relevant and controllable events, enabling CompoSecure to
evaluate and plan more effectively for the future. Due to the forward-looking nature of the financial guidance included above, specific
quantification of the charges excluded from the non-GAAP financial measures included in such financial guidance, including with respect
to depreciation, amortization, interest, and taxes, that would be required to reconcile the non GAAP financial measures included in such
financial guidance to GAAP measures are not available, so it is not feasible to provide accurate forecasted non-GAAP reconciliations
without unreasonable effort. Consequently, no disclosure of estimated comparable GAAP measures is included, and no reconciliation of
the forward looking non-GAAP financial measures is included. In addition, CompoSecure’s debt agreements contain covenants
that use a variation of these measures for purposes of determining debt covenant compliance. CompoSecurebelieves that investors
should have access to the same set of tools that its management uses in analyzing operating results. EBITDA, Adjusted EBITDA, Adjusted
Net Income, Adjusted EPS, and Free Cash Flow should not be considered as measures of financial performance under U.S. GAAP, and
the items excluded from EBITDA, Adjusted EBITDA, Adjusted Net Income, Adjusted EPS, and Free Cash Flow are significant components
in understanding and assessing CompoSecure’s financial performance. Accordingly, these key business metrics have limitations
as an analytical tool. They should not be considered as an alternative to net income or any other performance measures derived in accordance
with U.S. GAAP or as an alternative to cash flows from operating activities as a measure of CompoSecure’s liquidity and may
be different from similarly titled non-GAAP measures used by other companies. Please refer to the tables below for the reconciliation
of GAAP measures to these non-GAAP measures for the year ended December 31, 2023.
Corporate Contact
Anthony Piniella
Head of Communications, CompoSecure
(917) 208-7724
apiniella@composecure.com
Investor Relations Contact
Sean Mansouri, CFA
Elevate IR
(720) 330-2829
CMPO@elevate-ir.com
CompoSecure,
Inc.
Condensed
Consolidated Balance Sheet Data
(in
thousands)
| | |
December
31, 2023 | | |
December
31, 2022 | |
| | |
(unaudited) | | |
| |
| ASSETS | |
| | | |
| | |
| Cash and cash equivalents | |
$ | 41,216 | | |
$ | 13,642 | |
| Accounts Receivable, net | |
| 40,488 | | |
| 37,272 | |
| Inventories | |
| 52,540 | | |
| 42,374 | |
| Prepaid expenses and other current assets | |
| 5,133 | | |
| 3,824 | |
| Property and equipment, net | |
| 25,212 | | |
| 22,655 | |
| Right of use assets operating, net | |
| 7,473 | | |
| 8,932 | |
| Deferred tax asset | |
| 23,697 | | |
| 25,569 | |
| Derivative asset - interest rate swap | |
| 5,258 | | |
| 8,651 | |
| Deposits and other assets | |
| 24 | | |
| 24 | |
| TOTAL ASSETS | |
$ | 201,041 | | |
$ | 162,943 | |
| | |
| | | |
| | |
| LIABILITIES AND STOCKHOLDERS' EQUITY | |
| | | |
| | |
| Current portion of long-term debt | |
$ | 10,313 | | |
$ | 14,372 | |
| Current portion of lease liabilities | |
| 1,948 | | |
| 1,846 | |
| Current portion of tax receivable agreement liability | |
| 1,425 | | |
| 2,367 | |
| Accounts payable | |
| 5,193 | | |
| 7,127 | |
| Accrued expenses | |
| 11,987 | | |
| 10,154 | |
| Commission payable | |
| 4,429 | | |
| 3,317 | |
| Bonus payable | |
| 5,616 | | |
| 8,177 | |
| Long-term debt, net of deferred finance costs | |
| 198,331 | | |
| 216,276 | |
| Convertible notes, net of debt discount | |
| 127,832 | | |
| 127,348 | |
| Derivative liability - convertible notes | |
| 425 | | |
| 285 | |
| Warrant liability | |
| 8,294 | | |
| 16,341 | |
| Earnout consideration liability | |
| 852 | | |
| 15,090 | |
| Lease liabilities, operating | |
| 6,220 | | |
| 7,766 | |
| Tax receivable agreement liability | |
| 23,949 | | |
| 24,475 | |
| Total stockholders' (deficit) | |
| (205,773 | ) | |
| (291,998 | ) |
| TOTAL LIABILITIES AND STOCKHOLDERS'
EQUITY | |
$ | 201,041 | | |
$ | 162,943 | |
CompoSecure,
Inc.
Consolidated
Statements of Operations
(in
thousands, except per share amounts)
(unaudited)
| | |
Three Months
Ended December 31, | | |
Twelve
Months Ended December 31, | |
| | |
2023 | | |
2022 | | |
2023 | | |
2022 | |
| Net sales | |
$ | 99,900 | | |
$ | 93,790 | | |
$ | 390,629 | | |
$ | 378,476 | |
| | |
| | | |
| | | |
| | | |
| | |
| Operating expenses: | |
| | | |
| | | |
| | | |
| | |
| Cost of sales | |
| 47,005 | | |
| 43,514 | | |
| 181,547 | | |
| 158,832 | |
| Selling, General
and administrative | |
| 22,368 | | |
| 25,425 | | |
| 89,995 | | |
| 104,749 | |
| Total operating
expenses | |
| 69,373 | | |
| 68,939 | | |
| 271,542 | | |
| 263,581 | |
| | |
| | | |
| | | |
| | | |
| | |
| Income from operations | |
| 30,527 | | |
| 24,851 | | |
| 119,087 | | |
| 114,895 | |
| | |
| | | |
| | | |
| | | |
| | |
| Total other income (expense), net | |
| 4,399 | | |
| (1,872 | ) | |
| (2,011 | ) | |
| 21,280 | |
| Income before income taxes | |
| 34,926 | | |
| 22,979 | | |
| 117,076 | | |
| 136,175 | |
| Income tax (expense) benefit | |
| (3,901 | ) | |
| (622 | ) | |
| (4,556 | ) | |
| (4,360 | ) |
| Net income | |
| 31,025 | | |
| 22,357 | | |
| 112,520 | | |
| 131,815 | |
| | |
| | | |
| | | |
| | | |
| | |
| Net income attributable to non-controlling
interests | |
| 27,730 | | |
| 20,113 | | |
| 93,281 | | |
| 113,158 | |
| Net income attributable to CompoSecure,
Inc | |
$ | 3,295 | | |
$ | 2,244 | | |
$ | 19,239 | | |
$ | 18,657 | |
| | |
| | | |
| | | |
| | | |
| | |
| Net income per share attributable to Class A common stockholders
-basic | |
$ | 0.17 | | |
$ | 0.14 | | |
$ | 1.03 | | |
$ | 1.21 | |
| Net income per share attributable to Class A common stockholders
- diluted | |
$ | 0.17 | | |
$ | 0.14 | | |
$ | 0.96 | | |
$ | 1.13 | |
| | |
| | | |
| | | |
| | | |
| | |
| Weighted average shared used to compute net income per share
attributable to Class A common stockholders - basic (in thousands) | |
| 19,375 | | |
| 16,059 | | |
| 18,661 | | |
| 15,372 | |
| Weighted average shared used to compute net income per share
attributable to Class A common stockholders - diluted (in thousands) | |
| 19,375 | | |
| 16,059 | | |
| 35,312 | | |
| 32,555 | |
CompoSecure, Inc.
Consolidated Statements
of Cash Flows
(in thousands)
(unaudited)
| | |
Twelve
Months Ended December 31, | |
| | |
2023 | | |
2022 | |
| CASH FLOWS FROM OPERATING ACTIVITES: | |
| | | |
| | |
| Net income | |
$ | 112,520 | | |
$ | 131,815 | |
| Adjustments to reconcile net income to net cash provided
by operating activities | |
| | | |
| | |
| Depreciation | |
| 8,387 | | |
| 8,575 | |
| Stock-based compensation expense | |
| 17,562 | | |
| 11,465 | |
| Inventory reserve | |
| (1,182 | ) | |
| 1,668 | |
| Amortization of deferred finance
costs | |
| 1,546 | | |
| 2,345 | |
| Change in fair value of earnout
consideration liability | |
| (14,237 | ) | |
| (23,337 | ) |
| Revaluation of warrant liability | |
| (8,047 | ) | |
| (18,930 | ) |
| Change in fair value of derivative
liability | |
| 139 | | |
| (266 | ) |
| Deferred tax (benefit) expense | |
| 2,667 | | |
| 3,193 | |
| Changes in assets and liabilities | |
| | | |
| | |
| Accounts receivable | |
| (3,216 | ) | |
| (9,347 | ) |
| Inventories | |
| (8,984 | ) | |
| (18,237 | ) |
| Prepaid expenses and other assets | |
| (1,309 | ) | |
| (1,228 | ) |
| Accounts payable | |
| (1,934 | ) | |
| 68 | |
| Deposits and other assets | |
| - | | |
| (14 | ) |
| Accrued expenses | |
| 1,833 | | |
| 23 | |
| Other liabilities | |
| (1,433 | ) | |
| 4,990 | |
| Net cash provided by operating
activities | |
| 104,312 | | |
| 92,783 | |
| CASH FLOWS FROM INVESTING ACTIVITIES: | |
| | | |
| | |
| Acquisition
of property and equipment | |
| (10,944 | ) | |
| (9,053 | ) |
| Net cash used in investing activities | |
| (10,944 | ) | |
| (9,053 | ) |
| CASH FLOWS FROM FINANCING ACTIVITIES: | |
| | | |
| | |
| Proceeds from employee stock purchase
plan and exercise of equity awards | |
| 1,196 | | |
| 82 | |
| Payments for taxes related to net
share settlement of equity awards | |
| (3,126 | ) | |
| - | |
| Payment of line of credit | |
| - | | |
| (15,000 | ) |
| Payment of Tax receivable agreement
liability | |
| (2,436 | ) | |
| (110 | ) |
| Deferred finance costs related
to debt modification | |
| (256 | ) | |
| - | |
| Payment of term loan | |
| (22,810 | ) | |
| (16,878 | ) |
| Distributions | |
| (38,362 | ) | |
| (36,293 | ) |
| Payment
of issuance cost related to business combination | |
| - | | |
| (23,833 | ) |
| Net cash used in financing activities | |
| (65,794 | ) | |
| (92,032 | ) |
| Net increase (decrease) in cash
and cash equivalents | |
| 27,574 | | |
| (8,302 | ) |
| Cash and cash
equivalents, beginning of period | |
| 13,642 | | |
| 21,944 | |
| Cash and cash equivalents, end
of period | |
$ | 41,216 | | |
$ | 13,642 | |
| | |
| | | |
| | |
| Supplementary disclosure of cash flow information | |
| | | |
| | |
| Cash paid for interest expense | |
| 27,247 | | |
| 21,379 | |
| Cash paid for income taxes | |
| 2,760 | | |
| 858 | |
| Supplemental disclosure of non-cash financing activity: | |
| | | |
| | |
| Derivative asset - interest rate
swap | |
| 5,258 | | |
| 8,651 | |
CompoSecure,
Inc.
Non-GAAP
Adjusted EBITDA Reconciliation
(in
thousands)
(unaudited)
| | |
Three Months
Ended December 31, | | |
Twelve
Months Ended December 31, | |
| | |
2023 | | |
2022 | | |
2023 | | |
2022 | |
| Net income | |
$ | 31,025 | | |
$ | 22,357 | | |
$ | 112,520 | | |
$ | 131,815 | |
| Add: | |
| | | |
| | | |
| | | |
| | |
| Depreciation | |
| 2,138 | | |
| 1,998 | | |
| 8,387 | | |
| 8,575 | |
| Interest expense, net (1) | |
| 5,800 | | |
| 6,182 | | |
| 24,156 | | |
| 22,544 | |
| Income tax expense (benefit) | |
| 3,901 | | |
| 622 | | |
| 4,556 | | |
| 4,360 | |
| EBITDA | |
$ | 42,864 | | |
$ | 31,159 | | |
$ | 149,619 | | |
$ | 167,294 | |
| Stock-based compensation | |
| 4,510 | | |
| 3,730 | | |
| 17,562 | | |
| 11,465 | |
| Mark to market adjustments (2) | |
| (10,198 | ) | |
| (4,310 | ) | |
| (22,145 | ) | |
| (42,533 | ) |
| Adjusted EBITDA | |
$ | 37,176 | | |
$ | 30,579 | | |
$ | 145,036 | | |
$ | 136,226 | |
| (1) | Includes amortization of deferred financing cost
for the three and twelve months ended December 31, 2023 and 2022, respectively. |
| (2) | Includes the changes in fair value of warrant liability, derivative
liabilities and earnout consideration liability for the three and twelve months ended December 30,
2023 and 2022, respectively |
CompoSecure, Inc.
Non-GAAP Adjusted EPS
Reconciliation
(in thousands)
(unaudited)
| | |
Three
Months Ended December 31, | | |
Twelve
Months Ended December 31, | |
| | |
2023 | | |
2022 | | |
2023 | | |
2022 | |
| | |
| | |
| | |
| | |
| |
| | |
(in
thousands) except per share amounts | |
| Basic
and Diluted: | |
| | | |
| | | |
| | | |
| | |
| Net
income | |
$ | 31,025 | | |
$ | 22,357 | | |
$ | 112,520 | | |
$ | 131,815 | |
| Add:
provision for income taxes | |
| 3,901 | | |
| 622 | | |
| 4,556 | | |
| 4,360 | |
| Income
before Income taxes | |
| 34,926 | | |
| 22,979 | | |
| 117,076 | | |
| 136,175 | |
| Income
tax expense (1) | |
| (6,399 | ) | |
| (4,784 | ) | |
| (24,403 | ) | |
| (22,423 | ) |
| Adjusted
net income before adjustments | |
| 28,527 | | |
| 18,195 | | |
| 92,673 | | |
| 113,752 | |
| (Less):
mark-to-market adjustments (2) | |
| (9,974 | ) | |
| (4,227 | ) | |
| (22,284 | ) | |
| (42,267 | ) |
| Add:
stock-based compensation | |
| 4,510 | | |
| 3,730 | | |
| 17,562 | | |
| 11,465 | |
| Adjusted
net income | |
$ | 23,063 | | |
$ | 17,698 | | |
$ | 87,951 | | |
$ | 82,950 | |
| Common
shares outstanding used in computing earnings per share, basic: | |
| | | |
| | | |
| | | |
| | |
| Class
A and Class B common shares (3) | |
| 79,334 | | |
| 76,384 | | |
| 78,619 | | |
| 75,697 | |
| Common
shares outstanding used in computing earnings per share, diluted: | |
| | | |
| | | |
| | | |
| | |
| Warrants
(Public and Private) (4) | |
| 8,094 | | |
| 8,094 | | |
| 8,094 | | |
| 8,094 | |
| Equity
awards | |
| 2,988 | | |
| 3,859 | | |
| 3,651 | | |
| 4,183 | |
| Total
Shares outstanding used in computing adjusted earnings per share - diluted | |
| 90,416 | | |
| 88,337 | | |
| 90,364 | | |
| 87,974 | |
| | |
| | | |
| | | |
| | | |
| | |
| Adjusted
net income per share- basic | |
$ | 0.29 | | |
$ | 0.23 | | |
$ | 1.12 | | |
$ | 1.10 | |
| Adjusted
net income per share- diluted | |
$ | 0.26 | | |
$ | 0.20 | | |
$ | 0.97 | | |
$ | 0.94 | |
| 1) | Calculated
using the Company's blended tax rate. |
| 2) | Includes
the changes in fair value of warrant liability and earnout consideration liability. |
| 3) | Assumes
both Class A shares and Class B shares participate in earnings and are outstanding at the
end of the period. |
| 4) | Assumes
treasury stock method, valuation at assumed fair market value of $18.00. |
| 5) | The
Company did not include the effect of Exchangeable Notes to its total shares outstanding
used in diluted adjusted net income per share. |
End
Exhibit 99.2

Q4 2023 Earnings Presentation March 6, 2024

Disclaimers 2 Forward Looking Statements This presentation contains forward - looking statements as defined by the Private Securities Litigation Reform Act of 1995. These statements are based on the beliefs and assumptions of management. Although the Company believes that its plans, intentions, and expectations reflected in or suggested by these forward - looking st atements are reasonable, the Company cannot assure you that it will achieve or realize these plans, intentions, or expectations. Forward - looking statements are inherently subject to risks, uncerta inties, and assumptions. Generally, statements that are not historical facts, including statements concerning the Company’s possible or assumed future actions, business strategies, events, or resu lts of operations, are forward - looking statements. In some instances, these statements may be preceded by, followed by or include the words “believes,” “estimates,” “expects,” “projects,” “foreca sts ,” “may,” “will,” “should,” “seeks,” “plans,” “scheduled,” “anticipates” or “intends” or the negatives of these terms or variations of them or similar terminology. Forward - looking statements are not guara ntees of performance. You should not put undue reliance on these statements which speak only as of the date hereof. You should understand that the following important factors, among others, cou ld affect the Company’s future results and could cause those results or other outcomes to differ materially from those expressed or implied in the Company’s forward - looking statements: the ability of the Company to grow and manage growth profitably, maintain relationships with customers, compete within its industry and retain its key employees; the possibility that the Company may be adversely impacted by global economic, business, competitive and/or other factors; the outcome of any legal proceedings that may be instituted against the Company or others; future exchange and in terest rates; and other risks and uncertainties indicated in this report, including those under “Risk Factors” in filings that have been made or will be made with the SEC . The Company undertakes no obligations to update or revise publicly any forward - looking statements, whether as a result of new information, future events or otherwise, except as required by law. Non - GAAP Financial Measures This presentation includes certain non - GAAP financial measures that are not prepared in accordance with accounting principles ge nerally accepted in the United States (“GAAP”) and that may be different from non - GAAP financial measures used by other companies. The Company believes EBITDA, Adjusted EBITDA, Adjusted Net I ncome, Adjusted EPS, and Free Cash Flow are useful to investors in evaluating the Company’s financial performance. The Company uses these measures internally to establish forecast s, budgets and operational goals to manage and monitor its business, as well as evaluate its underlying historical performance and/or to measure incentive compensation, as we believe that these non - GAAP financial measures depict the true performance of the business by encompassing only relevant and controllable events, enabling the Company to evaluate and plan more effectively for the fut ure . Due to the forward - looking nature of the financial guidance included below, specific quantification of the charges excluded from the non - GAAP financial measures included in such financial guidance, including with respect to depreciation, amortization, interest, and taxes, that would be required to reconcile the non GAAP financial measures included in such financial guidance to GAAP measur es are not available, so it is not feasible to provide accurate forecasted non - GAAP reconciliations without unreasonable effort. Consequently, no disclosure of estimated comparable GAAP measures is inclu ded, and no reconciliation of the forward - looking non - GAAP financial measures is included. In addition, the Company’s debt agreements contain covenants that use a variation of these me asu res for purposes of determining debt covenant compliance. The Company believes that investors should have access to the same set of tools that its management uses in analyzing operating r esu lts. EBITDA, Adjusted EBITDA, Adjusted Net Income, Adjusted EPS, and Free Cash Flow should not be considered as measures of financial performance under U.S. GAAP, and the items excluded from EB ITDA, Adjusted EBITDA, Adjusted Net Income, Adjusted EPS, and Free Cash Flow are significant components in understanding and assessing the Company’s financial performance. Accordingly, th ese key business metrics have limitations as an analytical tool. They should not be considered as an alternative to net income or any other performance measures derived in accordance with U.S. GA AP or as an alternative to cash flows from operating activities as a measure of the Company’s liquidity and may be different from similarly titled non - GAAP measures used by other companies. Please refer to the tables below for the reconciliation of net income to EBITDA, Adjusted EBITDA, Adjusted Net Income, Adjusted EPS, and Free Cash Flow. Industry and Market Information Statements in this presentation concerning our industry and the markets in which we operate, including our general expectatio ns and competitive position, business opportunity and market size, growth and share, are based on information from independent industry organizations and other third - party sources, data from our internal research and management estimates. Management estimates are derived from publicly available information and the information and data referred to above and are based on ass ump tions and calculations made by us based upon our interpretation of such information and data. The information and data referred to above are imprecise and may prove to be inaccurate because th e i nformation cannot always be verified with complete certainty due to the limitations on the availability and reliability of raw data, the voluntary nature of the data gathering process and other li mitations and uncertainties. As a result, please be aware that the data and statistical information in this presentation may differ from information provided by our competitors or from information foun d i n current or future studies conducted by market research institutes, consultancy firms or independent sources.

Summary Full y ear 2024 n et s ales is expected to be in the range of $ 408 mm to $ 428 mm a nd adjusted EBITDA of $147mm to $157mm Approved a repurchase program for up to $40 million of the Company’s outstanding shares of common stock, warrants and/or convertible notes over three years to provide us with a new mechanism to unlock shareholder value Card issuers reported growth in 2023 and have maintained a positive outlook for the year ahead, indicating continued investments in customer acquisition and retention due to sustained consumer demand Net Sales: Q4 ’23 vs. Q4 ‘22 increased 7% to $100mm compared to $94mm driven by strongest domestic quarter ever offset by international business softness due to global economic uncertainty; FY up 3% to $391mm vs. $378mm prior year and at high - end of updated guidance range of $386mm to $392mm 1 Adjusted EBITDA is a non - GAAP financial measure. For reconciliation of Adjusted EBITDA to the most directly comparable measure prepared in accordance with GAAP, please see the Appendix 3 Adjusted EBITDA 1 : Q4 ‘23 vs. Q4 ‘22 increased 22% to $37mm compared to $31mm in part due to operating expense controls offset by gross margin decrease; FY up 6% to $145mm compared to $136mm prior year and within original guidance of $145mm to $155mm In 2023 we supported more than 150 new and ongoing metal payment card programs for our customers (vs. 125 in 2022) while broadening Arculus hardware and software solutions to drive momentum in 2024

Key Highlights – New Metal Card Programs 4 Trade Republic – Europe Echo Mirror Banque Palatine – Europe BPCE Subsidiary Regions Bank – US Traditional Bank Kotak – Asia India Expansion BMW – US Automobile Card Fan Inc – US College Athlete Card Step – US Credit Building Card Neon Bank Club – US FinTech - Stock Market Rewards

Key Highlights – Customers Marketing New Programs 5

Recent Trends across Payment Cards 1 American Express & JP Morgan Chase Earnings Presentations 2 American Express Earnings Presentations CompoSecure’s Largest Customers Report Continued Purchase Volume Growth vs. Prior Year Year over Year Purchase Volume Growth 1 6 American Express Completed Another Successful Acquisition Year Behind Robust Investments YoY Card Growth 28 % YoY Marketing & Bus Dev Spend Growth 43% 31% 33% 13 % 27 % (5%) 11% 21% 13% New Card Acquisitions & Investment 2 (4%) (6%) (1%) (12%) - 32% - 6% 30% 4% 51% 12% 8% -40% -20% 0% 20% 40% 60% Q1 '20 Q2 '20 Q3 '20 Q4 '20 Q1 '21 Q2 '21 Q3 '21 Q4 '21 Q1 '22 Q2 '22 Q3 '22 Q4 '22 Q1 '23 Q2 '23 Q3 '23 Q4 '24 American Express JP Morgan Chase 2.9 2.6 2.5 1.0 1.4 1.7 2.1 2.4 2.6 2.7 3.0 3.2 3.3 3.0 3.4 3.0 2.9 2.9 - 0.5 1.0 1.5 2.0 2.5 3.0 3.5 4.0 Q3 '19 Q4 '19 Q1 '20 Q2 '20 Q3 '20 Q4 '20 Q1 '21 Q2 '21 Q3 '21 Q4 '21 Q1 '22 Q2 '22 Q3 '22 Q4 '22 Q1 '23 Q2 '23 Q3 '23 Q4 '24 $0.0 $0.5 $1.0 $1.5 $2.0 $2.5 $3.0 $3.5 $4.0 New Cards (MM) Marketing & Business Development Spend ($B) 5% (3%)

Card Issuer and Payment Network Sentiment 1 Q4 ‘23 Earnings Transcripts 2 PR Newswire – 2/19/24 “ as long as we have a line of sight into high credit quality premium cardmembers, we will continue to be out there aggressively acquiring cardmembers . And, you know, that range will be where we see that range today, between 2.9, 3.1. We don't really provide any guidance on that, but with the amount of money we're planning on spending , I think that's a -- it's a pretty fair assumption .” – Steve Squeri (Chairman & CEO) “However, we saw demand increase as we move through the quarter, and we continue to plan for increased marketing spend in 2024 . We're confident that with our sophisticated acquisition engine, we'll do so in an efficient way .” – Christophe Le Laillec (CFO) 1 7 "From Capital One's founding days, we set out to build a payments and banking company powered by modern technology. Our acquisition of Discover is a singular opportunity to bring together two very successful companies with complementary capabilities and franchises, and to build a payments network that can compete with the largest payments networks and payments companies …Through this combination, we're creating a company that is exceptionally well - positioned to create significant value for consumers, small businesses, merchants, and shareholders as technology continues to transform the payments and banking marketplace ." – Richard F airbank (Chairman & CEO) 2 “ Overall, we remain fairly positive about the growth outlook . Consumer spending continues to be supported by a strong labor market and wage growth. Our base case scenario for 2024 reflects healthy consumer spending and recent spending dynamics. ” – Sachin Mehra (CFO) 1 “Marketing is also a driver. We're seeing great opportunities, great demand and engagement in our Card products . And so, that shows up in marketing. And as you well know, our wealth strategy in CCB remains a big focus and priority.” – Jeremy Barnum (CFO) 1

Arculus Capabilities The Arculus premium metal card can combine functionality of both a credit/debit payment card and a secure authentication token or cold storage wallet 8 Arculus Authenticate Arculus Cold Storage Hardware - bound PassKey authenticator • Secure login on any iPhone, Android phone, or platform enabled with FIDO2 technology • New device authentication (on - boarding new phone) • Customer support authentication to call center • Step - up authentication for high - risk transactions • Secure account and prevent hackers from gaining access to banking or social media app • White - labeled or co - branded solution sold through businesses for usage by their customer base • Generate, store, and secure keys for digital assets such as Bitcoin, Ethereum, Cardano, Solano, and many more • White - labeled or co - branded solution sold through businesses for usage by their customer base • Direct to consumer Capability Use Cases Example Distribution Channels Crypto and NFT hardware cold storage wallet • Advanced three - factor authentication (biometric, PIN, and tapping card) • Securely store, send, and receive digital assets via user - friendly mobile application • Secure element with NFC connectivity (no battery or charging required)

Financial Services Business Leaders Perceptions and Expectations for Fraud Prevention & User Authentication 9 68% Plan to increase spending on fraud monitoring and detection 69% Agreed that enhanced authentication methods would save time and resources 62% Leaders have future plans for enhancing cybersecurity via hardware authentication (e.g. key card, fob, or USB drive) 80% Think that creating a better experience for customer transactions is a key competitive advantage in the industry Source: Forbes Insights – Security Should be Simple: Your Road Map for Preventing Fraud and Building Trust

Financial Overview

Q4 2023 Results $37.2mm Q4 ‘23 Q2 YTD ‘22 Net Sales $99.9mm 37.2% $31.0mm 52.9% $93.8mm $22.4mm 53.6% $30.6mm 32.6% 7% Record domestic quarter offset by lower international sales 39% (66 bps) 22% 461 bps Net Income Gross Margin Adjusted EBITDA 1 Adjusted EBITDA Margin 1 Q4 ‘22 % Change Commentary 1 Adjusted EBITDA and Adjusted EBITDA Margin are non - GAAP financial metrics. For a reconciliation of Adjusted EBITDA to the most - c omparable GAAP metric, please see the Appendix to this presentation The decrease was primarily due to lower production efficiencies from new card constructions and customer designs Includes $5.9mm positive benefit when comparing Q4 ‘23 vs. Q4 ‘22 from re - valuation of warrant, earnout consideration, & derivatives liability driven by change in stock price Excludes net change from re - valuation of earnout & warrants Q4 ‘23 includes ($2.4mm) net impact from Arculus investment 11
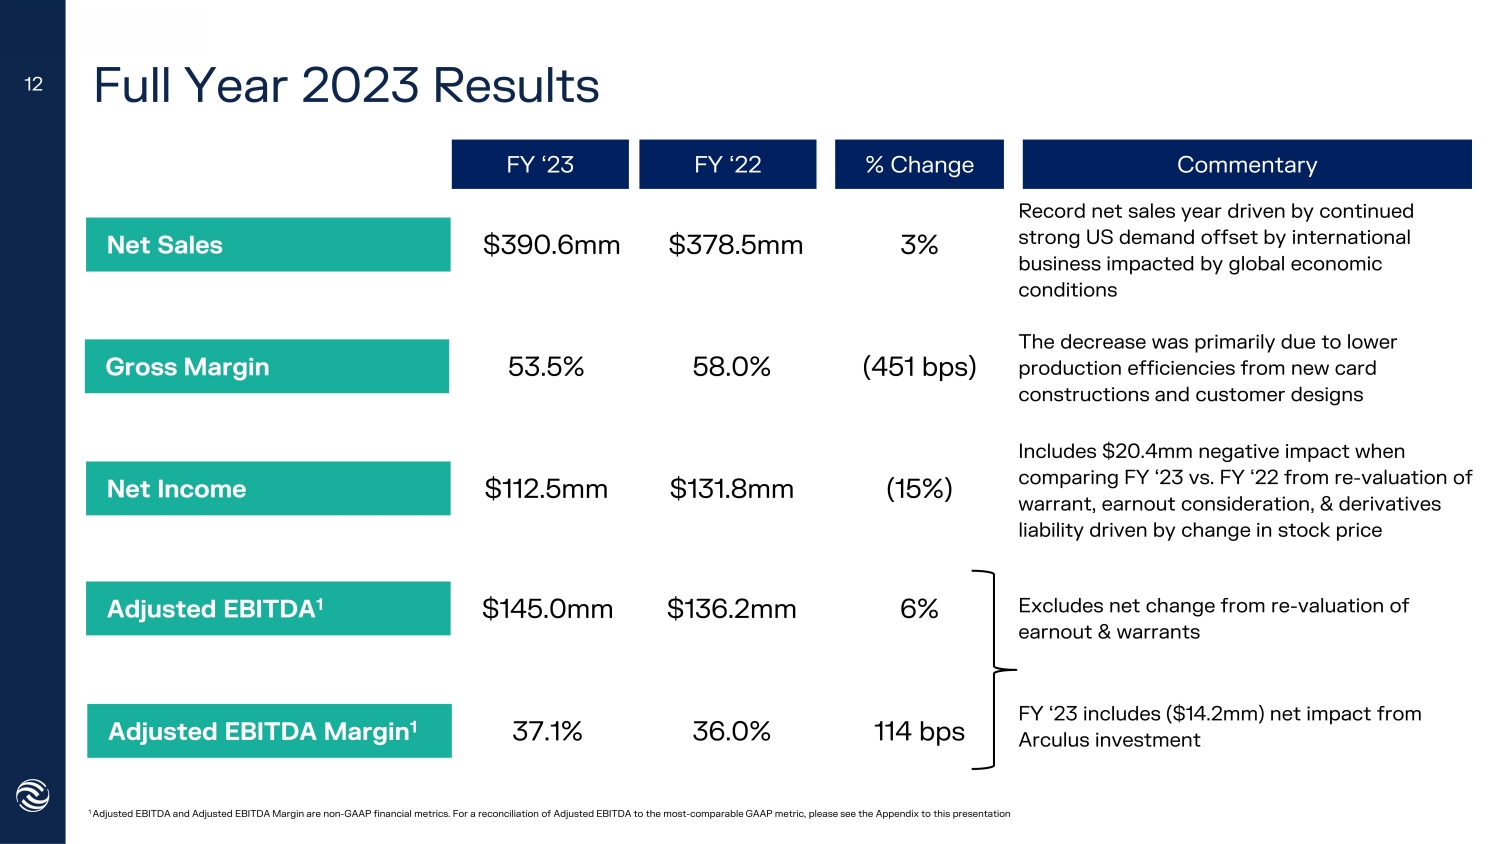
Full Year 2023 Results $145.0mm FY ‘23 Q2 YTD ‘22 Net Sales $390.6mm 37.1% $112.5mm 53.5% $378.5mm $131.8mm 58.0% $136.2mm 36.0% 3% Record net sales year driven by continued strong US demand offset by international business impacted by global economic conditions (15%) (451 bps) 6% 114 bps Net Income Gross Margin Adjusted EBITDA 1 Adjusted EBITDA Margin 1 FY ‘22 % Change Commentary Excludes net change from re - valuation of earnout & warrants FY ‘23 includes ($14.2mm) net impact from Arculus investment 12 The decrease was primarily due to lower production efficiencies from new card constructions and customer designs Includes $20.4mm negative impact when comparing FY ‘23 vs. FY ‘22 from re - valuation of warrant, earnout consideration, & derivatives liability driven by change in stock price 1 Adjusted EBITDA and Adjusted EBITDA Margin are non - GAAP financial metrics. For a reconciliation of Adjusted EBITDA to the most - c omparable GAAP metric, please see the Appendix to this presentation

$79 $74 $78 $84 $86 $15 $22 $21 $13 $14 $94 $95 $99 $97 $100 Q4 '22 Q1 '23 Q2 '23 Q3 '23 Q4 '23 International Domestic Net Sales Trend International mix for the full year was 18% of total net sales, in line with long range view of business of approximately 20% In millions International Domestic 13% 87% 21 % 79 % 14% 86% 16% 84% 13 23 % 77 % FY = $69mm (18% of Total) - 17% vs. Prior Year FY = $321mm (82% of Total) +9% vs. Prior Year

Balance Sheet (Unaudited) Source: Company financials Note: Financial position has been derived from CompoSecure’s consolidated financial statements for the quarters ended Decembe r 3 1, 2023 and December 31, 2022 respectively 14 Q4 2022A Q4 2023A ($mm) Assets Current Assets $14 $41 Cash & cash equivalents 37 40 Accounts receivable, net 42 53 Inventories 4 5 Prepaid expenses and other Current assets 97 139 Total Current Assets 23 25 Property and equipment, net 26 24 Deferred tax assets 17 13 Other assets $163 $201 Total assets Liabilities and Members' Equity Current Liabilities $7 $5 Accounts payable 10 12 Accrued expenses 16 14 Other current liabilities 14 10 Current portion of long - term debt 47 41 Total current liabilities 216 198 Long - term debt, net of deferred finance costs 0 0 Line of credit 128 128 Convertible Debt, net of debt discount 64 40 Other liabilities $455 $407 Total liabilities (292) (206) Members' Equity $163 $201 Total liabilities and members' equity » Cash position is up nearly 3x to $41mm at the end of 2023 » Continued investment in inventory to meet backlog demand » Paid down term loan debt balance from $233mm (as of Dec ’22) to $210mm (as of Dec ‘23) including $8mm non - scheduled voluntary payment

Statement of Cash Flows (Unaudited) Source: Company financials Note: Cash flows have been derived from CompoSecure’s consolidated financial statements for the twelve months ended December 31, 2023 and 2022 respectively 15 FY 2022A FY 2023A ($mm) Cash flows from operating activities $132 $113 Net income 9 8 Depreciation 11 18 Equity - based compensation expense 2 (1) Inventory reserve 2 2 Amortization of deferred finance costs (43) (22) Change in fair value of earnout, warrant and derivative (9) (3) Accounts receivable 0 (2) Accounts payable (18) (9) Inventories (1) (3) Prepaid expenses and other assets 3 3 Deferred tax expense (benefit) 5 (2) Other liabilities 0 2 Accrued expenses $93 $104 Net cash provided by operating activities Cash flows rom investing activities (9) (11) Acquisition of property and equipment ($9) ($11) Net cash used in investing activities Cash flows from financing activities 0 1 Proceeds from employee stock purchase plan and exercise of equity awards (15) 0 Payment of line of credit (0) (3) Payment of Tax receivable agreement liability 0 (3) Payments for taxes related to net share settlement of equity awards (17) (23) Payment of term loan (24) 0 Issuance cost related to business combination (36) (38) Tax Distribution to members ($92) ($66) Net cash used in financing activities (8) 28 Net increase (decrease) cash, cash equivalents and restricted cash $22 $14 Cash, cash equivalents and restricted cash, beginning of year $14 $41 Cash, cash equivalents and restricted cash, end of year Supplementary disclosure of cash flow information 21 27 Cash paid during the year for interest 9 5 Derivative asset - interest rate swap 2023A 2022A Net Cash Provided by Operating Activities $104 $93 Acquisition of Property & Equipment (11) (9) Tax Distribution to Members (38) (36) Free Cash Flow (FCF) 55 47 Market Cap as of 12/31 429 1 377 2 Yield: FCF / Market Cap 13% 13% 1 79.4mm shares @ $5.40 price/share as of market close 12/31/23 2 76.7mm shares @ $4.91 price/share as of market close 12/31/22

Q4 Earnings per Share: GAAP 19.4mm Basic Q2 YTD ‘22 GAAP Net Income $31.0mm $0.17 $3.3mm 1 Three months ended 12/31/23 Three months ended 12/31/22 $31.0mm $3.3mm 2 19.4mm $0.17 $22.4mm $22.4mm $2.2mm 3 $2.2mm 4 16.1mm 16.1mm $0.14 $0.14 Net Income used in EPS Total Shares used in EPS Earnings per Share Diluted Basic Diluted 16 Source: Company Financials 1 24.5% of net income of $36.7mm of operating entities plus 100% of C - Corp net loss of $5.7mm 2 24.5% of net income of $36.7mm of operating entities plus 100% of C - Corp net loss of $5.7mm 3 21.4% of net income of $25.6mm of operating plus 100% of C - Corp net loss of $3.2mm 4 21.4% of net income of $25.6mm of operating plus 100% of C - Corp net loss of $3.2mm

Full Year Earnings per Share: GAAP 18.7mm Basic Q2 YTD ‘22 GAAP Net Income $112.5mm $1.03 $19.2mm 1 Twelve months ended 12/31/23 Twelve months ended 12/31/22 $112.5mm $34.1mm 2 35.3mm $0.96 $131.8mm $131.8mm $18.7mm 3 $36.7mm 4 15.4mm 32.6mm $1.21 $1.13 Net Income used in EPS Total Shares used in EPS Earnings per Share Diluted Basic Diluted 17 Source: Company Financials 1 24.5% of net income of $123.5mm of operating entities plus 100% of C - Corp net loss of $11.0mm 2 24.5% of net income of $123.5mm of operating entities plus 100% of C - Corp net loss of $11.0mm plus exchangeable notes and equity awards of $14.8mm 3 21.4% of net income of $144.0mm of operating entities plus 100% of C - Corp net loss of $12.2mm 4 21.4% of net income of $144.0mm of operating entities plus 100% of C - Corp net loss of $12.2mm plus exchangeable notes and equity awards of $18.0mm

Q4 Adjusted Earnings per Share 79.3mm 3 Basic Q2 YTD ‘22 GAAP Net Income $31.0mm $0.29 $23.1mm 1 Three months ended 12/31/23 Three months ended 12/31/22 $31.0mm $23.1mm 1 90.4mm 4 $0.26 $22.4mm $22.4mm $17.7mm 2 $17.7mm 2 76.4mm 3 88.3mm 5 $0.23 $0.20 Adjusted Net Income Total Shares used in EPS Adjusted EPS 6 Diluted Basic Diluted 18 Source: Company Financials 1 GAAP Net Income of $31.0mm less Additional Tax Provision of $2.5mm less Fair Value/Mark to Market Changes for Warrants and Ea rn outs and Equity Awards Adjustment of $5.5mm 2 GAAP Net Income of $22.4mm less Additional Tax Provision of $4.2mm less Fair Value/Mark to Market Changes for Warrants and Ea rn outs and Equity Awards Adjustment of $0.5mm 3 Outstanding Class A plus Class B Shares 4 Outstanding Class A plus Class B Shares plus 8.1mm Public Warrants (Converted Using Treasury Stock Method) and 3.0mm Equity A wa rds 5 Outstanding Class A plus Class B Shares plus 8.1mm Public Warrants (Converted Using Treasury Stock Method) and 3.9mm Equity A war ds. 6 Adjusted Net Income and Adjusted EPS are non - GAAP financial measures. For reconciliation of these non - GAAP measures to the most directly comparable measures prepared in accordance with GAAP, please see the Appendix

Full Year Adjusted Earnings per Share 78.6mm 3 Basic Q2 YTD ‘22 GAAP Net Income $112.5mm $1.12 $88.0mm 1 Twelve months ended 12/31/23 Twelve months ended 12/31/22 $112.5mm $88.0mm 1 90.4mm 4 $0.97 $131.8mm $131.8mm $83.0mm 2 $83.0mm 2 75.7mm 3 88.0mm 5 $1.10 $0.94 Adjusted Net Income Total Shares used in EPS Adjusted EPS 6 Diluted Basic Diluted 19 Source: Company Financials 1 GAAP Net Income of $112.5mm less Additional Tax Provision of $19.8mm less Fair Value/Mark to Market Changes for Warrants and Ea rnouts and Equity Awards Adjustment of $4.7mm 2 GAAP Net Income of $1131.8mm less Additional Tax Provision of $18.1mm less Fair Value/Mark to Market Changes for Warrants and E arnouts and Equity Awards Adjustment of $30.8mm 3 Outstanding Class A plus Class B Shares 4 Outstanding Class A plus Class B Shares plus 8.1mm Public and Private Warrants (Converted Using Treasury Stock Method) and 3. 7m m Equity Awards 5 Outstanding Class A plus Class B Shares plus 8.1mm Public and Private Warrants (Converted Using Treasury Stock Method) and 4. 2mm Equity Awards 6 Adjusted Net Income and Adjusted EPS are non - GAAP financial measures. For reconciliation of these non - GAAP measures to the most directly comparable measures prepared in accordance with GAAP, please see the Appendix

2024 Guidance Providing full year net sales and adjusted EBITDA guidance Net Sales Adjusted EBITDA 1 2023A $391mm $145mm 1 Adjusted EBITDA is a non - GAAP financial metric. For a reconciliation of Adjusted EBITDA to the most - comparable GAAP metric, plea se see the Appendix to this presentation $408mm - $428mm $147mm - $157mm 2024F +4% / +10% B/(W) vs. ‘23 +1% / +8% B/(W) vs. ’23 20

2024 Company Objectives Grow and diversify metal payment cards while delivering exceptional quality to our customers Innovate across products, processes and platforms to differentiate from competition and continue emphasis on environmental impact Drive Arculus Authenticate and Cold Storage by demonstrating to our customers the value proposition of both hardware and software solutions Maintain margins through improved quality, production efficiency, sourcing optimization, and automation Grow Metal Payment Cards 21 Innovate Across Functions Demonstrate Arculus Success Enhance Efficiency 1 4 3 2 Continue to evolve as a world - class organization, innovator, and employer of choice to deliver unparalleled customer and shareholder value Focus On Our People 5

Investor Relations Contact ir.composecure.com Sean Mansouri 720 - 330 - 2829 ir@composecure.com 22 22

Appendix

CompoSecure, Inc. (Nasdaq: CMPO) Summary Equity Capitalization Table (with net exercise model) As of December 31, 2023 Holders # of Shares Issued & Outstanding # of Shares Issued & Outstanding Public Shareholders: Class A 19.4mm 19.4mm Historic CompoSecure Owners : Class B 60.0mm 60.0mm Subtotal 79.4mm 79.4mm Holders # of Shares Reserved for Immediately Exercisable In - The - Money Options # of Shares Reserved for Immediately Exercisable In - The - Money Options (assuming net exercise) 1 Merger Rollover Options 3.3mm 2.7mm Subtotal 82.7mm 82.1mm Convertible Instruments # of Shares Reserved for Conversion # of Shares Reserved for Conversion (assuming net exercise) Public Warrants 2 22.4mm 8.0mm Exchangeable Notes 3 11.3mm 11.3mm Grand Total 116.4mm 101.5mm Notes: The table above excludes shares which may be issued in the future for contingent “earnout”, equity incentive plan, emp loy ee stock purchase plan, and 401K plan 1 Assumes exercise net of strike price, valuation at assumed FMV of $10.00 2 Assumes treasury stock method, $11.50 strike price, & valuation at assumed FMV of $18.00 3 Assumes $11.50 strike price with redemption (at company’s discretion) after three years if FMV exceeds $14.95 24

Statement of Operations (Unaudited) Source: Company financials Note: Operating results have been derived from CompoSecure’s consolidated financial statements for the three and twelve month s e nded December 31, 2023 and 2022 respectively 25 FY 2022A FY 2023A Q4 2022A Q4 2023A ($mm) Revenue $378 $391 $94 $100 Net Sales (158) (182) (44) (47) Cost of Sales $220 $209 $50 $53 Gross Profit Operating Expenses (105) (90) (25) (22) Selling, general and administrative $115 $119 $25 $31 Income from operations Other expense 17 (6) (3) 0 Other income (expense), net $132 $113 $22 $31 Net Income

Non - GAAP Adjusted EBITDA Reconciliation (Unaudited) Source: Company financials Non - Cash Equity Awards : Equity based expenses related to the equity incentive plan Non - Cash Mark - to - Market Adjustments : Related to changes in fair value of liabilities for warrants, earnouts and derivatives assets . 1 2 1 2 26 FY 2022A FY 2023A Q4 2022A Q4 2023A $mm $132 $113 $22 $31 Net Income 22 24 6 6 Interest Expense 9 8 2 2 Depreciation and Amortization 4 5 1 4 Taxes $167 $150 $31 $43 Unadjusted EBITDA 11 18 4 5 Non - Cash Stock Comp Expense - 42 - 23 - 4 - 11 Mark - to - market Adjustments 0 0 0 0 Other ($31) ($5) ($0) ($6) Total EBITDA Adjustments $136 $145 $31 $37 Adjusted EBITDA 36% 37% 33% 37% Adjusted EBITDA %

Non - GAAP EPS Reconciliation (Unaudited) Source: Company financials 1 Assumes treasury stock method, valuation at assumed FMV of $18.00 2 Includes options, RSUs, and ESPP shares 27 Twelve months ended 12/31/2022 Twelve Months Ended 12/31/2023 Three Months Ended 12/31/2023 DILUTED BASIC DILUTED BASIC DILUTED BASIC ($mm) $131.8 $131.8 $112.5 $112.5 $31.0 $31.0 GAAP Net Income 4.4 4.4 4.6 4.6 3.9 3.9 Adjust for tax provision - 22.4 - 22.4 - 24.4 - 24.4 - 6.4 - 6.4 Tax Provision $113.8 $113.8 $92.7 $92.7 $28.5 $28.5 Tax Adjusted Net Income - $30.8 - $30.8 - $4.7 - $4.7 - $5.4 - $5.4 Fair Value and Stock Based Compensation Adjustment $83.0 $83.0 $88.0 $88.0 $23.1 $23.1 Total Adjusted Net Income 75.7 75.7 78.6 78.6 79.3 79.3 Class A + Class B Shares 8.1 - 8.1 - 8.1 - Public & Private Warrants 1 4.2 - 3.7 - 3.1 - Equity Awards 2 88.0 75.7 90.4 78.6 90.5 79.3 Total Shares $0.94 $1.10 $0.97 $1.12 $0.25 $0.29 Adjusted EPS
v3.24.0.1
Cover
|
Mar. 01, 2024 |
| Document Type |
8-K
|
| Amendment Flag |
false
|
| Document Period End Date |
Mar. 01, 2024
|
| Entity File Number |
001-39687
|
| Entity Registrant Name |
CompoSecure, Inc.
|
| Entity Central Index Key |
0001823144
|
| Entity Tax Identification Number |
85-2749902
|
| Entity Incorporation, State or Country Code |
DE
|
| Entity Address, Address Line One |
309 Pierce Street
|
| Entity Address, City or Town |
Somerset
|
| Entity Address, State or Province |
NJ
|
| Entity Address, Postal Zip Code |
08873
|
| City Area Code |
(908)
|
| Local Phone Number |
518-0500
|
| Written Communications |
false
|
| Soliciting Material |
false
|
| Pre-commencement Tender Offer |
false
|
| Pre-commencement Issuer Tender Offer |
false
|
| Entity Emerging Growth Company |
true
|
| Elected Not To Use the Extended Transition Period |
false
|
| Common Stock [Member] |
|
| Title of 12(b) Security |
Class
A Common Stock, $0.0001 par value
|
| Trading Symbol |
CMPO
|
| Security Exchange Name |
NASDAQ
|
| Redeemable warrants, each whole warrant exercisable for one share of Class A Common Stock [Member] |
|
| Title of 12(b) Security |
Redeemable
warrants, each whole warrant exercisable for one share of Class A Common Stock
|
| Trading Symbol |
CMPOW
|
| Security Exchange Name |
NASDAQ
|
| X |
- DefinitionBoolean flag that is true when the XBRL content amends previously-filed or accepted submission.
| Name: |
dei_AmendmentFlag |
| Namespace Prefix: |
dei_ |
| Data Type: |
xbrli:booleanItemType |
| Balance Type: |
na |
| Period Type: |
duration |
|
| X |
- DefinitionFor the EDGAR submission types of Form 8-K: the date of the report, the date of the earliest event reported; for the EDGAR submission types of Form N-1A: the filing date; for all other submission types: the end of the reporting or transition period. The format of the date is YYYY-MM-DD.
| Name: |
dei_DocumentPeriodEndDate |
| Namespace Prefix: |
dei_ |
| Data Type: |
xbrli:dateItemType |
| Balance Type: |
na |
| Period Type: |
duration |
|
| X |
- DefinitionThe type of document being provided (such as 10-K, 10-Q, 485BPOS, etc). The document type is limited to the same value as the supporting SEC submission type, or the word 'Other'.
| Name: |
dei_DocumentType |
| Namespace Prefix: |
dei_ |
| Data Type: |
dei:submissionTypeItemType |
| Balance Type: |
na |
| Period Type: |
duration |
|
| X |
- DefinitionAddress Line 1 such as Attn, Building Name, Street Name
| Name: |
dei_EntityAddressAddressLine1 |
| Namespace Prefix: |
dei_ |
| Data Type: |
xbrli:normalizedStringItemType |
| Balance Type: |
na |
| Period Type: |
duration |
|
| X |
- Definition
+ References
+ Details
| Name: |
dei_EntityAddressCityOrTown |
| Namespace Prefix: |
dei_ |
| Data Type: |
xbrli:normalizedStringItemType |
| Balance Type: |
na |
| Period Type: |
duration |
|
| X |
- DefinitionCode for the postal or zip code
| Name: |
dei_EntityAddressPostalZipCode |
| Namespace Prefix: |
dei_ |
| Data Type: |
xbrli:normalizedStringItemType |
| Balance Type: |
na |
| Period Type: |
duration |
|
| X |
- DefinitionName of the state or province.
| Name: |
dei_EntityAddressStateOrProvince |
| Namespace Prefix: |
dei_ |
| Data Type: |
dei:stateOrProvinceItemType |
| Balance Type: |
na |
| Period Type: |
duration |
|
| X |
- DefinitionA unique 10-digit SEC-issued value to identify entities that have filed disclosures with the SEC. It is commonly abbreviated as CIK. Reference 1: http://www.xbrl.org/2003/role/presentationRef
-Publisher SEC
-Name Exchange Act
-Number 240
-Section 12
-Subsection b-2
| Name: |
dei_EntityCentralIndexKey |
| Namespace Prefix: |
dei_ |
| Data Type: |
dei:centralIndexKeyItemType |
| Balance Type: |
na |
| Period Type: |
duration |
|
| X |
- DefinitionIndicate if registrant meets the emerging growth company criteria. Reference 1: http://www.xbrl.org/2003/role/presentationRef
-Publisher SEC
-Name Exchange Act
-Number 240
-Section 12
-Subsection b-2
| Name: |
dei_EntityEmergingGrowthCompany |
| Namespace Prefix: |
dei_ |
| Data Type: |
xbrli:booleanItemType |
| Balance Type: |
na |
| Period Type: |
duration |
|
| X |
- DefinitionCommission file number. The field allows up to 17 characters. The prefix may contain 1-3 digits, the sequence number may contain 1-8 digits, the optional suffix may contain 1-4 characters, and the fields are separated with a hyphen.
| Name: |
dei_EntityFileNumber |
| Namespace Prefix: |
dei_ |
| Data Type: |
dei:fileNumberItemType |
| Balance Type: |
na |
| Period Type: |
duration |
|
| X |
- DefinitionTwo-character EDGAR code representing the state or country of incorporation.
| Name: |
dei_EntityIncorporationStateCountryCode |
| Namespace Prefix: |
dei_ |
| Data Type: |
dei:edgarStateCountryItemType |
| Balance Type: |
na |
| Period Type: |
duration |
|
| X |
- DefinitionThe exact name of the entity filing the report as specified in its charter, which is required by forms filed with the SEC. Reference 1: http://www.xbrl.org/2003/role/presentationRef
-Publisher SEC
-Name Exchange Act
-Number 240
-Section 12
-Subsection b-2
| Name: |
dei_EntityRegistrantName |
| Namespace Prefix: |
dei_ |
| Data Type: |
xbrli:normalizedStringItemType |
| Balance Type: |
na |
| Period Type: |
duration |
|
| X |
- DefinitionThe Tax Identification Number (TIN), also known as an Employer Identification Number (EIN), is a unique 9-digit value assigned by the IRS. Reference 1: http://www.xbrl.org/2003/role/presentationRef
-Publisher SEC
-Name Exchange Act
-Number 240
-Section 12
-Subsection b-2
| Name: |
dei_EntityTaxIdentificationNumber |
| Namespace Prefix: |
dei_ |
| Data Type: |
dei:employerIdItemType |
| Balance Type: |
na |
| Period Type: |
duration |
|
| X |
- DefinitionLocal phone number for entity.
| Name: |
dei_LocalPhoneNumber |
| Namespace Prefix: |
dei_ |
| Data Type: |
xbrli:normalizedStringItemType |
| Balance Type: |
na |
| Period Type: |
duration |
|
| X |
- DefinitionBoolean flag that is true when the Form 8-K filing is intended to satisfy the filing obligation of the registrant as pre-commencement communications pursuant to Rule 13e-4(c) under the Exchange Act. Reference 1: http://www.xbrl.org/2003/role/presentationRef
-Publisher SEC
-Name Exchange Act
-Number 240
-Section 13e
-Subsection 4c
| Name: |
dei_PreCommencementIssuerTenderOffer |
| Namespace Prefix: |
dei_ |
| Data Type: |
xbrli:booleanItemType |
| Balance Type: |
na |
| Period Type: |
duration |
|
| X |
- DefinitionBoolean flag that is true when the Form 8-K filing is intended to satisfy the filing obligation of the registrant as pre-commencement communications pursuant to Rule 14d-2(b) under the Exchange Act. Reference 1: http://www.xbrl.org/2003/role/presentationRef
-Publisher SEC
-Name Exchange Act
-Number 240
-Section 14d
-Subsection 2b
| Name: |
dei_PreCommencementTenderOffer |
| Namespace Prefix: |
dei_ |
| Data Type: |
xbrli:booleanItemType |
| Balance Type: |
na |
| Period Type: |
duration |
|
| X |
- DefinitionTitle of a 12(b) registered security. Reference 1: http://www.xbrl.org/2003/role/presentationRef
-Publisher SEC
-Name Exchange Act
-Number 240
-Section 12
-Subsection b
| Name: |
dei_Security12bTitle |
| Namespace Prefix: |
dei_ |
| Data Type: |
dei:securityTitleItemType |
| Balance Type: |
na |
| Period Type: |
duration |
|
| X |
- DefinitionName of the Exchange on which a security is registered. Reference 1: http://www.xbrl.org/2003/role/presentationRef
-Publisher SEC
-Name Exchange Act
-Number 240
-Section 12
-Subsection d1-1
| Name: |
dei_SecurityExchangeName |
| Namespace Prefix: |
dei_ |
| Data Type: |
dei:edgarExchangeCodeItemType |
| Balance Type: |
na |
| Period Type: |
duration |
|
| X |
- DefinitionBoolean flag that is true when the Form 8-K filing is intended to satisfy the filing obligation of the registrant as soliciting material pursuant to Rule 14a-12 under the Exchange Act. Reference 1: http://www.xbrl.org/2003/role/presentationRef
-Publisher SEC
-Name Exchange Act
-Section 14a
-Number 240
-Subsection 12
| Name: |
dei_SolicitingMaterial |
| Namespace Prefix: |
dei_ |
| Data Type: |
xbrli:booleanItemType |
| Balance Type: |
na |
| Period Type: |
duration |
|
| X |
- DefinitionTrading symbol of an instrument as listed on an exchange.
| Name: |
dei_TradingSymbol |
| Namespace Prefix: |
dei_ |
| Data Type: |
dei:tradingSymbolItemType |
| Balance Type: |
na |
| Period Type: |
duration |
|
| X |
- DefinitionBoolean flag that is true when the Form 8-K filing is intended to satisfy the filing obligation of the registrant as written communications pursuant to Rule 425 under the Securities Act. Reference 1: http://www.xbrl.org/2003/role/presentationRef
-Publisher SEC
-Name Securities Act
-Number 230
-Section 425
| Name: |
dei_WrittenCommunications |
| Namespace Prefix: |
dei_ |
| Data Type: |
xbrli:booleanItemType |
| Balance Type: |
na |
| Period Type: |
duration |
|
| X |
- Details
| Name: |
us-gaap_StatementClassOfStockAxis=us-gaap_CommonStockMember |
| Namespace Prefix: |
|
| Data Type: |
na |
| Balance Type: |
|
| Period Type: |
|
|
| X |
- Details
| Name: |
us-gaap_StatementClassOfStockAxis=CMPO_RedeemableWarrantSeachWholeWarrantExercisableForOneShareOfClassACommonStockMember |
| Namespace Prefix: |
|
| Data Type: |
na |
| Balance Type: |
|
| Period Type: |
|
|
CompoSecure (NASDAQ:CMPO)
Graphique Historique de l'Action
De Mai 2024 à Juin 2024

CompoSecure (NASDAQ:CMPO)
Graphique Historique de l'Action
De Juin 2023 à Juin 2024
