GOLD'N FUTURES
adds
high priority
GOLD TARGETs
within
the
expanded
HERCULES PROPERTY
in
Beardmore-Geraldton
gold
camp,
ontario
VANCOUVER,
BC -- (InvestorsHub NewsWire – July
9,
2021)
Gold'n
Futures
Mineral
Corp.
(the "Company" or
"Gold'n Futures") is pleased to report that the compilation of
historical data
on the Hercules Gold Property
has
identified
two
additional
gold
targets for its 2021 exploration
program associated with
indicative
geological, geophysical and geochemical
anomalies.
Significantly,
these new targets were found
outside of
and to the
east of the Elmhirst Lake
Intrusive Complex
that is the host
for the high-grade
Hercules gold
vein systems.
"This
is an
important development which establishes a new
regional
component for gold targets outside the main gold-bearing
Elmhirst
Lake Intrusive
Complex.
Our team
of geologists has
recognized certain unique features
in these regional targets that are
similar to the
Hercules gold systems. However,
these
targets have seen
little if any historical work and
we
believe
the targets represent opportunities to replicate the Golden Mile
vein but in new and untested environments,"
commented
Stephen Wilkinson, the
Company's President and CEO.
Regional
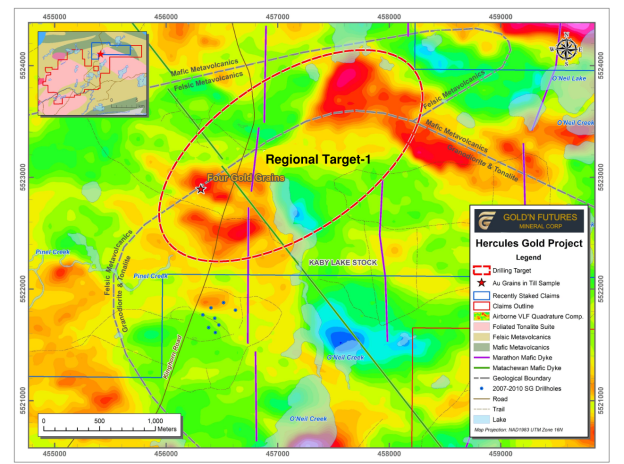
Target-1– North Kaby Lake Stock (Figure-1)
The Kaby Lake
Stock is a granitic intrusive body
that is very
similar to and almost a twin of
the Elmhirst Lake
Intrusive Complex. It occurs and
dominates
much of the Hercules
Property
in the
northeastern part of the claims` group. The Stock
is
an
important host to mineral deposits
including
the past
producing DikDik Mine which
reportedly
produced
3,525-tons grading 0.689 ounces per ton (21.5 grams per tonne)
gold and
the Foisey vein system which has
returned assays up to 0.62 ounces per ton (19.4 grams per
tonne) gold.
This
Regional
Target - 1 is based in part on the
location of a gold-bearing
glacial
till sample
collected by the Ontario Geological Survey in 1987.
The survey was conducted across the Beardmore-Geraldton gold
camp. The program was highly
successful and identified a strong correlation
between
visible grains
of gold found in glacial till samples
with
known
gold
mines and
deposits in
the camp. For example, the
past
producing Quebec Sturgeon River Gold
Mine,
located about 12-kilometres southwest
of the Hercules gold systems, returned three basal till
samples
with 15, 22 and 74 gold
grains. Similarly,
the
Dik
Dik
Mine, located about
10-kilometres east of the Hercules gold
systems, had two till samples that showed
3 and 4 gold
grains.
Gold'n
Futures' Regional
Target-1 is contained within the
Company's newly staked claims located, about 5-kilometres northeast
of the Hercules gold systems (see our news release dated,
May 10, 2021). Regional Target-1
is centered on
a government
sample that
contained 4 visible gold
grains.
Geologically,
the target
area occurs at the northern nose of the
Kaby Lake Stock at the contact
with
felsic
metavolcanic
units of the
Beardmore-Geraldton greenstone belt and near the intersection of
two regional structures now each
occupied by diabase dikes.
These are
geological
features with
which the primary gold systems at
Hercules such as the
Yellow Brick
Road, Penelton, and
Amede
are
associated. The association of the
geological features with the finding of visible grains of gold in the
glacial overburden is indicative of the
potential for a yet-to-be discovered gold vein system
for which our field crews will be
exploring.
Regional
Target-2 – Ballina
Lake Gold Zone (Figure-2)
The
Ballina
Lake Gold
Zone is
located about 11-kilomtres northeast of the Hercules gold systems
and consists of two
showings associated
with the
eastern contact of the Kaby Lake Stock with mafic metavolcanic
units. The gold showing at Ballina
Lake had exploration
performed on
it in the
past and
during 2010 the work included limited outcrop
stripping, pitting, sampling and diamond
drilling.
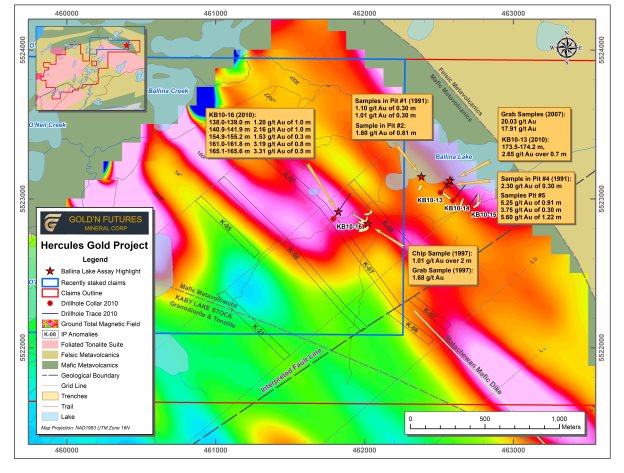
Grab samples of
17.94 grams/tonne (g/t)
gold and 20.03
g/t gold were reported from sheared metavolcanics at the south
shore of Ballina Lake. In this location,
pit
samples ranged from 1.01 g/t to 5.60 g/t gold over 0.3-metres to
1.22-metres and of the three
holes drilled
across the trenched area, the most notable
intersection was
from hole KB 10-13 which
returned 2.65 g/t over
0.7-metres.
Figure-1:
Regional
Target-1 – the North
Kaby Lake Stock.
Compilation
plan of
major geological and geophysical features on VLF
conductor base map.

Approximately
500-metres to the southwest of Ballina Lake is another gold occurrence
which is
within the
Kaby Lake Stock. This showing received limited trenching from
which a chip sample yielded 1.01 g/t gold over 2-metres. One
hole, KB 10-16, drilled across the projected trend of the trenches
and collared in a complex magnetic feature very similar to the
Hercules gold occurrences that extends for over 2,000-metres.
Five intercepts ranging from 1.20 g/t to 3.31g/t gold over
sub-meter to meter drill core lengths were reported from this
hole.
The Ballina Lake
gold zones represent excellent candidates for further
exploration. Gold'n Futures intends to have its geological
team conduct mapping and sampling programs to prospect for drill
sites for the upcoming drill programs.
Figure-2.Regional
Target-2 – Ballina Lake Gold Zone.
Compilation Map on total
magnetic Field base map.

Cautionary
Note:
Historical
resource estimates cited in this news release are based on prior
data and reports obtained and prepared by previous operators, and
information provided by governmental authorities. Although
the historical resource estimates were National
Instrument 43-101
compliant at the time they were compiled,
they
are not 'Current Resource Estimates'. A Qualified Person has
not done sufficient work to verify the classification of the
mineral resource estimates in accordance with current CIM
categories. The Company is not treating the historical
estimate as a current NI 43-101 mineral resource estimate.
Establishing a current mineral resource estimate for
the
Hercules Gold Property will require further evaluation, which the
Company and its consultants intend to complete in due
course.
Qualified
Person
The scientific and technical
content of this press release has been prepared, reviewed and
approved by Mr. Walter Hanych, P. Geo., who is a Qualified Person
under NI 43-101 regulations and is a director of the
Company.
About
Gold'n Futures Mineral Corp.
Gold'n Futures Mineral Corp.
(CSE: FUTR) (FSE: G6M) (OTC: GFTRF) is a Canadian based exploration
company advancing its flagship Hercules Gold Project. The
Hercules Gold Project is a well-known high-grade gold project,
located 120 kilometres northeast of Thunder Bay, Ont., in the
townships of Elmhirst and Rickaby, within the Thunder Bay North
Mining District in the heart of the Beardmore – Geraldton gold
mining camp. The Hercules Gold Project lies within an Archean
greenstone belt that extends from the Longlac area in the east to
Lake Nipigon in the west, a distance of about 130 kilometres.
It comprises 475 contiguous claim cells (10,052 ha) of which 95% of
the property is effectively unexplored. To date, the work
completed on the Hercules Gold Project forms an extensive database
including reconnaissance grab samples; channel samples; a variety
of geophysical surveys; and, historical drilling totalling in the
order of 537 holes – all of which is being remodeled for planning
of the 2021 exploration program. The historical resource
estimate (see Cautionary Note) for the Hercules Gold Project was
completed in 2010 and comprised an uncapped Indicated Resource
of 231,800
tonnes containing 111,450 ounces of
gold and an uncapped Inferred Resource of 761,300 tonnes
containing
101,050 ounces of gold.
Gold'n Futures' other
advanced gold asset is the Brady Gold Property that consists of an
advanced project within a 950 ha claim group in the highly
prospective Gander Zone of the central region of
Newfoundland. The Brady's Reid Gold Zone is an
intrusion-hosted deposit that is only partially drill-tested and
remains open on strike and at depth. The historical resource
estimated for Reid Gold Zone in 2011 produced an
Inferred Resource
of 9,750,000 tonnes hosting 173,000 ounces of gold (see the Cautionary
Note).
For more information, please
visit our website at: www.goldnfuturesmineralcorp.com.
For further
information
Stephen Wilkinson,
President and CEO
Email:
contact@goldnfutures.com
The
Canadian Securities Exchange accepts no responsibility for the
adequacy or accuracy of this release.
This news
release may contain forward-looking statements based on assumptions
and judgments of management regarding future events or results.
Such statements are subject to a variety of risks and uncertainties
which could cause actual events or results to differ materially
from those reflected in the forward-looking statements. There is no
assurance the private placement, property option, change of board
or reinstatement of trading referred to above will close on the
terms as stated, or at all. The Company disclaims any intention or
obligation to revise or update such statements.
Cautionary Note: The Company refers to the historical resource
estimates associated with the Hercules Gold Project,
the
Brady Gold Property
and the Handcamp Property (the "Historical
Estimates").
The
Historical
Estimates
are based on prior data and reports obtained and prepared by
previous operators, and information provided by governmental
authorities. A Qualified Person has not done sufficient work to
verify the classification of the mineral resource estimates in
accordance with current CIM categories. The Company is not treating
the historical estimate as a current NI 43-101-compliant mineral
resource estimate. Accordingly, this historical estimate should not
be relied upon. Establishing a current mineral resource estimate on
the Hercules
Gold
Project ,
the
Brady
Gold Property and the Handcamp Property
will require further evaluation, which the Company and its
consultants intend to complete in due course.