AP Alternative Assets Releases Financial Results for the Three and Nine Months Ended September 30, 2020
29 Octobre 2020 - 2:28AM

AP Alternative Assets Releases Financial Results for the Three and
Nine Months Ended September 30, 2020
AP Alternative Assets, L.P. (“AAA”, Euronext Amsterdam: AAA)
today released its financial results for three and nine months
ended September 30, 2020. AAA invests its capital through, and is
the sole limited partner of, AAA Investments, L.P., which is
referred to as the “Investment Partnership.”
Highlights
- Net asset value at
September 30, 2020 was $10.3 million, or $0.13 per unit, reflecting
a net increase in net assets of approximately $1.0 million, or
$0.01 per common unit during the three months ended September 30,
2020.
- The increase in net asset value during
the three months ended September 30, 2020 was driven by an increase
in net assets from operations due to a realized gain on sale of
605,554 Athene shares by the Investment Partnership of $12.0,
offset by the reversal of previously recognized unrealized gains of
$(9.3) million.
Net Asset Value for AAA
At September 30, 2020, AAA had net assets of $10.3 million,
including its share of the net assets of the Investment
Partnership, as follows:
|
(in $ millions, except per unit amounts) |
Net Asset Value as of September 30, 2020 |
|
Gross Asset Value: |
|
| Cash |
$ |
9.6 |
|
| Other |
0.7 |
| Net Asset
Value(1) |
$ |
10.3 |
|
| Net Asset
Value per Unit(1) |
$ |
0.13 |
|
| Net Common
Units Outstanding |
76,328,950 |
____________________________
(1) The remaining cash will be used be used to
settle outstanding liabilities and expenses (including expenses
relating to ultimately winding up AAA). After payment of these
expenses the remaining cash of AAA (if any) will be distributed to
AAA unitholders (unless the cash, on a per unit basis, is de
minimis, in which case it is expected to be given to charity). This
distribution which, based on information now available to AAA is
currently estimated to be between USD 7 cents and 9 cents per AAA
unit. A further announcement in this regard will be made at the
relevant time. The net asset value also includes $0.8 million of
prepaid management fees that will continue to be amortized over the
life of the service period through December 31, 2020. If a decision
is made to wind up AAA prior to the end of the service period, AAA
will accelerate the amortization of the prepaid management fee.
Financial Report
AAA's interim report, which includes its
unaudited financial statements and the unaudited consolidated
financial statements of the Investment Partnership is available and
can be downloaded free of charge at its website at:
www.apolloalternativeassets.com.
Contact
Ann Dai (New
York) +1 (212) 822
0678
Additional Information
A presentation will be available on the company’s website at
http://www.apolloalternativeassets.com/ReportsAndFilings/AdditionalDocuments.aspx
in connection with this press release.
About AAA
AAA was established by Apollo Global Management,
Inc. and its subsidiaries (“Apollo”) and is a closed- end limited
partnership established under the laws of Guernsey. Apollo is a
leading global alternative investment manager with 30 years of
experience investing across the capital structure of leveraged
companies. AAA is managed by Apollo Alternative Assets, L.P. For
more information about AAA, please visit
www.apolloalternativeassets.com.
Forward-Looking Statements
This press release contains forward-looking
statements. Forward-looking statements involve risks and
uncertainties because they relate to future events and
circumstances. Such statements are based on currently available
operating, financial and competitive information and are subject to
various risks and uncertainties that could cause actual results and
developments to differ materially from the historical experience
and expressed or implied expectations of AAA. Undue reliance should
not be placed on such forward-looking statements. Forward-looking
statements speak only as of the date on which they are made and AAA
does not undertake to update its forward-looking statements unless
required by law.
Financial Schedules Follow
Financial Schedule I
|
AP ALTERNATIVE ASSETS, L.P.STATEMENT OF
OPERATIONS (unaudited) (in
thousands) |
|
|
For the Three Months Ended September
30, |
|
For the Nine Months Ended September 30, |
|
|
2020 |
|
2019 |
|
2020 |
|
2019 |
|
|
|
|
|
|
|
|
|
|
|
|
|
|
|
|
|
|
|
NET INVESTMENT LOSS (ALLOCATED FROM AAA
INVESTMENTS, L.P.) |
|
|
|
|
|
|
|
|
Investment expenses |
$ |
(1,150 |
) |
|
$ |
(1,097) |
|
|
$ |
(3,212) |
|
|
$ |
(3,359) |
|
|
|
|
|
|
|
|
|
|
|
EXPENSES |
|
|
|
|
|
|
|
|
General and administrative expenses |
(309) |
|
|
(253) |
|
|
(710 |
) |
|
(840 |
) |
|
|
|
|
|
|
|
|
|
|
NET INVESTMENT LOSS |
(1,459 |
) |
|
(1,350 |
) |
|
(3,922 |
) |
|
(4,199 |
) |
|
|
|
|
|
|
|
|
|
|
UNREALIZED GAINS (LOSSES) FROM INVESTMENTS
(ALLOCATED FROM AAA INVESTMENTS,
L.P.) |
|
|
|
|
|
|
|
|
Net increase (decrease) in unrealized (depreciation)
appreciation of investment |
2,483 |
|
|
(549) |
|
|
(6,237 |
) |
|
1,229 |
|
|
|
|
|
|
|
|
|
|
|
NET GAIN (LOSS) FROM INVESTMENTS |
2,483 |
|
|
(549) |
|
|
(6,237 |
) |
|
1,229 |
|
|
|
|
|
|
|
|
|
|
|
NET INCREASE (DECREASE) IN NET ASSETS
RESULTING FROM OPERATIONS |
$ |
1,024 |
|
|
$ |
(1,899 |
) |
|
$ |
(10,159 |
) |
|
$ |
(2,970 |
) |
|
|
|
|
|
|
|
|
|
|
|
|
|
|
|
|
|
|
|
|
|
|
|
|
|
|
|
Financial Schedule II
|
AP ALTERNATIVE ASSETS, L.P.STATEMENT OF
ASSETS AND LIABILITIES (in thousands, except per
unit amounts) |
|
|
As of September
30, 2020
(unaudited) |
|
As of December 31, 2019 |
|
ASSETS |
|
|
|
|
Investment in AAA Investments, L.P. |
$ |
16,632 |
|
|
$ |
26,080 |
|
|
Other assets |
298 |
|
|
170 |
|
TOTAL ASSETS |
16,930 |
|
26,250 |
|
|
|
|
|
|
LIABILITIES |
|
|
|
|
Accounts payable and accrued liabilities |
463 |
|
546 |
|
Due to affiliates |
6,190 |
|
|
5,268 |
|
|
TOTAL LIABILITIES |
6,653 |
|
5,814 |
|
|
|
|
|
|
|
NET ASSETS |
$ |
10,277 |
|
|
$ |
20,436 |
|
|
|
|
|
|
|
NET ASSETS CONSIST OF: |
|
|
|
|
Partners’ capital contribution (76,328,950 common units
outstanding at September 30, 2020 and December 31,
2019) |
$ |
1,621,541 |
|
|
$ |
1,621,541 |
|
|
Partners’ capital distributions |
(3,967,667 |
) |
|
(3,967,667 |
) |
|
Accumulated increase in net assets resulting from
operations |
2,356,403 |
|
2,366,562 |
|
|
|
|
|
|
|
NET ASSETS |
$ |
10,277 |
|
|
$ |
20,436 |
|
|
|
|
|
|
|
Net asset value per common unit |
$ |
0.13 |
|
|
$ |
0.27 |
|
|
|
|
|
|
|
Market price per common unit |
$ |
0.07 |
|
|
$ |
0.10 |
|
|
|
|
|
|
|
|
|
|
|
|
|
|
|
|
Financial Schedule III
|
AAA INVESTMENTS, L.P.CONSOLIDATED
STATEMENT OF OPERATIONS (unaudited) (in
thousands) |
|
|
|
For the Three Months Ended September 30, |
|
For the Six Months Ended September 30, |
|
|
|
2020 |
|
2019 |
|
2020 |
|
2019 |
|
EXPENSES: |
|
|
|
|
|
|
|
|
|
Management fees |
|
$ |
(842 |
) |
|
$ |
(842 |
) |
|
$ |
(2,527 |
) |
|
$ |
(2,527 |
) |
|
General and administrative expenses |
|
(309 |
) |
|
(256 |
) |
|
(687 |
) |
|
(836 |
) |
|
|
|
|
|
|
|
|
|
|
|
NET INVESTMENT LOSS |
|
(1,151 |
) |
|
(1,098 |
) |
|
(3,214 |
) |
|
(3,363 |
) |
|
|
|
|
|
|
|
|
|
|
|
UNREALIZED GAIN (LOSS) FROM
INVESTMENTS: |
|
|
|
|
|
|
|
|
|
Net realized gains from sales/dispositions on
investments |
|
12,049 |
|
— |
|
12,049 |
|
— |
|
Net (decrease) increase in unrealized appreciation on
investments |
|
(9,317) |
|
|
(604) |
|
|
(18,911 |
) |
|
1,350 |
|
|
NET GAIN (LOSS) FROM INVESTMENTS |
|
2,732 |
|
|
(604) |
|
|
(6,862 |
) |
|
1,350 |
|
|
|
|
|
|
|
|
|
|
|
|
NET INCREASE (DECREASE) IN NET ASSETS
RESULTING FROM OPERATIONS |
|
$ |
1,581 |
|
|
$ |
(1,702) |
|
|
$ |
(10,076 |
) |
|
$ |
(2,013 |
) |
|
|
|
|
|
|
|
|
|
|
|
|
|
|
|
|
|
|
|
|
|
|
|
|
Financial Schedule IV
|
AAA INVESTMENTS, L.P.CONSOLIDATED
STATEMENT OF ASSETS AND LIABILITIES (in
thousands) |
|
|
As of September 30, 2020 (unaudited) |
|
As of December 31,2019 |
|
ASSETS |
|
|
|
|
Investments: |
|
|
|
|
Investment in Opportunistic Investment at fair value (cost
of $0 and $9,570 at September 30, 2020 and December 31, 2019,
respectively) |
$ |
— |
|
|
$ |
28,480 |
|
|
Cash and cash equivalents |
9,626 |
|
|
14 |
|
|
Other assets |
1,141 |
|
|
3,541 |
|
|
Due from affiliates |
6,190 |
|
|
5,268 |
|
|
TOTAL ASSETS |
16,957 |
|
|
37,303 |
|
|
|
|
|
|
|
LIABILITIES |
|
|
|
|
Accounts payable and accrued liabilities |
321 |
|
|
482 |
|
|
Line of Credit due to affiliates |
0 |
|
|
8,725 |
|
|
TOTAL LIABILITIES |
321 |
|
|
9,207 |
|
|
|
|
|
|
|
NET ASSETS |
$ |
16,636 |
|
|
$ |
28,096 |
|
|
|
|
|
|
|
NET ASSETS CONSIST OF: |
|
|
|
|
Partners' capital |
$ |
(2,682,361 |
) |
|
$ |
(2,680,977 |
) |
|
Accumulated increase in net assets resulting from
operations |
2,698,997 |
|
|
2,709,073 |
|
|
|
|
|
|
|
NET ASSETS |
$ |
16,636 |
|
|
$ |
28,096 |
|
|
|
|
|
|
|
|
|
|
|
|
|
|
|
Attachment
- AAAEarningsReleaseQ320.pdf
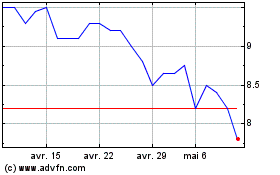
Alan Allman Associates (EU:AAA)
Graphique Historique de l'Action
De Nov 2024 à Déc 2024

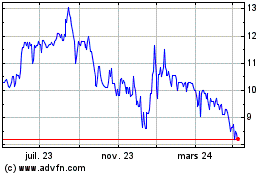
Alan Allman Associates (EU:AAA)
Graphique Historique de l'Action
De Déc 2023 à Déc 2024
