Form 8-K - Current report
14 Février 2024 - 11:23PM
Edgar (US Regulatory)
false
0001324404
0001324404
2024-02-14
2024-02-14
iso4217:USD
xbrli:shares
iso4217:USD
xbrli:shares
UNITED STATES
SECURITIES AND
EXCHANGE COMMISSION
Washington, D.C. 20549
FORM 8-K
CURRENT REPORT
Pursuant to Section
13 OR 15(d) of The Securities Exchange Act of 1934
Date of Report (Date of earliest event reported):
February 14, 2024
CF
Industries Holdings, Inc.
(Exact name of registrant as specified in its
charter)
| Delaware |
|
001-32597 |
|
20-2697511 |
(State
or other jurisdiction
of incorporation) |
|
(Commission
File Number) |
|
(IRS
Employer
Identification No.) |
2375
Waterview Drive
Northbrook,
Illinois |
|
|
|
60062 |
(Address
of principal
executive offices) |
|
|
|
(Zip
Code) |
Registrant’s telephone number, including
area code (847) 405-2400
(Former name or former address,
if changed since last report.)
Check the appropriate box below if the Form 8-K
filing is intended to simultaneously satisfy the filing obligation of the registrant under any of the following provisions (see General
Instruction A.2. below):
| ¨ | Written
communications pursuant to Rule 425 under the Securities Act (17 CFR 230.425) |
| ¨ | Soliciting
material pursuant to Rule 14a-12 under the Exchange Act (17 CFR 240.14a-12) |
| ¨ | Pre-commencement
communications pursuant to Rule 14d-2(b) under the Exchange Act (17 CFR 240.14d-2(b)) |
| ¨ | Pre-commencement
communications pursuant to Rule 13e-4(c) under the Exchange Act (17 CFR 240.13e-4(c)) |
Securities registered pursuant to Section 12(b) of the Act:
| Title of each class |
|
Trading symbol(s) |
|
Name of each exchange on which registered |
| common
stock, par value $0.01 per share |
|
CF |
|
New
York Stock Exchange |
Indicate by check mark whether the registrant is
an emerging growth company as defined in Rule 405 of the Securities Act of 1933 (§230.405 of this chapter) or Rule 12b-2
of the Securities Exchange Act of 1934 (§240.12b-2 of this chapter).
Emerging
growth company ¨
If
an emerging growth company, indicate by check mark if the registrant has elected not to use the extended transition period for complying
with any new or revised financial accounting standards provided pursuant to Section 13(a) of the Exchange Act. ¨
| Item 2.02. | Results
of Operations and Financial Condition. |
On February 15, 2024, CF Industries Holdings, Inc. will
host a conference call discussing its results for the quarter and year ended December 31, 2023, at which the presentation attached
hereto as Exhibit 99.1 will be used.
The information set forth herein, including the exhibit attached hereto,
shall not be deemed “filed” for purposes of Section 18 of the Securities Exchange Act of 1934, as amended, nor shall
it be deemed incorporated by reference in any filing under the Securities Act of 1933, as amended, except as shall be expressly set forth
by specific reference in any such filing.
| Item 9.01. | Financial
Statements and Exhibits. |
(d) Exhibits.
SIGNATURES
Pursuant to the requirements of the Securities
Exchange Act of 1934, the registrant has duly caused this report to be signed on its behalf by the undersigned hereunto duly authorized.
| Date: |
February 14,
2024 |
CF
INDUSTRIES HOLDINGS, INC. |
| |
|
|
|
| |
|
|
|
| |
|
By: |
/s/ Christopher
D. Bohn |
| |
|
Name: |
Christopher
D. Bohn |
| |
|
Title: |
Executive
Vice President and Chief Operating Officer |
Exhibit 99.1

| 2023 Fourth Quarter
and Full Year
Financial Results
February 14, 2024
NYSE: CF |
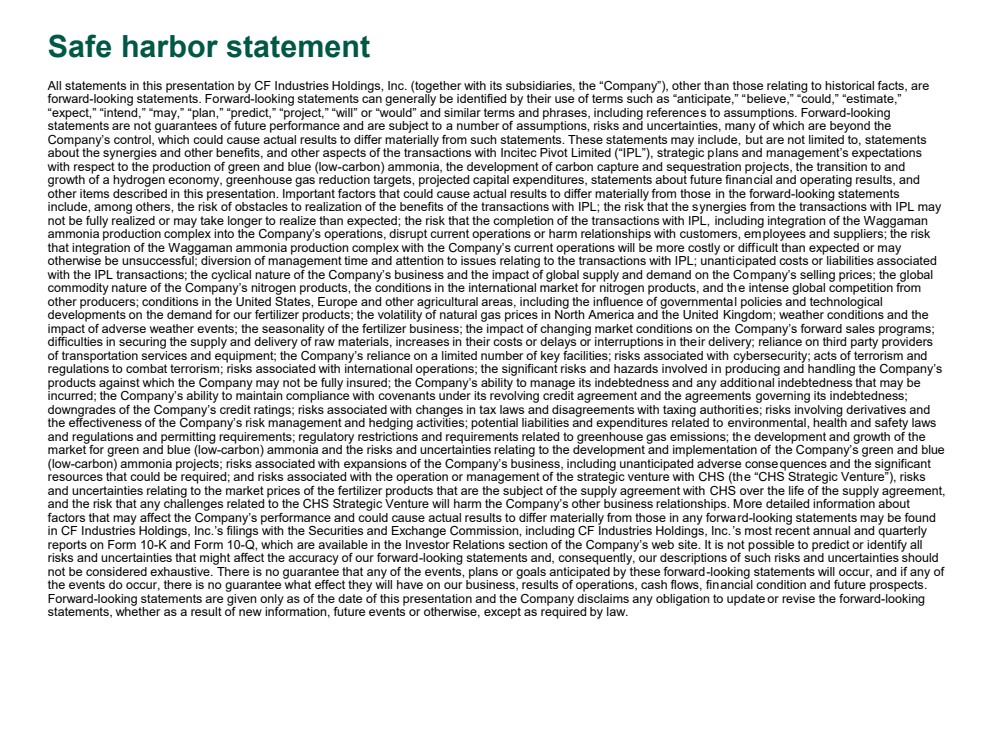
| Safe harbor statement
All statements in this presentation by CF Industries Holdings, Inc. (together with its subsidiaries, the “Company”), other than those relating to historical facts, are
forward-looking statements. Forward-looking statements can generally be identified by their use of terms such as “anticipate,” “believe,” “could,” “estimate,”
“expect,” “intend,” “may,” “plan,” “predict,” “project,” “will” or “would” and similar terms and phrases, including references to assumptions. Forward-looking
statements are not guarantees of future performance and are subject to a number of assumptions, risks and uncertainties, many of which are beyond the
Company’s control, which could cause actual results to differ materially from such statements. These statements may include, but are not limited to, statements
about the synergies and other benefits, and other aspects of the transactions with Incitec Pivot Limited (“IPL”), strategic plans and management’s expectations
with respect to the production of green and blue (low-carbon) ammonia, the development of carbon capture and sequestration projects, the transition to and
growth of a hydrogen economy, greenhouse gas reduction targets, projected capital expenditures, statements about future financial and operating results, and
other items described in this presentation. Important factors that could cause actual results to differ materially from those in the forward-looking statements
include, among others, the risk of obstacles to realization of the benefits of the transactions with IPL; the risk that the synergies from the transactions with IPL may
not be fully realized or may take longer to realize than expected; the risk that the completion of the transactions with IPL, including integration of the Waggaman
ammonia production complex into the Company’s operations, disrupt current operations or harm relationships with customers, employees and suppliers; the risk
that integration of the Waggaman ammonia production complex with the Company’s current operations will be more costly or difficult than expected or may
otherwise be unsuccessful; diversion of management time and attention to issues relating to the transactions with IPL; unanticipated costs or liabilities associated
with the IPL transactions; the cyclical nature of the Company’s business and the impact of global supply and demand on the Company’s selling prices; the global
commodity nature of the Company’s nitrogen products, the conditions in the international market for nitrogen products, and the intense global competition from
other producers; conditions in the United States, Europe and other agricultural areas, including the influence of governmental policies and technological
developments on the demand for our fertilizer products; the volatility of natural gas prices in North America and the United Kingdom; weather conditions and the
impact of adverse weather events; the seasonality of the fertilizer business; the impact of changing market conditions on the Company’s forward sales programs;
difficulties in securing the supply and delivery of raw materials, increases in their costs or delays or interruptions in their delivery; reliance on third party providers
of transportation services and equipment; the Company’s reliance on a limited number of key facilities; risks associated with cybersecurity; acts of terrorism and
regulations to combat terrorism; risks associated with international operations; the significant risks and hazards involved in producing and handling the Company’s
products against which the Company may not be fully insured; the Company’s ability to manage its indebtedness and any additional indebtedness that may be
incurred; the Company’s ability to maintain compliance with covenants under its revolving credit agreement and the agreements governing its indebtedness;
downgrades of the Company’s credit ratings; risks associated with changes in tax laws and disagreements with taxing authorities; risks involving derivatives and
the effectiveness of the Company’s risk management and hedging activities; potential liabilities and expenditures related to environmental, health and safety laws
and regulations and permitting requirements; regulatory restrictions and requirements related to greenhouse gas emissions; the development and growth of the
market for green and blue (low-carbon) ammonia and the risks and uncertainties relating to the development and implementation of the Company’s green and blue
(low-carbon) ammonia projects; risks associated with expansions of the Company’s business, including unanticipated adverse consequences and the significant
resources that could be required; and risks associated with the operation or management of the strategic venture with CHS (the “CHS Strategic Venture”), risks
and uncertainties relating to the market prices of the fertilizer products that are the subject of the supply agreement with CHS over the life of the supply agreement,
and the risk that any challenges related to the CHS Strategic Venture will harm the Company’s other business relationships. More detailed information about
factors that may affect the Company’s performance and could cause actual results to differ materially from those in any forward-looking statements may be found
in CF Industries Holdings, Inc.’s filings with the Securities and Exchange Commission, including CF Industries Holdings, Inc.’s most recent annual and quarterly
reports on Form 10-K and Form 10-Q, which are available in the Investor Relations section of the Company’s web site. It is not possible to predict or identify all
risks and uncertainties that might affect the accuracy of our forward-looking statements and, consequently, our descriptions of such risks and uncertainties should
not be considered exhaustive. There is no guarantee that any of the events, plans or goals anticipated by these forward-looking statements will occur, and if any of
the events do occur, there is no guarantee what effect they will have on our business, results of operations, cash flows, financial condition and future prospects.
Forward-looking statements are given only as of the date of this presentation and the Company disclaims any obligation to update or revise the forward-looking
statements, whether as a result of new information, future events or otherwise, except as required by law. |
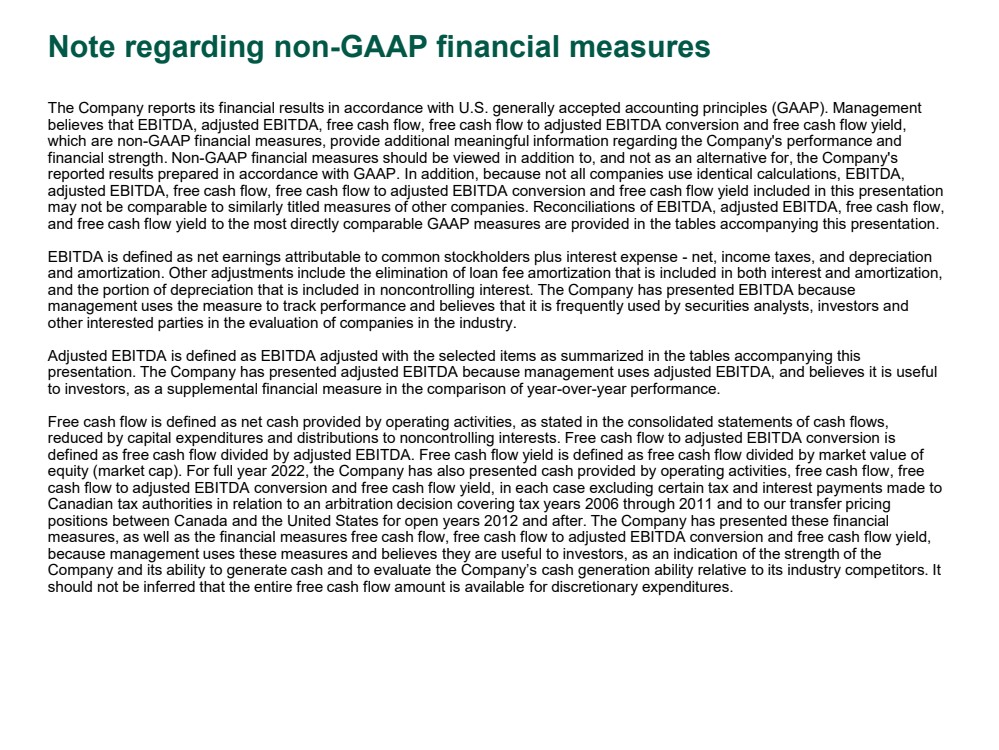
| Note regarding non-GAAP financial measures
The Company reports its financial results in accordance with U.S. generally accepted accounting principles (GAAP). Management
believes that EBITDA, adjusted EBITDA, free cash flow, free cash flow to adjusted EBITDA conversion and free cash flow yield,
which are non-GAAP financial measures, provide additional meaningful information regarding the Company's performance and
financial strength. Non-GAAP financial measures should be viewed in addition to, and not as an alternative for, the Company's
reported results prepared in accordance with GAAP. In addition, because not all companies use identical calculations, EBITDA,
adjusted EBITDA, free cash flow, free cash flow to adjusted EBITDA conversion and free cash flow yield included in this presentation
may not be comparable to similarly titled measures of other companies. Reconciliations of EBITDA, adjusted EBITDA, free cash flow,
and free cash flow yield to the most directly comparable GAAP measures are provided in the tables accompanying this presentation.
EBITDA is defined as net earnings attributable to common stockholders plus interest expense - net, income taxes, and depreciation
and amortization. Other adjustments include the elimination of loan fee amortization that is included in both interest and amortization,
and the portion of depreciation that is included in noncontrolling interest. The Company has presented EBITDA because
management uses the measure to track performance and believes that it is frequently used by securities analysts, investors and
other interested parties in the evaluation of companies in the industry.
Adjusted EBITDA is defined as EBITDA adjusted with the selected items as summarized in the tables accompanying this
presentation. The Company has presented adjusted EBITDA because management uses adjusted EBITDA, and believes it is useful
to investors, as a supplemental financial measure in the comparison of year-over-year performance.
Free cash flow is defined as net cash provided by operating activities, as stated in the consolidated statements of cash flows,
reduced by capital expenditures and distributions to noncontrolling interests. Free cash flow to adjusted EBITDA conversion is
defined as free cash flow divided by adjusted EBITDA. Free cash flow yield is defined as free cash flow divided by market value of
equity (market cap). For full year 2022, the Company has also presented cash provided by operating activities, free cash flow, free
cash flow to adjusted EBITDA conversion and free cash flow yield, in each case excluding certain tax and interest payments made to
Canadian tax authorities in relation to an arbitration decision covering tax years 2006 through 2011 and to our transfer pricing
positions between Canada and the United States for open years 2012 and after. The Company has presented these financial
measures, as well as the financial measures free cash flow, free cash flow to adjusted EBITDA conversion and free cash flow yield,
because management uses these measures and believes they are useful to investors, as an indication of the strength of the
Company and its ability to generate cash and to evaluate the Company’s cash generation ability relative to its industry competitors. It
should not be inferred that the entire free cash flow amount is available for discretionary expenditures. |

| 4
Strong global demand and favorable energy spreads
underpin solid results
(1) See appendix for reconciliations of EBITDA and adjusted EBITDA to the most directly comparable GAAP measures
(2) Free cash flow represents cash provided by operating activities (cash from operations) less capital expenditures less distributions to noncontrolling interest; see
appendix for reconciliation of free cash flow
EBITDA(1)
Net earnings Net earnings per
diluted share
Adjusted EBITDA(1)
$2.76 B
FY 2023
$5.88 B
FY 2022
$7.87
FY 2023
$16.38
FY 2022
2023 Cash from
operations(2)
2023 Free cash flow(2)
Strong cash generation enabled significant return of
capital since the beginning of 2021:
- Invested $1.4 billion in growth projects
- Deployed $2.5 billion to repurchase 31.3 million
shares, ~15% of the shares outstanding
- $2.6 billion remaining in $3 billion share
repurchase authorization
- Returned approximately $900 million to
shareholders through dividends
- Latest dividend 67% higher
Acquisition of Waggaman ammonia facility complete
Advanced our clean energy initiatives
- Progressed low-carbon and green ammonia
projects
• Initial FEED study with Mitsui completed; FID
targeted 2H 2024
• Autothermal reforming (ATR) and flue gas FEED
studies in progress to evaluate optimal carbon
reduction alternatives
• Donaldsonville green ammonia project:
electrolyzer installed, mechanically complete and
commissioning activities underway
- Entered into agreement with bp to purchase
4.4 billion cubic feet of certified natural gas, double
the amount purchased in 2023
$2.76 B
$2.71 B
FY 2023
$5.54 B
FY 2022
$1.53 B
FY 2023
$3.35 B
FY 2022
$1.80 B |
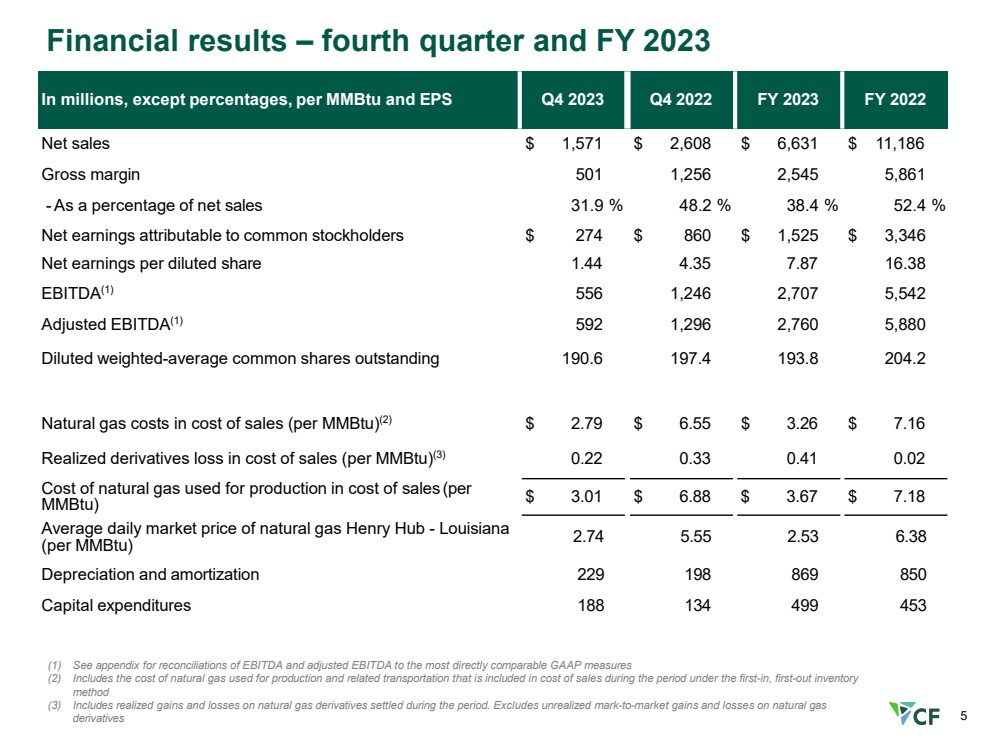
| 5
Financial results – fourth quarter and FY 2023
In millions, except percentages, per MMBtu and EPS Q4 2023 Q4 2022 FY 2023 FY 2022
Net sales $ 1,571 $ 2,608 $ 6,631 $ 11,186
Gross margin 501 1,256 2,545 5,861
-As a percentage of net sales 31.9 % 48.2 % 38.4 % 52.4 %
Net earnings attributable to common stockholders $ 274 $ 860 $ 1,525 $ 3,346
Net earnings per diluted share 1.44 4.35 7.87 16.38
EBITDA(1) 556 1,246 2,707 5,542
Adjusted EBITDA(1) 592 1,296 2,760 5,880
Diluted weighted-average common shares outstanding 190.6 197.4 193.8 204.2
Natural gas costs in cost of sales (per MMBtu)(2) $ 2.79 $ 6.55 $ 3.26 $ 7.16
Realized derivatives loss in cost of sales (per MMBtu)(3) 0.22 0.33 0.41 0.02
Cost of natural gas used for production in cost of sales (per
MMBtu) $ 3.01 $ 6.88 $ 3.67 $ 7.18
Average daily market price of natural gas Henry Hub - Louisiana
(per MMBtu) 2.74 5.55 2.53 6.38
Depreciation and amortization 229 198 869 850
Capital expenditures 188 134 499 453
(1) See appendix for reconciliations of EBITDA and adjusted EBITDA to the most directly comparable GAAP measures
(2) Includes the cost of natural gas used for production and related transportation that is included in cost of sales during the period under the first-in, first-out inventory
method
(3) Includes realized gains and losses on natural gas derivatives settled during the period. Excludes unrealized mark-to-market gains and losses on natural gas
derivatives |

| 6
(1) Source of data: December 19, 2023 CRU Ammonia Database
(2) Represents CF Industries’ historical North American production and CRU’s capacity estimates for CF Industries
(3) Calculated by removing CF Industries’ annual reported production and capacity from the CRU data for all North American ammonia production peer group, Waggaman production/capacity
included for one month only
(4) ~0.9 million tons represents the difference between CF Industries’ actual trailing 5-year average ammonia production of 9.3 million tons at 97% of capacity utilization and the 8.4 million tons CF
Industries would have produced if operated at the 87% CRU North American benchmark excluding CF Industries
Note: CRU North American peer group includes AdvanSix, Austin Powder (US Nitrogen), Carbonair, CF Industries, Chevron, CVR Partners, Dakota Gasification Co, Dyno Nobel, Fortigen, Incitec
Pivot (11 months production/capacity), Koch Industries, LSB Industries, LSB Industries/Cherokee Nitrogen, Mississippi Power, Mosaic, Nutrien, OCI N.V., RenTech Nitrogen, Sherritt International
Corp, Shoreline Chemical, Simplot, Yara International
North American Ammonia Percent of
Capacity Utilization (1)
5-Year Rolling Avg. Percent of Capacity
CF’s 10% greater capacity utilization yields an additional
~0.9 million tons of ammonia annually(4)
Outstanding safety performance drives industry leading
production capacity utilization
0.0
0.5
1.0
1.5
2.0
2.5
3.0
3.5
4.0
4.5
2011 2014 2017 2020 2023
Total injuries per 200,000 work hours
Total Recordable Incident Rate
BLS Fertilizer
Manufacturing
CF
Industries
As of December 31, 2023, the 12-month rolling average
recordable incident rate was 0.36 per 200,000 work hours
CF North
America (2)
North
America
Excl. CF (3)
96% 96%
97%
84%
86%
87%
80%
82%
84%
86%
88%
90%
92%
94%
96%
98%
100%
5 years ending 2021 5 years ending 2022 5 years ending 2023 |

| 7
Consistently strong free cash flow metrics show undervalued
equity
Attractive free cash flow yield and free cash flow to adjusted EBITDA conversion rate suggest
undervalued equity, supporting robust share repurchase program
9.7% 8.9% 9.0%
14.7%
16.7%
12.0%
2018 2019 2020 2021 2022 2023
2018-2023 average yield
Free Cash Flow Yield(1)
FCF/Adj EBITDA
conversion(2) %
67% 57% 55% 79% 47% 65%
56%(3)
19.6%(3)
(1) Represents annual free cash flow divided by market value of equity (market cap) as of December 31st of each year; see appendix for reconciliation of free cash flow to
the most directly comparable GAAP measure and calculation of market cap
(2) Represents annual free cash flow divided by annual adjusted EBITDA; see appendix for reconciliations of free cash flow and adjusted EBITDA to the most directly
comparable GAAP measures
(3) Excluding the impact of $491M of tax and interest payments related to a dispute between Canadian and U.S. tax authorities dating back to the early 2000s; the
Company has filed amended tax returns in the U.S. seeking refunds of related taxes paid
Canada/US
tax matter (3) |
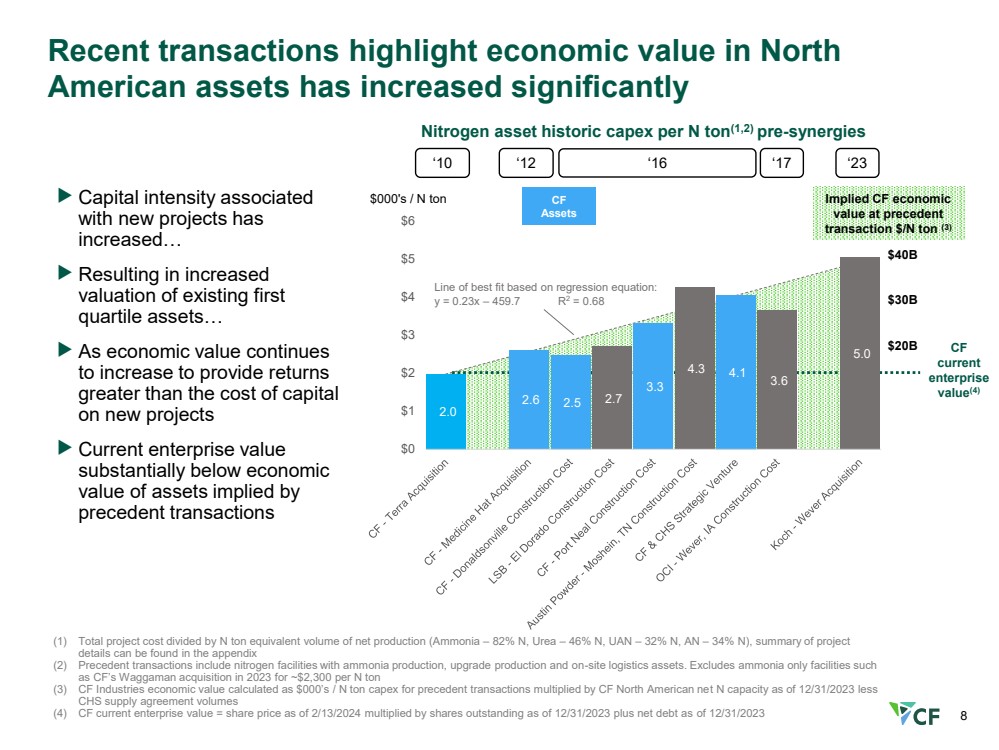
| 8
Recent transactions highlight economic value in North
American assets has increased significantly
Nitrogen asset historic capex per N ton(1,2) pre-synergies
$000's / N ton
‘10 ‘16 ‘17 ‘23
Capital intensity associated
with new projects has
increased…
Resulting in increased
valuation of existing first
quartile assets…
As economic value continues
to increase to provide returns
greater than the cost of capital
on new projects
Current enterprise value
substantially below economic
value of assets implied by
precedent transactions
$40B
$20B
(1) Total project cost divided by N ton equivalent volume of net production (Ammonia – 82% N, Urea – 46% N, UAN – 32% N, AN – 34% N), summary of project
details can be found in the appendix
(2) Precedent transactions include nitrogen facilities with ammonia production, upgrade production and on-site logistics assets. Excludes ammonia only facilities such
as CF’s Waggaman acquisition in 2023 for ~$2,300 per N ton
(3) CF Industries economic value calculated as $000’s / N ton capex for precedent transactions multiplied by CF North American net N capacity as of 12/31/2023 less
CHS supply agreement volumes
(4) CF current enterprise value = share price as of 2/13/2024 multiplied by shares outstanding as of 12/31/2023 plus net debt as of 12/31/2023
$30B
CF
current
enterprise
value(4)
‘12
Line of best fit based on regression equation:
y = 0.23x – 459.7 R2 = 0.68
Implied CF economic
value at precedent
transaction $/N ton (3)
CF
Assets
2.0
2.6 2.5 2.7
3.3
4.3 4.1 3.6
5.0
$0
$1
$2
$3
$4
$5
$6 |
| 9
$1.2
$2.5
$0.9
Total
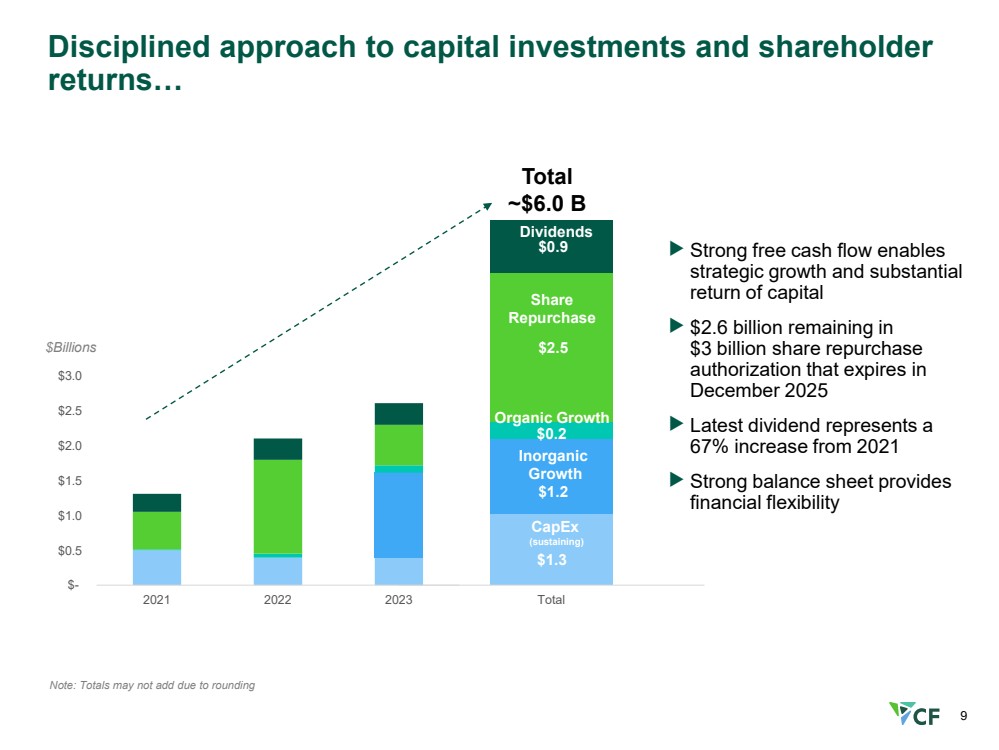
Disciplined approach to capital investments and shareholder
returns…
$Billions
Share
Repurchase
Dividends
Inorganic
Growth
Total
~$6.0 B
CapEx
(sustaining)
Strong free cash flow enables
strategic growth and substantial
return of capital
$2.6 billion remaining in
$3 billion share repurchase
authorization that expires in
December 2025
Latest dividend represents a
67% increase from 2021
Strong balance sheet provides
financial flexibility
Note: Totals may not add due to rounding
Organic Growth
$0.2
$1.3
$-
$0.5
$1.0
$1.5
$2.0
$2.5
$3.0
2021 2022 2023 |
| 10
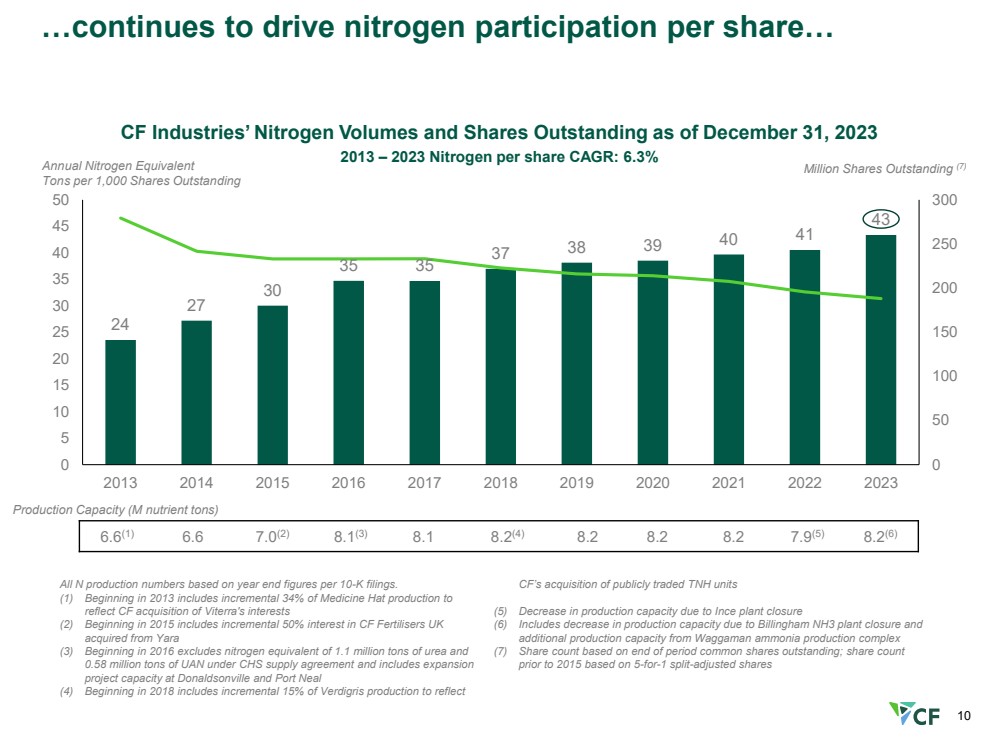
6.6(1) 6.6 7.0(2) 8.1(3) 8.1 8.2(4) 8.2 8.2 8.2 7.9(5) 8.2(6)
All N production numbers based on year end figures per 10-K filings.
(1) Beginning in 2013 includes incremental 34% of Medicine Hat production to
reflect CF acquisition of Viterra's interests
(2) Beginning in 2015 includes incremental 50% interest in CF Fertilisers UK
acquired from Yara
(3) Beginning in 2016 excludes nitrogen equivalent of 1.1 million tons of urea and
0.58 million tons of UAN under CHS supply agreement and includes expansion
project capacity at Donaldsonville and Port Neal
(4) Beginning in 2018 includes incremental 15% of Verdigris production to reflect
CF’s acquisition of publicly traded TNH units
(5) Decrease in production capacity due to Ince plant closure
(6) Includes decrease in production capacity due to Billingham NH3 plant closure and
additional production capacity from Waggaman ammonia production complex
(7) Share count based on end of period common shares outstanding; share count
prior to 2015 based on 5-for-1 split-adjusted shares
Production Capacity (M nutrient tons)
Annual Nitrogen Equivalent
Tons per 1,000 Shares Outstanding
CF Industries’ Nitrogen Volumes and Shares Outstanding as of December 31, 2023
Million Shares Outstanding (7)
2013 – 2023 Nitrogen per share CAGR: 6.3%
24
27
30
35 35
37 38 39 40 41
43
0
50
100
150
200
250
300
0
5
10
15
20
25
30
35
40
45
50
2013 2014 2015 2016 2017 2018 2019 2020 2021 2022 2023
…continues to drive nitrogen participation per share… |
| 11
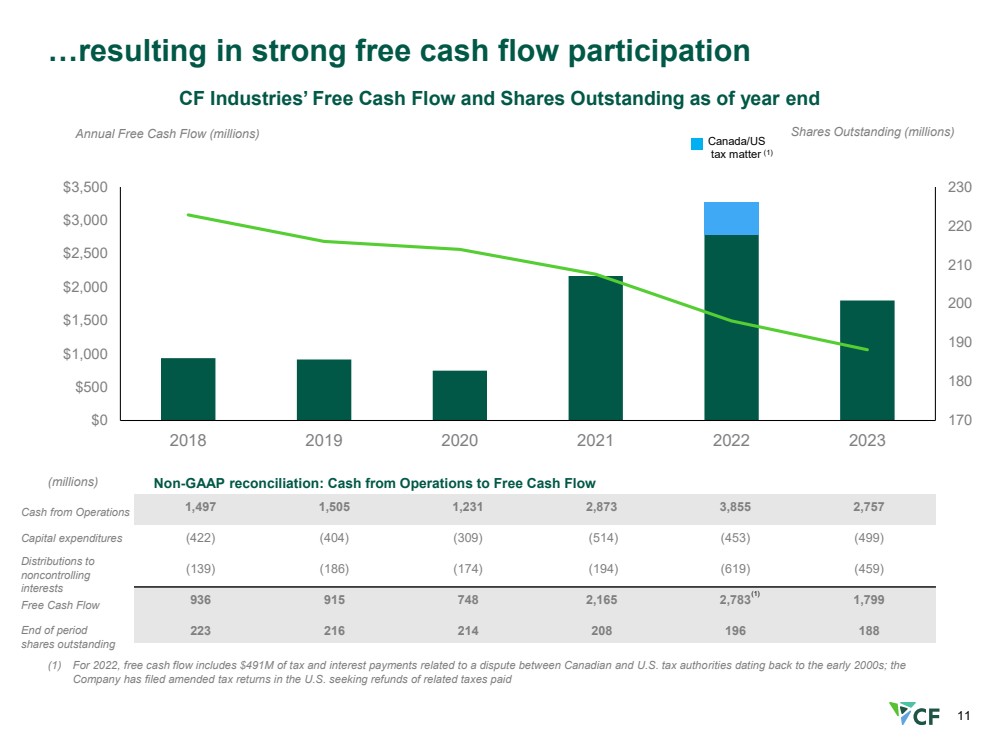
1,497 1,505 1,231 2,873 3,855 2,757
(422) (404) (309) (514) (453) (499)
(139) (186) (174) (194) (619) (459)
936 915 748 2,165 2,783 1,799
223 216 214 208 196 188
Annual Free Cash Flow (millions)
CF Industries’ Free Cash Flow and Shares Outstanding as of year end
Shares Outstanding (millions)
170
180
190
200
210
220
230
$0
$500
$1,000
$1,500
$2,000
$2,500
$3,000
$3,500
2018 2019 2020 2021 2022 2023
…resulting in strong free cash flow participation
End of period
shares outstanding
Cash from Operations
Capital expenditures
Distributions to
noncontrolling
interests
Free Cash Flow
(millions) Non-GAAP reconciliation: Cash from Operations to Free Cash Flow
(1)
(1) For 2022, free cash flow includes $491M of tax and interest payments related to a dispute between Canadian and U.S. tax authorities dating back to the early 2000s; the
Company has filed amended tax returns in the U.S. seeking refunds of related taxes paid
Canada/US
tax matter (1) |
| 12
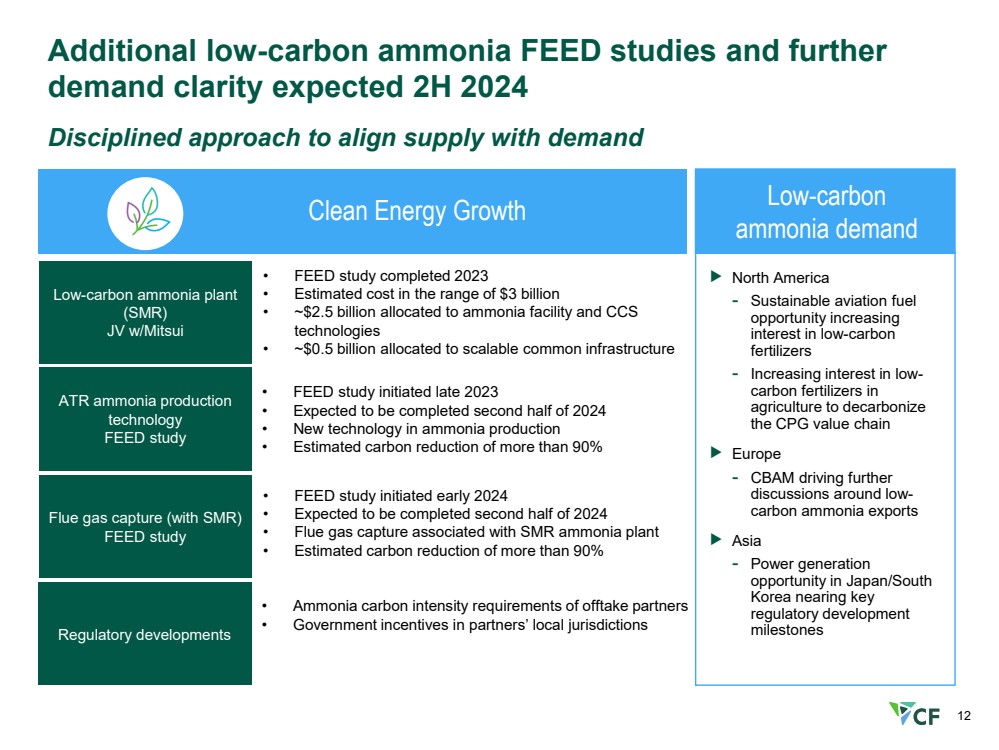
Additional low-carbon ammonia FEED studies and further
demand clarity expected 2H 2024
Disciplined approach to align supply with demand
Clean Energy Growth
Low-carbon ammonia plant
(SMR)
JV w/Mitsui
ATR ammonia production
technology
FEED study
Flue gas capture (with SMR)
FEED study
• FEED study completed 2023
• Estimated cost in the range of $3 billion
• ~$2.5 billion allocated to ammonia facility and CCS
technologies
• ~$0.5 billion allocated to scalable common infrastructure
• FEED study initiated late 2023
• Expected to be completed second half of 2024
• New technology in ammonia production
• Estimated carbon reduction of more than 90%
• FEED study initiated early 2024
• Expected to be completed second half of 2024
• Flue gas capture associated with SMR ammonia plant
• Estimated carbon reduction of more than 90%
Low-carbon
ammonia demand
Regulatory developments
• Ammonia carbon intensity requirements of offtake partners
• Government incentives in partners’ local jurisdictions
North America
- Sustainable aviation fuel
opportunity increasing
interest in low-carbon
fertilizers
- Increasing interest in low-carbon fertilizers in
agriculture to decarbonize
the CPG value chain
Europe
- CBAM driving further
discussions around low-carbon ammonia exports
Asia
- Power generation
opportunity in Japan/South
Korea nearing key
regulatory development
milestones |
| 13
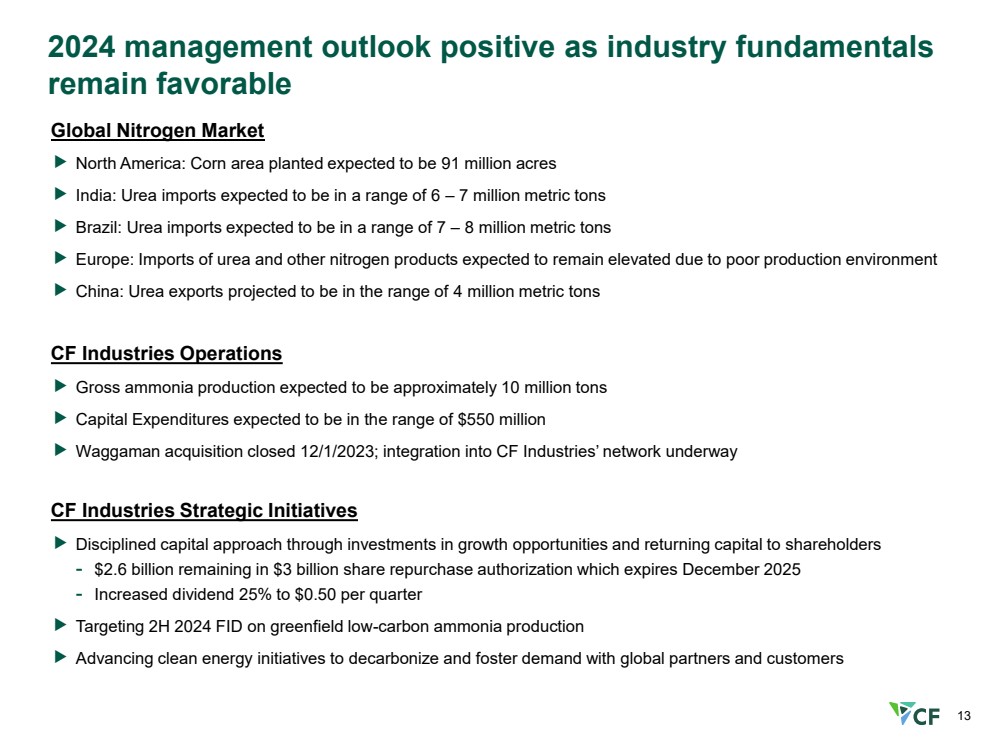
2024 management outlook positive as industry fundamentals
remain favorable
Global Nitrogen Market
North America: Corn area planted expected to be 91 million acres
India: Urea imports expected to be in a range of 6 – 7 million metric tons
Brazil: Urea imports expected to be in a range of 7 – 8 million metric tons
Europe: Imports of urea and other nitrogen products expected to remain elevated due to poor production environment
China: Urea exports projected to be in the range of 4 million metric tons
CF Industries Operations
Gross ammonia production expected to be approximately 10 million tons
Capital Expenditures expected to be in the range of $550 million
Waggaman acquisition closed 12/1/2023; integration into CF Industries’ network underway
CF Industries Strategic Initiatives
Disciplined capital approach through investments in growth opportunities and returning capital to shareholders
- $2.6 billion remaining in $3 billion share repurchase authorization which expires December 2025
- Increased dividend 25% to $0.50 per quarter
Targeting 2H 2024 FID on greenfield low-carbon ammonia production
Advancing clean energy initiatives to decarbonize and foster demand with global partners and customers |
| 14
0
5
10
15
20
25
30
35
40
Jan-23 Jul-23 Jan-24 Jul-24
The data and information provided by Wood Mackenzie should not be interpreted as advice and you should not rely on it for any purpose. You may not copy or use this data and information except as expressly permitted by Wood
Mackenzie in writing. To the fullest extent permitted by law, Wood Mackenzie accepts no responsibility for your use of this data and information except as specified in a written agreement you may have entered into with Wood
Mackenzie for the provision of such data and information
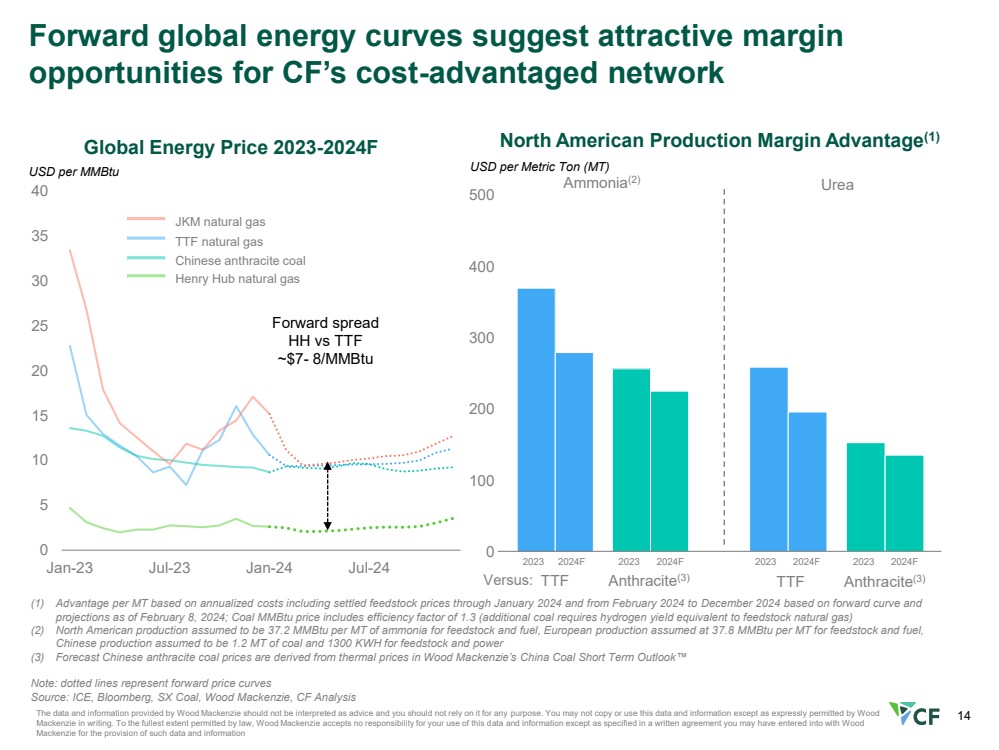
Global Energy Price 2023-2024F
Henry Hub natural gas
TTF natural gas
Chinese anthracite coal
JKM natural gas
USD per MMBtu
0
100
200
300
400
500
USD per Metric Ton (MT)
North American Production Margin Advantage(1)
Ammonia(2) Urea
TTF Anthracite(3)
2023 2024F
Versus: TTF Anthracite(3)
(1) Advantage per MT based on annualized costs including settled feedstock prices through January 2024 and from February 2024 to December 2024 based on forward curve and
projections as of February 8, 2024; Coal MMBtu price includes efficiency factor of 1.3 (additional coal requires hydrogen yield equivalent to feedstock natural gas)
(2) North American production assumed to be 37.2 MMBtu per MT of ammonia for feedstock and fuel, European production assumed at 37.8 MMBtu per MT for feedstock and fuel,
Chinese production assumed to be 1.2 MT of coal and 1300 KWH for feedstock and power
(3) Forecast Chinese anthracite coal prices are derived from thermal prices in Wood Mackenzie’s China Coal Short Term Outlook™
Note: dotted lines represent forward price curves
Source: ICE, Bloomberg, SX Coal, Wood Mackenzie, CF Analysis
2023 2024F 2023 2024F 2023 2024F
Forward global energy curves suggest attractive margin
opportunities for CF’s cost-advantaged network
Forward spread
HH vs TTF
~$7- 8/MMBtu |

| 15
2024 global delivered U.S. Gulf urea cost curve suggests
prices near historic averages
2024 Monthly Delivered U.S. Gulf Urea Cost Curve
2024 Shipments:
17.5M Tons Avg.
Appx. Monthly
Range
Energy (N.G.)
Other Cash
Freight
Estimated 2024 Cost Range: $320-$375
5 10 15 20
Energy
(Coal)
5
Y-axis: USD/st
X-axis: Monthly Production Capacity at 95% Operating Rate, 85% Operating Rate in China, million short tons
Illustrative of seasonal highs
Illustrative of seasonal lows
Source: Industry Publications, CF Analysis
Energy (N.G.)
Other Cash
Freight
Energy
(Coal) |

| Appendix |
| 17
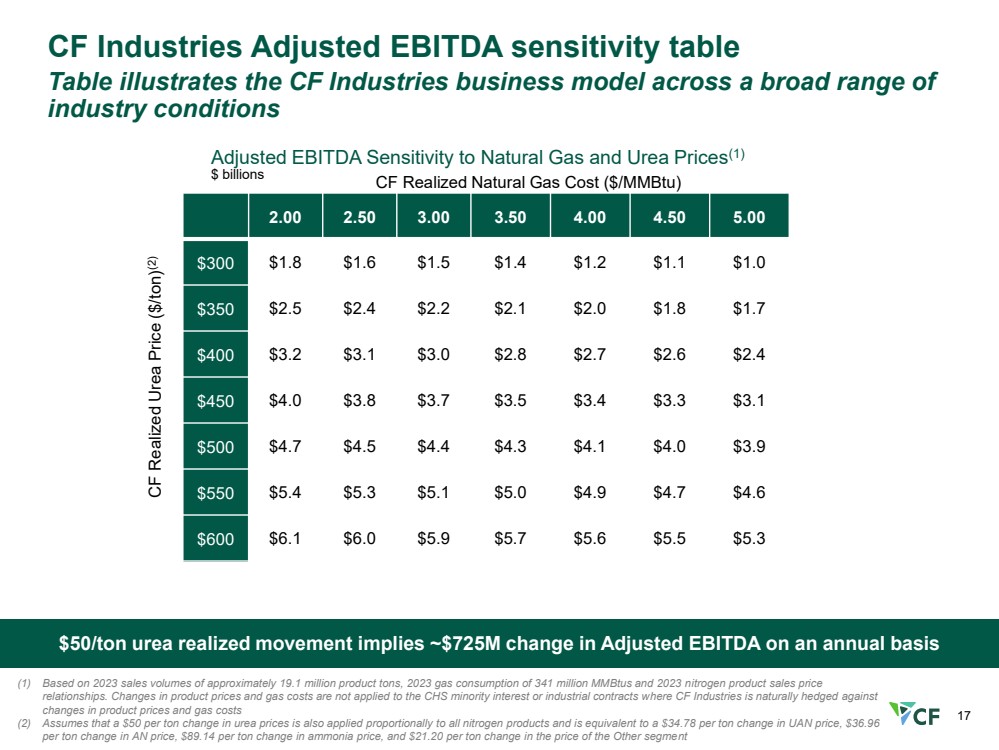
2.00 2.50 3.00 3.50 4.00 4.50 5.00
$300 $1.8 $1.6 $1.5 $1.4 $1.2 $1.1 $1.0
$350 $2.5 $2.4 $2.2 $2.1 $2.0 $1.8 $1.7
$400 $3.2 $3.1 $3.0 $2.8 $2.7 $2.6 $2.4
$450 $4.0 $3.8 $3.7 $3.5 $3.4 $3.3 $3.1
$500 $4.7 $4.5 $4.4 $4.3 $4.1 $4.0 $3.9
$550 $5.4 $5.3 $5.1 $5.0 $4.9 $4.7 $4.6
$600 $6.1 $6.0 $5.9 $5.7 $5.6 $5.5 $5.3
CF Industries Adjusted EBITDA sensitivity table
Table illustrates the CF Industries business model across a broad range of
industry conditions
$50/ton urea realized movement implies ~$725M change in Adjusted EBITDA on an annual basis
(1) Based on 2023 sales volumes of approximately 19.1 million product tons, 2023 gas consumption of 341 million MMBtus and 2023 nitrogen product sales price
relationships. Changes in product prices and gas costs are not applied to the CHS minority interest or industrial contracts where CF Industries is naturally hedged against
changes in product prices and gas costs
(2) Assumes that a $50 per ton change in urea prices is also applied proportionally to all nitrogen products and is equivalent to a $34.78 per ton change in UAN price, $36.96
per ton change in AN price, $89.14 per ton change in ammonia price, and $21.20 per ton change in the price of the Other segment
Adjusted EBITDA Sensitivity to Natural Gas and Urea Prices(1)
$ billions CF Realized Natural Gas Cost ($/MMBtu)
CF Realized Urea Price ($/ton)(2) |
| 18
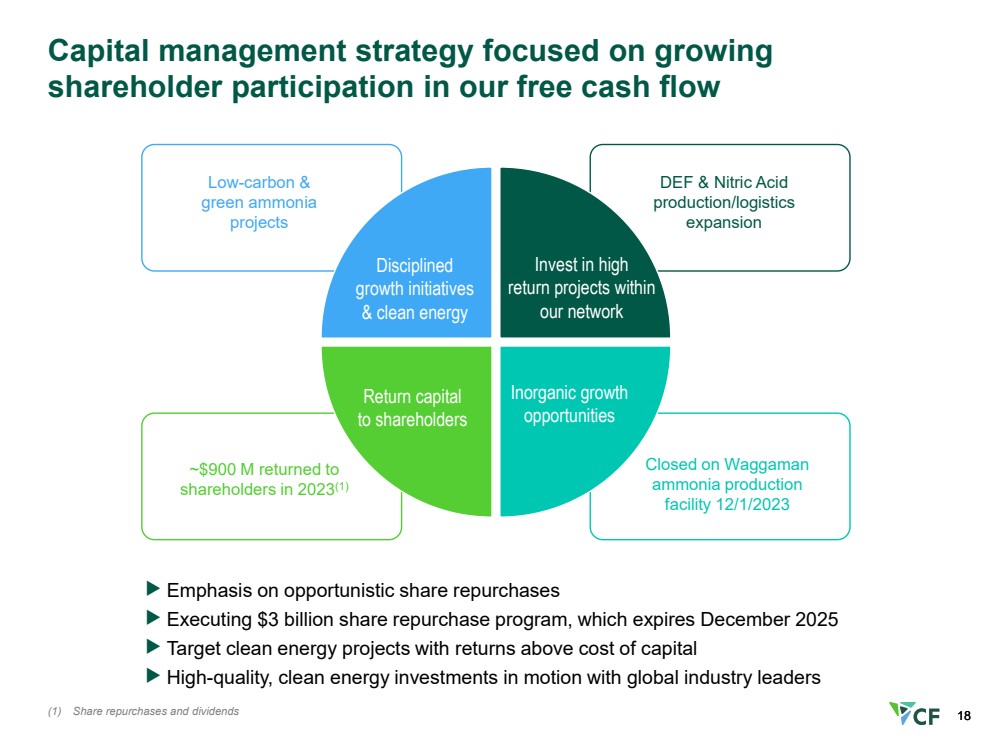
Capital management strategy focused on growing
shareholder participation in our free cash flow
Emphasis on opportunistic share repurchases
Executing $3 billion share repurchase program, which expires December 2025
Target clean energy projects with returns above cost of capital
High-quality, clean energy investments in motion with global industry leaders
~$900 M returned to
shareholders in 2023(1)
Closed on Waggaman
ammonia production
facility 12/1/2023
Low-carbon &
green ammonia
projects
DEF & Nitric Acid
production/logistics
expansion
Return capital
to shareholders
Inorganic growth
opportunities
Invest in high
return projects within
our network
Disciplined
growth initiatives
& clean energy
18 (1) Share repurchases and dividends |

| 19
Advancing decarbonization through significant progress on
strategic initiatives
Clean Energy
Growth
Purchased natural
gas certified by MiQ
Donaldsonville
green ammonia
Donaldsonville
CCS low-carbon ammonia
Engineering
activities ongoing
Low-carbon ammonia plant
(SMR w/CCS)
FEED study
FID targeted
2H 2024
Flue gas capture
FEED study
Clean ammonia industry
demand milestones
Potential supply of
low-carbon
ammonia into Asia
PROJECTS
ATR ammonia
production technology
FEED study
Decarbonization
Inorganic Growth
Closed 12/1/2023
Waggaman ammonia
production facility
Expected
completion
2H 2024
2025 project
start-up
Purchased 2.2 BCF Purchased 4.4 BCF
• European CBAM
• NH3 marine engine
commercialization
JERA: first commercial
co-fire test at Hekinan
coal fired power plant
Initial FEED study
completed
Estimated completion of
greenfield low-carbon
ammonia facility
(~4 years from FID)
Commissioning
activities underway
MOUs signed between
CF, JERA, POSCO &
LOTTE |

| 20
Global grain stocks-to-use expected to approach five-year
average by end of the 2024 growing season
(1) Crop futures prices represent Marketing Year (September – August) average daily settlement of the front month future contracts for 2011/12 through 2022/23. 2023/24F
represents actual futures settlements through January 16, 2024, and the forward curve through August 2024.
Source: USDA, CME, CF Analysis
Global Coarse Grains Stocks-to-Use Ratio
vs Corn Futures Prices(1)
Percent
$0
$1
$2
$3
$4
$5
$6
$7
0%
2%
4%
6%
8%
10%
12%
14%
16%
World ex-China
Crop Futures Price (RHS)
USD per Bushel
Global Oilseeds Stocks-to-Use Ratio vs
Soybean Futures Prices
Percent
$0
$2
$4
$6
$8
$10
$12
$14
$16
0%
5%
10%
15%
20%
25%
30%
World ex-China
Crop Futures Price (RHS)
USD per Bushel |
| 21
0
2
4
6
8
10
2019 2020 2021 2022 2023 2024F
0
2
4
6
8
10
2019 2020 2021 2022 2023 2024F
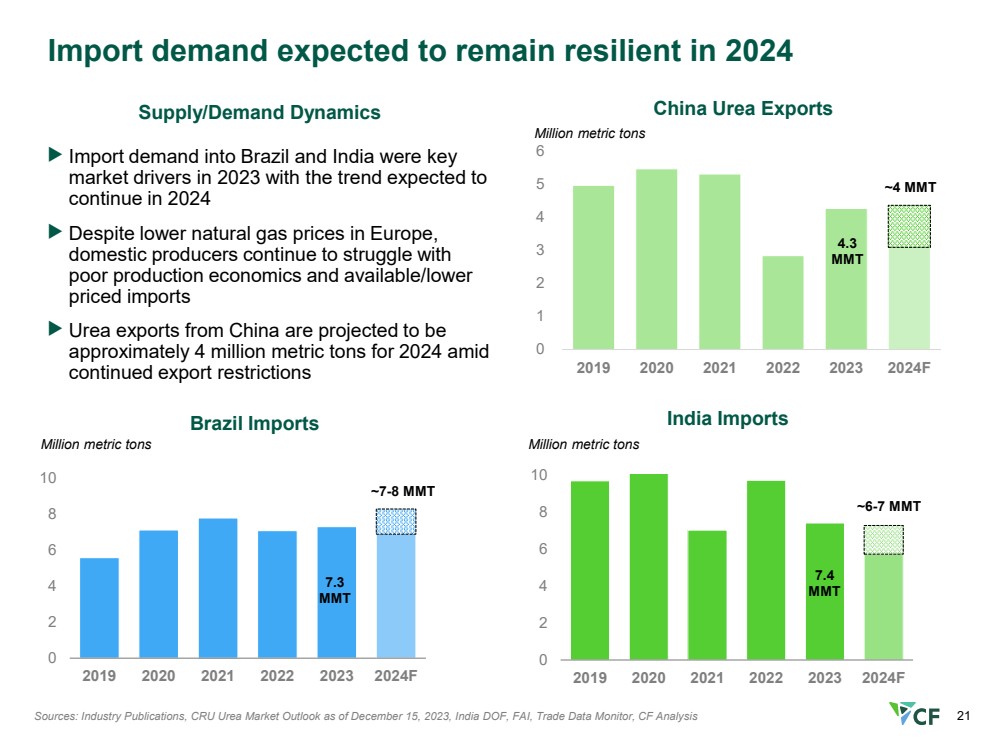
Import demand expected to remain resilient in 2024
Sources: Industry Publications, CRU Urea Market Outlook as of December 15, 2023, India DOF, FAI, Trade Data Monitor, CF Analysis
India Imports
Million metric tons
Brazil Imports
Million metric tons
Supply/Demand Dynamics
7.3
MMT
0
1
2
3
4
5
6
2019 2020 2021 2022 2023 2024F
China Urea Exports
Million metric tons
7.4
MMT
4.3
MMT
Import demand into Brazil and India were key
market drivers in 2023 with the trend expected to
continue in 2024
Despite lower natural gas prices in Europe,
domestic producers continue to struggle with
poor production economics and available/lower
priced imports
Urea exports from China are projected to be
approximately 4 million metric tons for 2024 amid
continued export restrictions
~6-7 MMT
~4 MMT
~7-8 MMT |

| 22
North American Nitrogen Precedent Transactions
Project FID
Year
Completion
Year
Total Cost
$M
Net N Volume
000's $000's / N
North American Nitrogen Assets
CF - Terra Acquisition 2010 2010 4,800 2,414 2.0
CF - Medicine Hat Acquisition 2012 2012 900 346 2.6
CF - Donaldsonville Construction Cost 2012 2016 2,643 1,067 2.5
LSB - El Dorado Construction Cost 2012 2016 830 308 2.7
CF - Port Neal Construction Cost 2012 2016 2,557 772 3.3
OCI - Wever, IA Construction Cost 2017 2017 2,600 713 3.6
Austin Powder - Mosheim, TN Construction Cost 2016 2016 225 53 4.3
CF & CHS Strategic Venture 2016 2016 2,800 689 4.1
Koch - Wever Acquisition 2023 2024 3,600 713 5.0 |
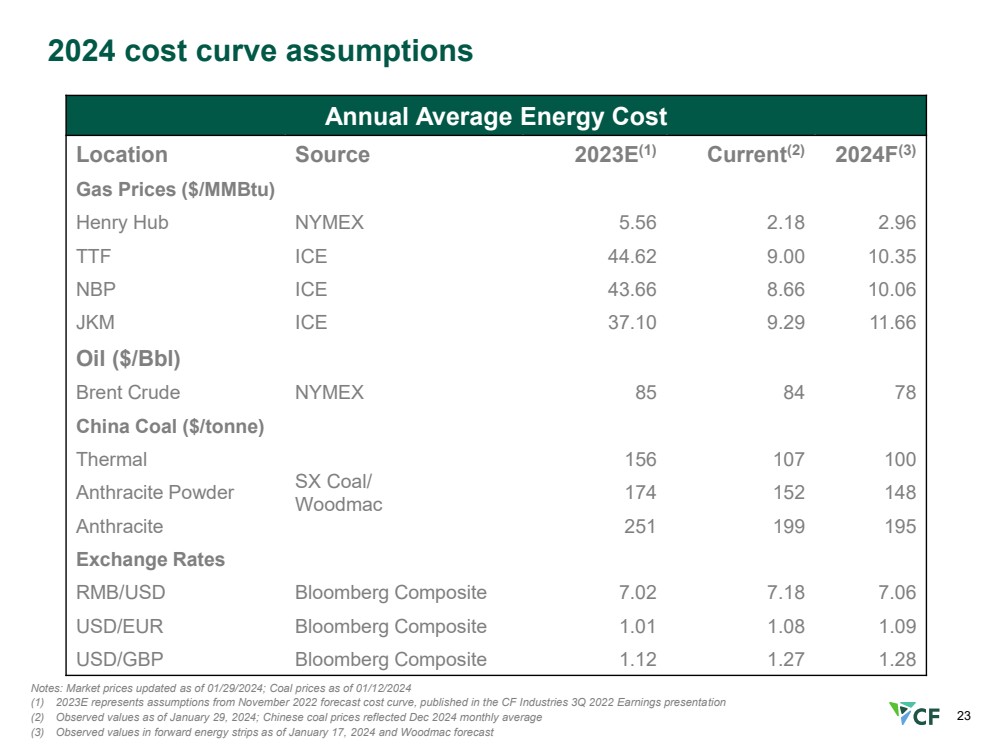
| 23
Annual Average Energy Cost
Location Source 2023E(1) Current(2) 2024F(3)
Gas Prices ($/MMBtu)
Henry Hub NYMEX 5.56 2.18 2.96
TTF ICE 44.62 9.00 10.35
NBP ICE 43.66 8.66 10.06
JKM ICE 37.10 9.29 11.66
Oil ($/Bbl)
Brent Crude NYMEX 85 84 78
China Coal ($/tonne)
Thermal
SX Coal/
Woodmac
156 107 100
Anthracite Powder 174 152 148
Anthracite 251 199 195
Exchange Rates
RMB/USD Bloomberg Composite 7.02 7.18 7.06
USD/EUR Bloomberg Composite 1.01 1.08 1.09
USD/GBP Bloomberg Composite 1.12 1.27 1.28
Notes: Market prices updated as of 01/29/2024; Coal prices as of 01/12/2024
(1) 2023E represents assumptions from November 2022 forecast cost curve, published in the CF Industries 3Q 2022 Earnings presentation
(2) Observed values as of January 29, 2024; Chinese coal prices reflected Dec 2024 monthly average
(3) Observed values in forward energy strips as of January 17, 2024 and Woodmac forecast
2024 cost curve assumptions |

| 24
Non-GAAP: reconciliation of net earnings to EBITDA and
adjusted EBITDA
In millions Q4 2023 Q4 2022 FY 2023 FY 2022
Net earnings $ 352 $ 1,009 $ 1,838 $ 3,937
Less: Net earnings attributable to noncontrolling interest (78) (149) (313) (591)
Net earnings attributable to common stockholders 274 860 1,525 3,346
Interest (income) expense – net (8) (34) (8) 279
Income tax provision 84 245 410 1,158
Depreciation and amortization 229 198 869 850
Less other adjustments:
Depreciation and amortization in noncontrolling interest (22) (22) (85) (87)
Loan fee amortization(1) (1) (1) (4) (4)
EBITDA $ 556 $ 1,246 $ 2,707 $ 5,542
Unrealized net mark-to-market loss (gain) on natural gas
derivatives
(Gain) loss on foreign currency transactions, including
intercompany loans
U.K. long-lived and intangible asset impairment
U.K. operations restructuring
Acquisition and integration costs
Impairment of equity method investment in PLNL
26 80 (39) 41
(5) (10) — 28
— — — 239
3 1 10 19
12 — 39 —
— — 43 —
Unrealized gain on embedded derivative liability — (14) — (14)
Pension settlement loss and curtailments gains—net — (7) — 17
Loss on debt extinguishment — — — 8
Total adjustments 36 50 53 338
Adjusted EBITDA $ 592 $ 1,296 $ 2,760 $ 5,880
(1) Loan fee amortization is included in both interest expense – net and depreciation and amortization |
| 25
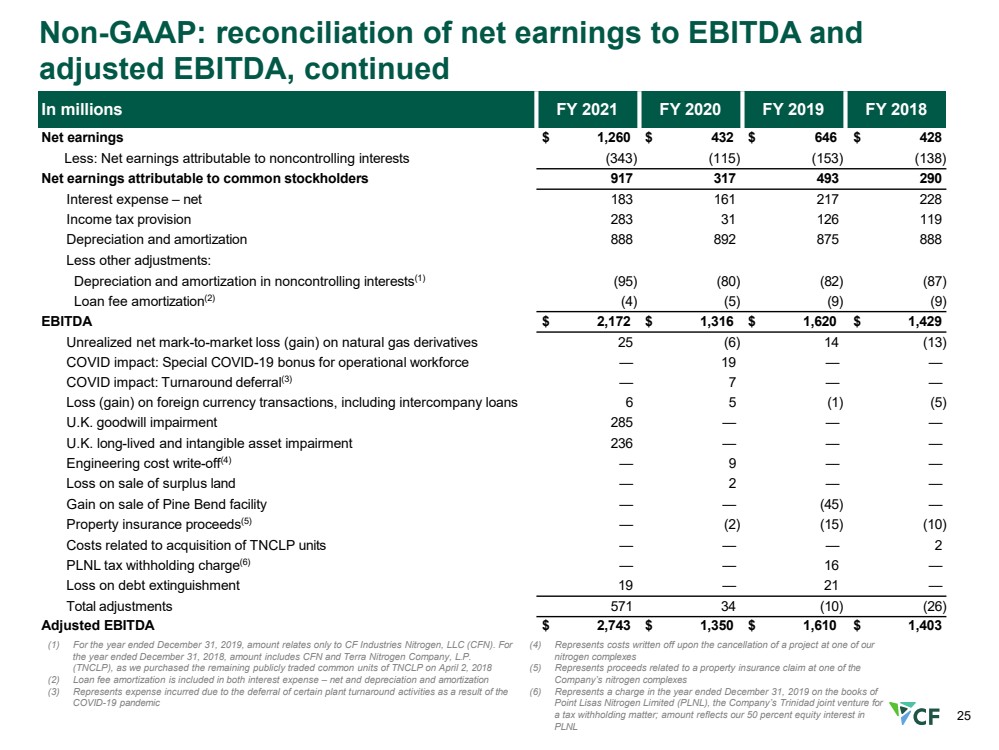
Non-GAAP: reconciliation of net earnings to EBITDA and
adjusted EBITDA, continued
In millions FY 2021 FY 2020 FY 2019 FY 2018
Net earnings $ 1,260 $ 432 $ 646 $ 428
Less: Net earnings attributable to noncontrolling interests (343) (115) (153) (138)
Net earnings attributable to common stockholders 917 317 493 290
Interest expense – net 183 161 217 228
Income tax provision 283 31 126 119
Depreciation and amortization 888 892 875 888
Less other adjustments:
Depreciation and amortization in noncontrolling interests(1) (95) (80) (82) (87)
Loan fee amortization(2) (4) (5) (9) (9)
EBITDA $ 2,172 $ 1,316 $ 1,620 $ 1,429
Unrealized net mark-to-market loss (gain) on natural gas derivatives 25 (6) 14 (13)
COVID impact: Special COVID-19 bonus for operational workforce — 19 — —
COVID impact: Turnaround deferral(3) — 7 — —
Loss (gain) on foreign currency transactions, including intercompany loans 6 5 (1) (5)
U.K. goodwill impairment 285 — — —
U.K. long-lived and intangible asset impairment 236 — — —
Engineering cost write-off(4) — 9 — —
Loss on sale of surplus land — 2 — —
Gain on sale of Pine Bend facility — — (45) —
Property insurance proceeds(5) — (2) (15) (10)
Costs related to acquisition of TNCLP units — — — 2
PLNL tax withholding charge(6) — — 16 —
Loss on debt extinguishment 19 — 21 —
Total adjustments 571 34 (10) (26)
Adjusted EBITDA $ 2,743 $ 1,350 $ 1,610 $ 1,403
(1) For the year ended December 31, 2019, amount relates only to CF Industries Nitrogen, LLC (CFN). For
the year ended December 31, 2018, amount includes CFN and Terra Nitrogen Company, L.P.
(TNCLP), as we purchased the remaining publicly traded common units of TNCLP on April 2, 2018
(2) Loan fee amortization is included in both interest expense – net and depreciation and amortization
(3) Represents expense incurred due to the deferral of certain plant turnaround activities as a result of the
COVID-19 pandemic
(4) Represents costs written off upon the cancellation of a project at one of our
nitrogen complexes
(5) Represents proceeds related to a property insurance claim at one of the
Company’s nitrogen complexes
(6) Represents a charge in the year ended December 31, 2019 on the books of
Point Lisas Nitrogen Limited (PLNL), the Company’s Trinidad joint venture for
a tax withholding matter; amount reflects our 50 percent equity interest in
PLNL |
| 26
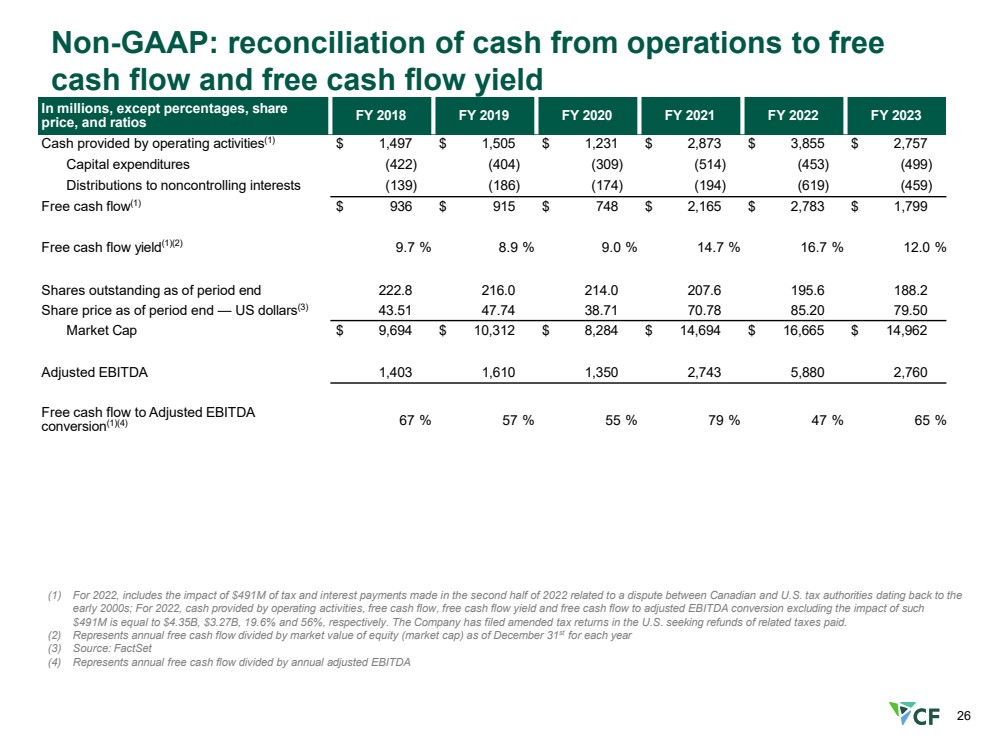
Non-GAAP: reconciliation of cash from operations to free
cash flow and free cash flow yield
In millions, except percentages, share
price, and ratios FY 2018 FY 2019 FY 2020 FY 2021 FY 2022 FY 2023
Cash provided by operating activities(1) $ 1,497 $ 1,505 $ 1,231 $ 2,873 $ 3,855 $ 2,757
Capital expenditures (422) (404) (309) (514) (453) (499)
Distributions to noncontrolling interests (139) (186) (174) (194) (619) (459)
Free cash flow(1) $ 936 $ 915 $ 748 $ 2,165 $ 2,783 $ 1,799
Free cash flow yield(1)(2) 9.7 % 8.9 % 9.0 % 14.7 % 16.7 % 12.0 %
Shares outstanding as of period end 222.8 216.0 214.0 207.6 195.6 188.2
Share price as of period end — US dollars(3) 43.51 47.74 38.71 70.78 85.20 79.50
Market Cap $ 9,694 $ 10,312 $ 8,284 $ 14,694 $ 16,665 $ 14,962
Adjusted EBITDA 1,403 1,610 1,350 2,743 5,880 2,760
Free cash flow to Adjusted EBITDA
conversion(1)(4) 67 % 57 % 55 % 79 % 47 % 65 %
(1) For 2022, includes the impact of $491M of tax and interest payments made in the second half of 2022 related to a dispute between Canadian and U.S. tax authorities dating back to the
early 2000s; For 2022, cash provided by operating activities, free cash flow, free cash flow yield and free cash flow to adjusted EBITDA conversion excluding the impact of such
$491M is equal to $4.35B, $3.27B, 19.6% and 56%, respectively. The Company has filed amended tax returns in the U.S. seeking refunds of related taxes paid.
(2) Represents annual free cash flow divided by market value of equity (market cap) as of December 31st for each year
(3) Source: FactSet
(4) Represents annual free cash flow divided by annual adjusted EBITDA |
| X |
- DefinitionBoolean flag that is true when the XBRL content amends previously-filed or accepted submission.
| Name: |
dei_AmendmentFlag |
| Namespace Prefix: |
dei_ |
| Data Type: |
xbrli:booleanItemType |
| Balance Type: |
na |
| Period Type: |
duration |
|
| X |
- DefinitionFor the EDGAR submission types of Form 8-K: the date of the report, the date of the earliest event reported; for the EDGAR submission types of Form N-1A: the filing date; for all other submission types: the end of the reporting or transition period. The format of the date is YYYY-MM-DD.
| Name: |
dei_DocumentPeriodEndDate |
| Namespace Prefix: |
dei_ |
| Data Type: |
xbrli:dateItemType |
| Balance Type: |
na |
| Period Type: |
duration |
|
| X |
- DefinitionThe type of document being provided (such as 10-K, 10-Q, 485BPOS, etc). The document type is limited to the same value as the supporting SEC submission type, or the word 'Other'.
| Name: |
dei_DocumentType |
| Namespace Prefix: |
dei_ |
| Data Type: |
dei:submissionTypeItemType |
| Balance Type: |
na |
| Period Type: |
duration |
|
| X |
- DefinitionAddress Line 1 such as Attn, Building Name, Street Name
| Name: |
dei_EntityAddressAddressLine1 |
| Namespace Prefix: |
dei_ |
| Data Type: |
xbrli:normalizedStringItemType |
| Balance Type: |
na |
| Period Type: |
duration |
|
| X |
- Definition
+ References
+ Details
| Name: |
dei_EntityAddressCityOrTown |
| Namespace Prefix: |
dei_ |
| Data Type: |
xbrli:normalizedStringItemType |
| Balance Type: |
na |
| Period Type: |
duration |
|
| X |
- DefinitionCode for the postal or zip code
| Name: |
dei_EntityAddressPostalZipCode |
| Namespace Prefix: |
dei_ |
| Data Type: |
xbrli:normalizedStringItemType |
| Balance Type: |
na |
| Period Type: |
duration |
|
| X |
- DefinitionName of the state or province.
| Name: |
dei_EntityAddressStateOrProvince |
| Namespace Prefix: |
dei_ |
| Data Type: |
dei:stateOrProvinceItemType |
| Balance Type: |
na |
| Period Type: |
duration |
|
| X |
- DefinitionA unique 10-digit SEC-issued value to identify entities that have filed disclosures with the SEC. It is commonly abbreviated as CIK. Reference 1: http://www.xbrl.org/2003/role/presentationRef
-Publisher SEC
-Name Exchange Act
-Number 240
-Section 12
-Subsection b-2
| Name: |
dei_EntityCentralIndexKey |
| Namespace Prefix: |
dei_ |
| Data Type: |
dei:centralIndexKeyItemType |
| Balance Type: |
na |
| Period Type: |
duration |
|
| X |
- DefinitionIndicate if registrant meets the emerging growth company criteria. Reference 1: http://www.xbrl.org/2003/role/presentationRef
-Publisher SEC
-Name Exchange Act
-Number 240
-Section 12
-Subsection b-2
| Name: |
dei_EntityEmergingGrowthCompany |
| Namespace Prefix: |
dei_ |
| Data Type: |
xbrli:booleanItemType |
| Balance Type: |
na |
| Period Type: |
duration |
|
| X |
- DefinitionCommission file number. The field allows up to 17 characters. The prefix may contain 1-3 digits, the sequence number may contain 1-8 digits, the optional suffix may contain 1-4 characters, and the fields are separated with a hyphen.
| Name: |
dei_EntityFileNumber |
| Namespace Prefix: |
dei_ |
| Data Type: |
dei:fileNumberItemType |
| Balance Type: |
na |
| Period Type: |
duration |
|
| X |
- DefinitionTwo-character EDGAR code representing the state or country of incorporation.
| Name: |
dei_EntityIncorporationStateCountryCode |
| Namespace Prefix: |
dei_ |
| Data Type: |
dei:edgarStateCountryItemType |
| Balance Type: |
na |
| Period Type: |
duration |
|
| X |
- DefinitionThe exact name of the entity filing the report as specified in its charter, which is required by forms filed with the SEC. Reference 1: http://www.xbrl.org/2003/role/presentationRef
-Publisher SEC
-Name Exchange Act
-Number 240
-Section 12
-Subsection b-2
| Name: |
dei_EntityRegistrantName |
| Namespace Prefix: |
dei_ |
| Data Type: |
xbrli:normalizedStringItemType |
| Balance Type: |
na |
| Period Type: |
duration |
|
| X |
- DefinitionThe Tax Identification Number (TIN), also known as an Employer Identification Number (EIN), is a unique 9-digit value assigned by the IRS. Reference 1: http://www.xbrl.org/2003/role/presentationRef
-Publisher SEC
-Name Exchange Act
-Number 240
-Section 12
-Subsection b-2
| Name: |
dei_EntityTaxIdentificationNumber |
| Namespace Prefix: |
dei_ |
| Data Type: |
dei:employerIdItemType |
| Balance Type: |
na |
| Period Type: |
duration |
|
| X |
- DefinitionLocal phone number for entity.
| Name: |
dei_LocalPhoneNumber |
| Namespace Prefix: |
dei_ |
| Data Type: |
xbrli:normalizedStringItemType |
| Balance Type: |
na |
| Period Type: |
duration |
|
| X |
- DefinitionBoolean flag that is true when the Form 8-K filing is intended to satisfy the filing obligation of the registrant as pre-commencement communications pursuant to Rule 13e-4(c) under the Exchange Act. Reference 1: http://www.xbrl.org/2003/role/presentationRef
-Publisher SEC
-Name Exchange Act
-Number 240
-Section 13e
-Subsection 4c
| Name: |
dei_PreCommencementIssuerTenderOffer |
| Namespace Prefix: |
dei_ |
| Data Type: |
xbrli:booleanItemType |
| Balance Type: |
na |
| Period Type: |
duration |
|
| X |
- DefinitionBoolean flag that is true when the Form 8-K filing is intended to satisfy the filing obligation of the registrant as pre-commencement communications pursuant to Rule 14d-2(b) under the Exchange Act. Reference 1: http://www.xbrl.org/2003/role/presentationRef
-Publisher SEC
-Name Exchange Act
-Number 240
-Section 14d
-Subsection 2b
| Name: |
dei_PreCommencementTenderOffer |
| Namespace Prefix: |
dei_ |
| Data Type: |
xbrli:booleanItemType |
| Balance Type: |
na |
| Period Type: |
duration |
|
| X |
- DefinitionTitle of a 12(b) registered security. Reference 1: http://www.xbrl.org/2003/role/presentationRef
-Publisher SEC
-Name Exchange Act
-Number 240
-Section 12
-Subsection b
| Name: |
dei_Security12bTitle |
| Namespace Prefix: |
dei_ |
| Data Type: |
dei:securityTitleItemType |
| Balance Type: |
na |
| Period Type: |
duration |
|
| X |
- DefinitionName of the Exchange on which a security is registered. Reference 1: http://www.xbrl.org/2003/role/presentationRef
-Publisher SEC
-Name Exchange Act
-Number 240
-Section 12
-Subsection d1-1
| Name: |
dei_SecurityExchangeName |
| Namespace Prefix: |
dei_ |
| Data Type: |
dei:edgarExchangeCodeItemType |
| Balance Type: |
na |
| Period Type: |
duration |
|
| X |
- DefinitionBoolean flag that is true when the Form 8-K filing is intended to satisfy the filing obligation of the registrant as soliciting material pursuant to Rule 14a-12 under the Exchange Act. Reference 1: http://www.xbrl.org/2003/role/presentationRef
-Publisher SEC
-Name Exchange Act
-Section 14a
-Number 240
-Subsection 12
| Name: |
dei_SolicitingMaterial |
| Namespace Prefix: |
dei_ |
| Data Type: |
xbrli:booleanItemType |
| Balance Type: |
na |
| Period Type: |
duration |
|
| X |
- DefinitionTrading symbol of an instrument as listed on an exchange.
| Name: |
dei_TradingSymbol |
| Namespace Prefix: |
dei_ |
| Data Type: |
dei:tradingSymbolItemType |
| Balance Type: |
na |
| Period Type: |
duration |
|
| X |
- DefinitionBoolean flag that is true when the Form 8-K filing is intended to satisfy the filing obligation of the registrant as written communications pursuant to Rule 425 under the Securities Act. Reference 1: http://www.xbrl.org/2003/role/presentationRef
-Publisher SEC
-Name Securities Act
-Number 230
-Section 425
| Name: |
dei_WrittenCommunications |
| Namespace Prefix: |
dei_ |
| Data Type: |
xbrli:booleanItemType |
| Balance Type: |
na |
| Period Type: |
duration |
|
CF Industries (NYSE:CF)
Graphique Historique de l'Action
De Avr 2024 à Mai 2024

CF Industries (NYSE:CF)
Graphique Historique de l'Action
De Mai 2023 à Mai 2024
