Dreyfus Strategic Municipals, Inc. (LEO) Releases Fund Statistics
05 Mars 2010 - 7:18PM
Business Wire
The following information for Dreyfus Strategic Municipals, Inc.
(NYSE: LEO) is as of December 31, 2009 (except as otherwise noted),
and is subject to change at any time. All percentages are based on
total net assets (except as otherwise noted).
Dreyfus Strategic Municipals,
Inc.
Symbol : “LEO”
As of December 31, 2009
Portfolio Overview
Sector Distribution (Top Five)
Subject to AMT 17% Health Care 11% Number of Issues 165
Transportation 9% Average maturity 18yrs Electric 7% Effective
maturity 8yrs General Obligation 6% Duration 5.45 Housing 6%
Average rating* A+
Average coupon
5.85%
State Distribution (Top Five)
Average dollar price $101.159 California 12% Pre-refunded
securities 16% Texas 10% Leverage 36% Michigan 7% Wisconsin 5%
Market Summary
Illinois 5% Market price range (52 weeks) $8.11-$5.76 NAV range (52
weeks) $8.52-$6.69
Call Schedule (Through 2014)
Market price $8.08 2010 14% NAV $8.26 2011 4% Premium/(discount)
(-2.179) 2012 9% Average daily volume (52 weeks) 85,521 2013 3%
Shares outstanding 60.77MM 2014 2% Net assets $786,696,254
Market Yield and Dividend
Rate**
Portfolio Quality*
Current market yield 5.81% AAA 38% Current dividend rate $0.049 AA
11% A 21% BBB 19% Below investment grade 11%
* The percentages of these ratings
arecalculated based on the higher of Standard &Poor's or
Moody's for individual issues and on aDreyfus rating for non-rated
issues.
**The market yield is calculated
by multiplyingthe current market distribution by 12 and dividingby
the market price per share of $8.08 as ofDecember 31, 2009. Past
Performance is no guaranteeof future performance and price and
yield will vary.
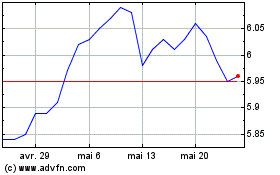
BNY Mellon Strategic Mun... (NYSE:LEO)
Graphique Historique de l'Action
De Juin 2024 à Juil 2024

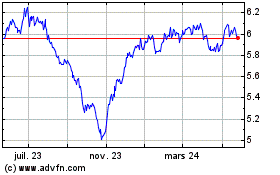
BNY Mellon Strategic Mun... (NYSE:LEO)
Graphique Historique de l'Action
De Juil 2023 à Juil 2024
