Barings
Participation
Investors
| |
|
|
| |
Report
for the
Nine
Months Ended September 30, 2020

|
|
| |
Beginning
on January 1, 2021, as permitted by regulations adopted by the U.S. Securities and Exchange Commission, paper copies of the
Fund’s annual and semi-annual shareholder reports will no longer be sent by mail, unless you specifically request paper
copies of the reports. Instead, the reports will be made available on the Fund’s website http://www.barings.com/MPV,
and you will be notified by mail each time a report is posted and provided with a website link to access the report.
If you
already elected to receive shareholder reports electronically, you will not be affected by this change and you need not
take any action. You may elect to receive shareholder reports and other communications from the Fund electronically
anytime by contacting your financial intermediary (such as a broker-dealer or bank).
You may
elect to receive all future reports in paper free of charge. If you invest through a financial intermediary, you can
contact your financial intermediary to request that you continue to receive paper copies of your shareholder reports.
Your election to receive reports in paper will apply to all funds held in your account. |
|
| |
|
|
| |
|
|
| |
|
|
|
Adviser
Barings LLC
300 S Tryon St., Suite 2500
Charlotte, NC 28202
Independent Registered
Public Accounting Firm
KPMG LLP
Boston, Massachusetts 02110
Counsel to the Trust
Ropes & Gray LLP
Boston, Massachusetts 02111
Custodian
State Street Bank and Trust Company
Boston, Massachusetts 02110
Transfer Agent &
Registrar
DST Systems, Inc.
P.O. Box 219086
Kansas City, Missouri 64121-9086
1-800-647-7374
Internet Website
www.barings.com/mpv
 |
Barings Participation Investors
c/o Barings LLC
300 S Tryon St., Suite 2500
Charlotte, NC 28202
1-866-399-1516 |
Investment Objective and
Policy
Barings Participation Investors (the “Trust”)
is a closed-end management investment company, first offered to the public in 1988, whose shares are traded on the New York Stock
Exchange under the trading symbol “MPV”. The Trust’s share price can be found in the financial section of most
newspapers under either the New York Stock Exchange listings or Closed-End Fund Listings.
The Trust’s investment objective
is to maintain a portfolio of securities providing a current yield and, when available, an opportunity for capital gains. The Trust’s
principal investments are privately placed, below investment grade, long-term debt obligations including bank loans and mezzanine
debt instruments. Such private placement securities may, in some cases, be accompanied by equity features such as common stock,
preferred stock, warrants, conversion rights, or other equity features. The Trust typically purchases these investments, which
are not publicly tradable, directly from their issuers in private placement transactions. These investments are typically made
to small or middle market companies. In addition, the Trust may invest, subject to certain limitations, in marketable debt securities
(including high yield and/or investment grade securities) and marketable common stock. Below investment grade or high yield securities
have predominantly speculative characteristics with respect to the capacity of the issuer to pay interest and repay capital.
The Trust distributes substantially all
of its net income to shareholders each year. Accordingly, the Trust pays dividends to shareholders in January, May, August, and
November. All registered shareholders are automatically enrolled in the Dividend Reinvestment and Cash Purchase Plan unless cash
distributions are requested.
Form N-PORT
The Trust files its complete schedule
of portfolio holdings with the U.S. Securities and Exchange Commission (“SEC”) for the first and third quarters
of each fiscal year on part F of Form N-PORT. This information is available (i) on the SEC’s website at http://www.sec.gov;
and (ii) at the SEC’s Public Reference Room in Washington, DC (which information on their operation may be obtained
by calling 1-800-SEC-0330). A complete schedule of portfolio holdings as of each quarter-end is available upon request by calling,
toll-free, 866-399-1516.
Proxy Voting Policies &
Procedures; Proxy Voting Record
The Trustees of the Trust have delegated
proxy voting responsibilities relating to the voting of securities held by the Trust to Barings LLC (“Barings”). A
description of Barings’ proxy voting policies and procedures is available (1) without charge, upon request, by calling,
toll-free 866-399-1516; (2) on the Trust’s website at www.barings.com/mpv; and (3) on the SEC’s website at
http://www.sec.gov. Information regarding how the Trust voted proxies relating to portfolio securities during the most recent 12-month
period ended June 30 is available (1) on the Trust’s website at www.barings.com/mpv; and (2) on the SEC’s
website at http://www.sec.gov.
Legal Matters
The Trust has entered into contractual
arrangements with an investment adviser, transfer agent and custodian (collectively “service providers”) who each provide
services to the Trust. Shareholders are not parties to, or intended beneficiaries of, these contractual arrangements, and these
contractual arrangements are not intended to create any shareholder right to enforce them against the service providers or to seek
any remedy under them against the service providers, either directly or on behalf of the Trust.
Under the Trust’s Bylaws, any claims
asserted against or on behalf of the Trust, including claims against Trustees and officers must be brought in courts located within
the Commonwealth of Massachusetts.
The Trust’s registration statement
and this shareholder report are not contracts between the Trust and its shareholders and do not give rise to any contractual rights
or obligations or any shareholder rights other than any rights conferred explicitly by federal or state securities laws that may
not be waived.

Barings Participation Investors
TO OUR SHAREHOLDERS
October 31, 2020
We are pleased to present the September 30,
2020 Quarterly Report of Barings Participation Investors (the “Trust”).
The Board of Trustees declared a quarterly
dividend of $0.20 per share, payable on November 13, 2020 to shareholders of record on November 2, 2020. The Trust paid
a $0.20 per share dividend for the preceding quarter. The Trust earned $0.20 per share of net investment income for the third quarter
of 2020, compared to $0.19 per share in the previous quarter.
During the third quarter, the net assets
of the Trust increased to $141,525,877 or $13.35 per share compared to 137,787,791 or $13.00 per share on June 30, 2020. This
translates to a 4.3% total return for the quarter, based on the change in the Trust’s net assets assuming the reinvestment
of all dividends. Longer term, the Trust returned 2.8%, 5.5%, 7.6%, 9.8% and 11.5% for the 1, 3, 5, 10, and 25-year periods, respectively,
based on the change in the Trust’s net assets assuming the reinvestment of all dividends.
The Trust’s share price decreased
13.3% during the quarter, from $12.75 per share as of June 30, 2020 to $10.86 per share as of September 30, 2020. The
Trust’s market price of $10.86 per share equates to an 18.7% discount to the September 30, 2020 net asset value per
share of $13.35. The Trust’s average quarter-end premium for the 3, 5 and 10-year periods was 6.4%, 5.9% and 7.7%, respectively.
U.S. fixed income markets, as approximated by the Bloomberg Barclays U.S. Corporate High Yield Index and the Credit Suisse Leverage
Loan Index, increased 4.6% and 4.1% for the quarter, respectively.
The Trust closed three new private placement
investments and five add-on investments to existing portfolio companies during the third quarter. The total amount invested by
the Trust in these transactions was $2,678,395. Of note, the new platform investments were floating rate term loans and the add-on
investments were three floating rate term loans, one subordinated note with an equity co-investment and one small equity co-investment.
Middle-market merger and acquisition activity
improved during the third quarter of 2020, however, year-to-date sponsored lending volume is down 39% compared to 2019 (Refinitiv).
M&A activity has improved as local, state, and federal governments across North America focused on working towards reopening
their communities. There have been further positive developments with communities reopening and encouraging news regarding potential
vaccines. However, there have been some disappointing developments with cases re-emerging and new restrictions being put in place
in some communities. To be clear, navigating the effect of COVID-19 introduces levels of portfolio stress. During the third quarter,
two mezzanine debt issuers deferred their quarterly interest payment and were placed on non-accrual. Yet, the new non-accrual investments
represents less than $0.01 per share in quarterly income for the Trust and, on a go forward basis, we would expect to see improved
credit performance based on our increasing mix of first lien senior secure loans.
To manage through this unique period of
investment volatility, we continue to be selective in our investment choices and maintain our underwriting discipline throughout
multiple cycles. First, the Trust has been investing in first lien senior secured loans in high-quality companies in defensive
sectors and is well-diversified by industry. This was a strategy put in place over three years ago and has provided strong risk
adjusted returns for the Trust given their senior position in the capital stack. As of September 30, 2020, 45.2% of the Trust’s
investment portfolio is in first lien senior secured loans compared to 2.7% as of December 31, 2017. These investments have
proven resilient to date and their management teams now have the benefit of having a wealth of knowledge to draw upon from working
in such unique and challenging circumstances. Second, we hold meaningful investment liquidity based on the Trust’s combined
available cash balance and short-term investments of $15.834.717 or 10.1%, and a low leverage profile at 0.11x as of September 30,
2020. Strong liquidity also provides ample support to our current portfolio companies to the extent the duration of COVID-19 related
stress extends. Third, we continue to be selective in pruning our equity investments and reinvesting the proceeds into first lien
senior secured investments further driving investment income. As always, the Trust continues to benefit from strong relationships
with our financial sponsor partners which provides clear benefits including potential access to additional capital if needed, strategic
thinking alongside their management teams and high-quality and timely information which is only available in a private market setting.
This allows us to work constructively together and maximize the portfolio companies’ long-term health and value.
(Continued)
In closing, we believe it is always appropriate
to provide views on the Trust’s long-term dividend policy which is to say, ‘we believe that long-term dividends
should be a reflection of long-term core earnings power, even when core earnings power is lower as a result of a higher quality
asset mix’. The Trust’s recently announced dividend of $0.20 per share was in line with the most recently reported
net investment income of $0.20 per share. That said, as we continue to both (1) deploy the Trust’s excess liquidity
and (2) seek opportunities to shift the Trust’s non-yielding equity investments to senior secured loans, we expect long-term
earnings power to meet the dividend distribution.
Thank you for your continued interest
in and support of Barings Participation Investors.
Sincerely,

Christina Emery
President
Portfolio Composition as of 09/30/20*
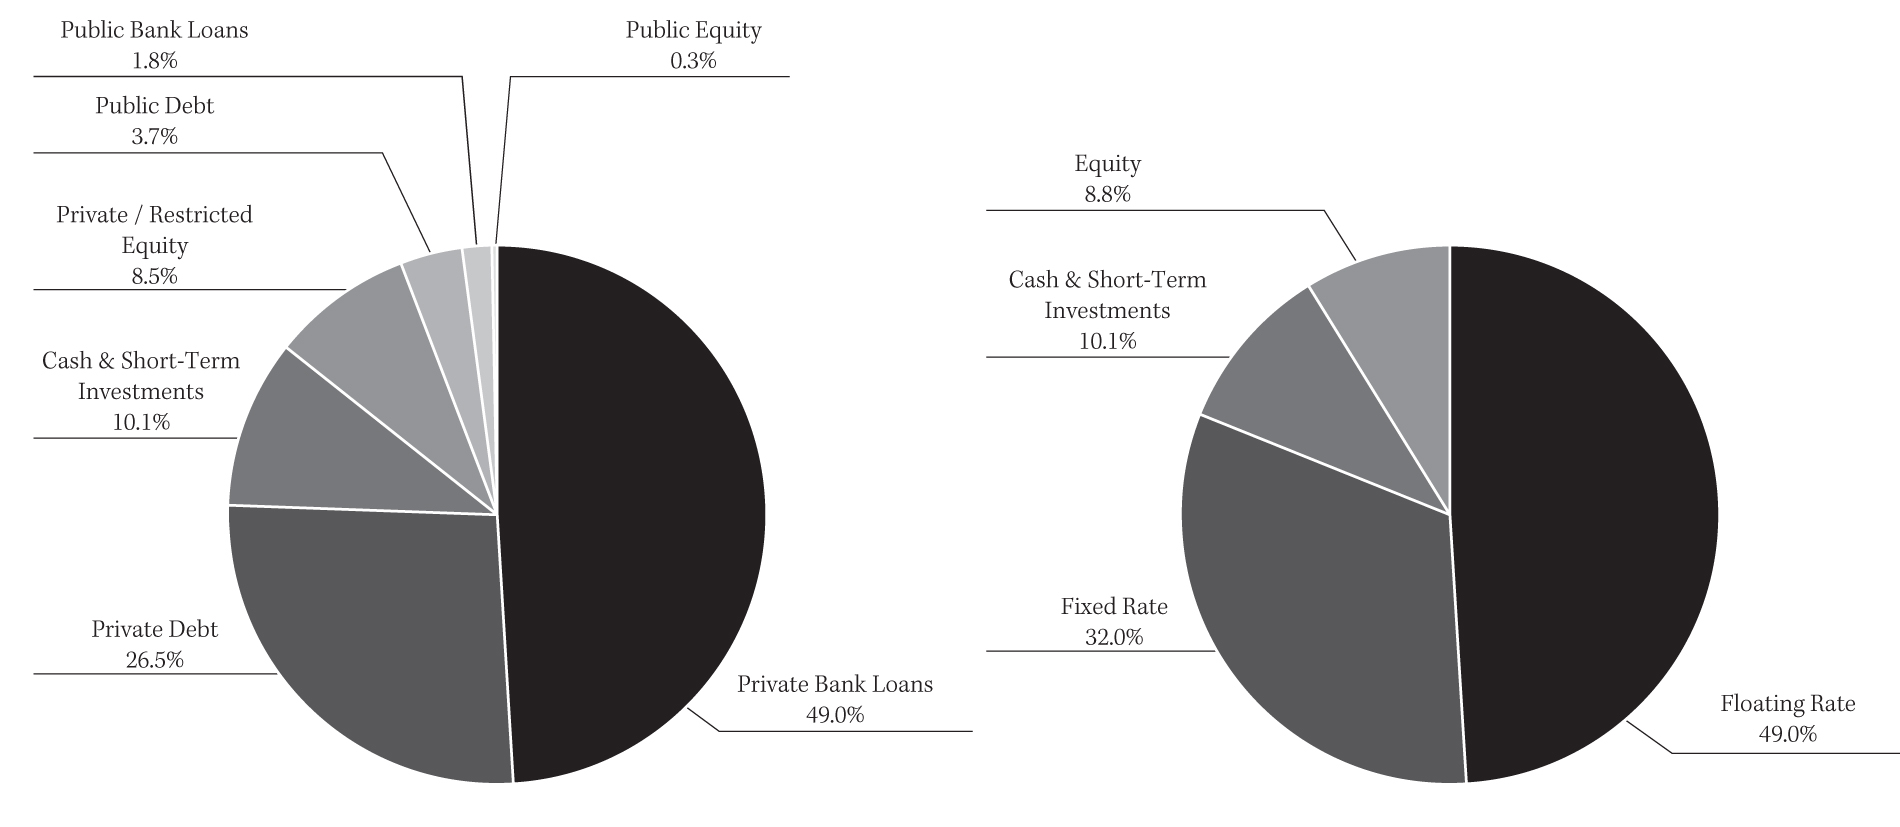
* Based
on market value of total investments (including cash)
Cautionary Notice:
Certain statements contained in this report may be “forward looking” statements. Investors are cautioned not to place
undue reliance on forward-looking statements, which speak only as of the date on which they are made and which reflect management’s
current estimates, projections, expectations or beliefs, and which are subject to risks and uncertainties that may cause actual
results to differ materially. These statements are subject to change at any time based upon economic, market or other conditions
and may not be relied upon as investment advice or an indication of the Trust’s trading intent. References to specific securities
are not recommendations of such securities, and may not be representative of the Trust’s current or future investments.
We undertake no obligation to publicly update forward looking statements, whether as a result of new information, future events,
or otherwise.
Barings Participation Investors
CONSOLIDATED STATEMENT OF ASSETS AND LIABILITIES
September 30, 2020
(Unaudited)
| | |
| |
| Assets: | |
| |
| | |
| |
Investments
(See Consolidated Schedule of Investments) | |
| | |
| | |
| | |
Corporate restricted securities at fair value
(Cost - $119,433,917) | |
$ | 114,171,616 | |
| | |
| | |
Corporate restricted securities at market value
(Cost - $17,014,760) | |
| 17,093,068 | |
| | |
| | |
Corporate public securities at market value
(Cost - $10,441,620) | |
| 9,147,024 | |
| | |
| | |
| Short-term securities at amortized cost | |
| 5,997,873 | |
| | |
| | |
| | |
| | |
| Total investments (Cost - $152,887,552) | |
| 146,409,581 | |
| | |
| | |
| Cash | |
| 9,836,844 | |
| | |
| | |
| Interest receivable | |
| 1,185,931 | |
| | |
| | |
| Receivable for investments sold | |
| 567,271 | |
| | |
| | |
| Other assets | |
| 46,097 | |
| | |
| | |
| Total assets | |
| 158,045,724 | |
| | |
| | |
| | |
| | |
| Liabilities: | |
| | |
| | |
| | |
| Note payable | |
| 15,000,000 | |
| | |
| | |
| Payable for investments purchased | |
| 1,054,700 | |
| | |
| | |
| Investment advisory fee payable | |
| 318,433 | |
| | |
| | |
| Interest payable | |
| 27,267 | |
| | |
| | |
| Accrued expenses | |
| 119,447 | |
| | |
| | |
| Total liabilities | |
| 16,519,847 | |
| | |
| | |
| Commitments and Contingencies (See Note 8) | |
| | |
| | |
| | |
| Total net assets | |
$ | 141,525,877 | |
| | |
| | |
| Net Assets: | |
| | |
| | |
| | |
| Common shares, par value $.01 per share | |
$ | 106,017 | |
| | |
| | |
| Additional paid-in capital | |
| 142,250,117 | |
| | |
| | |
| Total distributable earnings | |
| (830,257 | ) |
| | |
| | |
| Total
net assets | |
$ | 141,525,877 | |
| | |
| | |
| Common
shares issued and outstanding (14,787,750 authorized) | |
| 10,601,700 | |
| | |
| | |
| Net
asset value per share | |
$ | 13.35 | |
See Notes to Consolidated
Financial Statements
CONSOLIDATED STATEMENT OF OPERATIONS
For the nine months ended September 30,
2020
(Unaudited)
| | |
| |
| Investment Income: | |
| | |
| | |
| | |
| Interest | |
$ | 8,625,726 | |
| | |
| | |
| Dividends | |
| 135,628 | |
| | |
| | |
| Other | |
| 103,297 | |
| | |
| | |
| Total investment income | |
| 8,864,651 | |
| | |
| | |
| | |
| | |
| Expenses: | |
| | |
| | |
| | |
| Investment advisory fees | |
| 938,650 | |
| | |
| | |
| Interest | |
| 460,125 | |
| | |
| | |
| Trustees’ fees and expenses | |
| 273,500 | |
| | |
| | |
| Professional fees | |
| 220,694 | |
| | |
| | |
| Custodian fees | |
| 18,000 | |
| | |
| | |
| Other | |
| 18,587 | |
| | |
| | |
| Total expenses | |
| 1,929,556 | |
| | |
| | |
| Investment income - net | |
| 6,935,095 | |
| | |
| | |
| | |
| | |
| Net realized and unrealized loss on investments: | |
| | |
| | |
| | |
| Net realized loss on investments before taxes | |
| (476,316 | ) |
| | |
| | |
| Income tax expense | |
| (348,194 | ) |
| | |
| | |
| Net realized loss on investments after taxes | |
| (824,510 | ) |
| | |
| | |
| Net increase (decrease) in unrealized appreciation (depreciation) of investments before taxes | |
| (6,653,701 | ) |
| | |
| | |
| Net increase (decrease) in unrealized appreciation (depreciation) of investments after taxes | |
| (6,653,701 | ) |
| | |
| | |
| Net loss on investments | |
| (7,478,211 | ) |
| | |
| | |
| Net decrease in net assets resulting from operations | |
$ | (543,116 | ) |
See Notes to Consolidated
Financial Statements
Barings Participation Investors
CONSOLIDATED STATEMENT OF CASH FLOWS
For the nine months ended September 30,
2020
(Unaudited)
| Net increase in cash: | |
| | |
| | |
| | |
| Cash flows from operating activities: | |
| | |
| | |
| | |
| Purchases/Proceeds/Maturities from short-term portfolio securities, net | |
$ | (144,297 | ) |
| | |
| | |
| Purchases of portfolio securities | |
| (26,364,212 | ) |
| | |
| | |
| Proceeds from disposition of portfolio securities | |
| 24,786,284 | |
| | |
| | |
| Interest, dividends and other income received | |
| 8,007,972 | |
| | |
| | |
| Interest expense paid | |
| (460,125 | ) |
| | |
| | |
| Operating expenses paid | |
| (1,476,868 | ) |
| | |
| | |
| Income taxes paid | |
| (762,033 | ) |
| | |
| | |
| Net cash provided by operating activities | |
| 3,586,721 | |
| | |
| | |
| Cash flows from financing activities: | |
| | |
| | |
| | |
| Cash dividends paid from net investment income | |
| (7,099,232 | ) |
| | |
| | |
| Receipts for shares issued on reinvestment of dividends | |
| 227,533 | |
| | |
| | |
| Net cash used for financing activities | |
| (6,871,699 | ) |
| | |
| | |
| Net decrease in cash | |
| (3,284,978 | ) |
| | |
| | |
| Cash - beginning of period | |
| 13,121,822 | |
| | |
| | |
| Cash - end of period | |
$ | 9,836,844 | |
| | |
| | |
Reconciliation of net decrease in net assets to
net cash used for operating activities: | |
| | |
| | |
| | |
| Net decrease in net assets resulting from operations | |
$ | (543,116 | ) |
| | |
| | |
| Decrease in investments | |
| 4,217,491 | |
| | |
| | |
| Increase in interest receivable | |
| (214,308 | ) |
| | |
| | |
| Increase in receivable for investments sold | |
| (462,648 | ) |
| | |
| | |
| Increase in other assets | |
| (44,122 | ) |
| | |
| | |
| Increase in payable for investments purchased | |
| 1,054,700 | |
| | |
| | |
| Decrease in investment advisory fee payable | |
| (10,252 | ) |
| | |
| | |
| Decrease in tax payable | |
| (413,839 | ) |
| | |
| | |
| Increase in accrued expenses | |
| 2,815 | |
| | |
| | |
| Total adjustments to net assets from operations | |
| 4,129,837 | |
| | |
| | |
| Net cash provided by operating activities | |
$ | 3,586,721 | |
See Notes to Consolidated
Financial Statements
CONSOLIDATED STATEMENTS OF CHANGES IN NET
ASSETS
For the nine months ended September 30,
2020
(Unaudited)
| | |
| For the nine
months ended
9/30/2020
(Unaudited) | | |
| For the
year ended
12/31/2019 | |
| Increase / (decrease) in net assets: | |
| | | |
| | |
| | |
| | | |
| | |
| Operations: | |
| | | |
| | |
| | |
| | | |
| | |
| Investment income - net | |
$ | 6,935,095 | | |
$ | 10,575,402 | |
| | |
| | | |
| | |
| Net realized loss on investments after taxes | |
| (824,510 | ) | |
| 769,899 | |
| | |
| | | |
| | |
| Net change in unrealized appreciation (depreciation) of investments after taxes | |
| (6,653,701 | ) | |
| 6,464,660 | |
| | |
| | | |
| | |
| Net (decrease) / increase in net assets resulting from operations | |
| (543,116 | ) | |
| 17,809,961 | |
| | |
| | | |
| | |
| | |
| | | |
| | |
| Increase from common shares issued on reinvestment of dividends | |
| | | |
| | |
| | |
| | | |
| | |
| Common shares issued (2020 - 14,472; 2019 - 60,330) | |
| 227,533 | | |
| 933,680 | |
| | |
| | | |
| | |
| | |
| | | |
| | |
| Dividends to shareholders from: | |
| | | |
| | |
| | |
| | | |
| | |
| Distributable earnings to Common Stock Shareholders (2020 - $0.40 per share; 2019 - $1.08 per share) | |
| (4,240,680 | ) | |
| (11,410,602 | ) |
| | |
| | | |
| | |
| Total (decrease) / increase in net assets | |
| (4,556,263 | ) | |
| 7,333,039 | |
| | |
| | | |
| | |
| | |
| | | |
| | |
| Net assets, beginning of period | |
| 146,082,140 | | |
| 138,749,101 | |
| | |
| | | |
| | |
| | |
| | | |
| | |
| Net assets, end of period | |
$ | 141,525,877 | | |
$ | 146,082,140 | |
See Notes to Consolidated
Financial Statements
Barings Participation Investors
CONSOLIDATED SELECTED FINANCIAL HIGHLIGHTS
Selected data for each share of beneficial
interest outstanding:
| | |
For the nine
months ended
9/30/2020 | | |
For the years ended December 31, | |
| | |
(Unaudited) | | |
2019 | | |
2018 | | |
2017 | | |
2016 | |
| Net asset value: | |
| | |
| | |
| | |
| | |
| |
| Beginning of period / year | |
$ | 13.80 | | |
$ | 13.18 | | |
$ | 13.91 | | |
$ | 13.15 | | |
$ | 13.10 | |
| | |
| | | |
| | | |
| | | |
| | | |
| | |
| Net investment income (a) | |
| 0.65 | | |
| 1.00 | | |
| 1.03 | | |
| 1.09 | | |
| 1.00 | |
| | |
| | | |
| | | |
| | | |
| | | |
| | |
| Net realized and unrealized gain (loss) on investments | |
| (0.71 | ) | |
| 0.69 | | |
| (0.68 | ) | |
| 0.75 | | |
| 0.13 | |
| | |
| | | |
| | | |
| | | |
| | | |
| | |
| Total from investment operations | |
| (0.06 | ) | |
| 1.69 | | |
| 0.35 | | |
| 1.84 | | |
| 1.13 | |
| | |
| | | |
| | | |
| | | |
| | | |
| | |
| Dividends from net investment income to common shareholders | |
| (0.40 | ) | |
| (1.08 | ) | |
| (1.08 | ) | |
| (1.08 | ) | |
| (1.08 | ) |
| | |
| | | |
| | | |
| | | |
| | | |
| | |
| Increase / (Decrease) from dividends reinvested | |
| 0.01 (b | ) | |
| 0.01 (b | ) | |
| (0.00) (b | ) | |
| (0.00) (b | ) | |
| (0.00) (b | ) |
| | |
| | | |
| | | |
| | | |
| | | |
| | |
| Total dividends | |
| (0.39 | ) | |
| (1.07 | ) | |
| (1.08 | ) | |
| (1.08 | ) | |
| (1.08 | ) |
| | |
| | | |
| | | |
| | | |
| | | |
| | |
| Net asset value: End of period / year | |
$ | 13.35 | | |
$ | 13.80 | | |
$ | 13.18 | | |
$ | 13.91 | | |
$ | 13.15 | |
| | |
| | | |
| | | |
| | | |
| | | |
| | |
| Per share market value: End of period /year | |
$ | 10.86 | | |
$ | 16.13 | | |
$ | 15.05 | | |
$ | 14.10 | | |
$ | 14.20 | |
| | |
| | | |
| | | |
| | | |
| | | |
| | |
| Total investment return | |
| | | |
| | | |
| | | |
| | | |
| | |
| Net asset value (c) | |
| (0.24% | ) | |
| 13.21% | | |
| 2.53% | | |
| 14.29% | | |
| 8.75% | |
| | |
| | | |
| | | |
| | | |
| | | |
| | |
| Market value (c) | |
| (30.28% | ) | |
| 14.72% | | |
| 15.02% | | |
| 7.21% | | |
| 11.45% | |
| | |
| | | |
| | | |
| | | |
| | | |
| | |
| Net assets (in millions): | |
| | | |
| | | |
| | | |
| | | |
| | |
| End of period / year | |
$ | 141.53 | | |
$ | 146.08 | | |
$ | 138.75 | | |
$ | 145.48 | | |
$ | 136.61 | |
| | |
| | | |
| | | |
| | | |
| | | |
| | |
| Ratio of total expenses to average net assets (d) | |
| 2.16% (e | ) | |
| 2.26% | | |
| 2.76% | | |
| 3.23% | | |
| 2.26% | |
| | |
| | | |
| | | |
| | | |
| | | |
| | |
| Ratio of operating expenses to average net assets | |
| 1.39% (e | ) | |
| 1.45% | | |
| 1.56% | | |
| 1.49% | | |
| 1.35% | |
| | |
| | | |
| | | |
| | | |
| | | |
| | |
| Ratio of interest expense to average net assets | |
| 0.44% (e | ) | |
| 0.42% | | |
| 0.42% | | |
| 0.43% | | |
| 0.44% | |
| | |
| | | |
| | | |
| | | |
| | | |
| | |
| Ratio of income tax expense to average net assets | |
| 0.33% (e | ) | |
| 0.39% | | |
| 0.78% | | |
| 1.31% | | |
| 0.47% | |
| | |
| | | |
| | | |
| | | |
| | | |
| | |
| Ratio of net investment income to average net assets | |
| 6.56% (e | ) | |
| 7.30% | | |
| 7.47% | | |
| 7.92% | | |
| 7.45% | |
| | |
| | | |
| | | |
| | | |
| | | |
| | |
| Portfolio turnover | |
| 18% | | |
| 22% | | |
| 48% | | |
| 24% | | |
| 31% | |
| (a) | Calculated using average shares. |
| (b) | Rounds to less than $0.01 per share. |
| (c) | Net asset value return represents portfolio returns based on change in the Trust’s net asset
value assuming the reinvestment of all dividends and distributions which differs from the total investment return based on the
Trust’s market value due to the difference between the Trust’s net asset value and the market value of its shares outstanding;
past performance is no guarantee of future results. |
| (d) | Total expenses include income tax expense. |
| | |
| | |
| | |
| | |
| | |
| |
| Senior borrowings: | |
| | | |
| | | |
| | | |
| | | |
| | |
| Total principal amount (in millions) | |
$ | 15 | | |
$ | 15 | | |
$ | 15 | | |
$ | 15 | | |
$ | 15 | |
| | |
| | | |
| | | |
| | | |
| | | |
| | |
| Asset coverage per $1,000 of indebtedness | |
$ | 10,186 | | |
$ | 10,739 | | |
$ | 10,250 | | |
$ | 10,699 | | |
$ | 10,107 | |
| | |
| | | |
| | | |
| | | |
| | | |
| | |
See Note to Consolidated
Financial Statements
CONSOLIDATED SCHEDULE OF INVESTMENTS
September 30, 2020
(Unaudited)
| | |
| | |
| |
| | |
| |
| Corporate Restricted Securities - 92.75%: (A) | |
Principal Amount,
Shares, Units or
Ownership Percentage | | |
Acquisition
Date | |
Cost | | |
Fair Value | |
| | |
| | |
| |
| | |
| |
| Private Placement Investments - 80.67%: (C) | |
| | |
| |
| | |
| |
| |
| 1 WorldSync, Inc. |
| A product information sharing platform that connects manufacturers/suppliers and key retailers via the Global Data Synchronizatoin Network. |
| 6.98% Term Loan due 6/24/2025 (LIBOR + 5.750%) | |
$ | 1,707,916 | | |
07/01/19 | |
$ | 1,680,515 | | |
$ | 1,673,757 | |
| | |
| | | |
| |
| | | |
| | |
|
| Accelerate Learning |
| A provider of standards-based, digital science education content of K-12 schools. |
| 4.77% Term Loan due 12/31/2024 (LIBOR + 4.500%) | |
$ | 974,753 | | |
12/19/18 | |
| 961,048 | | |
| 926,778 | |
| | |
| | | |
| |
| | | |
| | |
| Advanced Manufacturing Enterprises LLC |
| A designer and manufacturer of large, custom gearing products for a number of critical customer applications. |
| Limited Liability Company Unit (B) | |
| 1,945
uts. | | |
* | |
| 207,911 | | |
| — | |
| * 12/07/12, 07/11/13 and 06/30/15. | |
| | | |
| |
| | | |
| | |
| | |
| | | |
| |
| | | |
| | |
| AFC - Dell Holding Corporation |
| A distributor and provider of inventory management services for “C-Parts” used by OEMs in their manufacturing and production facilities. |
13% (1% PIK) Senior Subordinated Note
due 02/28/2022 | |
$ | 1,921,207 | | |
** | |
| 1,911,227 | | |
| 1,921,207 | |
| 12% Junior Subordinated Note due 02/28/2023 | |
$ | 200,050 | | |
08/17/20 | |
| 187,013 | | |
| 195,886 | |
| Preferred Stock (B) | |
| 73 shs. | | |
** | |
| — | | |
| 7,639 | |
| Preferred Stock Series A (B) | |
| 1,155 shs. | | |
*** | |
| 115,512 | | |
| 191,160 | |
| Preferred Stock Series V (B) | |
| 53 shs. | | |
12/31/19 | |
| 5,251 | | |
| 6,139 | |
| Common Stock (B) | |
| 373 shs. | | |
*** | |
| 373 | | |
| 64,440 | |
| Common Stock Series B (B) | |
| 44 shs. | | |
** | |
| — | | |
| 7,602 | |
| * 03/27/15, 11/16/18, 07/1/19, 08/21/19 and 12/05/19. | |
| | | |
| |
| 2,219,376 | | |
| 2,394,073 | |
| ** 03/27/15, 11/15/18 and 12/31/19. | |
| | | |
| |
| | | |
| | |
| *** 03/27/15, 11/15/18, 12/31/19 and 08/14/20. | |
| | | |
| |
| | | |
| | |
| | |
| | | |
| |
| | | |
| | |
| Aftermath, Inc. |
| A provider of crime scene cleanup and biohazard remediation services. |
| 8.00% Term Loan due 04/10/2025 (LIBOR + 5.750%) | |
$ | 1,183,875 | | |
04/09/19 | |
| 1,163,800 | | |
| 1,157,238 | |
| | |
| | | |
| |
| | | |
| | |
| American Scaffold, Inc. |
| A provider of scaffolding and environmental containment solutions. |
| 6.32% Term Loan due 09/06/2025 (LIBOR + 5.250%) | |
$ | 1,290,823 | | |
09/06/19 | |
| 1,266,960 | | |
| 1,255,325 | |
| | |
| | | |
| |
| | | |
| | |
| | |
| | | |
| |
| | | |
| | |
Barings Participation Investors
CONSOLIDATED SCHEDULE OF INVESTMENTS (CONTINUED)
September 30, 2020
(Unaudited)
| | |
| | |
| |
| | |
| |
| Corporate Restricted Securities: (A) (Continued) | |
Principal Amount,
Shares, Units or
Ownership Percentage | | |
Acquisition
Date | |
Cost | | |
Fair Value | |
| | |
| | |
| |
| | |
| |
| AMS Holding LLC | |
| | |
| |
| | |
| |
| A leading multi-channel direct marketer of high-value collectible coins and proprietary-branded jewelry and watches. |
| Limited Liability Company Unit Class A Preferred (B)(F) | |
| 114
uts. | | |
10/04/12 | |
$ | 113,636 | | |
$ | 186,372 | |
| | |
| | | |
| |
| | | |
| | |
| ASC Holdings, Inc. |
| A manufacturer of capital equipment used by corrugated box manufacturers. |
13% (1% PIK) Senior Subordinated Note
due 05/18/2021 | |
$ | 891,618 | | |
11/19/15 | |
| 889,340 | | |
| 863,108 | |
| Limited Liability Company Unit (B) | |
| 111,100 uts. | | |
11/18/15 | |
| 111,100 | | |
| 33,997 | |
| | |
| | | |
| |
| 1,000,440 | | |
| 897,105 | |
| | |
| | | |
| |
| | | |
| | |
| ASPEQ Holdings |
| A manufacturer of highly-engineered electric heating parts and equipment for a range of industrial, commercial, transportation and marine applications. |
| 6.25% Term Loan due 10/31/2025 (LIBOR + 5.250%) | |
$ | 1,202,537 | | |
11/08/19 | |
| 1,187,198 | | |
| 1,184,499 | |
| | |
| | | |
| |
| | | |
| | |
| Audio Precision |
|
| A provider of high-end audio test and measurement sensing instrumentation software and accessories. |
| 6.22% Term Loan due 07/27/2024 (LIBOR + 6.000%) | |
$ | 1,768,500 | | |
10/30/18 | |
| 1,744,441 | | |
| 1,728,709 | |
| | |
| | | |
| |
| | | |
| | |
| Aurora Parts & Accessories LLC |
| A distributor of aftermarket over-the-road semi-trailer parts and accessories sold to customers across North America. |
| Preferred Stock (B) | |
| 210
shs. | | |
08/17/15 | |
| 209,390 | | |
| 209,390 | |
| Common Stock (B) | |
| 210 shs. | | |
08/17/15 | |
| 210 | | |
| 994 | |
| | |
| | | |
| |
| 209,600 | | |
| 210,384 | |
| | |
| | | |
| |
| | | |
| | |
| BBB Industries LLC |
| A supplier of re-manufactured parts to the North American automotive aftermarket. |
9.58% Second Lien Term Loan due 06/26/2026
(LIBOR + 8.500%) | |
$ | 1,725,000 | | |
08/02/18 | |
| 1,687,191 | | |
| 1,515,240 | |
| | |
| | | |
| |
| | | |
| | |
| BCC Software, Inc. | |
| | | |
| |
| | | |
| | |
| A provider of software and data solutions which enhance mail processing to help direct mail marketers realize discounts from the U.S. Postal Service, avoid penalties associated with mailing errors, and improve the accuracy and efficiency of marketing campaigns. |
12% (1% PIK) Senior Subordinated Note
due 04/11/2023 | |
$ | 1,934,739 | | |
* | |
| 1,913,604 | | |
| 1,958,066 | |
| Preferred Stock Series A (B) | |
| 27 shs. | | |
* | |
| 272,162 | | |
| 272,200 | |
| Common Stock Class A (B) | |
| 783 shs. | | |
* | |
| 861 | | |
| 606,299 | |
| * 10/11/17 and 01/28/19. | |
| | | |
| |
| 2,186,627 | | |
| 2,836,565 | |
| | |
| | | |
| |
| | | |
| | |
| | |
| | | |
| |
| | | |
| | |
CONSOLIDATED SCHEDULE OF INVESTMENTS (CONTINUED)
September 30, 2020
(Unaudited)
| | |
| | |
| |
| | |
| |
| Corporate Restricted Securities: (A) (Continued) | |
Principal Amount,
Shares, Units or
Ownership Percentage | | |
Acquisition
Date | |
Cost | | |
Fair Value | |
| | |
| | |
| |
| | |
| |
| BDP International, Inc. | |
| | |
| |
| | |
| |
| A provider of transportation and related services to the chemical and life sciences industries. |
| 5.75% Term Loan due 12/14/2024 (LIBOR + 4.750%) | |
$ | 2,421,863 | | |
12/18/18 | |
$ | 2,387,866 | | |
$ | 2,421,862 | |
| | |
| | | |
| |
| | | |
| | |
| Beacon Pointe Advisors, LLC | |
| | | |
| |
| | | |
| | |
| An integrated wealth management platform with comprehensive financial planning capabilities for high net worth clients with complex financial needs. |
| 6.00% Term Loan due 03/31/2026 (LIBOR + 5.000%) | |
$ | 996,818 | | |
03/31/20 | |
| 611,950 | | |
| 614,342 | |
| | |
| | | |
| |
| | | |
| | |
| BEI Precision Systems & Space Company, Inc. | |
| | | |
| |
| | | |
| | |
| A provider of advanced design, manufacturing, and testing for custom optical encoder-based positioning systems, precision accelerometers, and micro scanners. |
12% (1% PIK) Senior Subordinated Note
due 04/28/2024 | |
$ | 1,499,377 | | |
04/28/17 | |
| 1,481,536 | | |
| 1,499,377 | |
| Limited Liability Company Unit (B)(F) | |
| 4,167
uts. | | |
* | |
| 416,654 | | |
| 409,583 | |
| * 04/28/17 and 02/07/19. | |
| | | |
| |
| 1,898,190 | | |
| 1,908,960 | |
| | |
| | | |
| |
| | | |
| | |
| Blue Wave Products, Inc. | |
| | | |
| |
| | | |
| | |
| A distributor of pool supplies. | |
| | | |
| |
| | | |
| | |
13% (1% PIK) Senior Subordinated Note
due 12/31/2020 | |
$ | 65,329 | | |
10/12/12 | |
| 65,322 | | |
| 65,006 | |
| Common Stock (B) | |
| 51,064 shs. | | |
10/12/12 | |
| 51,064 | | |
| 89,037 | |
Warrant, exercisable until 2022, to purchase
common stock at $.01 per share (B) | |
| 20,216 shs. | | |
10/12/12 | |
| 20,216 | | |
| 35,249 | |
| | |
| | | |
| |
| 136,602 | | |
| 189,292 | |
| BlueSpire Holding, Inc. | |
| | | |
| |
| | | |
| | |
| A marketing services firm that integrates strategy, technology, and content to deliver customized marketing solutions for clients in the senior living, financial services and healthcare end markets. |
| Common Stock (B) | |
| 2,956
shs. | | |
06/30/15 | |
| 937,438 | | |
| 38,664 | |
| | |
| | | |
| |
| | | |
| | |
| Brown Machine LLC | |
| | | |
| |
| | | |
| | |
| A designer and manufacturer of thermoforming equipment used in the production of plastic packaging containers within the food and beverage industry. |
| 6.25% Term Loan due 10/04/2024 (LIBOR + 5.250%) | |
$ | 680,840 | | |
10/03/18 | |
| 675,156 | | |
| 663,819 | |
| | |
| | | |
| |
| | | |
| | |
Barings Participation Investors
CONSOLIDATED SCHEDULE OF INVESTMENTS (CONTINUED)
September 30, 2020
(Unaudited)
| | |
| | |
| |
| | |
| |
| Corporate Restricted Securities: (A) (Continued) | |
Principal Amount,
Shares, Units or
Ownership Percentage | | |
Acquisition
Date | |
Cost | | |
Fair Value | |
| | |
| | |
| |
| | |
| |
| Cadence, Inc. | |
| | |
| |
| | |
| |
| A full-service contract manufacturer (“CMO”) and supplier of advanced products, technologies, and services to medical device, life science, and industrial companies. |
| 5.5% First Lien Term Loan due 04/30/2025 (LIBOR + 4.500%) | |
$ | 890,782 | | |
* | |
$ | 878,940 | | |
$ | 859,557 | |
| * 05/14/18 and 05/31/19. | |
| | | |
| |
| | | |
| | |
| | |
| | | |
| |
| | | |
| | |
| Cadent, LLC | |
| | | |
| |
| | | |
| | |
| A provider of advertising solutions driven by data and technology. |
| 6.50% Term Loan due 09/07/2023 (LIBOR + 5.500%) | |
$ | 970,231 | | |
09/04/18 | |
| 964,500 | | |
| 952,766 | |
| | |
| | | |
| |
| | | |
| | |
| CHG Alternative Education Holding Company | |
| | | |
| |
| | | |
| | |
| A leading provider of publicly-funded, for profit pre-K-12 education services targeting special needs children at therapeutic day schools and “at risk” youth through alternative education programs. |
13.5% (1.5% PIK) Senior Subordinated Note
due 03/31/2023 | |
$ | 825,578 | | |
01/19/11 | |
| 825,471 | | |
| 825,578 | |
14% (2% PIK) Senior Subordinated Note
due 03/31/2023 | |
$ | 221,167 | | |
08/03/12 | |
| 221,077 | | |
| 221,167 | |
| Common Stock (B) | |
| 375
shs. | | |
01/19/11 | |
| 37,500 | | |
| 36,679 | |
Warrant, exercisable until 2021, to purchase
common stock at $.01 per share (B) | |
| 295 shs. | | |
01/19/11 | |
| 29,250 | | |
| 28,832 | |
| | |
| | | |
| |
| 1,113,298 | | |
| 1,112,256 | |
| | |
| | | |
| |
| | | |
| | |
| Clarion Brands Holding Corp. | |
| | | |
| |
| | | |
| | |
| A portfolio of six over-the-counter (OTC) pharmaceutical brands whose products are used to treat tinnitus or ringing of the ear, excessive sweating, urinary tract infections, muscle pain, and skin conditions. |
| Limited Liability Company Unit (B) | |
| 1,853
uts. | | |
07/18/16 | |
| 189,267 | | |
| 346,830 | |
| | |
| | | |
| |
| | | |
| | |
| Claritas Holdings, Inc. | |
| | | |
| |
| | | |
| | |
| A market research company that provides market segmentation insights to customers engaged in direct-to-consumer and business-to-business marketing activities. |
| 7.00% Term Loan due 12/31/2023 (LIBOR + 6.000%) | |
$ | 1,585,123 | | |
12/20/18 | |
| 1,559,601 | | |
| 1,538,203 | |
| | |
| | | |
| |
| | | |
| | |
| Clubessential LLC | |
| | | |
| |
| | | |
| | |
| A leading SaaS platform for private clubs and resorts. |
6.5% (1% PIK) Senior Subordinated Note
due 11/30/2023 (LIBOR + 5.500%) | |
$ | 1,720,687 | | |
01/09/20 | |
| 1,697,164 | | |
| 1,688,855 | |
| | |
| | | |
| |
| | | |
| | |
| | |
| | | |
| |
| | | |
| | |
CONSOLIDATED SCHEDULE OF INVESTMENTS (CONTINUED)
September 30, 2020
(Unaudited)
| | |
| | |
| |
| | |
| |
| Corporate Restricted Securities: (A) (Continued) | |
Principal Amount,
Shares, Units or
Ownership Percentage | | |
Acquisition
Date | |
Cost | | |
Fair Value | |
| | |
| | |
| |
| | |
| |
| Command Alkon | |
| | |
| |
| | |
| |
| A vertical-market software and technology provider to the heavy building materials industry delivering purpose-built, mission critical products that serve as the core operating & production systems for ready-mix concrete producers, asphalt producers, and aggregate suppliers. |
| 9.25% Term Loan due 04/17/2027 (LIBOR + 8.250%) | |
$ | 1,702,726 | | |
04/23/20 | |
$ | 1,654,835 | | |
$ | 1,666,799 | |
| Limited Liability Company Unit | |
| 18
uts. | | |
04/23/20 | |
| 18,006 | | |
| 23,557 | |
| Class B Partnership Units | |
| 6,629 uts. | | |
04/23/20 | |
| 0 | | |
| 0 | |
| | |
| | | |
| |
| 1,672,841 | | |
| 1,690,356 | |
| Concept Machine Tool Sales, LLC | |
| | | |
| |
| | | |
| | |
| A full-service distributor of high-end machine tools and metrology equipment, exclusively representing a variety of global manufacturers in the Upper Midwest. |
| 6.00% Term Loan due 01/31/2025 (LIBOR +5.000%) | |
$ | 625,265 | | |
01/30/20 | |
| 614,430 | | |
| 575,869 | |
| Limited Liability Company Unit (F) | |
| 1,171 shs. | | |
01/30/20 | |
| 46,910 | | |
| 35,225 | |
| | |
| | | |
| |
| 661,340 | | |
| 611,094 | |
| CORA Health Services, Inc. | |
| | | |
| |
| | | |
| | |
| A provider of outpatient rehabilitation therapy services. |
| 11.00% (1% PIK) Term Loan due 05/05/2025 | |
$ | 1,552,034 | | |
* | |
| 1,465,434 | | |
| 1,345,946 | |
| Preferred Stock Series A (B) | |
| 758 shs. | | |
06/30/16 | |
| 2,647 | | |
| 116,633 | |
| Common Stock Class A (B) | |
| 3,791 shs. | | |
06/30/16 | |
| 3,791 | | |
| 18,257 | |
| * 05/01/18, 06/28/19 and 09/30/20 | |
| | | |
| |
| 1,471,872 | | |
| 1,480,836 | |
| | |
| | | |
| |
| | | |
| | |
| Dart Buyer, Inc. | |
| | | |
| |
| | | |
| | |
| A manufacturer of helicopter aftermarket equipment and OEM Replacement parts for rotorcraft operators, providers and OEMs. |
| 5.75% Term Loan due 04/01/2025 (LIBOR + 5.250%) | |
$ | 1,710,398 | | |
04/01/19 | |
| 1,399,282 | | |
| 1,395,015 | |
| | |
| | | |
| |
| | | |
| | |
| Del Real LLC | |
| | | |
| |
| | | |
| | |
| A manufacturer and distributor of fully-prepared fresh refrigerated Hispanic entrees as well as side dishes that are typically sold on a heat-and-serve basis at retail grocers. |
| 11% Senior Subordinated Note due 04/06/2023 (D) | |
$ | 1,420,588 | | |
10/07/16 | |
| 1,403,759 | | |
| 1,278,529 | |
| Limited Liability Company Unit (B)(F) | |
| 368,799 uts. | | |
* | |
| 368,928 | | |
| 98,066 | |
| * 10/07/16, 07/25/18, 03/13/19 and 06/17/19. | |
| | | |
| |
| 1,772,687 | | |
| 1,376,595 | |
| | |
| | | |
| |
| | | |
| | |
| Discovery Education, Inc. | |
| | | |
| |
| | | |
| | |
| A provider of standards-based, digital education content for K-12 schools. |
| 4.15% Term Loan due 04/30/2024 (LIBOR + 4.250%) | |
$ | 1,897,328 | | |
04/20/18 | |
| 1,874,702 | | |
| 1,887,461 | |
| | |
| | | |
| |
| | | |
| | |
| | |
| | | |
| |
| | | |
| | |
Barings Participation Investors
CONSOLIDATED SCHEDULE OF INVESTMENTS (CONTINUED)
September 30, 2020
(Unaudited)
| | |
| | |
| |
| | |
| |
| Corporate Restricted Securities: (A) (Continued) | |
Principal Amount,
Shares, Units or
Ownership Percentage | | |
Acquisition
Date | |
Cost | | |
Fair Value | |
| | |
| | |
| |
| | |
| |
| DPL Holding Corporation | |
| | |
| |
| | |
| |
| A distributor and manufacturer of aftermarket undercarriage parts for medium and heavy duty trucks and trailers. |
| Preferred Stock (B) | |
| 25
shs. | | |
05/04/12 | |
$ | 252,434 | | |
$ | 344,487 | |
| Common Stock (B) | |
| 25 shs. | | |
05/04/12 | |
| 28,048 | | |
| — | |
| | |
| | | |
| |
| 280,482 | | |
| 344,487 | |
| Dunn Paper | |
| | | |
| |
| | | |
| | |
| A provider of specialty paper for niche product applications. |
9.75% Second Lien Term Loan due 08/26/2023
(LIBOR + 8.750%) | |
$ | 1,725,000 | | |
09/28/16 | |
| 1,710,427 | | |
| 1,672,215 | |
| | |
| | | |
| |
| | | |
| | |
| Electronic Power Systems | |
| | | |
| |
| | | |
| | |
| A provider of electrical testing services for apparatus equipment and protection & controls infrastructure. |
| 4.97% Term Loan due 12/21/2024 (LIBOR + 4.750%) | |
$ | 1,587,751 | | |
12/21/18 | |
| 1,570,943 | | |
| 1,582,670 | |
| Common Stock (B) | |
| 52 shs. | | |
12/28/18 | |
| 52,176 | | |
| 103,728 | |
| | |
| | | |
| |
| 1,623,119 | | |
| 1,686,398 | |
| Elite Sportswear Holding, LLC | |
| | | |
| |
| | | |
| | |
| A designer and manufacturer of gymnastics, competitive cheerleading and swimwear apparel in the U.S. and internationally. |
11.5% (1% PIK) Senior Subordinated Note
due 09/20/2022 (D) | |
$ | 1,588,640 | | |
10/14/16 | |
| 1,568,694 | | |
| — | |
| Limited Liability Company Unit (B)(F) | |
| 101 uts. | | |
10/14/16 | |
| 159,722 | | |
| — | |
| | |
| | | |
| |
| 1,728,416 | | |
| — | |
| English Color & Supply LLC | |
| | | |
| |
| | | |
| | |
| A distributor of aftermarket automotive paint and related products to collision repair shops, auto dealerships and fleet customers through a network of stores in the Southern U.S. |
11.5% (0.5% PIK) Senior Subordinated Note
due 12/31/2023 | |
$ | 1,349,036 | | |
06/30/17 | |
| 1,334,158 | | |
| 1,333,239 | |
| Limited Liability Company Unit (B)(F) | |
| 397,695 uts. | | |
06/30/17 | |
| 397,695 | | |
| 372,241 | |
| | |
| | | |
| |
| 1,731,853 | | |
| 1,705,480 | |
| E.S.P. Associates, P.A. | |
| | | |
| |
| | | |
| | |
| A professional services firm providing engineering, surveying and planning services to infrastructure projects. |
| Limited Liability Company Unit (B) | |
| 229 uts. | | |
04/04/18 | |
| 228,955 | | |
| 219,025 | |
| | |
| | | |
| |
| | | |
| | |
| F G I Equity LLC | |
| | | |
| |
| | | |
| | |
| A manufacturer of a broad range of filters and related products that are used in commercial, light industrial, healthcare, gas turbine, nuclear, laboratory, clean room, hotel, educational system, and food processing settings. |
| Limited Liability Company Unit Class B-1 (B) | |
| 65,789 uts. | | |
12/15/10 | |
| 56,457 | | |
| 755,904 | |
| Limited Liability Company Unit Class B-2 (B) | |
| 8,248 uts. | | |
12/15/10 | |
| 7,078 | | |
| 94,768 | |
| Limited Liability Company Unit Class B-3 (B) | |
| 6,522 uts. | | |
08/30/12 | |
| 13,844 | | |
| 76,629 | |
| Limited Liability Company Unit Class C (B) | |
| 1,575 uts. | | |
12/20/10 | |
| 8,832 | | |
| 105,644 | |
| | |
| | | |
| |
| 86,211 | | |
| 1,032,945 | |
| | |
| | | |
| |
| | | |
| | |
CONSOLIDATED SCHEDULE OF INVESTMENTS (CONTINUED)
September 30, 2020
(Unaudited)
| | |
| | |
| |
| | |
| |
| Corporate Restricted Securities: (A) (Continued) | |
Principal Amount,
Shares, Units or
Ownership Percentage | | |
Acquisition
Date | |
Cost | | |
Fair Value | |
| | |
| | |
| |
| | |
| |
| Foundation Risk Partners, Corp. | |
| | |
| |
| | |
| |
| A retail insurance brokerage firm focused on providing commercial P&C and employee benefits solutions to small and medium-sized clients. |
5.75% First Lien Term Loan due 08/31/2026
(LIBOR + 4.750%) | |
$ | 666,667 | | |
09/30/20 | |
$ | 68,333 | | |
$ | 68,333 | |
9.50% Second Lien Term Loan due 11/10/2024
(LIBOR + 8.500%) | |
$ | 333,333 | | |
09/30/20 | |
| 18,611 | | |
| 18,611 | |
| | |
| | | |
| |
| 86,944 | | |
| 86,944 | |
| GD Dental Services LLC | |
| | | |
| |
| | | |
| | |
| A provider of convenient “onestop” general, specialty, and cosmetic dental services with 21 offices located throughout South and Central Florida. |
| Limited Liability Company Unit Preferred (B) | |
| 76
uts. | | |
10/05/12 | |
| 75,920 | | |
| — | |
| Limited Liability Company Unit Common (B) | |
| 767 uts. | | |
10/05/12 | |
| 767 | | |
| — | |
| | |
| | | |
| |
| 76,687 | | |
| — | |
| gloProfessional Holdings, Inc. | |
| | | |
| |
| | | |
| | |
| A marketer and distributor of premium mineral-based cosmetics, cosmeceuticals and professional hair care products to the professional spa and physician’s office channels. |
14% (2% PIK) Senior Subordinated Note
due 11/30/2021 (D) | |
$ | 1,380,135 | | |
03/27/13 | |
| 989,505 | | |
| 1,173,115 | |
| Preferred Stock (B) | |
| 295 shs. | | |
03/29/19 | |
| 295,276 | | |
| 352,575 | |
| Common Stock (B) | |
| 1,181 shs. | | |
03/27/13 | |
| 118,110 | | |
| 13,117 | |
| | |
| | | |
| |
| 1,402,891 | | |
| 1,538,807 | |
| GraphPad Software, Inc. | |
| | | |
| |
| | | |
| | |
| A provider of data analysis, statistics and graphing software solution for scientific research applications, with a focus on the life sciences and academic end-markets. |
| 7.00% Term Loan due 12/21/2023 (LIBOR + 6.000%) | |
$ | 2,421,666 | | |
* | |
| 2,395,680 | | |
| 2,421,666 | |
| * 12/19/17 and 04/16/19. | |
| | | |
| |
| | | |
| | |
| | |
| | | |
| |
| | | |
| | |
| GTI Holding Company | |
| | | |
| |
| | | |
| | |
| A designer, developer, and marketer of precision specialty hand tools and handheld test instruments. |
| Common Stock (B) | |
| 1,046
shs. | | |
* | |
| 104,636 | | |
| 218,364 | |
Warrant, exercisable until 2027, to purchase
common stock at $.01 per share (B) | |
| 397 shs. | | |
02/05/14 | |
| 36,816 | | |
| 82,878 | |
| * 02/05/14 and 11/22/17. | |
| | | |
| |
| 141,452 | | |
| 301,242 | |
| | |
| | | |
| |
| | | |
| | |
| Handi Quilter Holding Company (Premier Needle Arts) |
| A designer and manufacturer of long-arm quilting machines and related components for the consumer quilting market. |
| Limited Liability Company Unit Preferred (B) | |
| 372
uts. | | |
* | |
| 371,644 | | |
| 375,777 | |
| Limited Liability Company Unit Common Class A (B) | |
| 3,594 uts. | | |
12/19/14 | |
| — | | |
| — | |
| *12/19/14 and 04/29/16. | |
| | | |
| |
| 371,644 | | |
| 375,777 | |
| | |
| | | |
| |
| | | |
| | |
Barings Participation Investors
CONSOLIDATED SCHEDULE OF INVESTMENTS (CONTINUED)
September 30, 2020
(Unaudited)
| | |
| | |
| |
| | |
| |
| Corporate Restricted Securities: (A) (Continued) | |
Principal Amount,
Shares, Units or
Ownership Percentage | | |
Acquisition
Date | |
Cost | | |
Fair Value | |
| | |
| | |
| |
| | |
| |
| Happy Floors Acquisition, Inc. | |
| | |
| |
| | |
| |
| A wholesale importer and value-added distributor of premium European flooring tile to residential and commercial end markets. |
12.5% (1% PIK) Senior Subordinated Note
due 01/01/2023 | |
$ | 392,908 | | |
07/01/16 | |
$ | 390,302 | | |
$ | 392,908 | |
| Common Stock (B) | |
| 150
shs. | | |
07/01/16 | |
| 149,500 | | |
| 327,441 | |
| | |
| | | |
| |
| 539,802 | | |
| 720,349 | |
| Hartland Controls Holding Corporation | |
| | | |
| |
| | | |
| | |
| A manufacturer and distributor of electronic and electromechanical components. |
14% (2% PIK) Senior Subordinated Note
due 12/01/2023 | |
$ | 1,192,332 | | |
02/14/14 | |
| 1,191,459 | | |
| 1,192,332 | |
| 14% Senior Subordinated Note due 12/01/2023 | |
$ | 434,129 | | |
06/22/15 | |
| 433,927 | | |
| 434,129 | |
| Common Stock (B) | |
| 821 shs. | | |
02/14/14 | |
| 822 | | |
| 288,947 | |
| | |
| | | |
| |
| 1,626,208 | | |
| 1,915,408 | |
| HHI Group, LLC | |
| | | |
| |
| | | |
| | |
| A developer, marketer, and distributor of hobby-grade radio control products. |
14% (2% PIK) Senior Subordinated Note
due 11/26/2020 | |
| | | |
| |
| | | |
| | |
| Limited Liability Company Unit (B)(F) | |
| 102 uts. | | |
01/17/14 | |
| 101,563 | | |
| 325,637 | |
| | |
| | | |
| |
| | | |
| | |
| Holley Performance Products | |
| | | |
| |
| | | |
| | |
| A provider of automotive aftermarket performance products. |
| 5.26% Term Loan due 10/24/2025 (LIBOR + 5.000%) | |
$ | 2,428,025 | | |
10/24/18 | |
| 2,401,554 | | |
| 2,422,683 | |
| | |
| | | |
| |
| | | |
| | |
| HOP Entertainment LLC | |
| | | |
| |
| | | |
| | |
| A provider of post production equipment and services to producers of television shows and motion pictures. |
| Limited Liability Company Unit Class F (B)(F) | |
| 47 uts. | | |
10/14/11 | |
| — | | |
| — | |
| Limited Liability Company Unit Class G (B)(F) | |
| 114 uts. | | |
10/14/11 | |
| — | | |
| — | |
| Limited Liability Company Unit Class H (B)(F) | |
| 47 uts. | | |
10/14/11 | |
| — | | |
| — | |
| Limited Liability Company Unit Class I (B)(F) | |
| 47 uts. | | |
10/14/11 | |
| — | | |
| — | |
| | |
| | | |
| |
| — | | |
| — | |
| Hyperion Materials & Technologies, Inc. | |
| | | |
| |
| | | |
| | |
| A producer of specialty hard materials and precision tool components that are used to make precision cutting, grinding and other machining tools used by tool manufacturers and final product manufacturers. |
| 6.50% Term Loan due 08/14/2026 (LIBOR + 5.500%) | |
$ | 1,597,440 | | |
08/16/19 | |
| 1,572,893 | | |
| 1,517,727 | |
| | |
| | | |
| |
| | | |
| | |
| | |
| | | |
| |
| | | |
| | |
CONSOLIDATED SCHEDULE OF INVESTMENTS (CONTINUED)
September 30, 2020
(Unaudited)
| | |
| | |
| |
| | |
| |
| Corporate Restricted Securities: (A) (Continued) | |
Principal Amount,
Shares, Units or
Ownership Percentage | | |
Acquisition
Date | |
Cost | | |
Fair Value | |
| | |
| | |
| |
| | |
| |
| IM Analytics Holdings, LLC | |
| | |
| |
| | |
| |
| A provider of test and measurement equipment used for vibration, noise, and shock testing. |
| 7.22% Term Loan due 11/22/2023 (LIBOR + 6.000%) | |
$ | 1,060,579 | | |
11/21/19 | |
$ | 1,052,230 | | |
$ | 929,703 | |
Warrant, exercisable until 2026, to purchase
common stock at $.01 per share (B) | |
| 8,885
shs. | | |
11/25/19 | |
| — | | |
| — | |
| | |
| | | |
| |
| 1,052,230 | | |
| 929,703 | |
| Industrial Service Solutions | |
| | | |
| |
| | | |
| | |
| A provider of maintenance, repair and overhaul services for process equipment within the industrial, energy and power end-markets. |
| 5.77% Term Loan due 01/31/2026 (LIBOR + 4.500%) | |
$ | 903,489 | | |
02/05/20 | |
| 887,389 | | |
| 858,314 | |
| | |
| | | |
| |
| | | |
| | |
| LAC Acquisition LLC | |
| | | |
| |
| | | |
| | |
| A provider of center-based applied behavior analysis treatment centers for children diagnosed with autism spectrum disorder. |
| 6.82% Term Loan due 10/01/2024 (LIBOR + 5.750%) | |
$ | 1,726,941 | | |
10/01/18 | |
| 1,301,068 | | |
| 1,276,791 | |
| Limited Liability Company Unit Class A (F) | |
| 22,222 uts. | | |
10/01/18 | |
| 22,222 | | |
| 23,987 | |
| | |
| | | |
| |
| 1,323,290 | | |
| 1,300,778 | |
| Manhattan Beachwear Holding Company | |
| | | |
| |
| | | |
| | |
| A designer and distributor of women’s swimwear. |
| 12.5% Senior Subordinated Note due 05/30/2022 (D) | |
$ | 419,971 | | |
01/15/10 | |
| 404,121 | | |
| — | |
15% (2.5% PIK) Senior Subordinated Note due
05/30/2022 (D) | |
$ | 115,253 | | |
10/05/10 | |
| 114,604 | | |
| — | |
| Common Stock (B) | |
| 35 shs. | | |
10/05/10 | |
| 35,400 | | |
| — | |
| Common Stock Class B (B) | |
| 118 shs. | | |
01/15/10 | |
| 117,647 | | |
| — | |
Warrant, exercisable until 2023, to purchase
common stock at $.01 per share (B) | |
| 104 shs. | | |
10/05/10 | |
| 94,579 | | |
| — | |
| | |
| | | |
| |
| 766,351 | | |
| — | |
| Master Cutlery LLC | |
| | | |
| |
| | | |
| | |
| A designer and marketer of a wide assortment of knives and swords. |
| 13% Senior Subordinated Note due 07/20/2022 (D) | |
$ | 868,102 | | |
04/17/15 | |
| 867,529 | | |
| — | |
| Limited Liability Company Unit | |
| 5 uts. | | |
04/17/15 | |
| 678,329 | | |
| — | |
| | |
| | | |
| |
| 1,545,858 | | |
| — | |
| Media Recovery, Inc. | |
| | | |
| |
| | | |
| | |
| A global manufacturer and developer of shock, temperature, vibration and other condition indicators and monitors for in-transit and storage applications. |
6.75% First Out Term Loan due 11/22/2025
(LIBOR + 5.750%) | |
$ | 370,880 | | |
11/25/19 | |
| 364,515 | | |
| 355,588 | |
| | |
| | | |
| |
| | | |
| | |
| | |
| | | |
| |
| | | |
| | |
Barings Participation Investors
CONSOLIDATED SCHEDULE OF INVESTMENTS (CONTINUED)
September 30, 2020
(Unaudited)
| | |
| | |
| |
| | |
| |
| Corporate Restricted Securities: (A) (Continued) | |
Principal Amount,
Shares, Units or
Ownership Percentage | | |
Acquisition
Date | |
Cost | | |
Fair Value | |
| | |
| | |
| |
| | |
| |
| MES Partners, Inc. | |
| | |
| |
| | |
| |
| An industrial service business offering an array of cleaning and environmental services to the Gulf Coast region of the U.S. |
| Preferred Stock Series A (B) | |
| 30,926
shs. | | |
07/25/19 | |
$ | 12,412 | | |
$ | — | |
| Preferred Stock Series C (B) | |
| 1,275 shs. | | |
09/22/20 | |
| 457,365 | | |
| 457,365 | |
| Common Stock Class B (B) | |
| 259,252 shs. | | |
* | |
| 244,163 | | |
| — | |
Warrant, exercisable until 2021, to purchase
common stock at $.01 per share (B) | |
| 351,890 shs. | | |
09/22/20 | |
| — | | |
| — | |
| * 09/30/14 and 02/28/18. | |
| | | |
| |
| 713,940 | | |
| 457,365 | |
| | |
| | | |
| |
| | | |
| | |
| MeTEOR Education LLC | |
| | | |
| |
| | | |
| | |
| A leading provider of classroom and common area design services, furnishings, equipment and instructional support to K-12 schools. |
| 12% Senior Subordinated Note due 06/20/2023 | |
$ | 915,819 | | |
03/09/18 | |
| 905,759 | | |
| 914,142 | |
| Limited Liability Company Unit (B)(F) | |
| 182 uts. | | |
03/09/18 | |
| 183,164 | | |
| 109,919 | |
| | |
| | | |
| |
| 1,088,923 | | |
| 1,024,061 | |
| Motion Controls Holdings | |
| | | |
| |
| | | |
| | |
| A manufacturer of high performance mechanical motion control and linkage products. |
| Limited Liability Company Unit Class B-1 (B)(F) | |
| 75,000
uts. | | |
11/30/10 | |
| — | | |
| 32,772 | |
| Limited Liability Company Unit Class B-2 (B)(F) | |
| 6,801 uts. | | |
11/30/10 | |
| — | | |
| 2,972 | |
| | |
| | | |
| |
| — | | |
| 35,744 | |
| Music Reports, Inc. | |
| | | |
| |
| | | |
| | |
| An administrator of comprehensive offering of rights and royalties solutions for music and cue sheet copyrights to music and entertainment customers. |
| 6.40% Term Loan due 08/21/2026 (LIBOR + 5.250%) | |
$ | 605,170 | | |
08/25/20 | |
| 590,290 | | |
| 590,041 | |
| | |
| | | |
| |
| | | |
| | |
| Options Technology Ltd | |
| | | |
| |
| | | |
| | |
| A provider of vertically focused financial technology managed services and IT infrastructure products for the financial services industry. |
| 5.50% Term Loan due 12/18/2025 (LIBOR + 4.500%) | |
$ | 1,604,606 | | |
12/23/19 | |
| 1,240,125 | | |
| 1,236,893 | |
| | |
| | | |
| |
| | | |
| | |
| PANOS Brands LLC | |
| | | |
| |
| | | |
| | |
| A marketer and distributor of branded consumer foods in the specialty, natural, better-for-you,“free from” healthy and gluten-free categories. |
12% (1% PIK) Senior Subordinated Note
due 08/17/2022 | |
$ | 1,775,705 | | |
02/17/17 | |
| 1,762,857 | | |
| 1,775,705 | |
| Common Stock Class B (B) | |
| 380,545
shs. | | |
* | |
| 380,545 | | |
| 441,241 | |
| * 01/29/16 and 02/17/17. | |
| | | |
| |
| 2,143,402 | | |
| 2,216,946 | |
| | |
| | | |
| |
| | | |
| | |
| | |
| | | |
| |
| | | |
| | |
CONSOLIDATED SCHEDULE OF INVESTMENTS (CONTINUED)
September 30, 2020
(Unaudited)
| | |
| | |
| |
| | |
| |
| Corporate Restricted Securities: (A) (Continued) | |
Principal Amount,
Shares, Units or
Ownership Percentage | | |
Acquisition
Date | |
Cost | | |
Fair Value | |
| | |
| | |
| |
| | |
| |
| PB Holdings LLC | |
| | |
| |
| | |
| |
| A designer, manufacturer and installer of maintenance and repair parts and equipment for industrial customers. |
| 5.52% Term Loan due 03/06/2025 (LIBOR + 5.250%) | |
$ | 848,126 | | |
03/06/19 | |
$ | 835,369 | | |
$ | 769,250 | |
| | |
| | | |
| |
| | | |
| | |
| Pegasus Transtech Corporation | |
| | | |
| |
| | | |
| | |
| A provider of end-to-end document, driver and logistics management solutions, which enable its customers (carriers, brokers, and drivers) to operate more efficiently, reduce manual overhead, enhance compliance, and shorten cash conversion cycles. |
| 8.75% Term Loan due 08/31/2026 (LIBOR + 6.500%) | |
$ | 387,642 | | |
09/29/20 | |
| 374,075 | | |
| 374,075 | |
| 7.25% Term Loan due 11/17/2024 (LIBOR + 6.250%) | |
$ | 1,894,364 | | |
11/14/17 | |
| 1,866,426 | | |
| 1,847,005 | |
| | |
| | | |
| |
| 2,240,501 | | |
| 2,221,080 | |
| Petroplex Inv Holdings LLC | |
| | | |
| |
| | | |
| | |
| A leading provider of acidizing services to E&P customers in the Permian Basin. |
| Limited Liability Company Unit | |
| 0.40%
int. | | |
* | |
| 174,669 | | |
| 10,772 | |
| * 11/29/12 and 12/20/16. | |
| | | |
| |
| | | |
| | |
| | |
| | | |
| |
| | | |
| | |
| Polytex Holdings LLC | |
| | | |
| |
| | | |
| | |
| A manufacturer of water based inks and related products serving primarily the wall covering market. |
13.9% (7.9% PIK) Senior Subordinated Note
due 12/31/2021 (D) | |
$ | 1,069,985 | | |
07/31/14 | |
| 1,064,183 | | |
| 802,489 | |
| Limited Liability Company Unit | |
| 148,096 uts. | | |
07/31/14 | |
| 148,096 | | |
| — | |
| Limited Liability Company Unit Class F | |
| 36,976 uts. | | |
* | |
| 24,802 | | |
| — | |
| * 09/28/17 and 02/15/18. | |
| | | |
| |
| 1,237,081 | | |
| 802,489 | |
| | |
| | | |
| |
| | | |
| | |
| PPC Event Services | |
| | | |
| |
| | | |
| | |
| A special event equipment rental business. |
| Preferred Stock Series P-1 (B) | |
| 71 shs. | | |
07/21/20 | |
| 71,018 | | |
| — | |
| Common Stock (B) | |
| 170,927 shs. | | |
07/21/20 | |
| — | | |
| — | |
| 16.00% Term Loan due 05/28/2023 (D) | |
$ | 896,513 | | |
07/21/20 | |
| 619,923 | | |
| — | |
| 8.00% Term Loan due 05/28/2023 (D) | |
$ | 667,000 | | |
07/21/20 | |
| 620,376 | | |
| — | |
| Limited Liability Company Unit (B) | |
| 3,450 uts. | | |
11/20/14 | |
| 172,500 | | |
| — | |
| Limited Liability Company Unit Series A-1 (B) | |
| 339 uts. | | |
03/16/16 | |
| 42,419 | | |
| — | |
| | |
| | | |
| |
| 1,526,236 | | |
| — | |
| Recovery Point Systems, Inc. | |
| | | |
| |
| | | |
| | |
| A provider of IT infrastructure, colocation and cloud based resiliency services. |
| 7.50% Term Loan due 7/31/2026 (LIBOR + 6.500%) | |
$ | 1,356,514 | | |
08/12/20 | |
| 1,330,003 | | |
| 1,329,384 | |
| | |
| | | |
| |
| | | |
| | |
Barings Participation Investors
CONSOLIDATED SCHEDULE OF INVESTMENTS (CONTINUED)
September 30, 2020
(Unaudited)
| | |
| | |
| |
| | |
| |
| Corporate Restricted Securities: (A) (Continued) | |
Principal Amount,
Shares, Units or
Ownership Percentage | | |
Acquisition
Date | |
Cost | | |
Fair Value | |
| | |
| | |
| |
| | |
| |
| ReelCraft Industries, Inc. | |
| | |
| |
| | |
| |
| A designer and manufacturer of heavy-duty reels for diversified industrial, mobile equipment OEM, auto aftermarket, government/military and other end markets. |
| Limited Liability Company Unit Class B | |
| 293,617 uts. | | |
11/13/17 | |
$ | 184,689 | | |
$ | 551,566 | |
| | |
| | | |
| |
| | | |
| | |
| REVSpring, Inc. | |
| | | |
| |
| | | |
| | |
| A provider of accounts receivable management and revenue cycle management services to customers in the healthcare, financial and utility industries. |
8.40% Second Lien Term Loan due 10/11/2026
(LIBOR + 8.250%) | |
$ | 1,725,000 | | |
10/11/18 | |
| 1,686,019 | | |
| 1,666,523 | |
| | |
| | | |
| |
| | | |
| | |
| Rock-it Cargo | |
| | | |
| |
| | | |
| | |
|
| A provider of specialized international logistics solutions to the music touring, performing arts, live events, fine art and specialty industries. |
6.00% Term Loan due 06/22/2024 (G)
(LIBOR + 5.000% Cash & 2.750% PIK) | |
$ | 2,479,244 | | |
* | |
| 2,440,502 | | |
| 1,991,081 | |
| * 07/30/18 and 09/30/20. | |
| | | |
| |
| | | |
| | |
| | |
| | | |
| |
| | | |
| | |
| ROI Solutions | |
| | | |
| |
| | | |
| | |
| Call center outsourcing and end user engagement services provider. |
| 6.00% Term Loan due 07/31/2024 (LIBOR + 5.000%) | |
$ | 1,621,240 | | |
07/31/18 | |
| 632,022 | | |
| 627,255 | |
| | |
| | | |
| |
| | | |
| | |
| Ruffalo Noel Levitz | |
| | | |
| |
| | | |
| | |
| A provider of enrollment management, student retention and career services, and fundraising management for colleges and universities. |
| 7.00% Term Loan due 05/29/2022 (LIBOR + 6.000%) | |
$ | 1,241,787 | | |
01/08/19 | |
| 1,232,677 | | |
| 1,223,161 | |
| | |
| | | |
| |
| | | |
| | |
| Sandvine Corporation | |
| | | |
| |
| | | |
| | |
| A provider of active network intelligence solutions. |
8.15% Second Lien Term Loan due 11/02/2026
(LIBOR + 8.000%) | |
$ | 1,725,000 | | |
11/01/18 | |
| 1,692,191 | | |
| 1,672,388 | |
| | |
| | | |
| |
| | | |
| | |
| Sara Lee Frozen Foods | |
| | | |
| |
| | | |
| | |
| A provider of frozen bakery products, desserts and sweet baked goods. |
5.50% Lien Term Loan due 07/30/2025
(LIBOR + 4.500%) | |
$ | 1,506,455 | | |
07/27/18 | |
| 1,483,085 | | |
| 1,394,375 | |
| | |
| | | |
| |
| | | |
| | |
| Scaled Agile, Inc. | |
| | | |
| |
| | | |
| | |
| A provider of training and certifications for IT professionals focused on software development. |
| 5.75% Term Loan due 06/28/2024 (LIBOR + 4.750%) | |
$ | 659,142 | | |
06/27/19 | |
| 654,214 | | |
| 652,551 | |
| | |
| | | |
| |
| | | |
| | |
CONSOLIDATED SCHEDULE OF INVESTMENTS (CONTINUED)
September 30, 2020
(Unaudited)
| | |
| | |
| |
| | |
| |
| Corporate Restricted Securities: (A) (Continued) | |
Principal Amount,
Shares, Units or
Ownership Percentage | | |
Acquisition
Date | |
Cost | | |
Fair Value | |
| | |
| | |
| |
| | |
| |
| Soliant Holdings, LLC | |
| | |
| |
| | |
| |
| A healthcare staffing platform focused on placing highly skilled professionals in the education, nursing/allied health, life sciences and pharmacy end-markets. |
| 6.50% Term Loan due 11/30/2026 (LIBOR + 5.500%) | |
$ | 1,013,339 | | |
12/27/19 | |
$ | 995,252 | | |
$ | 993,073 | |
| | |
| | | |
| |
| | | |
| | |
| Specified Air Solutions | |
| | | |
| |
| | | |
| | |
| A manufacturer and distributor of heating, dehumidification and other air quality solutions. |
10.5% (0.5% PIK) Senior Subordinated Note
due 06/19/2024 | |
$ | 1,235,826 | | |
12/19/18 | |
| 1,227,222 | | |
| 1,248,185 | |
| Limited Liability Company Unit | |
| 531,730
uts. | | |
02/20/19 | |
| 539,795 | | |
| 1,550,677 | |
| | |
| | | |
| |
| 1,767,017 | | |
| 2,798,862 | |
| Springbrook Software | |
| | | |
| |
| | | |
| | |
| A provider of vertical-market enterprise resource planning software and payments platforms focused on the local government end-market. |
| 6.75% Term Loan due 12/20/2026 (LIBOR + 5.750%) | |
$ | 1,648,956 | | |
12/23/19 | |
| 1,174,206 | | |
| 1,171,983 | |
| | |
| | | |
| |
| | | |
| | |
| SR Smith LLC | |
| | | |
| |
| | | |
| | |
| A manufacturer of mine and tunneling ventilation products in the United States. |
| 11% Senior Subordinated Note due 03/27/2022 (D) | |
$ | 1,084,565 | | |
* | |
| 1,047,502 | | |
| 1,030,337 | |
| Limited Liability Company Unit Series A | |
| 1,072 uts. | | |
* | |
| 1,060,968 | | |
| 1,777,508 | |
| * 03/27/17 and 08/07/18. | |
| | | |
| |
| 2,108,470 | | |
| 2,807,845 | |
| | |
| | | |
| |
| | | |
| | |
| Strahman Holdings Inc. | |
| | | |
| |
| | | |
| | |
| A manufacturer of industrial valves and wash down equipment for a variety of industries, including chemical, petrochemical, polymer, pharmaceutical, food processing, beverage and mining. |
| Preferred Stock Series A (B) | |
| 158,967
shs. | | |
12/13/13 | |
| 158,967 | | |
| 307,100 | |
| Preferred Stock Series A-2 (B) | |
| 26,543 shs. | | |
09/10/15 | |
| 29,994 | | |
| 51,277 | |
| | |
| | | |
| |
| 188,961 | | |
| 358,377 | |
| Sunrise Windows Holding Company | |
| | | |
| |
| | | |
| | |
| A manufacturer and marketer of premium vinyl windows exclusively selling to the residential remodeling and replacement market. |
| 16% Senior Subordinated Note due 05/28/2021 (D) | |
$ | 2,211,310 | | |
* | |
| 1,358,229 | | |
| 1,769,048 | |
| Common Stock (B) | |
| 38 shs. | | |
12/14/10 | |
| 38,168 | | |
| — | |
Warrant, exercisable until 2020, to purchase
common stock at $.01 per share (B) | |
| 37 shs. | | |
12/14/10 | |
| 37,249 | | |
| — | |
| * 12/14/10, 08/17/12 and 03/31/16. | |
| | | |
| |
| 1,433,646 | | |
| 1,769,048 | |
| | |
| | | |
| |
| | | |
| | |
| | |
| | | |
| |
| | | |
| | |
Barings Participation Investors
CONSOLIDATED SCHEDULE OF INVESTMENTS (CONTINUED)
September 30, 2020
(Unaudited)
| | |
| | |
| |
| | |
| |
| Corporate Restricted Securities: (A) (Continued) | |
Principal Amount,
Shares, Units or
Ownership Percentage | | |
Acquisition
Date | |
Cost | | |
Fair Value | |
| | |
| | |
| |
| | |
| |
| Sunvair Aerospace Group Inc. | |
| | |
| |
| | |
| |
| An aerospace maintenance, repair, and overhaul provider servicing landing gears on narrow body aircraft. |
12% (1% PIK) Senior Subordinated Note
due 08/01/2024 (D) | |
$ | 1,393,644 | | |
07/31/15 | |
$ | 1,385,865 | | |
$ | 1,323,962 | |
| Common Stock (B) | |
| 68
shs. | | |
* | |
| 104,986 | | |
| 86,116 | |
| * 07/31/15 and 11/08/17. | |
| | | |
| |
| 1,490,851 | | |
| 1,410,078 | |
| | |
| | | |
| |
| | | |
| | |
| The Hilb Group, LLC | |
| | | |
| |
| | | |
| | |
| An insurance brokerage platform that offers insurance and benefits programs to middle-market companies throughout the Eastern seaboard. |
| 6.75% Term Loan due 09/30/2026 (LIBOR + 5.750%) | |
$ | 1,515,828 | | |
12/02/19 | |
| 1,232,084 | | |
| 1,228,570 | |
| | |
| | | |
| |
| | | |
| | |
| Therma-Stor Holdings LLC | |
| | | |
| |
| | | |
| | |
| A designer and manufacturer of dehumidifiers and water damage restoration equipment for residential and commercial applications. |
10.5% (0.5% PIK) Senior Subordinated Note
due 11/30/2023 | |
$ | 1,385,385 | | |
11/30/17 | |
| 1,385,384 | | |
| 1,399,238 | |
| Limited Liability Company Unit (B) | |
| 19,696 uts. | | |
11/30/17 | |
| 3,172 | | |
| 7,153 | |
| | |
| | | |
| |
| 1,388,556 | | |
| 1,406,391 | |
| Transit Technologies LLC | |
| | | |
| |
| | | |
| | |
| A software platform for the transportation market that offers end-to-end software solutions focused on operations, fleet management and telematics services. |
| 5.00% Term Loan due 02/10/2025 (LIBOR + 4.750%) | |
$ | 1,560,620 | | |
02/13/20 | |
| 754,729 | | |
| 691,666 | |
| | |
| | | |
| |
| | | |
| | |
| Trident Maritime Systems | |
| | | |
| |
| | | |
| | |
| A leading provider of turnkey marine vessel systems and solutions for government and commercial new ship construction as well as repair, refurbishment, and retrofit markets worldwide. |
| 6.50% Term Loan due 06/04/2024 (LIBOR + 5.500%) | |
$ | 2,339,897 | | |
05/14/18 | |
| 2,307,996 | | |
| 2,298,949 | |
| | |
| | | |
| |
| | | |
| | |
| Tristar Global Energy Solutions, Inc. | |
| | | |
| |
| | | |
| | |
| A hydrocarbon and decontamination services provider serving refineries worldwide. | |
| | | |
| |
| | | |
| | |
12.5% (1.5% PIK) Senior Subordinated Note
due 03/31/2022 (D) | |
$ | 1,204,904 | | |
01/23/15 | |
| 1,204,664 | | |
| 602,452 | |
| | |
| | | |
| |
| | | |
| | |
| Truck-Lite | |
| | | |
| |
| | | |
| | |
| A leading provider of harsh environment LED safety lighting, electronics, filtration systems, and telematics for a wide range of commercial vehicles, specialty vehicles, final mile delivery vehicles, off-road/off-highway, marine, and other adjacent harsh environment markets. |
| 7.25% Term Loan due 12/02/2026 (LIBOR + 6.250%) | |
$ | 1,717,481 | | |
12/13/19 | |
| 1,465,405 | | |
| 1,389,671 | |
| | |
| | | |
| |
| | | |
| | |
| | |
| | | |
| |
| | | |
| | |
CONSOLIDATED SCHEDULE OF INVESTMENTS (CONTINUED)
September 30, 2020
(Unaudited)
| | |
| | |
| |
| | |
| |
| Corporate Restricted Securities: (A) (Continued) | |
Principal Amount,
Shares, Units or
Ownership Percentage | | |
Acquisition
Date | |
Cost | | |
Fair Value | |
| | |
| | |
| |
| | |
| |
| Trystar, Inc. | |
| | |
| |
| | |
| |
| A niche manufacturer of temporary power distribution products for the power rental, industrial, commercial utility and back-up emergency markets. |
| 5.82% Term Loan due 10/01/2023 (LIBOR + 4.750%) | |
$ | 2,014,150 | | |
09/28/18 | |
$ | 1,993,047 | | |
$ | 1,976,486 | |
| Limited Liability Company Unit (B)(F) | |
| 47
uts. | | |
09/28/18 | |
| 46,562 | | |
| 47,078 | |
| | |
| | | |
| |
| 2,039,609 | | |
| 2,023,564 | |
| U.S. Legal Support, Inc. | |
| | | |
| |
| | | |
| | |
| A provider of court reporting, record retrieval and other legal supplemental services. |
| 5.97% Term Loan due 11/12/2024 (LIBOR + 5.750%) | |
$ | 2,174,216 | | |
* | |
| 2,082,039 | | |
| 1,917,069 | |
| * 11/29/18 and 03/25/19. | |
| | | |
| |
| | | |
| | |
| | |
| | | |
| |
| | | |
| | |
| U.S. Oral Surgery Management | |
| | | |
| |
| | | |
| | |
| An operator of oral surgery practices providing medically necessary treatments. |
| 7.00% Term Loan due 12/31/2023 (LIBOR + 6.000%) | |
$ | 2,428,257 | | |
* | |
| 2,387,117 | | |
| 2,379,692 | |
| * 01/04/19 and 10/01/19. | |
| | | |
| |
| | | |
| | |
| | |
| | | |
| |
| | | |
| | |
| U.S. Retirement and Benefit Partners, Inc. | |
| | | |
| |
| | | |
| | |
| A leading independent provider of outsourced benefit design and administration and retirement services, primarily to K-12 school districts, employee unions, and governmental agencies. |
9.75% Second Lien Term Loan due 09/29/2025
(LIBOR + 8.750%) | |
$ | 1,607,700 | | |
03/05/18 | |
| 1,584,780 | | |
| 1,527,797 | |
| | |
| | | |
| |
| | | |
| | |
| UBEO, LLC | |
| | | |
| |
| | | |
| | |
| A dealer and servicer of printers and copiers to medium sized businesses. |
| 11.00% Term Loan due 10/03/2024 | |
$ | 1,558,661 | | |
11/05/18 | |
| 1,536,317 | | |
| 1,527,488 | |
| | |
| | | |
| |
| | | |
| | |
| Velocity Technology Solutions, Inc. | |
| | | |
| |
| | | |
| | |
| A provider of outsourced hosting services for enterprise resource planning software applications and information technology infrastructure to mid and large-sized enterprises. |
7.00% Lien Term Loan due 12/07/2023
(LIBOR + 6.000%) | |
$ | 2,042,250 | | |
12/07/17 | |
| 2,031,399 | | |
| 2,018,968 | |
| | |
| | | |
| |
| | | |
| | |
| VP Holding Company | |
| | | |
| |
| | | |
| | |
| A provider of school transportation services for special-needs and homeless children in Massachusetts and Connecticut. |
5.72% Lien Term Loan due 05/22/2024
(LIBOR + 5.500%) | |
$ | 2,421,015 | | |
05/17/18 | |
| 2,384,866 | | |
| 2,336,522 | |
| | |
| | | |
| |
| | | |
| | |
Barings Participation Investors
CONSOLIDATED SCHEDULE OF INVESTMENTS (CONTINUED)
September 30, 2020
(Unaudited)
| | |
| | |
| |
| | |
| |
| Corporate Restricted Securities: (A) (Continued) | |
Principal Amount,
Shares, Units or
Ownership Percentage | | |
Acquisition
Date | |
Cost | | |
Fair Value | |
| | |
| | |
| |
| | |
| |
| Westminster Acquisition LLC | |
| | |
| |
| | |
| |
| A manufacturer of premium, all-natural oyster cracker products sold under the Westminster and Olde Cape Cod brands. |
12% (1% PIK) Senior Subordinated Note
due 08/03/2021 (D) | |
$ | 383,062 | | |
08/03/15 | |
$ | 382,196 | | |
$ | 95,765 | |
| Limited Liability Company Unit (B)(F) | |
| 370,241
uts. | | |
08/03/15 | |
| 370,241 | | |
| — | |
| | |
| | | |
| |
| 752,437 | | |
| 95,765 | |
| Whitebridge Pet Brands Holdings, LLC | |
| | | |
| |
| | | |
| | |
| A manufacturer and marketer of branded, all-natural treats and foods for dogs and cats. |
| Limited Liability Company Unit Class A (B)(F) | |
| 123 uts. | | |
04/18/17 | |
| 148,096 | | |
| 165,520 | |
| Limited Liability Company Unit Class B (B)(F) | |
| 123 uts. | | |
04/18/17 | |
| — | | |
| 81,179 | |
| | |
| | | |
| |
| 148,096 | | |
| 246,699 | |
| Wolf-Gordon, Inc. | |
| | | |
| |
| | | |
| | |
| A designer and specialty distributor of wallcoverings and related building products, including textiles, paint, and writeable surfaces. |
| Common Stock (B) | |
| 157 shs. | | |
01/22/16 | |
| 62,177 | | |
| 129,328 | |
| | |
| | | |
| |
| | | |
| | |
| World 50, Inc. | |
| | | |
| |
| | | |
| | |
| A provider of exclusive peer-to-peer networks for C-suite executives at leading corporations. |
| 6.25% Term Loan due 01/10/2026 (LIBOR + 5.250%) | |
$ | 381,972 | | |
09/21/20 | |
| 370,566 | | |
| 370,513 | |
| 5.75% Term Loan due 12/31/2025 (LIBOR + 4.750%) | |
$ | 1,221,706 | | |
01/09/20 | |
| 1,194,852 | | |
| 1,186,032 | |
| | |
| | | |
| |
| 1,565,418 | | |
| 1,556,545 | |
| WP Supply Holding Corporation | |
| | | |
| |
| | | |
| | |
| A distributor of fresh fruits and vegetables to grocery wholesalers and foodservice distributors in the upper Midwest. |
| Common Stock (B) | |
| 1,500 shs. | | |
11/03/11 | |
| 150,000 | | |
| 130,014 | |
| | |
| | | |
| |
| | | |
| | |
| York Wall Holding Company | |
| | | |
| |
| | | |
| | |
| A designer, manufacturer and marketer of wall covering products for both residential and commercial wall coverings. |
| Preferred Stock Series A (B) | |
| 2,936 shs. | | |
02/05/19 | |
| 293,616 | | |
| 293,600 | |
| Common Stock (B) | |
| 2,046 shs. | | |
* | |
| 200,418 | | |
| 114,694 | |
| * 03/04/15 and 02/07/18. | |
| | | |
| |
| 494,034 | | |
| 408,294 | |
| | |
| | | |
| |
| | | |
| | |
| | |
| | | |
| |
| | | |
| | |
| Total Private Placement Investments (E) | |
| | | |
| |
$ | 119,433,917 | | |
$ | 114,171,616 | |
| | |
| | | |
| |
| | | |
| | |
CONSOLIDATED SCHEDULE OF INVESTMENTS (CONTINUED)
September 30, 2020
(Unaudited)
| | |
| | |
| |
| | |
| | |
| |
| Corporate Restricted Securities: (A) (Continued) | |
| Interest
Rate | | |
Maturity
Date | |
Principal
Amount
| | |
Cost
| | |
Market
Value
| |
| | |
| | | |
| |
| | | |
| | | |
| | |
| Rule 144A Securities - 12.08%: | |
| | | |
| |
| | | |
| | | |
| | |
| | |
| | | |
| |
| | | |
| | | |
| | |
| Bonds - 12.08% | |
| | | |
| |
| | | |
| | | |
| | |
| Acrisure, LLC | |
| 7.000 | % | |
11/15/25 | |
$ | 757,000 | | |
$ | 710,669 | | |
$ | 743,658 | |
| Altice Financing S.A. | |
| 7.500 | | |
05/15/26 | |
| 308,000 | | |
| 308,000 | | |
| 326,027 | |
| American Airlines Inc | |
| 11.750 | | |
07/15/25 | |
| 500,000 | | |
| 495,195 | | |
| 482,500 | |
| Boyne USA, Inc. | |
| 7.250 | | |
05/01/25 | |
| 129,000 | | |
| 129,000 | | |
| 135,450 | |
| BWAY Holding Company | |
| 7.250 | | |
04/15/25 | |
| 750,000 | | |
| 695,290 | | |
| 705,937 | |
| Calumet Specialty Products Partners, L.P. | |
| 11.000 | | |
04/15/25 | |
| 500,000 | | |
| 500,000 | | |
| 452,500 | |
| Cleveland-Cliffs Inc. | |
| 6.750 | | |
03/15/26 | |
| 500,000 | | |
| 451,572 | | |
| 508,750 | |
| Cleveland-Cliffs Inc. | |
| 9.875 | | |
10/17/25 | |
| 500,000 | | |
| 546,695 | | |
| 558,125 | |
| CommScope Finance LLC | |
| 8.250 | | |
03/01/27 | |
| 500,000 | | |
| 476,773 | | |
| 520,000 | |
| CVR Energy Inc. | |
| 5.750 | | |
02/15/28 | |
| 500,000 | | |
| 453,586 | | |
| 425,000 | |
| CVR Partners, L.P. | |
| 9.250 | | |
06/15/23 | |
| 268,000 | | |
| 264,887 | | |
| 247,900 | |
| Diebold Nixdorf | |
| 9.375 | | |
07/15/25 | |
| 350,000 | | |
| 373,291 | | |
| 369,250 | |
| Dominion Diamond (D) | |
| 7.125 | | |
11/01/22 | |
| 500,000 | | |
| 279,489 | | |
| 8,000 | |
| Financial & Risk US Holdings, Inc. | |
| 6.250 | | |
05/15/26 | |
| 116,000 | | |
| 116,000 | | |
| 124,120 | |
| First Quantum Minerals Ltd. | |
| 7.500 | | |
04/01/25 | |
| 500,000 | | |
| 479,664 | | |
| 494,555 | |
| First Quantum Minerals Ltd. | |
| 7.250 | | |
04/01/23 | |
| 385,000 | | |
| 382,397 | | |
| 384,519 | |
| Gates Global LLC | |
| 6.250 | | |
01/15/26 | |
| 600,000 | | |
| 535,542 | | |
| 618,474 | |
| Genesys Telecommunications Laboratories, Inc. | |
| 10.000 | | |
11/30/24 | |
| 500,000 | | |
| 486,300 | | |
| 529,500 | |
| Golden Nugget, Inc. | |
| 8.750 | | |
10/01/25 | |
| 250,000 | | |
| 222,227 | | |
| 197,188 | |
| GRD Holding III Corp. | |
| 8.750 | | |
09/01/25 | |
| 375,000 | | |
| 378,399 | | |
| 391,643 | |
| Houghton Mifflin Harcourt | |
| 9.000 | | |
02/15/25 | |
| 500,000 | | |
| 491,353 | | |
| 480,000 | |
| Jonah Energy LLC | |
| 7.250 | | |
10/15/25 | |
| 385,000 | | |
| 341,326 | | |
| 42,831 | |
| LBC Tank Terminals Holding Netherlands B.V. | |
| 6.875 | | |
05/15/23 | |
| 511,000 | | |
| 515,910 | | |
| 507,168 | |
| OPE KAG Finance Sub | |
| 7.875 | | |
07/31/23 | |
| 385,000 | | |
| 392,783 | | |
| 373,450 | |
| Ortho Clinical Diagnostics, Inc. | |
| 7.250 | | |
02/01/28 | |
| 245,000 | | |
| 224,002 | | |
| 254,800 | |
| Panther BF Aggregator 2 LP | |
| 8.500 | | |
05/15/27 | |
| 100,000 | | |
| 92,783 | | |
| 103,250 | |
| Perenti Finance Pty Ltd | |
| 6.500 | | |
10/07/25 | |
| 500,000 | | |
| 500,000 | | |
| 502,810 | |
| Prime Security Services, LLC | |
| 6.250 | | |
01/15/28 | |
| 885,000 | | |
| 774,852 | | |
| 896,062 | |
| Suncoke Energy | |
| 7.500 | | |
06/15/25 | |
| 385,000 | | |
| 381,031 | | |
| 347,278 | |
| Terrier Media Buyer, Inc. | |
| 8.875 | | |
12/15/27 | |
| 530,000 | | |
| 508,032 | | |
| 533,975 | |
| The Manitowoc Company, Inc. | |
| 9.000 | | |
04/01/26 | |
| 863,000 | | |
| 857,751 | | |
| 891,047 | |
| TransDigm Group, Inc. | |
| 6.250 | | |
03/15/26 | |
| 500,000 | | |
| 494,200 | | |
| 522,147 | |
| Trident TPI Holdings Inc. | |
| 9.250 | | |
08/01/24 | |
| 500,000 | | |
| 487,383 | | |
| 530,775 | |
| Univision Communications Inc. | |
| 6.625 | | |
06/01/27 | |
| 253,000 | | |
| 253,000 | | |
| 246,991 | |
| Veritas US, Inc. | |
| 10.500 | | |
02/01/24 | |
| 750,000 | | |
| 671,711 | | |
| 705,300 | |
| Verscend Holding Corp | |
| 9.750 | | |
08/15/26 | |
| 482,000 | | |
| 511,138 | | |
| 524,074 | |
| VICI Properties, Inc. | |
| 4.625 | | |
12/01/29 | |
| 750,000 | | |
| 623,737 | | |
| 763,125 | |
| VRX Escrow Corp. | |
| 6.125 | | |
04/15/25 | |
| 140,000 | | |
| 140,000 | | |
| 143,325 | |
| Warrior Met Coal, Inc. | |
| 8.000 | | |
11/01/24 | |
| 161,000 | | |
| 161,000 | | |
| 163,969 | |
Barings Participation Investors
CONSOLIDATED SCHEDULE OF INVESTMENTS (CONTINUED)
September 30, 2020
(Unaudited)
| | |
| | |
| |
| | |
| | |
| |
| Corporate Restricted Securities: (A) (Continued) | |
| Interest
Rate | | |
Maturity
Date | |
Principal
Amount
| | |
Cost
| | |
Market
Value
| |
| | |
| | | |
| |
| | | |
| | | |
| | |
| WESCO International, Inc. | |
| 7.125 | % | |
06/15/25 | |
$ | 152,000 | | |
$ | 152,000 | | |
$ | 165,574 | |
| WESCO International, Inc. | |
| 7.250 | | |
06/15/28 | |
| 157,000 | | |
| 155,792 | | |
| 172,021 | |
| | |
| | | |
| |
| | | |
| | | |
| | |
| Total Bonds | |
| | | |
| |
| | | |
| 17,014,760 | | |
| 17,093,068 | |
| | |
| | | |
| |
| | | |
| | | |
| | |
| Common Stock - 0.00% | |
| | | |
| |
| | | |
| | | |
| | |
| TherOX, Inc. (B) | |
| | | |
| |
| 2 | | |
| — | | |
| — | |
| Touchstone Health Partnership (B) | |
| | | |
| |
| 292 | | |
| — | | |
| — | |
| | |
| | | |
| |
| | | |
| | | |
| | |
| Total Common Stock | |
| | | |
| |
| | | |
| — | | |
| — | |
| | |
| | | |
| |
| | | |
| | | |
| | |
| Total Rule 144A Securities | |
| | | |
| |
| | | |
$ | 17,014,760 | | |
$ | 17,093,068 | |
| | |
| | | |
| |
| | | |
| | | |
| | |
| Total Corporate Restricted Securities | |
| | | |
| |
| | | |
$ | 136,448,677 | | |
$ | 131,264,684 | |
| | |
| | | |
| |
| | | |
| | | |
| | |
| | |
| | |
| | |
| |
| | |
| | |
| |
Corporate Public Securities -
6.46%: (A) | |
| LIBOR
Spread | | |
| Interest
Rate | | |
Maturity
Date | |
Principal
Amount
| | |
Cost
| | |
Market
Value
| |
| | |
| | | |
| | | |
| |
| | | |
| | | |
| | |
| Bank Loans - 2.32% | |
| | | |
| | | |
| |
| | | |
| | | |
| | |
| Almonde, Inc. | |
| 3.500 | % | |
| 4.500 | % | |
06/13/24 | |
$ | 355,215 | | |
$ | 311,413 | | |
$ | 331,326 | |
| BMC Software Finance, Inc. | |
| 4.250 | | |
| 4.428 | | |
06/26/25 | |
| 491,250 | | |
| 487,736 | | |
| 475,731 | |
| Confie Seguros Holding II Co. | |
| 8.500 | | |
| 8.673 | | |
10/31/25 | |
| 446,131 | | |
| 439,632 | | |
| 340,175 | |
| Edelman Financial Services | |
| 6.750 | | |
| 6.930 | | |
06/08/26 | |
| 128,178 | | |
| 127,712 | | |
| 122,210 | |
| Envision Healthcare Corp | |
| 3.750 | | |
| 3.928 | | |
10/10/25 | |
| 748,734 | | |
| 513,909 | | |
| 538,422 | |
| Fieldwood Energy LLC (D) | |
| 7.250 | | |
| — | | |
04/01/22 | |
| 977,612 | | |
| 949,869 | | |
| 225 | |
| Golden Nugget, Inc. | |
| 2.500 | | |
| 3.250 | | |
10/04/23 | |
| 436,770 | | |
| 364,977 | | |
| 388,263 | |
| ION Trading Technologies Sarl | |
| 4.000 | | |
| 5.072 | | |
11/21/24 | |
| 270,640 | | |
| 266,127 | | |
| 265,113 | |
| PS Logistics LLC | |
| 4.750 | | |
| 5.750 | | |
03/01/25 | |
| 490,000 | | |
| 493,156 | | |
| 457,386 | |
| STS Operating, Inc. | |
| 8.000 | | |
| 9.000 | | |
04/25/26 | |
| 500,000 | | |
| 505,000 | | |
| 371,565 | |
| | |
| | | |
| | | |
| |
| | | |
| | | |
| | |
| Total Bank Loans | |
| | | |
| | | |
| |
| | | |
| 4,459,531 | | |
| 3,290,416 | |
| | |
| | | |
| | | |
| |
| | | |
| | | |
| | |
| | |
| | | |
| | | |
| |
| | | |
| | | |
| | |
| Bonds - 3.77% | |
| | | |
| | | |
| |
| | | |
| | | |
| | |
| Brunswick Corporation | |
| | | |
| 7.125 | | |
08/01/27 | |
| 500,000 | | |
| 502,877 | | |
| 616,851 | |
| Century Communities, Inc. | |
| | | |
| 5.875 | | |
07/15/25 | |
| 715,000 | | |
| 634,308 | | |
| 743,242 | |
| Clear Channel Worldwide Holdings, Inc. | |
| | | |
| 9.250 | | |
02/15/24 | |
| 137,000 | | |
| 131,065 | | |
| 132,808 | |
| Dish DBS Corporation | |
| | | |
| 7.750 | | |
07/01/26 | |
| 385,000 | | |
| 408,736 | | |
| 423,254 | |
| Genesis Energy LP | |
| | | |
| 6.500 | | |
10/01/25 | |
| 337,000 | | |
| 320,151 | | |
| 291,505 | |
| Hecla Mining Company | |
| | | |
| 7.250 | | |
02/15/28 | |
| 500,000 | | |
| 471,768 | | |
| 542,000 | |
| Hughes Satellite Systems Corporation | |
| | | |
| 7.625 | | |
06/15/21 | |
| 500,000 | | |
| 500,677 | | |
| 518,750 | |
| Jupiter Resources Inc. | |
| | | |
| 13.000 | | |
02/05/24 | |
| 50,428 | | |
| 50,428 | | |
| 49,344 | |
| Laredo Petroleum, Inc. | |
| | | |
| 10.125 | | |
01/15/28 | |
| 500,000 | | |
| 393,342 | | |
| 295,000 | |
| PBF Holding Company LLC | |
| | | |
| 7.250 | | |
06/15/25 | |
| 385,000 | | |
| 394,576 | | |
| 290,675 | |
| Targa Resources Partners LP | |
| | | |
| 4.250 | | |
11/15/23 | |
| 600,000 | | |
| 523,464 | | |
| 594,000 | |
| Triumph Group, Inc. | |
| | | |
| 7.750 | | |
08/15/25 | |
| 500,000 | | |
| 503,233 | | |
| 320,625 | |
| United Rentals (North America), Inc. | |
| | | |
| 4.625 | | |
10/15/25 | |
| 500,000 | | |
| 447,025 | | |
| 511,250 | |
| | |
| | | |
| | | |
| |
| | | |
| | | |
| | |
| Total Bonds | |
| | | |
| | | |
| |
| | | |
| 5,281,650 | | |
| 5,329,304 | |
| | |
| | | |
| | | |
| |
| | | |
| | | |
| | |
CONSOLIDATED SCHEDULE OF INVESTMENTS (CONTINUED)
September 30, 2020
(Unaudited)
| | |
| | |
| |
| | |
| | |
| |
| Corporate Public Securities: (A) (Continued) | |
| | | |
| |
Principal
Amount
| | |
Cost
| | |
Market
Value
| |
| | |
| | | |
| |
| | | |
| | | |
| | |
| Common Stock - 0.02% | |
| | | |
| |
| | | |
| | | |
| | |
| Jupiter Resources Inc. | |
| | | |
| |
$ | 41,472 | | |
$ | 200,439 | | |
$ | 31,104 | |
| | |
| | | |
| |
| | | |
| | | |
| | |
| Total
Common Stock | |
| | | |
| |
| | | |
| 200,439 | | |
| 31,104 | |
| | |
| | | |
| |
| | | |
| | | |
| | |
| Preferred Stock - 0.35% | |
| | | |
| |
| | | |
| | | |
| | |
| B. Riley Financial Inc. | |
| | | |
| |
| 20,000 | | |
| 500,000 | | |
| 496,200 | |
| | |
| | | |
| |
| | | |
| | | |
| | |
| Total Preferred Stock | |
| | | |
| |
| | | |
| 500,000 | | |
| 496,200 | |
| | |
| | | |
| |
| | | |
| | | |
| | |
| Total Corporate Public Securities | |
| | | |
| |
| | | |
$ | 10,441,620 | | |
$ | 9,147,024 | |
| | |
| | | |
| |
| | | |
| | | |
| | |
| | |
| | | |
| |
| | | |
| | | |
| | |
| | |
| | | |
| |
| | | |
| | | |
| | |
| | |
| | | |
| |
| | | |
| | | |
| | |
| Short-Term Security: | |
| Interest
Rate/Yield^ | | |
Maturity
Date | |
Principal
Amount
| | |
Cost
| | |
Market
Value
| |
| | |
| | | |
| |
| | | |
| | | |
| | |
| Commercial Paper - 4.24% | |
| | | |
| |
| | | |
| | | |
| | |
| Avangrid, Inc. | |
| 0.253 | % | |
11/09/20 | |
$ | 1,000,000 | | |
$ | 999,729 | | |
$ | 999,729 | |
| Enbridge (U.S.) Inc. | |
| 0.203 | | |
10/20/20 | |
| 2,000,000 | | |
| 1,999,789 | | |
| 1,999,789 | |
| NRW.Bank | |
| 0.183 | | |
12/08/20 | |
| 1,000,000 | | |
| 999,660 | | |
| 999,707 | |
| Skandinaviska Enskilda Banken (SEB) | |
| 0.220 | | |
10/08/20 | |
| 1,000,000 | | |
| 999,957 | | |
| 999,957 | |
| The Walt Disney Company | |
| 0.470 | | |
02/22/21 | |
| 1,000,000 | | |
| 998,120 | | |
| 998,691 | |
| | |
| | | |
| |
| | | |
| | | |
| | |
| Total Short-Term Securities | |
| | | |
| |
| | | |
$ | 5,997,255 | | |
$ | 5,997,873 | |
| | |
| | | |
| |
| | | |
| | | |
| | |
| Total Investments | |
| 103.45 | % | |
| |
| | | |
$ | 152,887,552 | | |
$ | 146,409,581 | |
| | |
| | | |
| |
| | | |
| | | |
| | |
| Other Assets | |
| 8.22 | | |
| |
| | | |
| | | |
| 11,636,143 | |
| Liabilities | |
| (11.67 | ) | |
| |
| | | |
| | | |
| (16,519,847 | ) |
| | |
| | | |
| |
| | | |
| | | |
| | |
| Total Net Assets | |
| 100.00 | % | |
| |
| | | |
| | | |
$ | 141,525,877 | |
| (A) | In each of the convertible note, warrant, and common stock investments, the issuer has agreed to
provide certain registration rights. |
| (B) | Non-income producing security. |
| (C) | Security valued at fair value using methods determined in good faith by or under the direction
of the Board of Trustees. |
| (D) | Defaulted security; interest not accrued. |
| (E) | Illiquid security. As of September 30, 2020 the values of these securities amounted to $114,171,616
or 80.67% of net assets. |
| (F) | Held in PI Subsidiary Trust |
^ Effective
yield at purchase
PIK - Payment-in-kind
Barings Participation Investors
CONSOLIDATED SCHEDULE OF INVESTMENTS (CONTINUED)
September 30, 2020
(Unaudited)
| Industry Classification: | |
Fair Value/
Market Value | |
| | |
| |
| AEROSPACE & DEFENSE - 6.81% | |
| | |
| American Scaffold, Inc. | |
$ | 1,255,325 | |
| BEI Precision Systems & Space Company, Inc. | |
| 1,908,960 | |
| Dart Buyer, Inc. | |
| 1,395,015 | |
| Sunvair Aerospace Group Inc. | |
| 1,410,078 | |
| TransDigm Group, Inc. | |
| 522,147 | |
| Trident Maritime Systems | |
| 2,298,949 | |
| Trident TPI Holdings Inc. | |
| 530,775 | |
| Triumph Group, Inc. | |
| 320,625 | |
| | |
| 9,641,874 | |
| | |
| | |
| AIRLINES - 0.34% | |
| | |
| American Airlines Inc | |
| 482,500 | |
| | |
| | |
| | |
| | |
| AUTOMOTIVE - 5.43% | |
| | |
| Aurora Parts & Accessories LLC | |
| 210,384 | |
| BBB Industries LLC | |
| 1,515,240 | |
| DPL Holding Corporation | |
| 344,487 | |
| English Color & Supply LLC | |
| 1,705,480 | |
| Holley Performance Products | |
| 2,422,683 | |
| Panther BF Aggregator 2 LP | |
| 103,250 | |
| Truck-Lite | |
| 1,389,671 | |
| | |
| 7,691,195 | |
| | |
| | |
| BANKING - 1.41% | |
| | |
| NRW.Bank | |
| 999,707 | |
| Skandinaviska Enskilda Banken (SEB) | |
| 999,957 | |
| | |
| 1,999,664 | |
| | |
| | |
|
| BROKERAGE, ASSET MANAGERS & EXCHANGES - 0.87% |
| The Hilb Group, LLC | |
| 1,228,570 | |
| | |
| | |
| | |
| | |
| BUILDING MATERIALS - 1.85% | |
| | |
| Happy Floors Acquisition, Inc. | |
| 720,349 | |
| Sunrise Windows Holding Company | |
| 1,769,048 | |
| Wolf-Gordon, Inc. | |
| 129,328 | |
| | |
| 2,618,725 | |
| | |
| | |
| CABLE & SATELLITE - 0.37% | |
| | |
| Hughes Satellite Systems Corporation | |
| 518,750 | |
| | |
| | |
| | |
| | |
| CHEMICALS - 1.10% | |
| | |
| CVR Partners, L.P. | |
| 247,900 | |
| LBC Tank Terminals Holding Netherlands B.V. | |
| 507,168 | |
| Polytex Holdings LLC | |
| 802,489 | |
| | |
| 1,557,557 | |
| | |
Fair Value/
Market Value | |
| | |
| | |
| CONSTRUCTION MACHINERY - 0.36% | |
| | |
| United Rentals (North America), Inc. | |
$ | 511,250 | |
| | |
| | |
| | |
| | |
| CONSUMER CYCLICAL SERVICES - 4.26% | |
| | |
| Accelerate Learning | |
| 926,778 | |
| CHG Alternative Education Holding Company | |
| 1,112,256 | |
| MeTEOR Education LLC | |
| 1,024,061 | |
| PPC Event Services | |
| — | |
| Prime Security Services, LLC | |
| 896,062 | |
| PS Logistics LLC | |
| 457,386 | |
| ROI Solutions | |
| 627,255 | |
| Soliant Holdings, LLC | |
| 993,073 | |
| | |
| 6,036,871 | |
| | |
| | |
| CONSUMER PRODUCTS - 2.52% | |
| | |
| AMS Holding LLC | |
| 186,372 | |
| Blue Wave Products, Inc. | |
| 189,292 | |
| Elite Sportwear Holding, LLC | |
| — | |
| gloProfessional Holdings, Inc. | |
| 1,538,807 | |
| GTI Holding Company | |
| 301,242 | |
Handi Quilter Holding Company (Premier
Needle Arts) | |
| 375,777 | |
| HHI Group, LLC | |
| 325,637 | |
| Manhattan Beachwear Holding Company | |
| — | |
| Master Cutlery LLC | |
| — | |
| Whitebridge Pet Brands Holdings, LLC | |
| 246,699 | |
| York Wall Holding Company | |
| 408,294 | |
| | |
| 3,572,120 | |
| | |
| | |
| DIVERSIFIED MANUFACTURING - 8.18% | |
| | |
| Advanced Manufacturing Enterprises LLC | |
| — | |
| F G I Equity LLC | |
| 1,032,945 | |
| Gates Global LLC | |
| 618,474 | |
| Hyperion Materials & Technologies, Inc. | |
| 1,517,727 | |
| Motion Controls Holdings | |
| 35,744 | |
| Reelcraft Industries, Inc. | |
| 551,566 | |
| SR Smith LLC | |
| 2,807,845 | |
| Strahman Holdings Inc. | |
| 358,377 | |
| The Manitowoc Company, Inc. | |
| 891,047 | |
| Therma-Stor Holdings LLC | |
| 1,406,391 | |
| Trystar, Inc. | |
| 2,023,564 | |
| WESCO International, Inc. | |
| 337,595 | |
| | |
| 11,581,275 | |
| | |
| | |
See Notes to Consolidated
Financial Statements
CONSOLIDATED SCHEDULE OF INVESTMENTS (CONTINUED)
September 30, 2020
(Unaudited)
| Industry Classification: (Continued) | |
Fair Value/
Market Value | |
| | |
| |
| ELECTRIC - 1.90% | |
| | |
| Avangrid, Inc. | |
$ | 999,729 | |
| Electronic Power Systems | |
| 1,686,398 | |
| | |
| 2,686,127 | |
| | |
| | |
| FINANCIAL OTHER - 2.87% | |
| | |
| Acrisure, LLC | |
| 743,658 | |
| Beacon Pointe Advisors, LLC | |
| 614,342 | |
| B. Riley Financial Inc. | |
| 496,200 | |
| Confie Seguros Holding II Co. | |
| 340,175 | |
| Edelman Financial Services | |
| 122,210 | |
| Financial & Risk US Holdings, Inc. | |
| 124,120 | |
| Foundation Risk Partners, Corp. | |
| 86,944 | |
| U.S. Retirement and Benefit Partners, Inc. | |
| 1,527,797 | |
| | |
| 4,055,446 | |
| | |
| | |
| FOOD & BEVERAGE - 3.68% | |
| | |
| Del Real LLC | |
| 1,376,595 | |
| PANOS Brands LLC | |
| 2,216,946 | |
| Sara Lee Frozen Foods | |
| 1,394,375 | |
| Westminster Acquisition LLC | |
| 95,765 | |
| WP Supply Holding Corporation | |
| 130,014 | |
| | |
| 5,213,695 | |
| | |
| | |
| HEALTHCARE - 5.29% | |
| | |
| Cadence, Inc. | |
| 859,557 | |
| CORA Health Services, Inc. | |
| 1,480,836 | |
| Envision Healthcare Corp | |
| 538,422 | |
| GD Dental Services LLC | |
| — | |
| LAC Acquisition LLC | |
| 1,300,778 | |
| Ortho Clinical Diagnostics, Inc. | |
| 254,800 | |
| TherOX, Inc. | |
| — | |
| Touchstone Health Partnership | |
| — | |
| U.S. Oral Surgery Management | |
| 2,379,692 | |
| Verscend Holding Corp | |
| 524,074 | |
| VRX Escrow Corp. | |
| 143,325 | |
| | |
| 7,481,484 | |
| | |
| | |
| HOME CONSTRUCTION - 0.53% | |
| | |
| Century Communities, Inc. | |
| 743,242 | |
| | |
| | |
| | |
| | |
| INDEPENDENT - 0.30% | |
| | |
| Fieldwood Energy LLC | |
| — | |
| Jonah Energy LLC | |
| 42,831 | |
| | |
Fair Value/
Market Value | |
| | |
| | |
| Jupiter Resources Inc. | |
$ | 80,448 | |
| Laredo Petroleum, Inc. | |
| 295,000 | |
| | |
| 418,279 | |
| | |
| | |
| INDUSTRIAL OTHER - 12.20% | |
| | |
| AFC - Dell Holding Corporation | |
| 2,394,073 | |
| Aftermath, Inc. | |
| 1,157,238 | |
| ASPEQ Holdings | |
| 1,184,499 | |
| Brunswick Corporation | |
| 616,851 | |
| Concept Machine Tool Sales, LLC | |
| 611,094 | |
| E.S.P. Associates, P.A. | |
| 219,025 | |
| Hartland Controls Holding Corporation | |
| 1,915,408 | |
| IM Analytics Holdings, LLC | |
| 929,703 | |
| Industrial Service Solutions | |
| 858,314 | |
| Media Recovery, Inc. | |
| 355,588 | |
| PB Holdings LLC | |
| 769,250 | |
| Specified Air Solutions | |
| 2,798,862 | |
| STS Operating, Inc. | |
| 371,565 | |
| UBEO, LLC | |
| 1,527,488 | |
| World 50, Inc. | |
| 1,556,545 | |
| | |
| 17,265,503 | |
| | |
| | |
| LODGING - 0.54% | |
| | |
| VICI Properties, Inc. | |
| 763,125 | |
| | |
| | |
| | |
| | |
| MEDIA & ENTERTAINMENT - 4.54% | |
| | |
| BlueSpire Holding, Inc. | |
| 38,664 | |
| Boyne USA, Inc. | |
| 135,450 | |
| Cadent, LLC | |
| 952,766 | |
| Clear Channel Worldwide Holdings, Inc. | |
| 132,808 | |
| Discovery Education, Inc. | |
| 1,887,461 | |
| Dish DBS Corporation | |
| 423,254 | |
| HOP Entertainment LLC | |
| — | |
| Houghton Mifflin Harcourt | |
| 480,000 | |
| Music Reports, Inc. | |
| 590,041 | |
| The Walt Disney Company | |
| 998,691 | |
| Terrier Media Buyer, Inc. | |
| 533,975 | |
| Univision Communications Inc. | |
| 246,991 | |
| | |
| 6,420,101 | |
| | |
| | |
| METALS & MINING - 2.47% | |
| | |
| Cleveland-Cliffs Inc. | |
| 1,066,875 | |
| Dominion Diamond | |
| — | |
| First Quantum Minerals Ltd. | |
| 879,074 | |
See Notes to Consolidated
Financial Statements
Barings Participation Investors
CONSOLIDATED SCHEDULE OF INVESTMENTS (CONTINUED)
September 30, 2020
(Unaudited)
| Industry Classification: (Continued) | |
Fair Value/
Market Value | |
| | |
| |
| Hecla Mining Company | |
$ | 542,000 | |
| Perenti Finance Pty Ltd | |
| 502,810 | |
| Suncoke Energy | |
| 347,278 | |
| Warrior Met Coal, Inc. | |
| 163,969 | |
| | |
| 3,502,006 | |
| | |
| | |
| MIDSTREAM - 2.04% | |
| | |
| Enbridge (U.S.) Inc. | |
| 1,999,789 | |
| Genesis Energy LP | |
| 291,505 | |
| Targa Resources Partners LP | |
| 594,000 | |
| | |
| 2,885,294 | |
| | |
| | |
| OIL FIELD SERVICES - 0.01% | |
| | |
| Petroplex Inv Holdings LLC | |
| 10,772 | |
| | |
| | |
| | |
| | |
| PACKAGING - 1.60% | |
| | |
| ASC Holdings, Inc. | |
| 897,105 | |
| Brown Machine LLC | |
| 663,819 | |
| BWAY Holding Company | |
| 705,937 | |
| | |
| 2,266,861 | |
| | |
| | |
| PAPER - 1.18% | |
| | |
| Dunn Paper | |
| 1,672,215 | |
| | |
| | |
| | |
| | |
| PHARMACEUTICALS - 0.25% | |
| | |
| Clarion Brands Holding Corp. | |
| 346,830 | |
| | |
| | |
| | |
| | |
| REFINING - 1.57% | |
| | |
| Calumet Specialty Products Partners, L.P. | |
| 452,500 | |
| CVR Energy Inc. | |
| 425,000 | |
| MES Partners, Inc. | |
| 457,365 | |
| PBF Holding Company LLC | |
| 290,675 | |
| Tristar Global Energy Solutions, Inc. | |
| 602,452 | |
| | |
| 2,227,992 | |
| | |
| | |
| RETAILERS - 0.28% | |
| | |
| GRD Holding III Corp. | |
| 391,643 | |
| | |
| | |
| | |
| | |
| RESTAURANTS - 0.41% | |
| | |
| Golden Nugget, Inc. | |
| 388,263 | |
| Golden Nugget, Inc. | |
| 197,188 | |
| | |
| 585,451 | |
| | |
| | |
| | |
| | |
| |
Fair Value/
Market Value | |
| TECHNOLOGY
- 21.45% | |
| | |
| 1WorldSync, Inc. | |
$ | 1,673,757 | |
| Almonde, Inc. | |
| 331,326 | |
| Audio Precision | |
| 1,728,709 | |
| BCC Software, Inc. | |
| 2,836,565 | |
| BMC Software Finance, Inc. | |
| 475,731 | |
| Claritas Holdings, Inc. | |
| 1,538,203 | |
| Clubessential LLC | |
| 1,688,855 | |
| Command Alkon | |
| 1,690,356 | |
| CommScope Finance LLC | |
| 520,000 | |
| Diebold Nixdorf | |
| 369,250 | |
| Genesys Telecommunications Laboratories, Inc. | |
| 529,500 | |
| GraphPad Software, Inc. | |
| 2,421,666 | |
| ION Trading Technologies Sarl | |
| 265,113 | |
| Options Technology Ltd | |
| 1,236,893 | |
| Recovery Point Systems, Inc. | |
| 1,329,384 | |
| REVSpring, Inc. | |
| 1,666,523 | |
| Ruffalo Noel Levitz | |
| 1,223,161 | |
| Sandvine Corporation | |
| 1,672,388 | |
| Scaled Agile, Inc. | |
| 652,551 | |
| Springbrook Software | |
| 1,171,983 | |
| Transit Technologies LLC | |
| 691,666 | |
| U.S. Legal Support, Inc. | |
| 1,917,069 | |
| Velocity Technology Solutions, Inc. | |
| 2,018,968 | |
| Veritas US, Inc. | |
| 705,300 | |
| | |
| 30,354,917 | |
| | |
| | |
| TELECOMMUNICATIONS - 0.23% | |
| | |
| Altice Financing S.A. | |
| 326,027 | |
| | |
| | |
| | |
| | |
| TRANSPORTATION SERVICES - 6.60% | |
| | |
| BDP International, Inc. | |
| 2,421,862 | |
| OPE KAG Finance Sub | |
| 373,450 | |
| Pegasus Transtech Corporation | |
| 2,221,080 | |
| Rock-it Cargo | |
| 1,991,081 | |
| VP Holding Company | |
| 2,336,522 | |
| | |
| 9,343,995 | |
| | |
| | |
Total Investments - 103.44%
(Cost - $152,887,552) | |
$ | 146,401,356 | |
See Notes to Consolidated
Financial Statements
NOTES TO CONSOLIDATED FINANCIAL STATEMENTS
(Unaudited)
Barings Participation Investors
(the “Trust”) was organized as a Massachusetts business trust under the laws of the Commonwealth of Massachusetts pursuant
to a Declaration of Trust dated April 7, 1988.
The Trust is a diversified closed-end
management investment company. Barings LLC (“Barings”), a wholly-owned indirect subsidiary of Massachusetts Mutual
Life Insurance Company (“MassMutual”), acts as its investment adviser. The Trust’s investment objective is to
maintain a portfolio of securities providing a current yield and, when available, an opportunity for capital gains. The Trust’s
principal investments are privately placed, below investment grade, long-term debt obligations including bank loans and mezzanine
debt instruments. Such direct placement securities may, in some cases, be accompanied by equity features such as common stock,
preferred stock, warrants, conversion rights, or other equity features. The Trust typically purchases these investments, which
are not publicly tradable, directly from their issuers in private placement transactions. These investments are typically made
to small or middle market companies. In addition, the Trust may invest, subject to certain limitations, in marketable debt securities
(including high yield and/or investment grade securities) and marketable common stock. Below investment grade or high yield securities
have predominantly speculative characteristics with respect to the capacity of the issuer to pay interest and repay capital.
On January 27, 1998, the
Board of Trustees authorized the formation of a wholly-owned subsidiary of the Trust (“PI Subsidiary Trust”) for the
purpose of holding certain investments. The results of the PI Subsidiary Trust are consolidated in the accompanying financial
statements. Footnote 2.D below discusses the Federal tax consequences of the PI Subsidiary Trust.
| 2. | Significant Accounting Policies |
The following is a summary of significant
accounting policies followed consistently by the Trust in the preparation of its consolidated financial statements in conformity
with accounting principles generally accepted in the United States of America (“U.S. GAAP”).
The Trustees have determined that
the Trust is an investment company in accordance with Accounting Standards Codification (“ASC”) 946, Financial Services
– Investment Companies, for the purpose of financial reporting.
A. Fair Value Measurements:
Under U.S. GAAP, fair value represents
the price that should be received to sell an asset (exit price) in an orderly transaction between willing market participants at
the measurement date.
Determination of Fair Value
The determination of the fair
value of the Trust’s investments is the responsibility of the Trust’s Board of Trustees (the
“Trustees”).
The Trustees have adopted procedures for the valuation of the Trust’s securities and have delegated responsibility for applying
those procedures to Barings. Barings has established a Pricing Committee which is responsible for setting the guidelines used in
following the procedures adopted by the Trustees ensuring that those guidelines are being followed. Barings considers all relevant
factors that are reasonably available, through either public information or information available to Barings, when determining
the fair value of a security. The Trustees meet at least once each quarter to approve the value of the Trust’s portfolio
securities as of the close of business on the last business day of the preceding quarter. This valuation requires the approval
of a majority of the Trustees of the Trust, including a majority of the Trustees who are not interested persons of the Trust or
of Barings. In approving valuations, the Trustees will consider reports by Barings analyzing each portfolio security in accordance
with the procedures and guidelines referred to above, which include the relevant factors referred to below. Barings has agreed
to provide such reports to the Trust at least quarterly. The consolidated financial statements include private placement restricted
securities valued at $114,171,616 (80.67% of net assets) as of September 30, 2020 the values of which have been estimated
by the Trustees based on the process described above in the absence of readily ascertainable market values. Due to the inherent
uncertainty of valuation, those estimated values may differ significantly from the values that would have been used had a ready
market for the securities existed, and the differences could be material.
Independent Valuation Review
Barings has engaged an independent
valuation firm to provide third-party valuation consulting services at the end of each fiscal quarter which consist of certain
limited procedures that the Trust identified and requested the valuation firm to perform (hereinafter referred to as the “Procedures”).
The Procedures generally consist of a review of the quarterly fair values of the Trust’s middle-market loan investments,
and are generally performed with respect to each middle-market loan investment at least once in every calendar year and for new
middle-market loan investments, at least once in the twelve-month period subsequent to the initial investment. In addition, the
Procedures will generally be performed with respect to an investment where there has been a significant change in the fair value
or performance of the investment. In certain instances, the Trust may determine that it is not cost-effective, and as a result
is not in the shareholders’ best interests, to request the independent valuation firm to perform the Procedures on certain
investments. Such instances include, but are not limited to, situations where the fair value of the investment in the portfolio
company is determined to be insignificant relative to the total investment portfolio.
Upon completion of the Procedures,
the valuation firm concluded that, with respect to each investment reviewed by the valuation firm, the fair value of those investments
subjected to the Procedures appeared reasonable. Finally,
Barings
Participation Investors
NOTES TO CONSOLIDATED FINANCIAL STATEMENTS
(CONTINUED)
(Unaudited)
the Trustees determined in good faith that the Trust’s investments
were valued at fair value in accordance with the Trust’s valuation policies and procedures and the 1940 Act based on, among
other things, the input of Barings, the Trust’s Audit Committee and the independent valuation firm.
Following is a description of
valuation methodologies used for assets recorded at fair value.
Corporate Public Securities
at Market Value – Bank Loans, Corporate Bonds, Preferred Stocks and Common Stocks
The Trust uses external independent
third-party pricing services to determine the fair values of its Corporate Public Securities. At September 30, 2020, 100%
of the carrying value of these investments was from external pricing services. In the event that the primary pricing service does
not provide a price, the Trust utilizes the pricing provided by a secondary pricing service.
Public debt securities generally
trade in the over-the-counter market rather than on a securities exchange. The Trust’s pricing services use multiple valuation
techniques to determine fair value. In instances where significant market activity exists, the pricing services may utilize a market
based approach through which quotes from market makers are used to determine fair value. In instances where significant market
activity may not exist or is limited, the pricing services also utilize proprietary valuation models which may consider market
characteristics such as benchmark yield curves, option adjusted spreads, credit spreads, estimated default rates, coupon rates,
anticipated timing of principal underlying prepayments, collateral, and other unique security features in order to estimate the
relevant cash flows, which are then discounted to calculate the fair value.
The Trust’s investments
in bank loans are normally valued at the bid quotation obtained from dealers in loans by an independent pricing service in accordance
with the Trust’s valuation policies and procedures approved by the Trustees.
Public equity securities listed
on an exchange or on the NASDAQ National Market System are valued at the last quoted sales price of that day.
At least annually, Barings conducts
reviews of the primary pricing vendors to validate that the inputs used in that vendors’ pricing process are deemed to be
market observable as defined in the standard. While Barings is not provided access to proprietary models of the vendors, the reviews
have included on-site walk-throughs of the pricing process, methodologies and control procedures for each asset class and level
for which prices are provided. The reviews also include an examination of the underlying inputs and assumptions for a sample of
individual securities across asset classes, credit rating levels and various durations. In
addition, the pricing vendors
have an established challenge process in place for all security valuations, which facilitates identification and resolution of
prices that fall outside expected ranges. Barings believes that the prices received from the pricing vendors are representative
of prices that would be received to sell the assets at the measurement date (exit prices) and are classified appropriately in
the hierarchy.
Corporate Restricted Securities
at Fair Value – Bank Loans, Corporate Bonds
The fair value of certain notes
is determined using an internal model that discounts the anticipated cash flows of those notes using a specific discount rate.
Changes to that discount rate are driven by changes in general interest rates, probabilities of default and credit adjustments.
The discount rate used within the models to discount the future anticipated cash flows is considered a significant unobservable
input. Increases/(decreases) in the discount rate would result in a (decrease)/increase to the notes’ fair value.
The fair value of certain distressed
notes is based on an enterprise waterfall methodology which is discussed in the equity security valuation section below.
Corporate Restricted Securities
at Fair Value – Common Stock, Preferred Stock and Partnerships & LLC’s
The fair value of equity securities
is determined using an enterprise waterfall methodology. Under this methodology, the enterprise value of the company is first estimated
and that value is then allocated to the company’s outstanding debt and equity securities based on the documented priority
of each class of securities in the capital structure. Generally, the waterfall proceeds from senior debt, to senior and junior
subordinated debt, to preferred stock, then finally common stock.
To estimate a company’s
enterprise value, the company’s trailing twelve months earnings before interest, taxes, depreciation and amortization (“EBITDA”)
is multiplied by a valuation multiple.
Both the company’s EBITDA
and valuation multiple are considered significant unobservable inputs. Increases/(decreases) to the company’s EBITDA and/or
valuation multiple would result in increases/(decreases) to the equity value.
Short-Term Securities
Short-term securities with more
than sixty days to maturity are valued at fair value, using external independent third-party services. Short-term securities, of
sufficient credit quality, having a maturity of sixty days or less are valued at amortized cost, which approximates fair value.
NOTES TO CONSOLIDATED FINANCIAL STATEMENTS
(CONTINUED)
(Unaudited)
Fair Value Hierarchy
The Trust categorizes its investments
measured at fair value in three levels, based on the inputs and assumptions used to determine fair value. These levels are as follows:
Level 1 – quoted prices in
active markets for identical securities
Level 2 – other significant
observable inputs (including quoted prices for similar securities, interest rates, prepayment speeds, credit risk, etc.)
Level 3 – significant unobservable
inputs (including the Trust’s own assumptions in determining the fair value of investments)
The following table summarizes
the levels in the fair value hierarchy into which the Trust’s financial instruments are categorized as of September 30,
2020.
The fair values of the Trust’s investments
disaggregated into the three levels of the fair value hierarchy based upon the lowest level of significant input used in the valuation
as of September 30, 2020 are as follows:
| Assets: | |
Total | | |
Level 1 | | |
Level 2 | | |
Level 3 | |
| Restricted Securities | |
| | | |
| | | |
| | | |
| | |
| Corporate Bonds | |
$ | 41,408,038 | | |
$ | — | | |
$ | 17,093,068 | | |
$ | 24,314,970 | |
| Bank Loans | |
| 76,564,800 | | |
| — | | |
| 461,019 | | |
| 76,103,781 | |
| Common Stock - U.S. | |
| 2,861,924 | | |
| — | | |
| — | | |
| 2,861,924 | |
| Preferred Stock | |
| 2,985,342 | | |
| — | | |
| — | | |
| 2,985,342 | |
| Partnerships and LLCs | |
| 7,444,580 | | |
| — | | |
| — | | |
| 7,444,580 | |
| Public Securities | |
| | | |
| | | |
| | | |
| | |
| Loans | |
| 3,290,416 | | |
| — | | |
| 3,290,416 | | |
| — | |
| Corporate Bonds | |
| 5,329,304 | | |
| — | | |
| 5,279,960 | | |
| 49,344 | |
| Common Stock - U.S. | |
| 31,104 | | |
| — | | |
| 31,104 | | |
| — | |
| Preferred Stock | |
| 496,200 | | |
| — | | |
| 496,200 | | |
| — | |
| Short-term Securities | |
| 5,997,873 | | |
| — | | |
| 5,997,873 | | |
| — | |
| Total | |
$ | 146,409,581 | | |
$ | — | | |
$ | 32,649,640 | | |
$ | 113,759,941 | |
|
| See information disaggregated by security type and industry classification in the Consolidated Schedule of Investments. |
Barings
Participation Investors
NOTES TO CONSOLIDATED FINANCIAL STATEMENTS
(CONTINUED)
(Unaudited)
Quantitative Information about
Level 3 Fair Value Measurements*
The following table represents
quantitative information about Level 3 fair value measurements as of September 30, 2020.
| |
Fair Value |
Valuation
Technique |
Unobservable
Inputs |
Range |
Weighted** |
| |
|
|
|
|
|
| Bank Loans |
$76,103,781 |
Income Approach |
Implied Spread |
4.2% to 14.5% |
7.1% |
| |
|
|
|
|
|
| Corporate Bonds |
$16,239,273 |
Income Approach |
Implied Spread |
8.4% to 20.5% |
11.5% |
| |
|
|
|
|
|
| |
$8,075,697 |
Enterprise Value
Waterfall Approach |
Valuation Multiple |
5.0x to 10.7x |
8.1x |
| |
|
|
|
|
|
| |
|
|
EBITDA |
$0.1 million to
$21.7 million |
$8.9 million |
| |
|
|
|
|
|
| Equity Securities** |
$13,291,846 |
Enterprise Value
Waterfall Approach |
Valuation Multiple |
5.0x to 17.3x |
10.0x |
| |
|
|
|
|
|
| |
|
|
EBITDA |
$0.0 million to
$289.5 million |
$37.9 million |
| * | Excludes Level 3 assets of $49,344 which are valued based upon unadjusted prices from independent
pricing services and independent indicative broker quotes where pricing inputs are not readily available. |
| ** | The weighted averages disclosed in the table above were weighted by relative fair value |
| *** | Including partnerships and LLC’s |
Following is a reconciliation of Level 3
assets for which significant unobservable inputs were used to determine fair value:
| Assets: | |
Beginning
balance at
12/31/2019 | | |
Included in
earnings | | |
Purchases | | |
Sales | | |
Prepayments | | |
Transfers
into
Level 3 | | |
Transfers
out of
Level 3 | | |
Ending
balance at
09/30/2020 | |
| Restricted Securities | |
| | | |
| | | |
| | | |
| | | |
| | | |
| | | |
| | | |
| | |
| Corporate Bonds | |
$ | 42,798,389 | | |
$ | (3,685,834 | ) | |
$ | (324,321 | ) | |
$ | (7,779,864 | ) | |
$ | (6,693,400 | ) | |
$ | — | | |
$ | — | | |
$ | 24,314,970 | |
| Bank Loans | |
| 70,255,151 | | |
| (2,348,609 | ) | |
| 12,626,114 | | |
| (200 | ) | |
| (5,042,539 | ) | |
| 613,864 | | |
| — | | |
| 76,103,781 | |
| Common Stock - U.S. | |
| 3,993,481 | | |
| 422,114 | | |
| 10 | | |
| (1,553,681 | ) | |
| — | | |
| — | | |
| — | | |
| 2,861,924 | |
| Preferred Stock | |
| 2,836,867 | | |
| (212,151 | ) | |
| 531,743 | | |
| (171,117 | ) | |
| — | | |
| — | | |
| — | | |
| 2,985,342 | |
| Partnerships and LLCs | |
| 7,510,960 | | |
| (85,141 | ) | |
| 64,916 | | |
| (46,155 | ) | |
| — | | |
| — | | |
| — | | |
| 7,444,580 | |
| Public Securities | |
| | | |
| | | |
| | | |
| | | |
| | | |
| | | |
| | | |
| | |
| Bank Loans | |
| 1,168,841 | | |
| (5,000 | ) | |
| — | | |
| — | | |
| (489,999 | ) | |
| — | | |
| (673,842 | ) | |
| — | |
| Common Stock - U.S. | |
| — | | |
| — | | |
| — | | |
| — | | |
| — | | |
| — | | |
| — | | |
| — | |
| Corporate Bonds | |
| — | | |
| (1,084 | ) | |
| 50,428 | | |
| — | | |
| — | | |
| — | | |
| — | | |
| 49,344 | |
| | |
$ | 128,563,689 | | |
$ | (5,915,705 | ) | |
$ | 12,948,890 | | |
$ | (9,551,017 | ) | |
$ | (12,225,938 | ) | |
$ | 613,864 | | |
$ | (673,842 | ) | |
$ | 113,759,941 | |
NOTES TO CONSOLIDATED FINANCIAL STATEMENTS
(CONTINUED)
(Unaudited)
Income, Gains and Losses on Level
3 assets included in Net Increase in Net Assets resulting from Operations for the year are presented in the following accounts
on the Statement of Operations:
| | |
Net Increase in Net Assets
Resulting from
Operations | | |
Change in
Unrealized
Gains &
(Losses) in
Net Assets
from assets
still held | |
| | |
| | |
| |
| Interest (Amortization) | |
$ | 238,166 | | |
| — | |
| | |
| | | |
| | |
| Net realized gain on investments before taxes | |
$ | (378,510 | ) | |
| — | |
| | |
| | | |
| | |
| Net change in unrealized appreciation of investments before taxes | |
$ | (5,775,361 | ) | |
| (6,750,514 | ) |
B. Accounting for Investments:
Investment Income
Investment transactions are accounted
for on the trade date. Interest income, including the amortization of premiums and accretion of discounts on bonds held using the
yield-to-maturity method, is recorded on the accrual basis to the extent that such amounts are expected to be collected. Generally,
when interest and/or principal payments on a loan become past due, or if the Trust otherwise does not expect the borrower to be
able to service its debt and other obligations, the Trust will place the investment on non-accrual status and will cease recognizing
interest income on that investment for financial reporting purposes until all principal and interest have been brought current
through payment or due to a restructuring such that the interest income is deemed to be collectible. The Trust writes off any previously
accrued and uncollected interest when it is determined that interest is no longer considered collectible. As of September 30,
2020, the fair value of the Trust’s non-accrual assets was $8,083,922, or 5.5% of the total fair value of the Trust’s
portfolio, and the cost of the Trust’s non-accrual assets was $14,260,508, or 9.3% of the total cost of the Trust’s
portfolio.
Payment-in-Kind Interest
The Trust currently holds, and
expects to hold in the future, some investments in its portfolio that contain Payment-in-Kind (“PIK”) interest provisions.
The PIK interest, computed at the contractual rate specified in each loan agreement, is added to the principal balance of the investment,
rather than being paid to the Trust in cash, and is recorded as interest income. Thus, the actual collection of PIK interest may
be deferred until the time of debt principal repayment. PIK interest, which is a non-cash source of income at the time of recognition,
is included in the Trust’s taxable income and therefore affects the amount the Trust is required to distribute
to its stockholders
to maintain its qualification as a “regulated investment company” for federal income tax purposes, even though the
Trust has not yet collected the cash.
Generally, when current cash
interest and/or principal payments on an investment become past due, or if the Trust otherwise does not expect the borrower
to be able to service its debt and other obligations, the Trust will place the investment on PIK non-accrual status and will
cease recognizing PIK interest income on that investment for financial reporting purposes until all principal and interest
have been brought current through payment or due to a restructuring such that the interest income is deemed to be
collectible. The Trust writes off any accrued and uncollected PIK interest when it is determined that the PIK interest is no
longer collectible. As of September 30, 2020, the fair value of the Trust’s PIK non-accrual assets was $1,991,081, or
1.4% of the total fair value of the Trust’s portfolio, and the cost of the Trust’s PIK non-accrual assets was
$2,440,502, or 1.6% of the total cost of the Trust’s portfolio.
Realized Gain or Loss and Unrealized
Appreciation or Depreciation of Portfolio Investments
Realized gains and losses on investment
transactions and unrealized appreciation and depreciation of investments are reported for financial statement and Federal income
tax purposes on the identified cost method.
C. Use of Estimates:
The preparation of financial statements
in conformity with U.S. GAAP requires management to make estimates and assumptions that affect the reported amounts of assets and
liabilities, disclosure of contingent assets and liabilities and the reported amounts of revenues and expenses during the reporting
period. Actual results could differ from those estimates and the differences could be material.
D. Federal Income Taxes:
The Trust has elected to be taxed
as a “regulated investment company” under the Internal Revenue Code, and intends to maintain this qualification and
to distribute substantially all of its net taxable income to its shareholders. In any year when net long-term capital gains are
realized by the Trust, management, after evaluating the prevailing economic conditions, will recommend that Trustees either designate
the net realized long-term gains as undistributed and pay the federal capital gains taxes thereon, or distribute all or a portion
of such net gains.
The Trust is taxed as a regulated
investment company and is therefore limited as to the amount of non-qualified income that it may receive as the result of operating
a trade or business, e.g. the Trust’s pro rata share of income allocable to the Trust by a partnership operating company.
The Trust’s violation of this limitation could result in the loss of its status as a regulated investment company, thereby
subjecting all of its net income and capital gains to corporate taxes prior to distribution to its shareholders. The Trust, from
time-to-time,
Barings
Participation Investors
NOTES TO CONSOLIDATED FINANCIAL STATEMENTS
(CONTINUED)
(Unaudited)
identifies investment opportunities in the securities of entities that could cause such trade or business income
to be allocable to the Trust. The PI Subsidiary Trust (described in Footnote 1, above) was formed in order to allow investment
in such securities without adversely affecting the Trust’s status as a regulated investment company.
The PI Subsidiary Trust is not
taxed as a regulated investment company. Accordingly, prior to the Trust receiving any distributions from the PI Subsidiary Trust,
all of the PI Subsidiary Trust’s taxable income and realized gains, including non-qualified income and realized gains, is
subject to taxation at prevailing corporate tax rates. As of September 30, 2020, the PI Subsidiary Trust has incurred income
tax expense of $348,194.
Deferred tax assets and liabilities
are recognized for the future tax consequences attributable to differences between the financial statement carrying amounts of
the existing assets and liabilities and their respective tax basis. As of September 30, 2020, the PI Subsidiary Trust has
no deferred tax liability.
E. Distributions to Shareholders:
The Trust records distributions
to shareholders from distributable earnings and net realized gains, if any, on the ex-dividend date. The Trust’s dividend
is declared four times per year, in April, July, October, and December. The Trust’s net realized capital gain distribution,
if any, is declared in December.
| 3. | Investment Advisory and Administrative Services Contract |
A. Services:
Under an Investment Advisory and
Administrative Services Contract (the “Contract”) with the Trust, Barings has agreed to use its best efforts to present
to the Trust a continuing and suitable investment program consistent with the investment objectives and policies of the Trust.
Barings represents the Trust in any negotiations with issuers, investment banking firms, securities brokers or dealers and other
institutions or investors relating to the Trust’s investments. Under the Contract, Barings also provides administration of
the day-to-day operations of the Trust and provides the Trust with office space and office equipment, accounting and bookkeeping
services, and necessary executive, clerical and secretarial personnel for the performance of the foregoing services.
B. Fee:
For its services under the Contract,
Barings is paid a quarterly investment advisory fee equal to 0.225% of the value of the Trust’s net assets as of the last
business day of each fiscal quarter, an amount approximately equivalent to 0.90% on an annual basis. A majority of the Trustees,
including a majority of the Trustees who are not interested persons of the Trust or of Barings, approve the valuation of the Trust’s
net assets as of such day.
MassMutual holds the Trust’s
$15,000,000 Senior Fixed Rate Convertible Note (the “Note”) issued by the Trust on December 13, 2011. The Note
is due December 13, 2023 and accrues interest at 4.09% per annum. MassMutual, at its option, can convert the principal amount
of the Note into common shares. The dollar amount of principal would be converted into an equivalent dollar amount of common shares
based upon the average price of the common shares for ten business days prior to the notice of conversion. For the nine months
ended September 30, 2020, the Trust incurred total interest expense on the Note of $460,125.
The Trust may redeem the Note,
in whole or in part, at the principal amount proposed to be redeemed together with the accrued and unpaid interest thereon through
the redemption date plus the Make Whole Premium. The Make Whole Premium equals the excess of (i) the present value of the
scheduled payments of principal and interest which the Trust would have paid but for the proposed redemption, discounted at the
rate of interest of U.S. Treasury obligations whose maturity approximates that of the Note plus 0.50% over (ii) the principal
of the Note proposed to be redeemed.
| 5. | Purchases and Sales of Investments |
| | |
| | |
| |
| | |
For the nine
months ended
9/30/2020 | |
| | |
Cost of
Investments
Acquired | | |
Proceeds
from
Sales or
Maturities | |
| | |
| | | |
| | |
| Corporate restricted securities | |
$ | 22,933,179 | | |
$ | 23,556,126 | |
| Corporate public securities | |
| 4,485,733 | | |
| 1,692,806 | |
The aggregate cost of investments
is substantially the same for financial reporting and Federal income tax purposes as of September 30, 2020. The net unrealized
depreciation of investments for financial reporting and Federal tax purposes as of September, 2020 is $(6,477,971) and consists
of $7,961,644 appreciation and $14,439,615 depreciation.
Net unrealized depreciation of
investments on the Statement of Assets and Liabilities reflects the balance net of a deferred tax liability of $nil on net unrealized
losses on the PI Subsidiary Trust.
NOTES TO CONSOLIDATED FINANCIAL STATEMENTS
(CONTINUED)
(Unaudited)
| 6. | Quarterly Results of Investment Operations (unaudited) |
| | |
| |
| | |
March 31, 2020 | |
| | |
| | |
| |
| | |
Amount
| | |
Per Share
| |
| | |
| | | |
| | |
| Investment income | |
$ | 3,518,403 | | |
| | |
| Net investment income | |
| 2,788,295 | | |
$ | 0.26 | |
| Net realized and unrealized loss on investments (net of taxes) | |
| (11,233,880 | ) | |
| (1.06 | ) |
| | |
| | | |
| | |
| | |
June 30, 2020 | |
| | |
| | | |
| | |
| | |
Amount
| | |
Per Share
| |
| | |
| | | |
| | |
| Investment income | |
$ | 2,711,944 | | |
| | |
| Net investment income | |
| 2,023,305 | | |
$ | 0.19 | |
| Net realized and unrealized loss on investments (net of taxes) | |
| 20,738 | | |
| 0.00 | |
| | |
| | | |
| | |
| | |
September 30, 2020 | |
| | |
| | | |
| | |
| | |
Amount
| | |
Per Share
| |
| | |
| | | |
| | |
| Investment income | |
$ | 2,634,304 | | |
| | |
| Net investment income | |
| 2,123,495 | | |
$ | 0.20 | |
| Net realized and unrealized loss on investments (net of taxes) | |
| 3,734,931 | | |
| 0.35 | |
In the normal course of its business,
the Trust trades various financial instruments and enters into certain investment activities with investment risks. These risks
include: (i) market risk, (ii) volatility risk and (iii) credit, counterparty and liquidity risk. It is the Trust’s
policy to identify, measure and monitor risk through various mechanisms including risk management strategies and credit policies.
These include monitoring risk guidelines and diversifying exposures across a variety of instruments, markets and counterparties.
There can be no assurance that the Trust will be able to implement its credit guidelines or that its risk monitoring strategies
will be successful.
The pandemic related to the global
spread of novel coronavirus disease (COVID-19), which was first detected in December 2019, has resulted in significant disruptions
to global business activity and the global economy, as well as the economies of individual countries, the financial performance
of individual companies and sectors, and the securities and commodities markets in general. This pandemic, the full effects of
which are still unknown, has resulted in substantial market volatility and may continue to adversely impact the prices and liquidity
of the Trust’s investments and the Trust’s performance.
| 8. | Commitments and Contingencies |
During the normal course of business,
the Trust may enter into contracts and agreements that contain a variety of representations and warranties. The exposure, if any,
to the Trust under these arrangements is unknown as this would involve future claims that may or may not be made against the Trust
and which have not yet occurred. The Trust has no history of prior claims related to such contracts and agreements.
At September 30, 2020, the
Trust had the following unfunded commitments:
| |
Investment | |
| Unfunded Amount | |
| |
ROI Solutions, LLC | |
$ | 961,561 | |
| |
Transit Technologies LLC | |
| 780,310 | |
| |
Foundation Risk Partners, Corp. (1st Lien) | |
| 583,333 | |
| |
Springbrook Software | |
| 448,116 | |
| |
Lighthouse Autism Center | |
| 393,333 | |
| |
Beacon Pointe Advisors, LLC | |
| 363,636 | |
| |
Options Technology Ltd | |
| 335,621 | |
| |
Foundation Risk Partners, Corp. (2nd Lien) | |
| 305,556 | |
| |
Dart Buyer, Inc | |
| 281,175 | |
| |
The Hilb Group, LLC | |
| 249,363 | |
| |
Peterson Party Center, Inc. | |
| 230,000 | |
| |
Truck-Lite Co., LLC | |
| 221,154 | |
| |
CORA Health Services, Inc. | |
| 80,301 | |
| |
US Legal Support Inc. | |
| 58,020 | |
This
privacy notice is being provided on behalf of Barings LLC and its affiliates: Barings Securities LLC; Barings Australia Pty Ltd;
Barings Japan Limited; Barings Investment Advisers (Hong Kong) Limited; Barings Funds Trust; Barings Global Short Duration High
Yield Fund; Barings BDC, Inc.; Barings Corporate Investors and Barings Participation Investors (together, for purposes of this
privacy notice, “Barings”).
When you use Barings you entrust us not
only with your hard-earned assets but also with your personal and financial data. We consider your data to be private and confidential,
and protecting its confidentiality is important to us. Our policies and procedures regarding your personal information are summarized
below.
We may collect non-public personal information
about you from:
| • | Applications or other forms, interviews, or by other means; |
| • | Consumer or other reporting agencies, government agencies, employers or others; |
| • | Your transactions with us, our affiliates, or others; and |
We may share the financial information
we collect with our financial service affiliates, such as insurance companies, investment companies and securities broker-dealers.
Additionally, so that we may continue to offer you products and services that best meet your investment needs and to effect transactions
that you request or authorize, we may disclose the information we collect, as described above, to companies that perform administrative
or marketing services on our behalf, such as transfer agents, custodian banks, service providers or printers and mailers that assist
us in the distribution of investor materials or that provide operational support to Barings. These companies are required to protect
this information and will use this information only for the services for which we hire them, and are not permitted to use or share
this information for any other purpose. Some of these companies may perform such services in jurisdictions other than the United
States. We may share some or all of the information we collect with other financial institutions with whom we jointly market products.
This may be done only if it is permitted by the state in which you live. Some disclosures may be limited to your name, contact
and transaction information with us or our affiliates.
Any disclosures will be only to the extent
permitted by federal and state law. Certain disclosures may require us to get an “opt-in” or “opt-out”
from you. If this is required, we will do so before information is shared. Otherwise, we do not share any personal information
about our customers or former customers unless authorized by the customer or as permitted by law.
We restrict access to personal information
about you to those employees who need to know that information to provide products and services to you. We maintain physical, electronic
and procedural safeguards that comply with legal standards to guard your personal information. As an added measure, we do not include
personal or account information in non-secure e-mails that we send you via the Internet without your prior consent. We advise you
not to send such information to us in non-secure e-mails.
This joint notice describes the privacy
policies of Barings, the Funds and Barings Securities LLC. It applies to all Barings and the Funds accounts you presently have,
or may open in the future, using your social security number or federal taxpayer identification number - whether or not you remain
a shareholder of our Funds or as an advisory client of Barings. As mandated by rules issued by the Securities and Exchange Commission,
we will be sending you this notice annually, as long as you own shares in the Funds or have an account with Barings.
Barings Securities LLC is a member of
the Financial Industry Regulatory Authority (FINRA) and the Securities Investor Protection Corporation (SIPC). Investors may obtain
information about SIPC including the SIPC brochure by contacting SIPC online at www.sipc.org or calling (202)-371-8300. Investors
may obtain information about FINRA including the FINRA Investor Brochure by contacting FINRA online at www.finra.org or by calling
(800) 289-9999.
April 2019
This page left intentionally blank.
Barings
Participation Investors
This page left intentionally blank.
This page left intentionally blank.
Members
of the Board of
Trustees
Clifford
M. Noreen
Chairman
Michael
H. Brown*
Barbara
M. Ginader*
Edward
P. Grace III*
Robert
E. Joyal
Susan
B. Sweeney*
Maleyne
M. Syracuse*
*Member
of the Audit Committee
Officers
Christina
Emery
President
Jonathan
Bock
Vice
President & Chief
Financial
Officer
Jill
Dinerman
Secretary &
Chief Legal Officer
Sean
Feeley
Vice
President
Elizabeth
Murray
Principal
Accounting Officer
Christopher
D. Hanscom
Treasurer
Michael
Cowart
Chief
Compliance Officer
Jonathan
Landsberg
Vice
President
|
|
DIVIDEND
REINVESTMENT AND CASH PURCHASE PLAN
Barings Participation Investors (the “Trust”)
offers a Dividend Reinvestment and Cash Purchase Plan (the “Plan”). The Plan provides a simple and automatic way for
shareholders to add to their holdings in the Trust through the receipt of dividend shares issued by the Trust or through the reinvestment
of cash dividends in Trust shares purchased in the open market. The dividends of each shareholder will be automatically reinvested
in the Trust by DST Systems, Inc., the Transfer Agent, in accordance with the Plan, unless such shareholder elects not to participate
by providing written notice to the Transfer Agent. A shareholder may terminate his or her participation by notifying the Transfer
Agent in writing.
Participating shareholders may also make
additional contributions to the Plan from their own funds. Such contributions may be made by personal check or other means in an
amount not less than $100 nor more than $5,000 per quarter. Cash contributions must be received by the Transfer Agent at least
five days (but no more then 30 days) before the payment date of a dividend or distribution.
Whenever the Trust declares a dividend
payable in cash or shares, the Transfer Agent, acting on behalf of each participating shareholder, will take the dividend in shares
only if the net asset value is lower than the market price plus an estimated brokerage commission as of the close of business on
the valuation day. The valuation day is the last day preceding the day of dividend payment.
When the dividend is to be taken in shares,
the number of shares to be received is determined by dividing the cash dividend by the net asset value as of the close of business
on the valuation date or, if greater than net asset value, 95% of the closing share price. If the net asset value of the shares
is higher than the market value plus an estimated commission, the Transfer Agent, consistent with obtaining the best price and
execution, will buy shares on the open market at current prices promptly after the dividend payment date.
The reinvestment of dividends does not,
in any way, relieve participating shareholders of any federal, state or local tax. For federal income tax purposes, the amount
reportable in respect of a dividend received in newly-issued shares of the Trust will be the fair market value of the shares received,
which will be reportable as ordinary income and/or capital gains.
As compensation for its services, the
Transfer Agent receives a fee of 5% of any dividend and cash contribution (in no event in excess of $2.50 per distribution per shareholder.)
Any questions regarding the Plan should
be addressed to DST Systems, Inc., Transfer Agent for Barings Participation Investors’ Dividend Reinvestment and Cash Purchase
Plan, P.O. Box 219086, Kansas City, MO 64121-9086.
|
|
Barings
Participation Investors |
Barings Participation In... (NYSE:MPV)
Graphique Historique de l'Action
De Jan 2025 à Fév 2025

Barings Participation In... (NYSE:MPV)
Graphique Historique de l'Action
De Fév 2024 à Fév 2025

