Logan International Reports First Quarter 2013 Results
09 Mai 2013 - 10:05PM
Marketwired Canada
Logan International Inc. (TSX:LII) ("Logan" or the "Company") today announced
the financial results for its first quarter of 2013. Revenues for the quarter
were $49.2 million as compared to revenues of $40.9 for the last year's first
quarter. Net earnings were $5.2 million, or $ 0.16 per diluted share, as
compared to $2.8 million, or $0.08 per diluted share, in last year's first
quarter. Modified EBITDA, as defined in the financial table below, increased to
$12.1 million in this year's first quarter from $8.5 million in last year's
first quarter.


The Company completed the acquisition of Xtend Energy Services Inc. ("Xtend")
effective March 1, 2012. Therefore, the first quarter report for 2012 includes
Xtend's operating results from the acquisition date.


Gerald Hage, Chief Executive Officer, stated, "We are pleased with the Company's
quarterly financial results. We are especially pleased with the increase in
Modified EBITDA because this is the metric we use most often to evaluate our
operating performance. In addition, each of our operating units contributed to
the positive comparison, except Logan Completion Systems ("LCS"). Despite a
slight industry slowing, we increased both revenues and Modified EBITDA. Logan
Oil Tools' increase in sales was produced, in part, by the increase in plant
capacity which was completed in 2012. Xtend improved its operating results as a
result of increased U.S. rental revenues. Increased international sales to
Algeria and Russia boosted Dennis Tool's quarterly operating results. Kline
Oilfield Equipment and Scope Production Developments continued to report
consistent sales and operating profits. Finally, the slow startup of Canadian
oilfield operations caused LCS's first quarter financial results to lag last
year's; however, we expect LCS to rebound in the second quarter as sales into
China and planned projects in the U.S. and Mexico will counterbalance the
"Spring Breakup" effect in Canada."


Recent highlights include:


--  Completion of the acquisition of Sup-R-Jar drilling jar product line on
    April 17, 2013.
--  LCS successfully completed 6 wells in China and received firm orders for
    an additional 42 wells to be completed in 2013.
--  Logan Oil Tools increased sales and reduced delivery times as a result
    of the 2012 plant expansion.


Logan manufactures and sells a complete line of quality fishing and intervention
products including retrieving, surface, stroking and remedial tools for a
variety of well work-over, intervention, drilling and completion activities
(Logan Oil Tools, Inc.); provides proprietary multi-zonal completion technology
and conventional completion products and services (Logan Completion Systems
Inc.); manufactures and sells high performance polycrystalline diamond compact
cutters and bearings (Dennis Tool Company); manufactures and sells packers,
bridge plugs and other completion products (Kline Oilfield Equipment, Inc.);
provides proprietary and patented products and services that are focused on
production optimization in sand laden heavy oil wells (Scope Production
Development Ltd.); provides proprietary tools that enhance the effectiveness of
horizontal drilling (Xtend Energy Services Inc.); and rents drilling jars in
North America (Logan Jars, LLC). The common shares of Logan are traded on the
Toronto Stock Exchange under the ticker symbol "LII".


Selected Consolidated Financial Information
(in thousands of US dollars, except per share data)
                                                       Three month periods
                                                              ended
                                                            March 31,
                                                  --------------------------
                                                          2013          2012
                                                  --------------------------

Revenue                                            $    49,194 $      40,894

Net earnings for the period                              5,238         2,819

Earnings per share:
  Basic                                            $      0.16 $        0.08
  Diluted                                          $      0.16 $        0.08

EBITDA (1)                                         $    11,770 $       6,805
Modified EBITDA (1)                                $    12,139 $       8,525
                                                  --------------------------

                                                     March 31,  December 31,
                                                          2013          2012
                                                  --------------------------
Working Capital                                    $    81,082 $      74,295
Total Assets                                       $   281,072 $     275,976
Debt (2)                                           $    61,885 $      60,192
Shareholders' Equity                               $   179,759 $     175,393

Note: The purchase of Xtend was completed on March 1, 2012 and, accordingly,
the Company's three month period ended March 31, 2012 operating results
included one month of Xtend.

(1) Management calculates: (a) EBITDA as earnings before net finance cost,
    taxes, depreciation and amortization ("EBITDA"), and (b) Modified EBITDA
    as EBITDA before acquisition accounting adjustments, transaction fees,
    share-based compensation payments and severance costs. Neither of these
    measurements should be considered an alternative to, or more meaningful
    than, "net earnings from continuing operations" or "cash flow from
    operating activities" as determined in accordance with International
    Financial Reporting Standards ("IFRS") as an indicator of the Company's
    financial performance. EBITDA and Modified EBITDA do not have
    standardized definitions as prescribed by IFRS; therefore, the Company's
    presentation of these measurements may not conform to similar
    presentations by other companies. Management calculates EBITDA and
    Modified EBITDA each period and evaluates the Company's operating
    performance based on these measurements. Management believes that
    Modified EBITDA, which eliminates significant non-cash or non-recurring
    items of revenue or cost, more accurately presents the results of the
    Company's ongoing operations and its ability to generate the cash
    required to fund or finance future growth, acquisitions and capital
    investments. A reconciliation of EBITDA and Modified EBITDA with net
    earnings for each period follows.
                                                         Three month periods
                                                                ended
                                                             March 31,
                                                    ------------------------
                                                            2013        2012
                                                    ------------------------

  Net earnings for the period                          $   5,238   $   2,819
Addbacks:
  Depreciation and amortization                            2,791       2,403
  Finance cost, net                                        1,250         297
  Income tax expense                                       2,491       1,286
                                                    ------------------------
EBITDA                                                    11,770       6,805
Adjustments:
  Acquisition accounting adjustments                           -         354
  Transaction fees                                            92         649
  Share-based compensation payments                          277         717
                                                    ------------------------
Modified EBITDA                                        $  12,139   $   8,525
                                                    ------------------------
                                                    ------------------------
EBITDA and Modified EBITDA are provided as measures of the Company's
operating performance without regard to financing decisions, share-based
compensation payments, age and cost of equipment used and income tax
impacts, all of which are factors that are not controlled at the operating
management level. The acquisition accounting adjustments reverse the effect
of the increase or step-up in cost basis of inventories acquired in a
business combination. The transaction fees include the professional and
other fees incurred in connection with acquisitions in 2012 and 2013. The
share-based compensation payments relate to expense recognized from stock
appreciation rights as well as the Company's stock option and restricted
share unit plans.

(2) Includes bank and other borrowed debt and capital leases.


Forward-Looking Statements

This press release contains forward-looking statements. These statements relate
to future events or future performance of Logan. When used in this press
release, the words "may", "would", "could", "will", "intend", "plan",
"anticipate", "believe", "estimate", "propose", "expect", "potential",
"continue", and similar expressions, are intended to identify forward-looking
statements. These statements involve known and unknown risks, uncertainties, and
other factors that may cause actual results or events to differ materially from
those anticipated in such forward-looking statements. Such statements reflect
Logan's current views with respect to certain events and are subject to certain
risks, uncertainties and assumptions. Although Logan believes that the
expectations and assumptions on which the forward-looking statements are based
are reasonable, undue reliance should not be placed on the forward-looking
statements because we can give no assurance that they will prove to be correct.
Many factors could cause Logan's actual results, performance, or achievements to
materially differ from those described in this press release. Readers are
referred to Logan's Annual Information Form for the year ended December 31, 2012
filed on www.sedar.com which identifies significant risk factors which could
cause actual results to differ from those contained in the forward-looking
statements. Should one or more risks or uncertainties materialize or should
assumptions underlying forward-looking statements prove incorrect, actual
results may vary materially from those described in this press release. The
forward-looking statements contained in this press release are expressly
qualified in their entirety by this cautionary statement. These statements speak
only as of the date of this press release. Logan does not intend and does not
assume any obligation, to update these forward-looking statements to reflect new
information, subsequent events or otherwise, except as required by law.


This press release shall not constitute an offer to sell or the solicitation of
an offer to buy the securities described herein in any jurisdiction.


For more information about Logan International Inc. please visit our website at
www.loganinternationalinc.com.


FOR FURTHER INFORMATION PLEASE CONTACT:
Logan International Inc.
Gerald Hage
Chief Executive Officer
403-930-6810 Calgary
832-386-2575 Houston


Logan International Inc.
Larry Keister
Chief Financial Officer
403-930-6810 Calgary
832-386-2534 Houston
www.loganinternationalinc.com
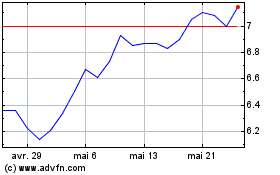
Brompton Lifeco Split (TSX:LCS)
Graphique Historique de l'Action
De Mai 2024 à Juin 2024

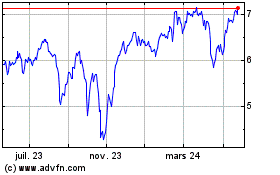
Brompton Lifeco Split (TSX:LCS)
Graphique Historique de l'Action
De Juin 2023 à Juin 2024
