(All figures are in Canadian dollars, unless
stated otherwise. Average exchange rate in Q2 2021: C$1.00 =
R$4.32)
Verde AgriTech Plc (TSX: “NPK”) (OTCQB: “AMHPF”)
("Verde” or the “Company”) is pleased to announce its
financial results for the second quarter, ended on June 30, 2021
(“Q2 2021”), and the upwards revision of its target revenue
for 2021.
Q2 2021 Financials
- Revenue increased by 116%, to $5,376,000 compared to $2,492,000
in the second quarter of 2020 (“Q2 2020”).
- Revenue in Brazilian Real (“R$”) increased by 159%, to
R$23,215,000 compared to R$8,965,000 in Q2 2020.
- Gross margin increased to 72% in Q2 2021, compared to 62% in Q2
2020.
- Operating profit before non-cash events increased by 109%, to
$1,220,000 compared to $584,000 in Q2 2020.
- Trade and other receivables increased 259%, to $6,020,000
compared to $1,675,000 in Q2 2020.
- Sales by volume increased by 35%, to 96,233 tonnes sold
compared to 71,183 tonnes sold in Q2 2020.
- Verde recorded a net profit of $79,000, compared to a net
profit of $444,000 in Q2 2020. A $887,000 non-cash charge from
Verde's long-term incentive programme for 58 employees was the main
reason for the reduction in net profit for the period.
- Cash held by the Company increased by 214%, to $1,908,000,
compared to $ 607,000 in Q2 2020.
“We are proud to see that Verde achieved triple-digit growth in
revenue for the second quarter, especially in light of the
considerable improvement in gross margin. This consistent growth in
the first half of the year made it possible for us to, once more,
increase our revenue target for 2021,” said Cristiano Veloso,
Verde’s Founder.
2021 Guidance
Originally, the Company’s target for 2021 was to achieve R$50
million revenue, as announced in the press release disclosed on
November 15, 2020. On May 17, 2021, however, Verde announced a 10%
increase in its guidance, aiming for a new a revenue target of R$55
million for 2021.
In light of the results of Q2, the Company is pleased to
announce a second 10% increase in its 2021 guidance, now aiming for
a total revenue target of R$60.5 million, which if achieved would
represent a 72% growth Year-on-Year (“YoY”).
"The pride we have in the Company’s achievements to date have
only boosted our efforts to continue the hard work to meet our
latest guidance. Beyond the next two quarters, the Verde team is
also heavily engaged with the Company’s expansion plans to increase
our production capacity for the year of 2022,” completed Mr.
Veloso.
Selected Annual Financial Information
The table below summarizes Q2 2021 financial results compared to
Q2 2020 and provides information about 2021 and 2020 year-to-date
(“YTD”). All amounts in CAD $'000.
CAD $’000
Q2 2021
Q2 2020
YTD 2021
YTD 2020
Tonnes sold ‘000
96
71
113
81
Revenue per tonne sold $
56
35
55
37
Production cost per tonne sold $
(16)
(13)
(18)
(16)
Gross Profit per tonne sold $
40
22
37
21
Gross Margin
72%
62%
68%
57%
Revenue
5,376
2,492
6,207
3,001
Production costs
(1,498)
(955)
(1,988)
(1,286)
Gross Profit
3,878
1,537
4,219
1,715
Gross Margin
72%
62%
68%
57%
Sales and product delivery freight
expenses
(2,236)
(604)
(2,767)
(1,026)
General and administrative expenses
(422)
(349)
(1,119)
(768)
Operating Profit/(Loss) before non-cash
events
1,220
584
333
(79)
Share Based Payments (Non-Cash
Event)1,2
(887)
(28)
(905)
(68)
Depreciation and Amortisation2
(10)
(3)
(16)
(15)
Profit on disposal of plant and equipment
2
-
-
9
-
Operating Profit/(Loss) after non-cash
events
323
553
(579)
(162)
Corporation tax3
(188)
(98)
(219)
(116)
Interest Income/Expense
(56)
(11)
(131)
(70)
Net Profit / (Loss)
79
444
(929)
(348)
1 - One time, non-cash charge from Verde's long-term incentive
programme regarding the vesting of stock options granted to 58
employees. 2 - Included in General and Administrative expenses in
the Financial Statements. 3 - For further details please refer to
Q2 2021 Management’s Discussion and Analysis.
Q2 2021 compared with Q2 2020
For Q2 2021 the Company generated a net profit of $79,000, a
decrease of $365,000 compared to Q2 2020. The earnings per share
was $0.001, compared to $0.009 for Q2 2020. This reduction was due
to a $887,000 non-cash charge from a long-term incentive programme
regarding the vesting of stock options granted to 58 employees.
Product Sales
In Q2 2021, the Company sold 96,233 tonnes, an increase of 35%
in comparison to Q2 2020. BAKS® accounted for approximately 13% of
Verde’s sales in Q2 2021.
Revenue
Revenue from sales for Q2 2021 was $5,376,000 from the sale of
96,233 tonnes of the Product, at $56 per tonne sold. Despite the
20% Brazilian Real devaluation against the Canadian Dollar, revenue
per tonne was higher than Q2 2020 ($35 per tonne sold) mainly due
to three factors:
- Product volume sold as CIF (Cost Insurance and Freight)
increased from 6% of total sales in Q2 2020 to 43% in Q2 2021.
- Potassium Chloride CIF (Minas Gerais) price increased from
US$287-US$303 per tonne in Q2 2020 to US$395-535 per tonne in Q2
2021 (as per Acerto Limited report).
- BAKS® has a higher sales price per tonne than the Product, it
was launched on Q4 2020 and in Q2 2021 it has accounted for 13% of
the total volume sold.
Production costs
Production costs include all direct costs from mining,
processing, and the addition of the other nutrients such as Sulfur
and Boron, logistics from the mine to the factory and supply chain
salaries, which are paid in R$. Production costs for Q2 2021 were
$1,498,000, an increase of $543,000 compared to Q2 2020. Cost per
tonne for the quarter was $16 compared to $13 for the same period
in 2020. This increase was due in large part to higher fuel prices,
which increased 45% in Q2 2021 compared to Q2 2020, and due to the
production of BAKS, which has a higher cost per tonne due to the
addition of other nutrients to the Product.
Sales Expenses
CAD $’000
Q2 2021
Q2 2020
YTD 2021
YTD 2020
Sales and marketing expenses
(410)
(369)
(712)
(634)
Product delivery freight expenses
(1,826)
(235)
(2,055)
(392)
Total
(2,236)
(604)
(2,767)
(1,026)
General and Administrative Expenses
CAD $’000
Q2 2021
Q2 2020
YTD 2021
YTD 2020
General administrative expenses
(240)
(197)
(718)
(416)
Legal, professional, consultancy and audit
costs
(106)
(121)
(265)
(284)
IT/Software expenses
(70)
(27)
(122)
(49)
Taxes and licenses fees
(6)
(4)
(14)
(19)
Total
(422)
(349)
(1,119)
(768)
General administrative expenses
These costs include general office expenses, rent, bank fees,
insurance, foreign exchange variances and remuneration of the
executives and administrative staff in Brazil. The costs have
increased by $43,000 in Q2 2021 compared to Q2 2020 as they include
an additional 29 administrative employees, with professional
headcount increasing from 18 in Q2 2020 to 47 in Q2 2021 to support
the Company’s growth and due to incentive compensation. The Company
had 26 administrative employees in Q1 2021.
Legal, professional, consultancy and audit
costs
Legal and professional fees include legal, professional,
consultancy fees along with accountancy, audit and regulatory
costs. Consultancy fees are consultants employed in Brazil, such as
accounting services, patent process, lawyer’s fee and regulatory
consultants. The costs in Q2 2021 are $15,000 lower than Q2 2020
mainly due to audit cost reduction and Brazilian Real devaluation
against Canadian dollar.
IT/Software expenses
IT/Software expenses include software licenses such as Microsoft
Office, CRM and enterprise resource planning (ERP). In Q2 2021
expenses were $70,000, an increase of $43,000 on Q2 2020 due to an
increase in the number of the software licenses used by the
Company.
Taxes and licences
Taxes and licence expenses include general taxes, product
branding and licence costs. In Q2 2021, expenses were $6,000
compared to $4,000 in Q2 2020.
Share Based Payments (Non-Cash
Event)
The directors have not received any shares in lieu of
compensation since Q3 2020.
Share Based Payments costs in Q2 2021 represent the expense
associated with stock options granted to employees as part of the
Company’s long-term incentive programme. These are measured under
the Black-Scholes Model.
Capital Expenditure
In Q2 2021, the Company invested $515,000 in infrastructure
improvements: the grounds of Plant 1 were paved to provide greater
operational efficiency; access routes to the mine pits have been
enhanced; project developments for Plant 2 were further
advanced.
Q2 2021 Results Conference Call
The Company will host a conference call on Wednesday, August 25,
2021 at 11:00 am Eastern Time (4:00 pm Greenwich Mean Time), to
discuss Q2 2021 results and provide an update. Subscribe using the
link below and receive the conference details by email.
Date:
Wednesday, August 25, 2021
Time:
11:00 am Eastern Time (4:00 pm Greenwich
Mean Time)
Subscription link:
https://bit.ly/Q2_2021_Results_Presentation
The Company’s first quarter financial statements and related
notes for the period March 31, 2021
are available to the public on SEDAR at www.sedar.com and the
Company’s website at www.investor.verde.ag/.
Investors Newsletter
Subscribe to receive the Company’s monthly updates at:
http://cloud.marketing.verde.ag/InvestorsSubscription
The last edition of the newsletter can be accessed at:
https://bit.ly/InvestorNL-July2021
About Verde AgriTech
Verde is an agricultural technology company that develops and
produces fertilizers. Rooting our solutions in nature, we make
agriculture healthier, more productive, and profitable for farmers.
We work to improve the health of all people and the planet.
Cautionary Language and Forward-Looking
Statements
This news release contains “forward-looking information” and
“forward-looking statements” (collectively, “forward-looking
statements”) within the meaning of the applicable Canadian
securities legislation. The Cautionary Language and Forward-Looking
Statements can be accessed at this link.
www.investor.verde.ag | www.supergreensand.com
| www.verde.ag
View source
version on businesswire.com: https://www.businesswire.com/news/home/20210816005219/en/
Cristiano Veloso, President & Chief Executive Officer
Tel: +55 (31) 3245 0205; Email: investor@verde.ag
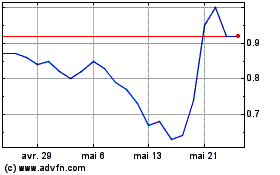
Verde Agritech (TSX:NPK)
Graphique Historique de l'Action
De Déc 2024 à Jan 2025

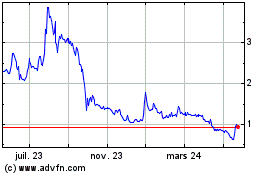
Verde Agritech (TSX:NPK)
Graphique Historique de l'Action
De Jan 2024 à Jan 2025
