THIS DOCUMENT IS NOT INTENDED FOR DISSEMINATION OR DISTRIBUTION IN THE UNITED
STATES.


Questor Technology Inc. ("Questor" or the "Company") (TSX VENTURE:QST) announced
today its financial and operating results for the three-month period ended March
31, 2010. The Company reported a net loss of $165,020 ($0.007 per basic share)
compared to net income of $82,689 ($0.003 per basic share) for the three months
ended March 31, 2009. The decrease in net income of $247,709 is attributable to
lower incinerator sales revenue, utilization and rate differences in the
incinerator rentals and services mix and differences in foreign exchange gains
and losses experienced in each of the two periods. The value of the sales orders
backlog at the beginning of each of 2010 and 2009 was similar, as was the value
of new sales orders received during the first quarter of each year. However, the
delivery timing for 2010-related orders will occur later in the year compared to
the 2009-related orders, consequently resulting in fewer incinerator sales
during first quarter 2010. Partially offsetting these impacts is the effect of
lower general and administrative expense and income tax expense in first quarter
2010.


Financial Results Summary
($ unless otherwise noted)

For the three months ended March 31             2010              2009
----------------------------------------------------------------------

Total revenue                                489,628         1,163,196
Gross margin(1)                              160,542           443,975
EBITDA(1)                                   (177,125)          155,159
Income (loss) before interest
 expense and income tax expense(1)          (216,327)          116,758
Net income (loss)                           (165,020)           82,689
Funds generated from operations(1)           (91,985)          205,840
Total assets                               6,261,906         6,627,142
Long-term liabilities                         60,554            45,262

Shares outstanding (thousands)(2)
  Basic                                       24,007            24,007
  Diluted                                     24,007            24,385
Net income (loss) per share - Basic
 and diluted                           $      (0.007)    $       0.003


1.  Non-GAAP financial measure. Please see discussion in the Non-GAAP
    Financial Measures section of the Company's Management's Discussion and
    Analysis for the three months ended March 31, 2010.
2.  Weighted average.


"To date, Questor has confirmed incinerator sales orders of $2.0 million, all of
which are scheduled for delivery this year. These orders are not reflected in
our first quarter 2010 results as the Company recognizes revenue once delivery
has occurred. These incinerator units are destined for customers in Canada, as
well as the United States and Asia, reflecting our growing domestic and
international reputation for providing cost effective green solutions to the oil
and gas industry. Drilling activities worldwide appear to be increasing but
there is typically a lag of five to six months for facility construction once
drilling is completed. We are actively engaged in bidding for this work and
currently have proposals outstanding in excess of $41 million which is
approximately $10 million more than the bids outstanding at this time last
year," said Audrey Mascarenhas, President and Chief Executive Officer.


The Company is pleased to announce that it has established a marketing
arrangement with Homer's Oilfield Services Ltd., an oilfield safety services
company headquartered in Dawson Creek, British Columbia, Canada, to increase
penetration of Questor's incinerator rental services in the Peace River region
of British Columbia and the Alberta Peace Country area. The companies jointly
showcased Questor's incineration solutions at the 35th Annual Kiwanis Club of
Dawson Creek Trade Show held April 23 - 25, 2010.


The Company continues to build market awareness and brand recognition for its
clean air technologies. At the invitation of the Texas Commission on
Environmental Quality ("TCEQ"), the lead environmental agency for the state of
Texas, Ms. Mascarenhas made a presentation to the organization on March 26, 2010
regarding Questor's incineration technology as an alternative solution to
flaring. On April 19, 2010, Ms. Mascarenhas presented on the topic of "Clearing
the Air - Safely and Efficiently" at the 2010 EnviroArabia Conference held in
the Kingdom of Bahrain. On May 6, 2010, Ms. Mascarenhas presented a paper
entitled "Platform Waste Gas Combustion: Efficiently, Safely, Reliably and
Economically" at the Society of Petroleum Engineers Offshore Technology
Conference held in Houston, Texas, USA. Copies of these latter two presentations
are available on the Company's website. On May 27, 2010, Ms. Mascarenhas is one
of the panellists during the discussion of "Going Global: Leading Your Company
to New Markets" at the Women's Executive Network luncheon to be held in Calgary,
Alberta, Canada.


Shareholders are invited to attend the Company's Annual General Meeting to be
held on Tuesday, June 8, 2010 at 4:00 p.m. (local time) in the Cardium Room of
the Calgary Petroleum Club, located at 319 - 5th Avenue S.W., Calgary, Alberta.
In addition to the formal business items, management will be presenting an
overview of Questor's results for the financial year ended December 31, 2009 and
for the three months ended March 31, 2010 and discussing the Company's strategy
for the future.


Questor's first quarter 2010 financial statements and notes thereto and
Management's Discussion and Analysis for the three months ended March 31, 2010
will be available shortly on the Company's website at www.questortech.com and
through SEDAR at www.sedar.com.


ABOUT QUESTOR TECHNOLOGY INC.

Questor is an international environmental oilfield services company founded in
late 1994 and headquartered in Calgary, Alberta, Canada with a field office
located in Grande Prairie, Alberta, Canada. The Company is focused on clean air
technologies with activities in Canada, the United States, Europe and Asia.
Questor designs and manufactures high efficiency waste gas incinerators for sale
or for use on a rental basis and also provides combustion-related oilfield
services. The Company's proprietary incinerator technology destroys noxious or
toxic hydrocarbon gases which ensures regulatory compliance, environmental
protection, public confidence and reduced operating costs for customers. Questor
is recognized for its particular expertise in the combustion of sour gas (H2S).
While the Company's current customer base is primarily in the oil and gas
industry, this technology is applicable to other industries such as landfills,
water and sewage treatment, tire recycling and agriculture.


Questor trades on the TSX Venture Exchange under the symbol "QST".

Certain information in this news release constitutes forward-looking statements.
When used in this news release, the words "may", "would", "could", "will",
"intend", "plan", "anticipate", "believe", "seek", "propose", "estimate",
"expect", and similar expressions, as they relate to the Company, are intended
to identify forward-looking statements. In particular, this news release
contains forward-looking statements with respect to, among other things,
business objectives, expected growth, results of operations, performance,
business projects and opportunities and financial results. These statements
involve known and unknown risks, uncertainties and other factors that may cause
actual results or events to differ materially from those anticipated in such
forward-looking statements. Such statements reflect the Company's current views
with respect to future events based on certain material factors and assumptions
and are subject to certain risks and uncertainties, including without
limitation, changes in market, competition, governmental or regulatory
developments, general economic conditions and other factors set out in the
Company's public disclosure documents. Many factors could cause the Company's
actual results, performance or achievements to vary from those described in this
news release, including without limitation those listed above. These factors
should not be construed as exhaustive. Should one or more of these risks or
uncertainties materialize, or should assumptions underlying forward-looking
statements prove incorrect, actual results may vary materially from those
described in this news release and such forward-looking statements included in,
or incorporated by reference in this news release, should not be unduly relied
upon. Such statements speak only as of the date of this news release. The
Company does not intend, and does not assume any obligation, to update these
forward-looking statements. The forward-looking statements contained in this
news release are expressly qualified by this cautionary statement.


                          QUESTOR TECHNOLOGY INC.
                               BALANCE SHEETS
                                (unaudited)
                                                                December 31
As at                                      March 31 2010               2009
----------------------------------------------------------------------------

ASSETS
Current assets
  Cash and cash equivalents              $     3,228,423    $     3,080,997
  Accounts receivable                            654,958            864,260
  Income and other taxes receivable              269,761            306,850
  Inventory                                      547,391            433,145
  Prepaid expenses and deposits                   74,233            101,072
  Deferred expenses                                    -              2,356
  Future income tax asset                         88,421             50,113
----------------------------------------------------------------------------
                                               4,863,187          4,838,793
Property and equipment                         1,387,047          1,418,524
Intangibles                                       11,672             15,682
----------------------------------------------------------------------------
                                         $     6,261,906    $     6,272,999
----------------------------------------------------------------------------
----------------------------------------------------------------------------

LIABILITIES AND SHAREHOLDERS' EQUITY
Current liabilities
  Accounts payable and accrued
   liabilities                           $       376,863    $       348,150
  Current portion of long-term debt               10,155             15,232
  Income and other taxes payable                  15,840             19,034
  Deferred revenue and deposits                  307,242            198,641
  Future income tax liability                      2,281              2,281
----------------------------------------------------------------------------
                                                 712,381            583,338
Future income tax liability                       60,554             74,057
----------------------------------------------------------------------------
                                                 772,935            657,395
----------------------------------------------------------------------------
Shareholders' equity
  Share capital                                5,265,736          5,265,736
  Contributed surplus                            486,038            447,651
  Retained earnings                             (262,803)           (97,783)
----------------------------------------------------------------------------
                                               5,488,971          5,615,604
----------------------------------------------------------------------------
                                         $     6,261,906    $     6,272,999
----------------------------------------------------------------------------
----------------------------------------------------------------------------


                          QUESTOR TECHNOLOGY INC.
          STATEMENTS OF INCOME (LOSS), COMPREHENSIVE INCOME (LOSS)
                      AND RETAINED EARNINGS (DEFICIT)
                                (unaudited)

For the three months ended March 31               2010                 2009
----------------------------------------------------------------------------

Revenue
  Incinerator sales and services      $         89,326     $        572,592
  Incinerator rentals and services             245,626              439,270
  Combustion services                          153,165              146,006
----------------------------------------------------------------------------
                                               488,117            1,157,868
Less: Direct costs                             327,575              713,893
----------------------------------------------------------------------------
                                               160,542              443,975
----------------------------------------------------------------------------

Other revenue                                    1,511                5,328

Expenses
  General and administrative                   324,155              364,627
  Foreign exchange loss (gain)                  47,295              (42,339)
  Depreciation and amortization                  6,930               10,257
----------------------------------------------------------------------------
                                               378,380              332,545
----------------------------------------------------------------------------
Income (loss) before interest
 expense and income tax expense               (216,327)             116,758
Interest expense                                   504                  826
----------------------------------------------------------------------------
Income (loss) before income tax
 expense                                      (216,831)             115,932
Income tax expense (recovery)
  Current income tax                                 -               28,579
  Future income tax                            (51,811)               4,664
----------------------------------------------------------------------------
Net income (loss) and comprehensive
 income (loss)                                (165,020)              82,689
Retained earnings (deficit),
 beginning of period                           (97,783)               4,180
----------------------------------------------------------------------------
Retained earnings (deficit), end of
 period                               $       (262,803)    $         86,869
----------------------------------------------------------------------------
----------------------------------------------------------------------------

Net income (loss) per share
  Basic and diluted                   $         (0.007)    $          0.003

Weighted average number of shares
 outstanding
  Basic                                     24,007,370           24,007,370
  Diluted                                   24,007,370           24,384,818


                          QUESTOR TECHNOLOGY INC.
                          STATEMENTS OF CASH FLOWS
                                (unaudited)

For the three months ended March 31                  2010              2009
----------------------------------------------------------------------------

Operating activities
  Net income (loss)                        $     (165,020)   $       82,689
  Items not involving cash:
  Depreciation                                     35,192            31,152
  Amortization                                      4,010             7,250
  Unrealized foreign exchange loss                 47,257            41,885
  Future income tax                               (51,811)            4,664
  Share-based compensation                         38,387            38,200
----------------------------------------------------------------------------
                                                  (91,985)          205,840
  Net change in non-cash working capital          292,862          (140,058)
----------------------------------------------------------------------------
                                                  200,877            65,782
----------------------------------------------------------------------------

Investing activities
  Additions of property and equipment              (3,439)          (70,520)
----------------------------------------------------------------------------
                                                   (3,439)          (70,520)
----------------------------------------------------------------------------

Financing activities
  Repayment of long-term debt                      (5,077)           (9,883)
----------------------------------------------------------------------------
                                                   (5,077)           (9,883)
----------------------------------------------------------------------------

Effect of exchange rates on cash                  (44,935)          (43,323)
----------------------------------------------------------------------------

Increase (decrease) in cash and cash
 equivalents                                      147,426           (57,944)
Cash and cash equivalents, beginning of
 period                                         3,080,997         3,259,037
----------------------------------------------------------------------------
Cash and cash equivalents, end of period   $    3,228,423    $    3,201,093
----------------------------------------------------------------------------
----------------------------------------------------------------------------
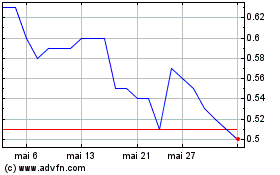
Questor Technology (TSXV:QST)
Graphique Historique de l'Action
De Mai 2024 à Juin 2024

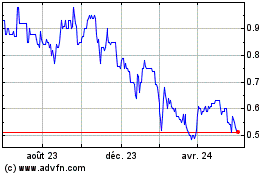
Questor Technology (TSXV:QST)
Graphique Historique de l'Action
De Juin 2023 à Juin 2024
