2024 TomTom Traffic Index: New York Takes #1 Spot for the Most U.S. Traffic Jams
10 Janvier 2024 - 11:00AM

TomTom, the global geolocation technology leader released the 13th
annual edition of its Traffic Index, which details key traffic
insights and trends across 387 cities around the world in 2023. The
report found that New York was both the slowest and the #1 most
congested in the U.S. The report identifies how traffic affects
residents in New York, from time and cost to emissions.
Key findings for 2023 include:
- On average, it took NYC drivers 23min + 58s to drive a typical
6-mile trip, up 19s from ‘22 and +1 min 26s from ‘21.
- The average speed over the year is 15 mph.
- For a typical 6 mile-commute driven twice a day during morning
& evening rush hours:
- Typical NYC daily commuters spent 230 hours driving; of which,
a whopping 108 hours were due to congestion – up 34min from ‘22 and
+10h and 15min from ‘21.
- Each NYC driver emitted 948 kg of CO2, and 95 trees would be
needed to absorb it.
- New Yorkers spent $421 on gas, with $103 stemming from traffic
jams alone.
Additional information: More data about each
city can be found at tomtom.com/Traffic-Index/. Visitors can also
access real-time traffic data to identify how long their commute
will take, current traffic jams and information about the busiest
traffic days of the year.
About TomTom: Billions of data points. Millions
of sources. Hundreds of communities. We are the mapmaker bringing
it all together to build the world’s smartest map. We provide
location data and technology to drivers, carmakers, businesses, and
developers. Our application-ready maps, routing, real-time traffic,
APIs and SDKs enable the dreamers and doers to shape the future of
mobility.
Headquartered in Amsterdam with 4,000 employees around the
globe, TomTom has been helping people find their way in the world
for over 30 years.
www.tomtom.com
Media Contact: LaunchSquad for
TomTomtomtom@launchsquad.com
A photo accompanying this announcement is available at
https://www.globenewswire.com/NewsRoom/AttachmentNg/d303e5a1-c7ff-433c-990f-d8aff26a68a9
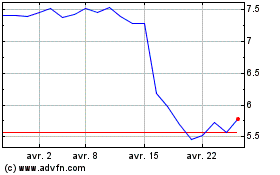
Tomtom NV (EU:TOM2)
Graphique Historique de l'Action
De Nov 2024 à Déc 2024

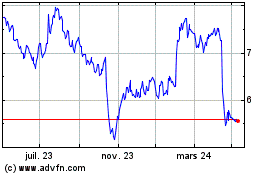
Tomtom NV (EU:TOM2)
Graphique Historique de l'Action
De Déc 2023 à Déc 2024
