Filed by ESGEN Acquisition Corporation pursuant to Rule 425 under the
Securities Act of 1933, as amended, and deemed filed pursuant to Rule 14a-12 under the Securities Exchange Act of 1934, as amended Subject Company: ESGEN Acquisition Corporation (File No. 001-40927) The following presentation was posted on
ESGEN’s website on February 1, 2024: JANUARY 2024 COMPANY PRESENTATION 1 CONFIDENTIAL
Disclaimer This confidential presentation (thiPresentation s “
”) is being delivered to you by ESGEN Acquisition Corp SPAC. ” (“or “ ESGEN”) in connection with its potential business combination Transaction (the “ ” or Business “ Combination”) with Sunergy
Renewables, LLC Sunergy (“ ” and the combined company formed with SPCombined AC, “ Co” or “ Newco”) pursuant to the Business Combination Agreement dated as of April 19, 2023 Business (theCombination “
Agreement”). This Presentation is for informational purposes only. Any reproduction or distribution of this Presentation, inin pa w rth , ol or t e hor e disclosure of its contents, without the prior consent of Sunergy or SPAC, is prohibited.
By accepting this Presentation, each recipient and its directors, partners, officers, employees, attorneys, agents and representatives (collectively, therecipients “ ”) agrees: (i) to maintain the confidentiality of all information that
is contained in this Presentation and not already in the public domain; and (ii) to return or destroy all copies of this Presentation or portions thereof in its possession following the request for the return or destruction of such copies. No
Representations and Warranties: This Presentation is for informational purposes only and does not purport to contain all of the information that may be required to evaluate a possible investment decision with respect to SPAC, Sunergy, Combined Co or
the Transaction. The recipient agrees and acknowledges that this Presentation is not intended to form the basis of any investment decision by the recipient and does not constitute financial investment, tax or legal advice. No representation or
warranty, express or implied, is or will be given by SPAC, Sunergy or Combined Co or any of their respective affiliates, directors, officers, employees or advisers or any other person as to the accuracy or completeness of the information (including
as to the accuracy, completeness or reasonableness of statements, estimates, targets, projections, assumptions or judgments) in this Presentation or in any other written, oral or other communications transmitted or otherwise made available to any
party in the course of its evaluation of a possible transaction, and no responsibility or liability whatsoever is accepted for the accuracy or sufficiency thereof or for any errors, omissions or misstatements, negligent or otherwise, relating
thereto. The recipient also acknowledges and agrees that the information contained in this Presentation is preliminary in nature and is subject to change, and any such changes may be material. Each of SPAC and Sunergy disclaims any duty to update
the information contained in this Presentation. Forward-Looking Statements: This Presentation and the oral statements made in connection herewith include -loo “fokirwng ardstatements” within the meaniof t ng he “safe harbor”
provisions of the Private Securities Litigation Reform Act of 1995. SPAC’s, Sunergy’s and Combined Co’s actual results may differ from their expectations, estimat ecteis an ons, ad p nd,roj consequently, you should not rely on
these forward-looking statements as predictions of future events. Words such as “expect,” “estimate,” “project,” “budget,” “forecast,” “anticipate,” “intend,”
“plan“w ,” ill,“ma ” “cou y,” ld,” “should,” “believe,” “predict,” “potential,” “continue,” and similar expressions are intended to identify
such forward-looking statements. These forward-looking statements include, without limitation, SPAC’s aun nd ergy S ’s expectations with respect to future performance growth opportunities and competitive position of Combined Co. These
forward-looking statements also involve significant risks and uncertainties, some of which are difficult to predict and may be beyond the control of SPAC, Sunergy and Combined Co, that could cause the actual results to differ materially from the
expected results. Factors that may cause such differences include, but are not limited to: (1) our ability to complete the Business Combination, including due to the failure to satisfy any conditions to the closing, or, if we fail to consummate the
Business Combination, any other initial business combination; (2) the failure to realize the anticipated benefits of the Business Combination, which may be affected by, among other things, competition, the ability of Combined Co to grow and manage
growth profitably, maintain relationships with customers and suppliers and retain key employees; (3) delays in obtaining, adverse conditions contained in, or the inability to obtain necessary regulatory approvals or complete regulatory reviews
required to complete the Business Combination; (4) the outcome of any legal proceedings that may be instituted in connection with the Business Combination; (5) the occurrence of any event, change or other circumstances that could give rise to the
termination of the Business Combination Agreement, including the failure to satisfy any of the conditions to closing in the Business Combination Agreement; (6) the ability to obtain and/or maintain the listing of Combined Co’s securities on
Nasdaq, and the potential liquidity and trading of such securities; (7) the amount of redemptions made by public shareholders; (8) the projected financial information, anticipated growth rate and market opportunity of Combined Co; (9) our success in
retaining or recruiting our principal officers, key employees or directors following the Business Combination; (10) our directors and officers potentially having conflicts of interest with our business or in approving the Business Combination, as a
result of which they would receive compensation; (11) intense competition and competitive pressures from electric utilities and other companies in the industry in which Combined Co will operate; (12) factors relating to the business, operations and
financial performance of Sunergy, including market conditions and global and economic factors beyond Sunergy’s control; (13) ge ch na en rage l es con in omic conditions, including unemployment, inflation (including the impact of tariffs) or
deflation, financial institution disruptions and geopolitical conflicts such as the conflict between Russia and Ukraine and the conflict in the Gaza Strip; (14) costs related to the Business Combination; (15) the reduction or elimination of
government economic incentives to the renewable energy market; (16) the ability of Combined Co to issue equity or equity-linked securities or obtain debt financing in connection with the Business Combination or in the future; (17) the demand for
renewable energy not being sustained or growing in size; (18) impacts of climate change, changing weather patterns and conditions and natural disasters; (19) increases in costs of solar energy system components and raw materials; (20) loss of a
supplier or other supply chain disruptions; (21) problems with the quality or performance of the solar energy systems that Sunergy sells; (22) the effect of legal, tax and regulatory changes; and (23) other risks and uncertainties provided to you
and indicated from time to time described in filings and potential filings by SPAC, Sunergy and Combined Co with the U.S. Securities and Exchange Commission (the SEC “ ”). These forward -looking statements are based on current
expectations and assumptions of SPAC’s and Sunergy’s managemen cont ce tern ams ing future events and are based on currently available information as to the outcome and timing of future events. Each of SPAC and Sunergy cautions that the
foregoing list of factors is not exclusive and not to place undue reliance upon any forward-looking statements, which speak only as of the date made. You should also carefully consider the risks and uncertainties described in th” e an“Ri
d sk“Ca Fact ution orsary Note Regarding Forwa -Lo rdoking Statements” sections of SPAC’s registration statement on Form S-1, its Annual Report on Form 10-K for the year ended December 31, 2022 and in subsequent Quarterly Reports
on Form 10-Q, in each case as filed with the SEC. In addition, there are additional risks and uncertainties described in the proxy statement / prospectus included in a registration statement on Form S-4 which was filed with the SEC on September 19,
2023, relating to the Transaction. These filings or potential filings may identify and address other important risks and uncertainties that could cause actual events and results to differ materially from those contained in the forward-looking
statements referred hereto. None of SPAC, Sunergy or Combined Co undertakes or will undertake any obligation to, and accepts no obligation to, release publicly any updates or revisions to any forward-looking statements or to reflect any change in
its expectations or any change in events, conditions or circumstances on which any such statement is based. 2
Disclaimer (cont’d) Industry, Market Data and Partnerships: In this
Presentation, SPAC and Sunergy rely on and refer to certain information and statistics regarding the markets and industries in which Sunergy competes. Such information and statistics are based on management’s estimates and/or obtained from
-path rtird y sources, including reports by market research firms and company filings. Although SPAC and Sunergy believe such third-party information is reliable, there can be no assurance as to the accuracy or completeness of the indicated
information. Neither SPAC nor Sunergy has independently verified the accuracy or completeness of the information provided by the third-party sources. This Presentation contains descriptions of certain key business partnerships of Sunergy. These
descriptions are based on the Sunergy management team’s discussion with such counterparties, certai-n bi nndon ing written agreements and the latest available information and estimates as of the date of this Presentation. These descriptions
are subject to negotiation and execution of definitive agreements with certain of such counterparties which have not been completed as of the date of this Presentation. No Offer or Solicitation: This Presentation and any oral statements made in
connection with this Presentation are is not intended to and shall not constitute (i) a solicitation of a proxy, vote, consent, approval or authorization with respect to any securities or in respect of the Transaction or (ii) an offer to sell or the
solicitation of an offer to buy or a recommendation to purchase any security of SPAC, Sunergy or Combined Co, or any of their respective affiliates, nor shall there be any sale of securities in any jurisdiction in which such offer, solicitation or
sale would be unlawful prior to registration or qualification under the securities laws of any such jurisdiction. No offering of securities shall be made except by means of a prospectus meeting the requirements of Section 10 of the SecuritiesAct of
1933, as amended, and the rules and regulations promulgated thereunde Securities r (the “ Act”), or in reliance on an exemption from the registration requirements of the Securities Act. You should not con ent strue s of t thhie s Pre con
setntation as legal, tax, accounting or investment advice or a recommendation. You should consult your own counsel and tax and financial advisors as to legal, financial and related matters concerning the matters described herein, and, by accepting
this Presentation, you confirm that you are not relying upon the information contained herein to make any decision. The distribution of this Presentation may also be restricted by law and persons into whose possession this Presentation comes should
inform themselves about and observe any such restrictions. The recipient acknowledges that it is (a) aware that the United States securities laws prohibit any person who has material, non-public information concerning a company from purchasing or
selling securities of such company or from communicating such information to any other person under circumstances in which it is reasonably foreseeable that such person is likely to purchase or sell such securities, and (b) familiar with the
Securities Exchange Act of 1934, as amended, and the rules and regulations promulgated thereunder (collect Exchange ively, theAct “ ”), and that the recipient will neither use, nor cause any third party to use, this Presentation or any
information contained herein in contravention of the Exchange Act, including, without limitation, Rule 10b-5 thereunder. THIS PRESENTATION IS BEING DISTRIBUTED TO SELECTED RECIPIENTS ONLY AND IS NOT INTENDED FOR DISTRIBUTION TO, OR USE BY, ANY
PERSON OR ENTITY IN ANY JURISDICTION OR COUNTRY WHERE SUCH DISTRIBUTION OR USE WOULD BE CONTRARY TO APPLICABLE LAW OR REGULATION. AS OF THE DATE HEREOF, NONE OF THE INFORMATION CONTAINED HEREIN HAS BEEN FILED WITH THE SEC, ANY SECURITIES
ADMINISTRATOR UNDER ANY SECURITIES LAWS OF ANY U.S. OR NON-U.S. JURISDICTION OR ANY OTHER U.S. OR NON-U.S. GOVERNMENTAL OR SELF-REGULATORY AUTHORITY. NO SUCH GOVERNMENTAL OR SELF- REGULATORY AUTHORITY WILL PASS ON THE MERITS OF THE TRANSACTION OR
OTHER OFFERING OF INTERESTS IN CONNECTION WITH THE TRANSACTION, THE MERITS OF THE TRANSACTION OR THE ADEQUACY OF THE INFORMATION CONTAINED HEREIN. ANY REPRESENTATION TO THE CONTRARY IS UNLAWFUL. Confidentiality: The distribution and use by each
recipient of the information contained in this Presentation and any other information provided to the recipient by or on behalf of SPAC or Sunergy is governed by a confidentiality agreement that has been executed and delivered by each recipient and
which strictly limits the circulation and copying of the information contained in this Presentation (th Confidentiality Agreement e “ ”). If you have not executed and delivered such a Confidentiality Agreement, you have received this
Presentation in error. If so, please notify SPAC or Sunergy immediately, and return this Presentation to us. Except as provided in such Confidentiality Agreement, this Presentation may not be distributed, reproduced or used without the express
consent of SPAC or Sunergy for any other purpose than the preliminary evaluation of the potential Transaction by the person to whom this Presentation has been delivered. This Presentation and information contained herein constitutes confidential
information and is provided to you on the condition that you agree that you will hold it in strict confidence and not reproduce, disclose, forward or distribute it in whole or in part without the prior written consent of SPAC or Sunergy and is
intended for the recipient hereof only. By accepting this Presentation, each recipient further agrees to return or destroy all copies of this Presentation or portions thereof in its possession following the request for the return or destruction of
such copies. No Relationship or Joint Venture: Nothing contained in this Presentation will be deemed or construed to create the relationship of partnership, association, principal and agent or joint venture. This Presentation does not create any
obligation on the part of either SPAC, Sunergy or Combined Co or the recipient to enter into any further agreement or arrangement. Unless and until a definitive agreement has been fully executed and delivered, no contract or agreement providing for
a transaction will be deemed to exist and none of SPAC, Sunergy or Combined Co or the recipient will be under any legal obligation of any kind whatsoever. Accordingly, this Presentation is not intended to create for any party a right of specific
performance or a right to seek any payment or damages for failure, for any reason, to complete the Transaction contemplated herein. 3
Disclaimer (cont’d) Non-GAAP Financial Measures: This Presentation
includes certain financial measures not presented in accordance with generally accepted accounting principles(“GAAP”), including, but not limited to (i) EBITDA, which we define as earnings (loss) before interest expense, income tax
expense (benefit) depreciation and amortization and (ii) Gross Profit, which we define as revenue, net less direct costs of revenue and depreciation and amortization, and certain ratios and other metrics derived therefrom. Note that other companies
may calculate these non-GAAP financial measures differently, and, therefore, such financial measures may not be directly comparable to similarly titled measures of other companies. Note that other companies may calculate these non-GAAP financial
measures differently, and, therefore, such financial measures may not be directly comparable to similarly titled measures of other companies. Further, these non-GAAP financial measures are not measures of financial performance in accordance with
GAAP and may exclude items that are significant in understanding and assessing Sunergy’s financial results. Therefore, these measures should not be considered in isolation or as an alternative me, to cansh et fliow nco s from operations or
other measures of profitability, liquidity or performance under GAAP. You should be aware that SPAC’s and Sunergy’s presentation of these measures may not be comparable to similarly e s tuse itled d by mea otsur her companies. SPAC and
Sunergy believe these non-GAAP measures of financial results provide useful information to management and investors regarding certain financial and business trends relating to Sunergy’s financial condition and results of operations. SPAC and
Sunergy believe that the use of these non-GAAP financial measures provides an additional tool for investors to use in evaluating ongoing operating results and trends in Sunergy, and in comparing Sunergy’s financial measures with those of other
similar companies, many of which present similar non-GAAP financial measures to investors. These non-GAAP financial measures are subject to inherent limitations as they reflect the exercise of judgments by management about which items of expense and
income are excluded or included in determining these non-GAAP financial measures. A reconciliation of historical non-GAAP measures to comparable GAAP measures are provided on page 41. Due to the forward-looking nature of certain of the forecasted
financial information contained in this Presentation, specific quantifications of the amounts that would be required to reconcile such projections to GAAP measures are not available. As a result, Sunergy believes it is not feasible to provide
accurate forecasted non-GAAP reconciliations. Certain monetary amounts, percentages and other figures included in this Presentation have been subject to rounding adjustments. We expect the variability of these items could have a significant impact
on our reported GAAP financial results. In connection with the filing by SPAC of the proxy statement / prospectus included in a registration statement on Form S-4 which was filed with the SEC on September 18, 2023, with respect to the Transaction
and in the course of the review by the SEC of such proxy statement / prospectus, SPAC may make changes to the information presented in this Presentation, including, without limitation, the description of Sunergy’s business and the financial
information and other data included in this Presentation. Comments by the SEC on information in the proxy statement / prospectus may require modification or reformulation of the information we present in this Presentation, and any such modification
or reformulation could be significant. In particular, we note that the SEC has adopted certain rules regarding the use of EBITDA and other financial measures that do not comply with GAAP in the United States, which rules are applicable to the proxy
statement / prospectus that was filed with respect to the Transaction. Trademarks: This Presentation contains trademarks, service marks, trade names and copyrights of Sunergy and other companies, which are the property of their respective owners.
Solely for convenience, some of the trademarks, service marks, trade names and copyrights referred to in this Presentation may be listed without the TM, SM, © or ® symbols, but SPAC and Sunergy will assert, to the fullest extent under
applicable law, the rights of the applicable owners, if any, to these trademarks, service marks, trade names and copyrights. Further, third-party logos included in this Presentation may represent past or present vendors or suppliers of materials
and/or products to Sunergy for use in connection with its business or may be provided simply for illustrative purposes only. Inclusion of such logos does not necessarily imply affiliation with or endorsement by such firms or businesses. There is no
guarantee that SPAC, Sunergy or Combined Co will work, or continue to work, with any of the firms or businesses whose logos are included herein in the future. Important Information for Shareholders and Investors: SPAC filed with the SEC a proxy
statement / prospectus included in a registration statement on Form S-4 relating to the Transaction, which will be mailed to its shareholders once definitive. SPAC’s and Sunergy’s shareholders and other interested persons are advised to
read the proxy sta spe temen ctus t a/ pr nd thoe amendments and other documents filed in connection with the Transaction, as these materials will contain important information about SPAC, Sunergy, Combined Co and the Transaction. Once definitive,
these materials will be mailed to shareholders of SPAC as of a record date to be established for voting on the Transaction, among other matters. Shareholders will also be able to obtain copies of the proxy statement / prospectus andother documents
filed with the SEC, without charge, at the SEC’s website at www.sec.gov, or by directing a written request to SPAC at Kirkland & Ellis LLP, 609 Main St., Suite 4700, Houston, TX 77002. Participants in the Solicitation for the
Transaction:SPAC and its directors and executive officers may be deemed participants in the solicitation of proxies from SPAerC’s s wish tha resp rehol ect d to the Transaction. A list of the names of those directors and executive officers and
a description of their interests in SPAC is contained in SP ion AC’s StatRe emen gistra t on t Form S-1, as effective on October 19, 2021, which was filed with the SEC and is available free of charge at the SEC’s web site at www.sec.gov,
or by directing a written request to SPAC aLLP t K , irkl 609 an Md ai& n StEl .,li s Suite 4700, Houston, TX 77002. Additional information regarding the interests of such participants is contained in the proxy statement / prospectus for the
Transaction. Sunergy and its members and executive officers may also be deemed to be participants in the solicitation of proxies from the shareholders of SPAC in connection with the Transaction. A list of the names of such members and executive
officers and information regarding their interests in the Transaction is included in the proxy statement / prospectus for the Transaction. 4

I. Sunergy Highlights 5
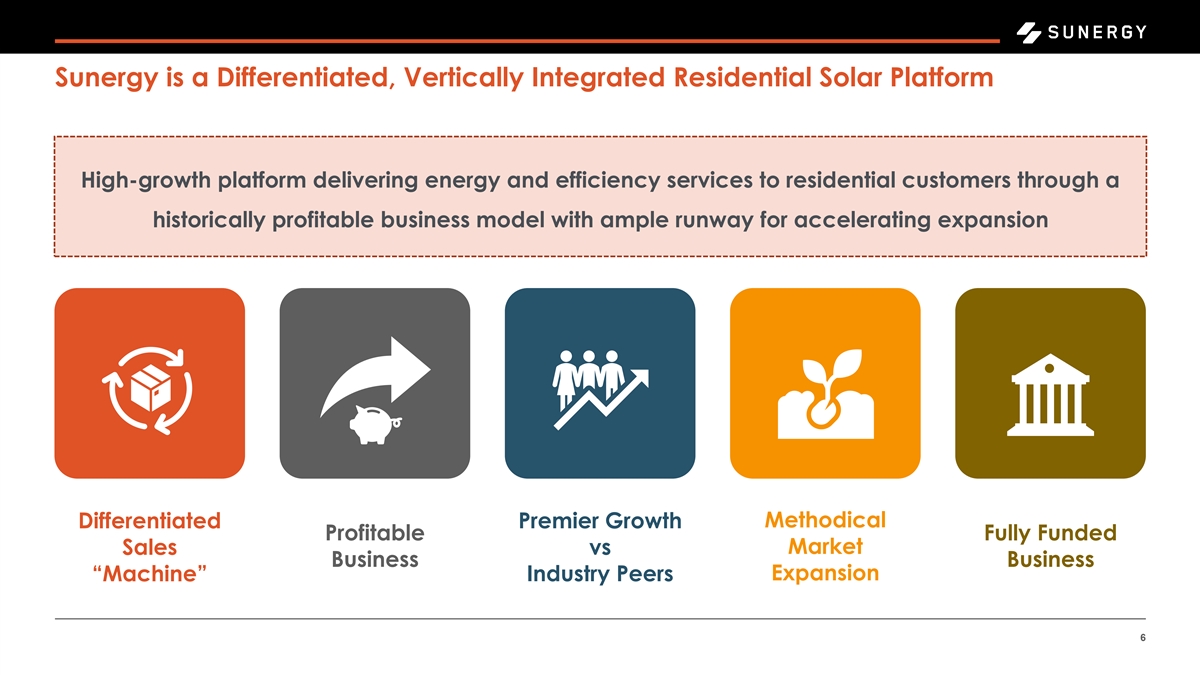
Sunergy is a Differentiated, Vertically Integrated Residential Solar
Platform High-growth platform delivering energy and efficiency services to residential customers through a historically profitable business model with ample runway for accelerating expansion Methodical Differentiated Premier Growth Profitable Fully
Funded Market Sales vs Business Business Expansion “Machine” Industry Peers 6
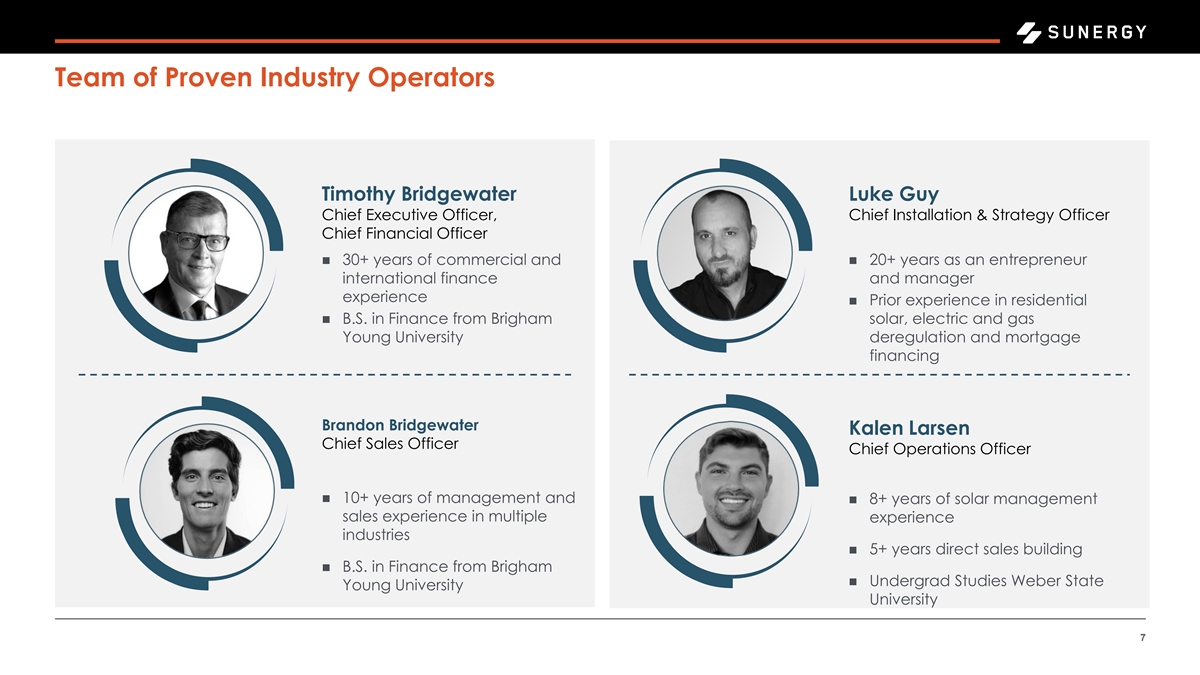
Team of Proven Industry Operators Timothy Bridgewater Luke Guy Chief
Executive Officer, Chief Installation & Strategy Officer Chief Financial Officer ◼ 30+ years of commercial and ◼ 20+ years as an entrepreneur international finance and manager experience ◼ Prior experience in residential
◼ B.S. in Finance from Brigham solar, electric and gas Young University deregulation and mortgage financing Brandon Bridgewater Kalen Larsen Chief Sales Officer Chief Operations Officer ◼ 10+ years of management and ◼ 8+ years of
solar management sales experience in multiple experience industries ◼ 5+ years direct sales building ◼ B.S. in Finance from Brigham ◼ Undergrad Studies Weber State Young University University 7
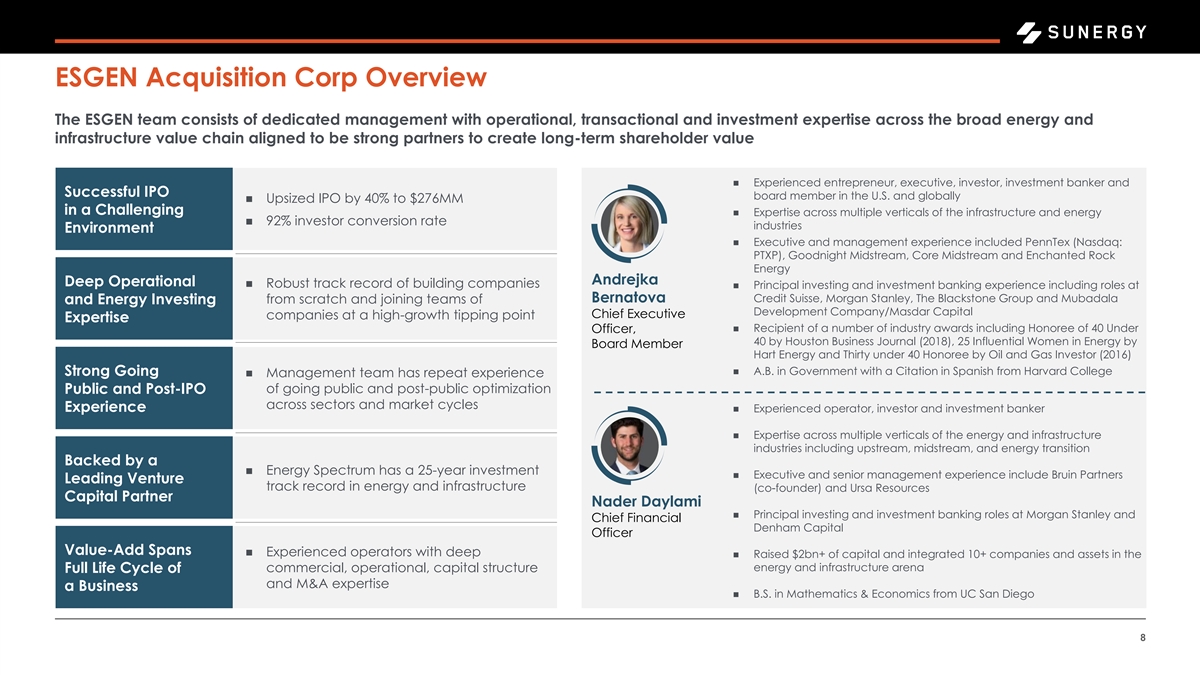
ESGEN Acquisition Corp Overview The ESGEN team consists of dedicated
management with operational, transactional and investment expertise across the broad energy and infrastructure value chain aligned to be strong partners to create long-term shareholder value ◼ Experienced entrepreneur, executive, investor,
investment banker and Successful IPO board member in the U.S. and globally ◼ Upsized IPO by 40% to $276MM in a Challenging ◼ Expertise across multiple verticals of the infrastructure and energy ◼ 92% investor conversion rate
industries Environment ◼ Executive and management experience included PennTex (Nasdaq: PTXP), Goodnight Midstream, Core Midstream and Enchanted Rock Energy Andrejka Deep Operational ◼ Robust track record of building companies ◼
Principal investing and investment banking experience including roles at Bernatova Credit Suisse, Morgan Stanley, The Blackstone Group and Mubadala from scratch and joining teams of and Energy Investing Development Company/Masdar Capital Chief
Executive companies at a high-growth tipping point Expertise ◼ Recipient of a number of industry awards including Honoree of 40 Under Officer, 40 by Houston Business Journal (2018), 25 Influential Women in Energy by Board Member Hart Energy
and Thirty under 40 Honoree by Oil and Gas Investor (2016) ◼ A.B. in Government with a Citation in Spanish from Harvard College Strong Going ◼ Management team has repeat experience Public and Post-IPO of going public and post-public
optimization across sectors and market cycles Experience ◼ Experienced operator, investor and investment banker ◼ Expertise across multiple verticals of the energy and infrastructure industries including upstream, midstream, and energy
transition Backed by a ◼ Energy Spectrum has a 25-year investment ◼ Executive and senior management experience include Bruin Partners Leading Venture track record in energy and infrastructure (co-founder) and Ursa Resources Capital
Partner Nader Daylami ◼ Principal investing and investment banking roles at Morgan Stanley and Chief Financial Denham Capital Officer Value-Add Spans ◼ Experienced operators with deep ◼ Raised $2bn+ of capital and integrated 10+
companies and assets in the energy and infrastructure arena commercial, operational, capital structure Full Life Cycle of and M&A expertise a Business ◼ B.S. in Mathematics & Economics from UC San Diego 8
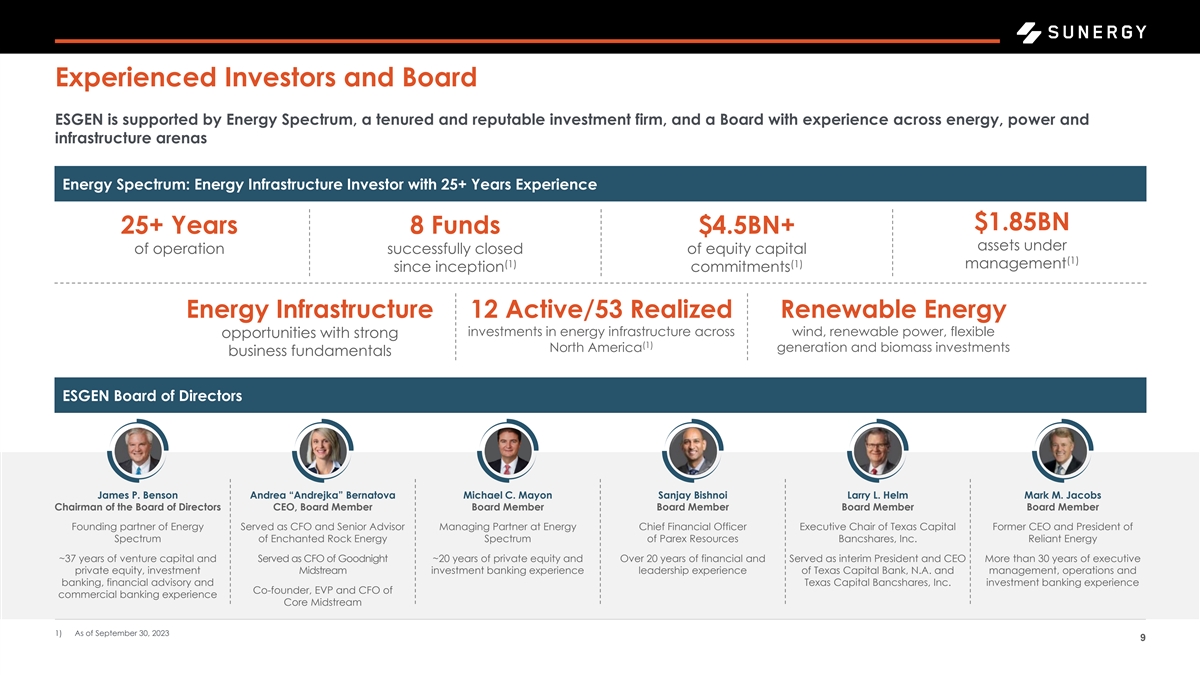
Experienced Investors and Board ESGEN is supported by Energy Spectrum, a
tenured and reputable investment firm, and a Board with experience across energy, power and infrastructure arenas Energy Spectrum: Energy Infrastructure Investor with 25+ Years Experience $1.85BN 25+ Years 8 Funds $4.5BN+ assets under of operation
successfully closed of equity capital (1) (1) (1) management since inception commitments Energy Infrastructure 12 Active/53 Realized Renewable Energy investments in energy infrastructure across wind, renewable power, flexible opportunities with
strong (1) North America generation and biomass investments business fundamentals ESGEN Board of Directors James P. Benson Andrea “Andrejka” Bernatova Michael C. Mayon Sanjay Bishnoi Larry L. Helm Mark M. Jacobs Chairman of the Board of
Directors CEO, Board Member Board Member Board Member Board Member Board Member Founding partner of Energy Served as CFO and Senior Advisor Managing Partner at Energy Chief Financial Officer Executive Chair of Texas Capital Former CEO and President
of Spectrum of Enchanted Rock Energy Spectrum of Parex Resources Bancshares, Inc. Reliant Energy ~37 years of venture capital and Served as CFO of Goodnight ~20 years of private equity and Over 20 years of financial and Served as interim President
and CEO More than 30 years of executive private equity, investment Midstream investment banking experience leadership experience of Texas Capital Bank, N.A. and management, operations and banking, financial advisory and Texas Capital Bancshares,
Inc. investment banking experience Co-founder, EVP and CFO of commercial banking experience Core Midstream 1) As of September 30, 2023 9

Transaction Overview ($ and share values in millions) The proposed
transaction structure provides investors with a highly compelling route to participate in significant potential upside in Sunergy alongside existing shareholders Pro Forma Valuation Sources and Uses 2023E EBITDA $12 Sources Uses 2024 EBITDA Range
$16 - $18 Sunergy Rollover $337.3 Equity to Sunergy $337.3 EBITDA Multiple Range 22x - 24x Pro Forma Enterprise Value $387.1 Cash in Trust 1.4 Cash to Balance Sheet 3.3 Less: Pro Forma Debt (1.7) Existing Cash on Balance Sheet 4.9 Transaction
Expenses 13.0 Less: Pro Forma Convertible Preferred (10.0) Convertible Preferred 10.0 Plus: Pro Forma Cash 3.3 Total $353.6 Total $353.6 Pro Forma Equity Value $378.7 Pro Forma Valuation at Close Pro Forma Ownership at Close Pro Forma Shares
Outstanding 37.9 Entity Shares % Share Price ($) $10.00 Sunergy Rollover Equity 33.7 89.1% Pro Forma Equity Value $378.7 SPAC Shareholders 0.1 0.4% Plus: Pro Forma Debt 1.7 SPAC Sponsor 4.0 10.6% Plus: Pro Forma Convertible Preferred 10.0 Less: Pro
Forma Cash (3.3) Total 37.9 100.0% Pro Forma Enterprise Value $387.1 1) Warrants and interest earned in the trust account are excluded. $1.7M of debt and $4.3M of cash on Sunergy balance sheet and $0.6M of cash on ESGEN balance sheet prior and to
transaction. 37.9M pro forma shares outstanding at $10.00 per common share. Excludes 1M shares of New PubCo Class V Common Stock which have no economic value. Assumes $1.4M of the illustrative $14M cash in trust (90% redemptions). 10 All warrants
have a strike price of $11.50 per common share. Transaction Expenses includes $2.9M of SPAC related expenses in 2023. Excludes any awards available under the new equity incentive plan to be adopted in connection with the closing. Pursuant to Up-C
structure, Sunergy Rollover Equity to be OpCo Sunergy membership interests and Combined Co non-economic voting stock convertible together into Combined Co common stock.

Profitable Integrated Residential Solar Platform Sunergy Highlights Adj
EBITDA Margin 2022 2023E 2022 10,878,068 12.2% 2022 H2 10,056,405 `Installs ~2,100+ ~3,200 2023 H1 4,442,404 9.1% 2023 10,293,963 9.4% LTM 6/30/23 14,498,809 Net Revenue ~$89 million ~$114 million and EBITDA ~$10 million ~$12 million kW Installed
~23,000 kW ~31,000 kW Year-Over-Year Growth Revenue 29% Installs 46% kW Installed 35% Employees 110 180 In-House Sales Team 137 270 11

Differentiated Internal Sales Approach Unlocks Attractive Margins ◼
Multi-tiered sales process maximizes lead generation and conversion efficiencies ◼ Senior sales resources focused on high-potential and developed leads to maximize conversion into installs ◼ Sales force leverages a custom software
platform to augment sales efforts and a customer relationship management (“CRM”) system to actively track key performance indicators (“KPIs”) across the sales cycle (1) Sunergy’s Sales Process Drives Best-in-Class CAC
CRM & In-Field Technology ▪ CRM system captures ▪ Managers oversee regional sales offices and attend sales meetings as Closers comprehensive datapoints ▪ Approximately 55% of appointments conducted by Managers are closed
throughout the sales cycle ▪ Software tools enhance customer sales experience ▪ Closers meet with homeowners and close sales▪ Data informs Sunergy KPIs and ▪ 1.1 average daily meeting conducted per Closer; 46% of meetings are
closed provides real-time insights to management ▪ Real-time tracking of doors knocked, appointments set, sales closed, (2) ▪ Setters knock on 50-125 doors daily each and schedule sales meetings installations scheduled and other ▪
3 average daily potential appointments generated per Setter KPIs 1) Unless otherwise noted, figures below are for the year ended December 31, 2023 2) During the Company’s peak sales period in late Spring and Summer of 2023 12
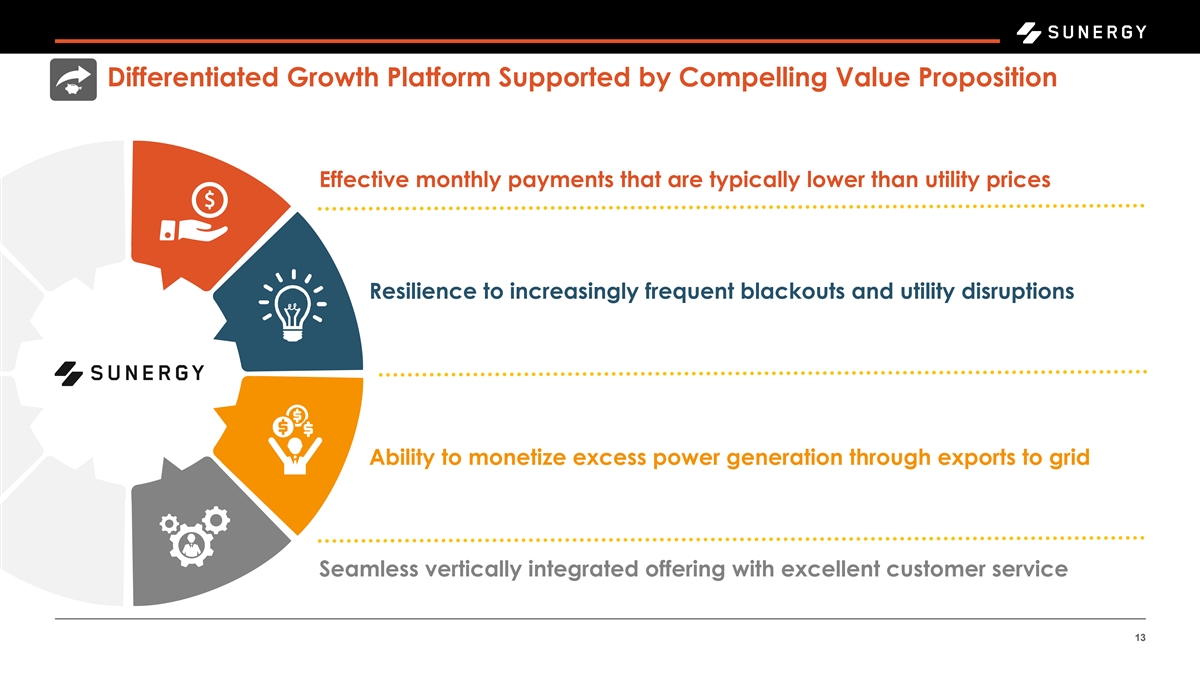
Differentiated Growth Platform Supported by Compelling Value Proposition
Effective monthly payments that are typically lower than utility prices Resilience to increasingly frequent blackouts and utility disruptions Ability to monetize excess power generation through exports to grid Seamless vertically integrated offering
with excellent customer service 13
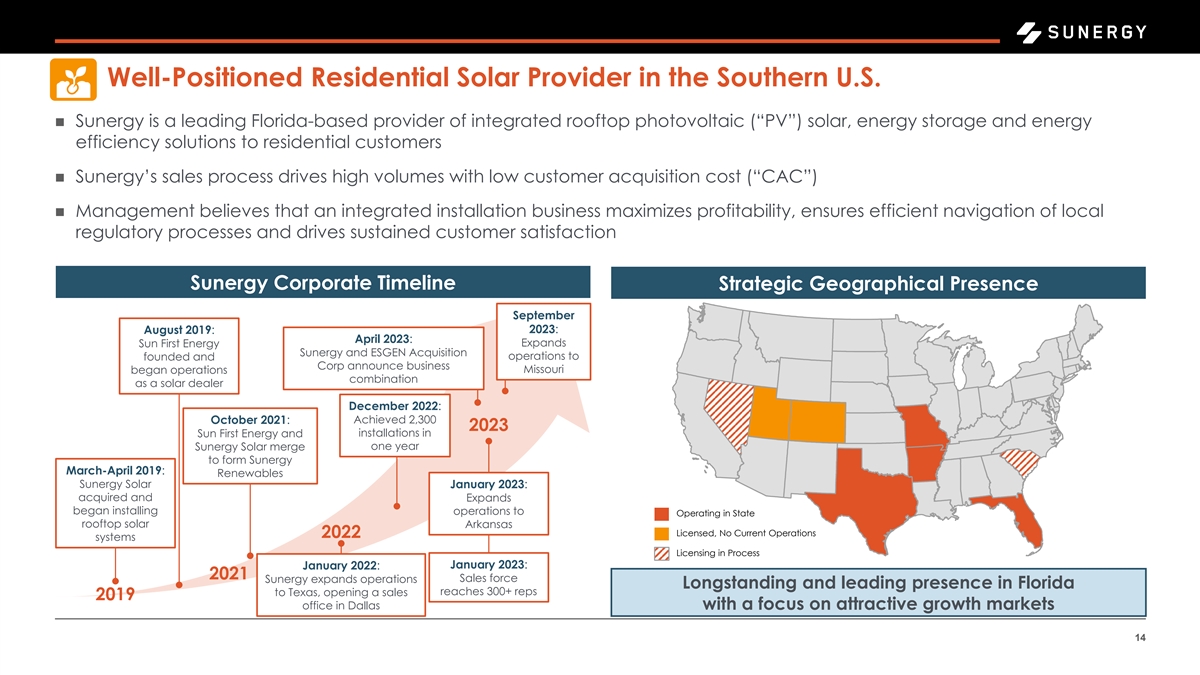
Well-Positioned Residential Solar Provider in the Southern U.S. ◼
Sunergy is a leading Florida-based provider of integrated rooftop photovoltaic (“PV”) solar, energy storage and energy efficiency solutions to residential customers ◼ Sunergy’s sales process drives high volumes with low
customer acquisition cost (“CAC”) ◼ Management believes that an integrated installation business maximizes profitability, ensures efficient navigation of local regulatory processes and drives sustained customer satisfaction Sunergy
Corporate Timeline Strategic Geographical Presence September 2023: August 2019: April 2023: Expands Sun First Energy Sunergy and ESGEN Acquisition operations to founded and Corp announce business Missouri began operations combination as a solar
dealer December 2022: October 2021: Achieved 2,300 2023 installations in Sun First Energy and one year Sunergy Solar merge to form Sunergy March-April 2019: Renewables Sunergy Solar January 2023: acquired and Expands began installing operations to
Operating in State rooftop solar Arkansas Licensed, No Current Operations 2022 systems Licensing in Process January 2022: January 2023: 2021 Sales force Sunergy expands operations Longstanding and leading presence in Florida reaches 300+ reps to
Texas, opening a sales 2019 office in Dallas with a focus on attractive growth markets 14

Vertically Integrated Offering Provides Competitive Strength ◼
Integrated installation division unlocks significant operating advantages including increased speed of project completion and higher conversion ratio of sales to installs ◼ Certain tasks are executed in-house while others are sub-contracted
⚫ High-value design, engineering and permitting processes are managed internally ⚫ Roofing drives high incremental margins in conjunction with PV solar installs Overview of Sunergy’s Installation Segment Site Survey ▪ Design
team surveys the project site and Permitting▪ Paperwork submitted to municipality System Design ▪ Team designs a build utilizing site specific information and Approval▪ Project is reviewed by an engineer and submitted to building
department ▪ Contractors typically install systems in one day Installation Permission ▪ Utility company installs a new meter at the customer’s site to Operate▪ Permission to operate is granted by the utility company
15
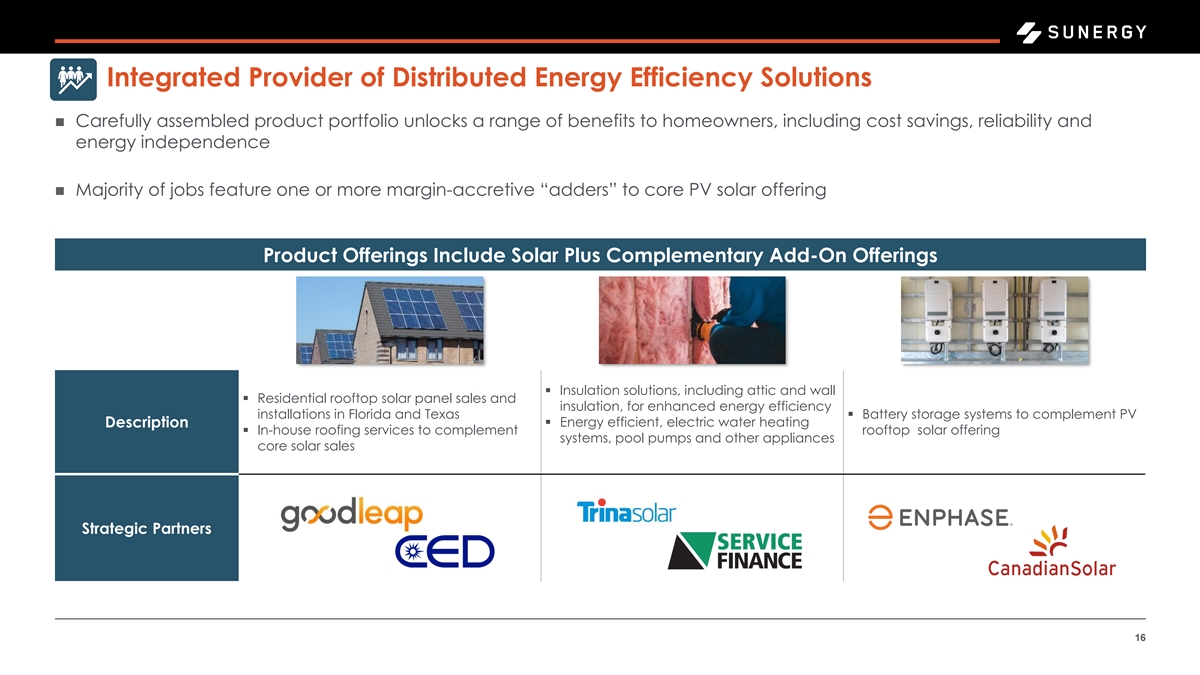
Integrated Provider of Distributed Energy Efficiency Solutions ◼
Carefully assembled product portfolio unlocks a range of benefits to homeowners, including cost savings, reliability and energy independence ◼ Majority of jobs feature one or more margin-accretive “adders” to core PV solar offering
Product Offerings Include Solar Plus Complementary Add-On Offerings PV Solar Efficiency Energy Storage ▪ Insulation solutions, including attic and wall ▪ Residential rooftop solar panel sales and insulation, for enhanced energy
efficiency installations in Florida and Texas▪ Battery storage systems to complement PV ▪ Energy efficient, electric water heating Description ▪ In-house roofing services to complement rooftop solar offering systems, pool pumps and
other appliances core solar sales Strategic Partners 16
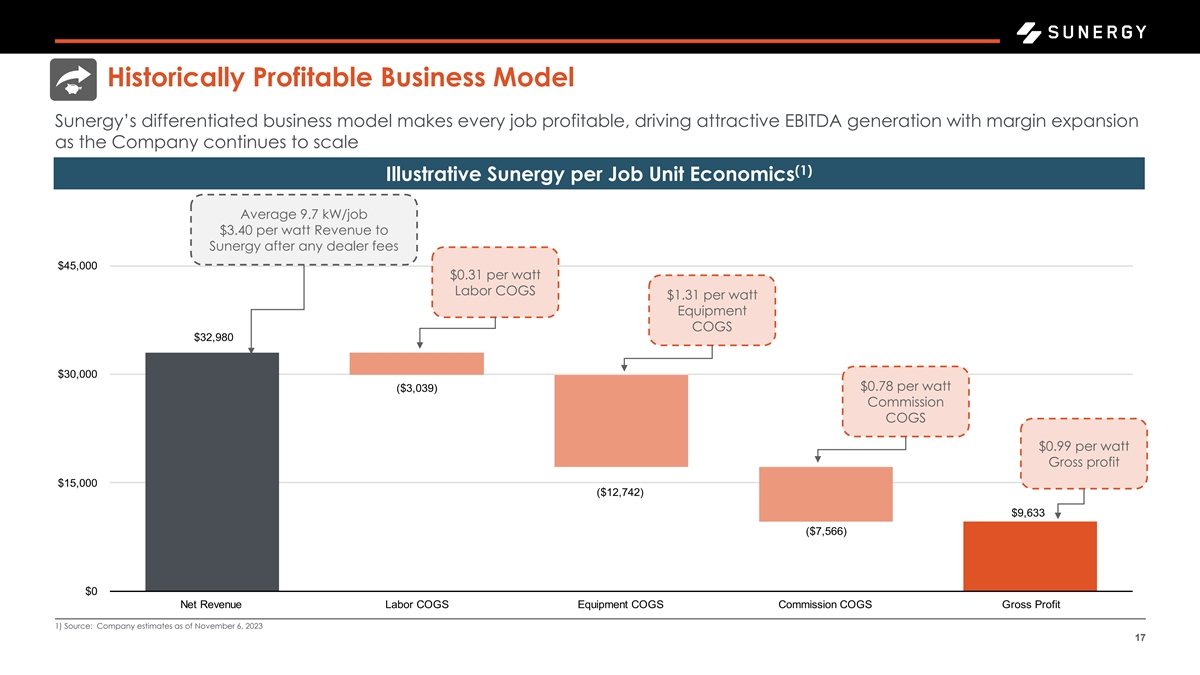
Historically Profitable Business Model Sunergy’s differentiated
business model makes every job profitable, driving attractive EBITDA generation with margin n expansio as the Company continues to scale (1) Illustrative Sunergy per Job Unit Economics Average 9.7 kW/job $3.40 per watt Revenue to Sunergy after any
dealer fees $0.31 per watt Labor COGS $1.31 per watt Equipment COGS $0.78 per watt Commission COGS $0.99 per watt Gross profit 1) Source: Company estimates as of November 6, 2023 17
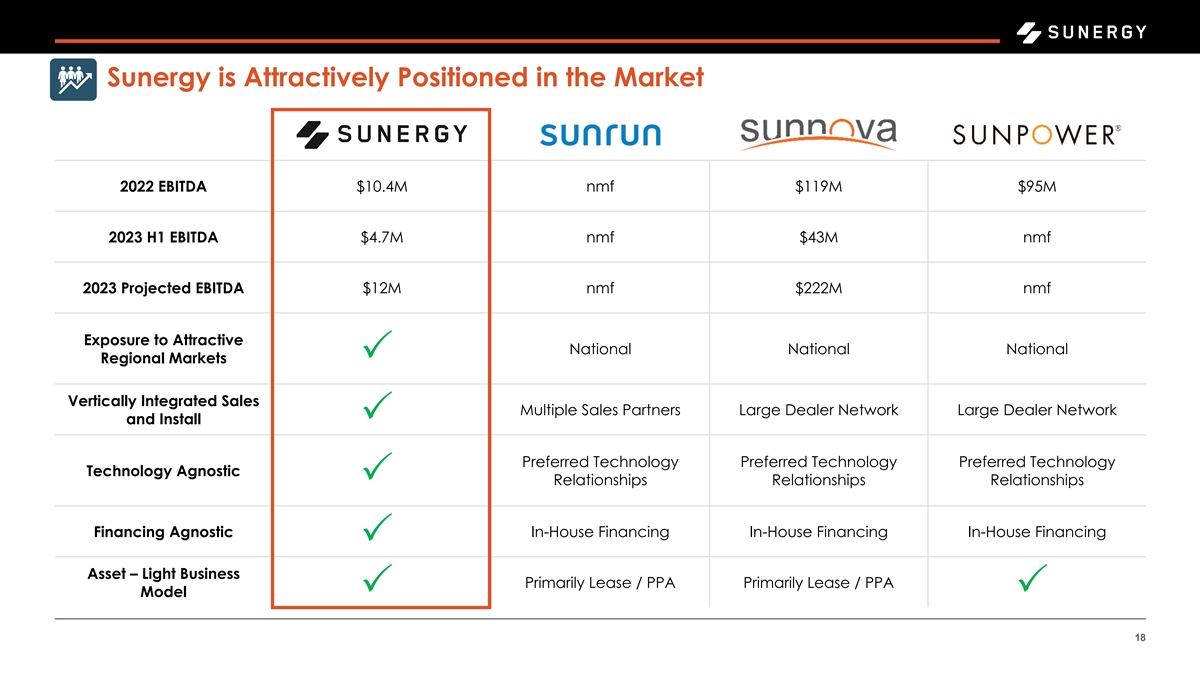
Sunergy is Attractively Positioned in the Market 2022 EBITDA $10.4M nmf
$119M $95M 2023 H1 EBITDA $4.7M nmf $43M nmf 2023 Projected EBITDA $12M nmf $222M nmf Exposure to Attractive National National National Regional MarketsP Vertically Integrated Sales Multiple Sales Partners Large Dealer Network Large Dealer Network
and Install P Preferred Technology Preferred Technology Preferred Technology Technology Agnostic Relationships Relationships Relationships P Financing Agnostic In-House Financing In-House Financing In-House Financing P Asset – Light Business
Primarily Lease / PPA Primarily Lease / PPA Model PP 18
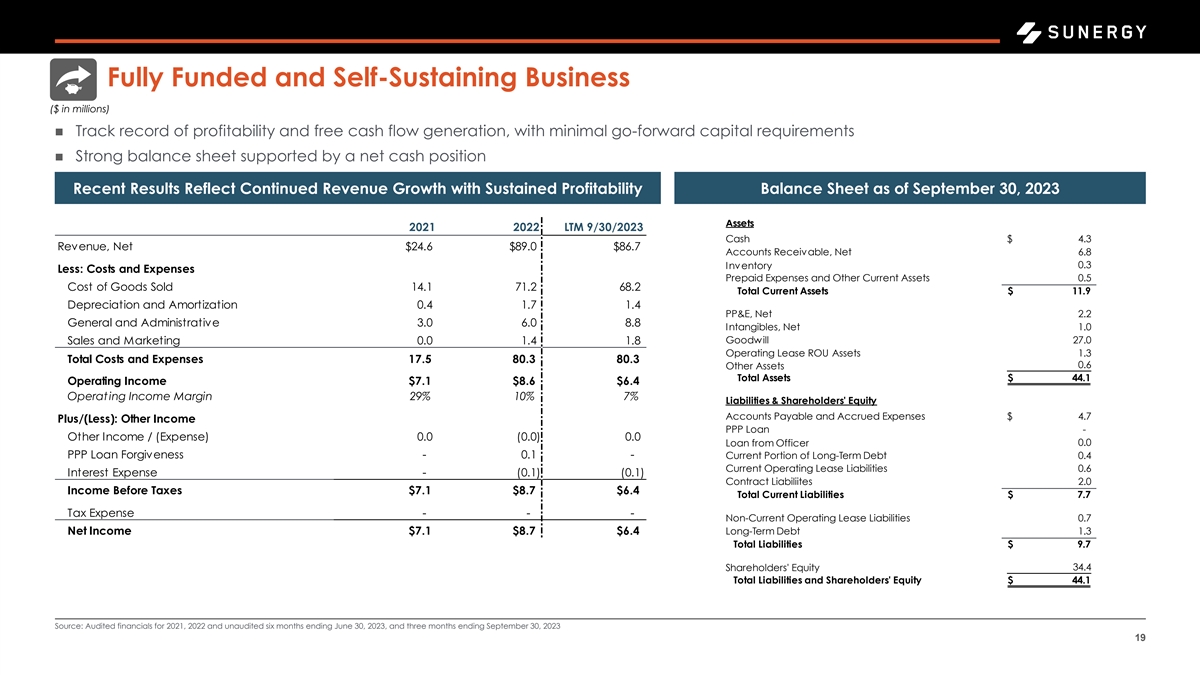
Fully Funded and Self-Sustaining Business ($ in millions) ◼ Track
record of profitability and free cash flow generation, with minimal go-forward capital requirements ◼ Strong balance sheet supported by a net cash position Recent Results Reflect Continued Revenue Growth with Sustained Profitability Balance
Sheet as of September 30, 2023 Assets 2021 2022 LTM 9/30/2023 Cash $ 4.3 Revenue, Net $24.6 $89.0 $86.7 Accounts Receivable, Net 6.8 0.3 Inventory Less: Costs and Expenses Prepaid Expenses and Other Current Assets 0.5 Cost of Goods Sold 14.1 71.2
68.2 Total Current Assets $ 11.9 Depreciation and Amortization 0.4 1.7 1.4 PP&E, Net 2.2 General and Administrative 3.0 6.0 8.8 Intangibles, Net 1.0 Goodwill 27.0 Sales and Marketing 0.0 1.4 1.8 Operating Lease ROU Assets 1.3 Total Costs and
Expenses 17.5 80.3 80.3 0.6 Other Assets Total Assets $ 44.1 Operating Income $7.1 $8.6 $6.4 Operating Income Margin 29% 10% 7% Liabilities & Shareholders' Equity Accounts Payable and Accrued Expenses $ 4.7 Plus/(Less): Other Income PPP Loan -
Other Income / (Expense) 0.0 (0.0) 0.0 0.0 Loan from Officer PPP Loan Forgiveness - 0.1 - Current Portion of Long-Term Debt 0.4 Current Operating Lease Liabilities 0.6 Interest Expense - (0.1) (0.1) Contract Liabiliites 2.0 Income Before Taxes $7.1
$8.7 $6.4 Total Current Liabilities $ 7.7 Tax Expense - - - Non-Current Operating Lease Liabilities 0.7 Net Income $7.1 $8.7 $6.4 Long-Term Debt 1.3 Total Liabilities $ 9.7 34.4 Shareholders' Equity Total Liabilities and Shareholders' Equity $ 44.1
Source: Audited financials for 2021, 2022 and unaudited six months ending June 30, 2023, and three months ending September 30, 2023 19
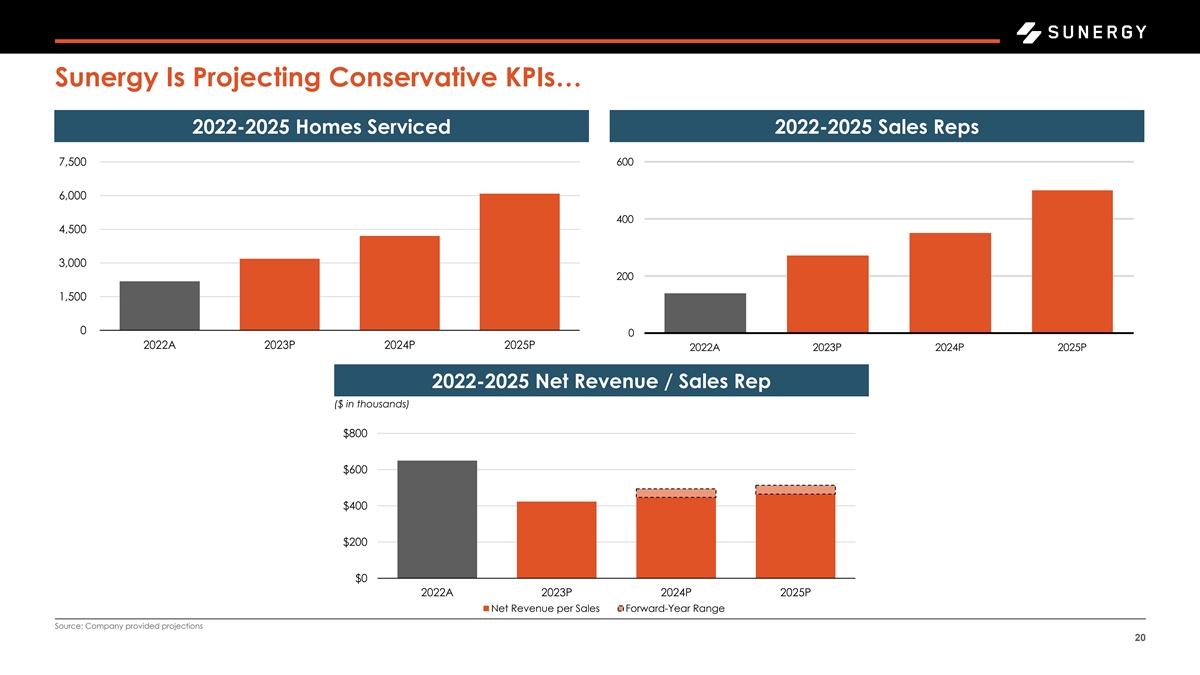
Sunergy Is Projecting Conservative KPIs… 2022-2025 Homes Serviced
2022-2025 Sales Reps 7,500 00 6,000 400 4,500 3,000 200 1,500 0 0 2022A 2023P 2024P 2025P 2022A 2023P 2024P 2025P 2022-2025 Net Revenue / Sales Rep ($ in thousands) $800 $600 $400 $200 $0 2022A 2023P 2024P 2025P Net Revenue per Sales Forward-Year
Range Source: Company provided projections 20
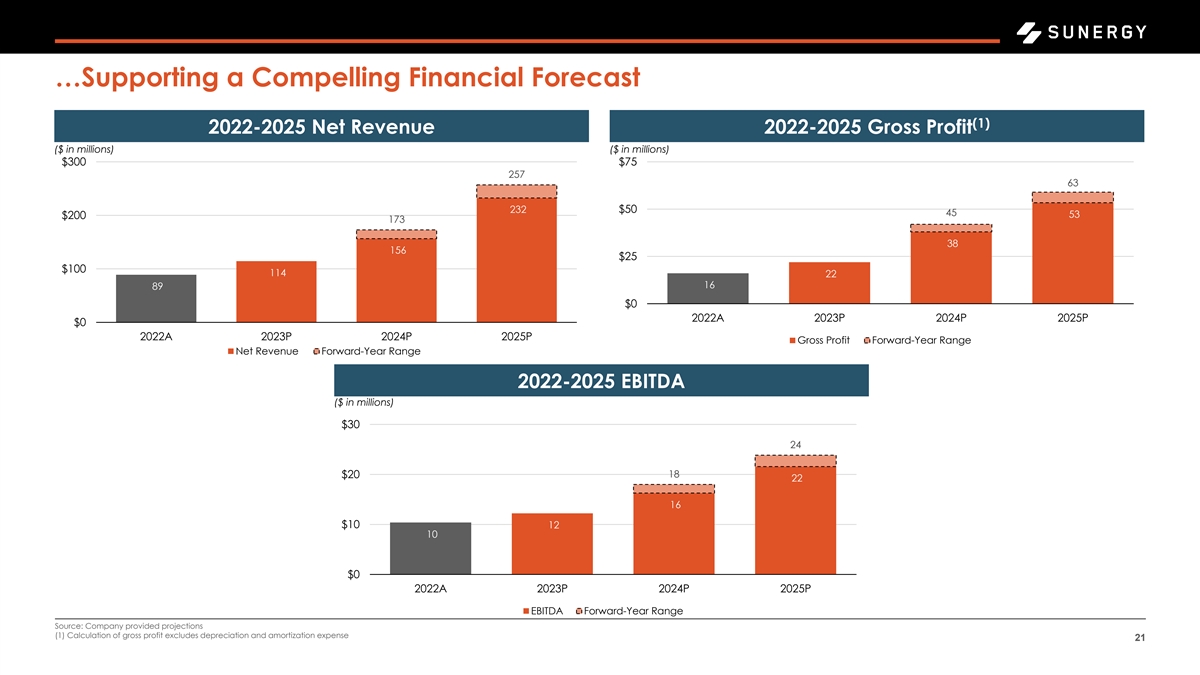
…Supporting a Compelling Financial Forecast (1) 2022-2025 Net
Revenue 2022-2025 Gross Profit ($ in millions) ($ in millions) $300 $75 257 63 232 $50 45 53 $200 173 38 156 $25 $100 114 22 16 89 $0 2022A 2023P 2024P 2025P $0 2022A 2023P 2024P 2025P Gross Profit Forward-Year Range Net Revenue Forward-Year Range
2022-2025 EBITDA ($ in millions) $30 24 18 $20 22 16 $10 12 10 $0 2022A 2023P 2024P 2025P EBITDA Forward-Year Range Source: Company provided projections (1) Calculation of gross profit excludes depreciation and amortization expense 21
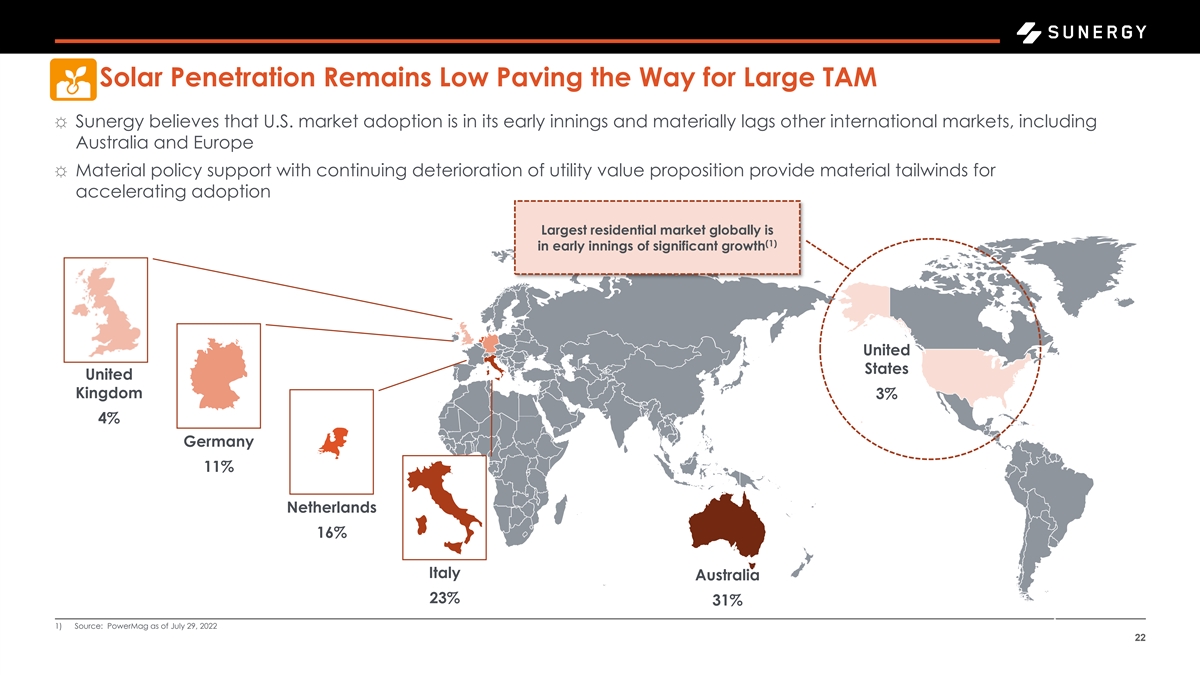
Solar Penetration Remains Low Paving the Way for Large TAM ☼ Sunergy
believes that U.S. market adoption is in its early innings and materially lags other international markets, including Australia and Europe ☼ Material policy support with continuing deterioration of utility value proposition provide material
tailwinds for accelerating adoption Largest residential market globally is (1) in early innings of significant growth United States United Kingdom 3% 4% Germany 11% Netherlands 16% Italy Australia 23% 31% 1) Source: PowerMag as of July 29, 2022
22
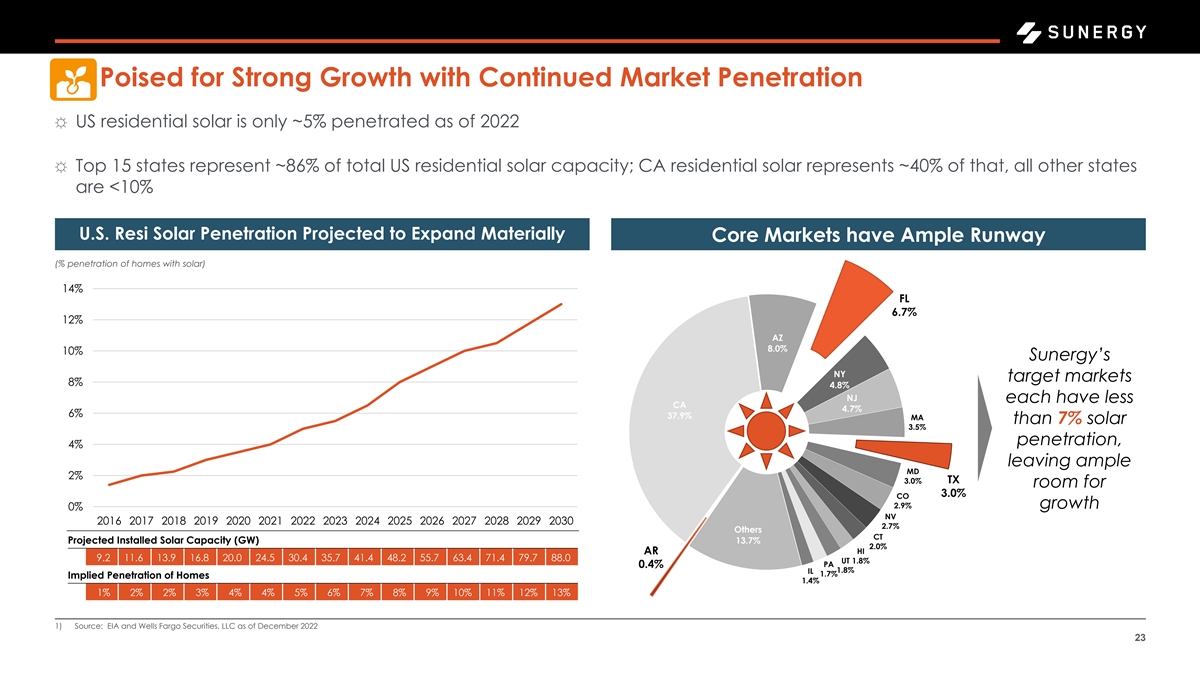
Poised for Strong Growth with Continued Market Penetration ☼ US
residential solar is only ~5% penetrated as of 2022 ☼ Top 15 states represent ~86% of total US residential solar capacity; CA residential solar represents ~40% of that, all other states are <10% U.S. Resi Solar Penetration Projected to
Expand Materially Core Markets have Ample Runway (% penetration of homes with solar) 14% FL 6.7% 12% AZ 8.0% 10% Sunergy’s NY target markets 8% 4.8% NJ each have less CA 4.7% 6% 37.9% MA than 7% solar 3.5% penetration, 4% leaving ample MD 2%
TX 3.0% room for 3.0% CO 2.9% growth 0% NV 2016 2017 2018 2019 2020 2021 2022 2023 2024 2025 2026 2027 2028 2029 2030 2.7% Others CT Projected Installed Solar Capacity (GW) 13.7% 2.0% HI AR 9.2 11.6 13.9 16.8 20.0 24.5 30.4 35.7 41.4 48.2 55.7 63.4
71.4 79.7 88.0 UT 1.8% PA 0.4% IL 1.8% 1.7% Implied Penetration of Homes 1.4% 1% 2% 2% 3% 4% 4% 5% 6% 7% 8% 9% 10% 11% 12% 13% 1) Source: EIA and Wells Fargo Securities, LLC as of December 2022 23
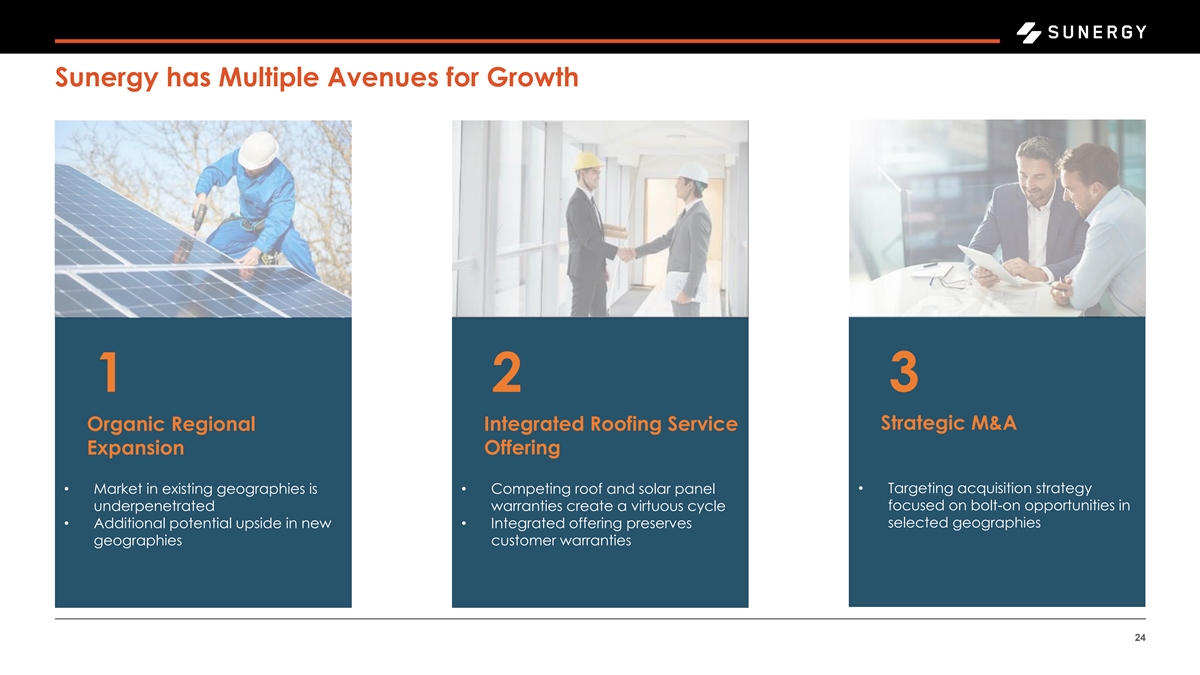
Sunergy has Multiple Avenues for Growth 1 2 3 Strategic M&A Organic
Regional Integrated Roofing Service Expansion Offering • Targeting acquisition strategy • Market in existing geographies is • Competing roof and solar panel underpenetrated warranties create a virtuous cycle focused on bolt-on
opportunities in selected geographies • Additional potential upside in new • Integrated offering preserves geographies customer warranties 24

Market Trends Are Favorable To Sunergy Favorable Economics are Driving
Fragmented Market provides 7 1 Accelerating PV Solar Adoption Consolidation Opportunity Consumer Focus on Energy Utility Price Inflation is a 6 2 Efficiency Continues to Material Tailwind Increase to Solar Adoption Residential Solar Inflation
Reduction Act 5 3 Supports Growing Provides Substantial Demand for Resilience Tailwinds 4 Regulatory Environment is Favorable 25
Why Sunergy? High Growth Business Historically Profitable Clean Balance
Sheet Secular Growth Industry 26

II. Appendix 27

Integrated Model Drives Profitability and Operational Excellence ☼
Integrated model seeks to minimize time from initial contact to final install and: ☼ Minimize customer frustration and attrition ☼ Reduce customer acquisition cost (CAC) ☼ Ensure sales agents are rewarded with commissions from
recognized revenue ☼ Create a motivated employee base that drives operational excellence and minimizes hiring and re-training expenses Time Day 1 Day 3 Day 10 Day 30 Door Knocked In-House Engineering and Permitting and Appointment Design
Installation | and Sale Record Revenue Rapid sales-to-install cycle fuels Sunergy's virtuous cycle of profitability Day 1 Day 10+ Day 30+ Day 60+ Door Knocked In-House Engineering and Permitting and More Some Customer Further Customer Appointment
Design Installation | Customer Attrition Attrition Attrition and Sale Record Revenue COMPANY A COMPANY A COMPANY B COMPANY C 28

Strategic Geographic Presence — Florida A $17.6B 12,612 Total Solar
Investment Solar Installed (MW) In State 12,168 6.07% Growth projected Percentage of state’s over the next 5 years electricity from solar (MW) ▪ Florida's abundant sunshine and favorable climate make it an ideal market for residential
solar. With an average of over 230 sunny days per year, homeowners can harness this renewable energy source to power their homes efficiently ▪ The state offers a net metering policy, allowing residential solar Select State Incentives owners to
receive credits for excess electricity they generate and ✓ Property tax exemption for residential solar energy systems feed back into the grid. This incentivizes homeowners to invest in ✓ Investment Tax Credit (“ITC”)
offsetting upfront expenses solar systems, reducing their reliance on traditional energy sources associated with setting up solar and potentially lowering their utility ✓ State and local rebate programs 1) Solar Energy Industries Association
(SEIA) State Factsheet (Data through Q2 2023) 29
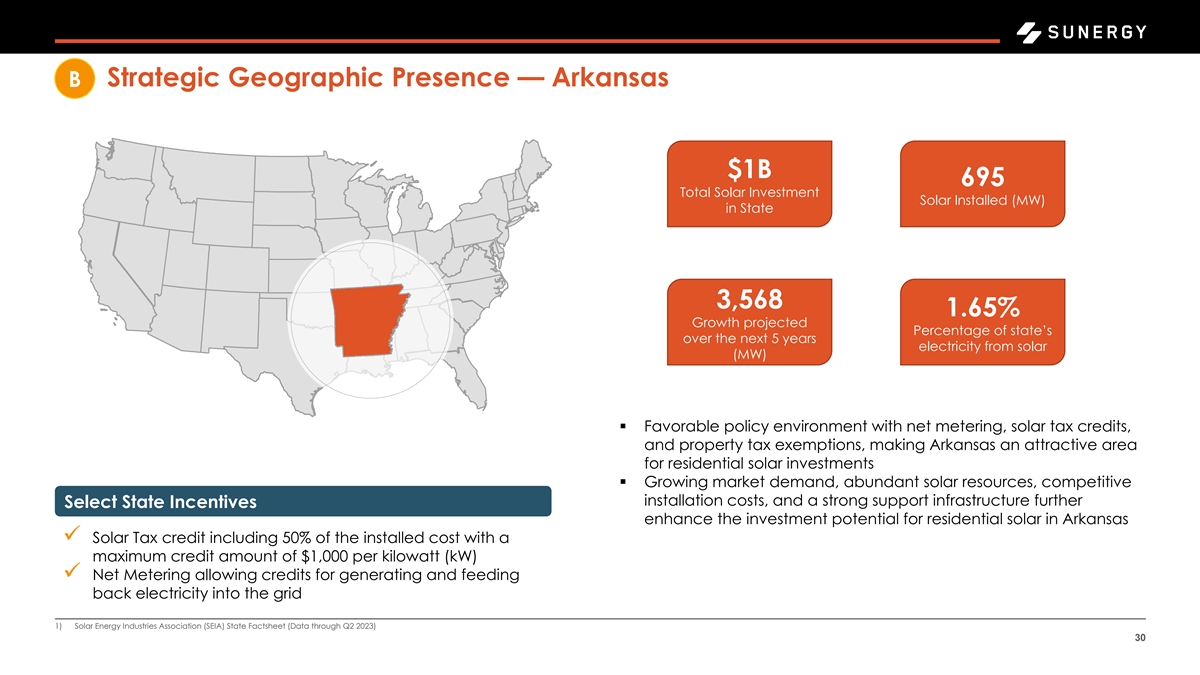
Strategic Geographic Presence — Arkansas B $1B 695 Total Solar
Investment Solar Installed (MW) in State 3,568 1.65% Growth projected Percentage of state’s over the next 5 years electricity from solar (MW) ▪ Favorable policy environment with net metering, solar tax credits, and property tax
exemptions, making Arkansas an attractive area for residential solar investments ▪ Growing market demand, abundant solar resources, competitive installation costs, and a strong support infrastructure further Select State Incentives enhance the
investment potential for residential solar in Arkansas ✓ Solar Tax credit including 50% of the installed cost with a maximum credit amount of $1,000 per kilowatt (kW) ✓ Net Metering allowing credits for generating and feeding back
electricity into the grid 1) Solar Energy Industries Association (SEIA) State Factsheet (Data through Q2 2023) 30

Strategic Geographic Presence — Texas C $22.7B 18,801 Total Solar
Investment Solar Installed (MW) in State 40,579 5.13% Growth projected Percentage of state’s over the next 5 years electricity from solar (MW) ▪ Abundant solar resources and favorable climate make Texas a prime location for residential
solar investments ▪ Expanding market demand, coupled with state incentives like rebates and tax exemptions, create a compelling environment for residential solar investing in Texas Select State Incentives ✓ Rebate programs for
residential solar installations ✓ Residential solar systems are exempt from property taxes ✓ Homeowners in Texas have a tax exemption on the purchase of solar energy systems 1) Solar Energy Industries Association (SEIA) State Factsheet
(Data through Q2 2023) 31
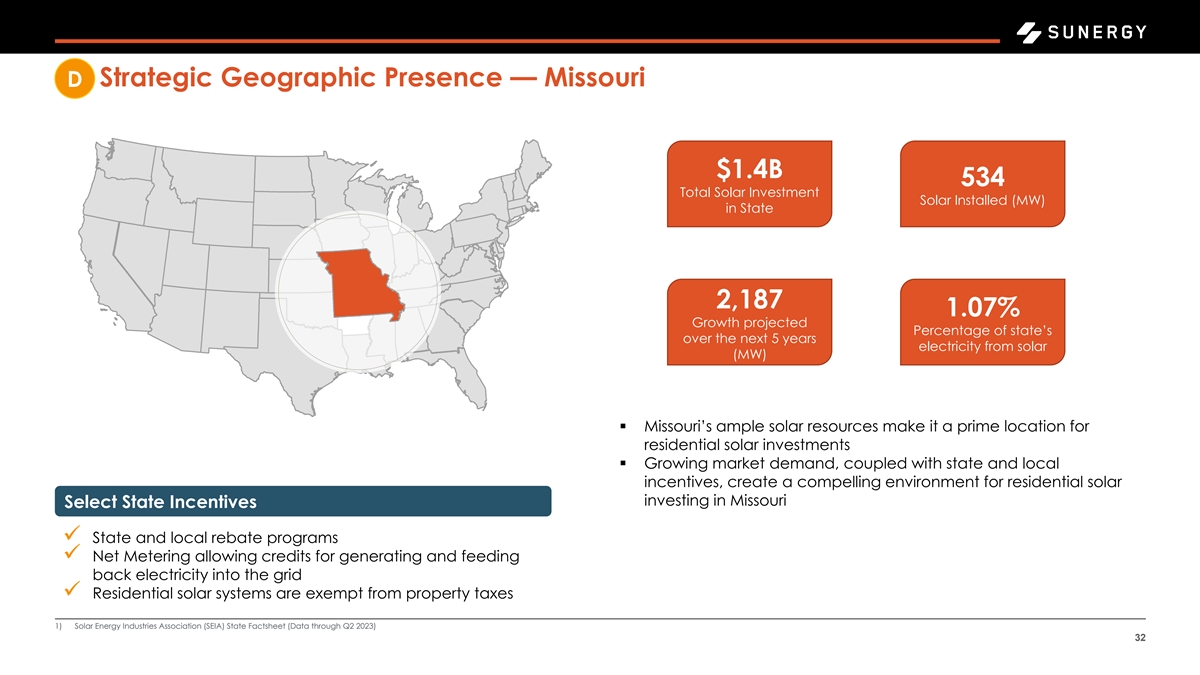
Strategic Geographic Presence — Missouri D $1.4B 534 Total Solar
Investment Solar Installed (MW) in State 2,187 1.07% Growth projected Percentage of state’s over the next 5 years electricity from solar (MW) ▪ Missouri’s ample solar resources make it a prime location for residential solar
investments ▪ Growing market demand, coupled with state and local incentives, create a compelling environment for residential solar investing in Missouri Select State Incentives ✓ State and local rebate programs ✓ Net Metering
allowing credits for generating and feeding back electricity into the grid ✓ Residential solar systems are exempt from property taxes 1) Solar Energy Industries Association (SEIA) State Factsheet (Data through Q2 2023) 32
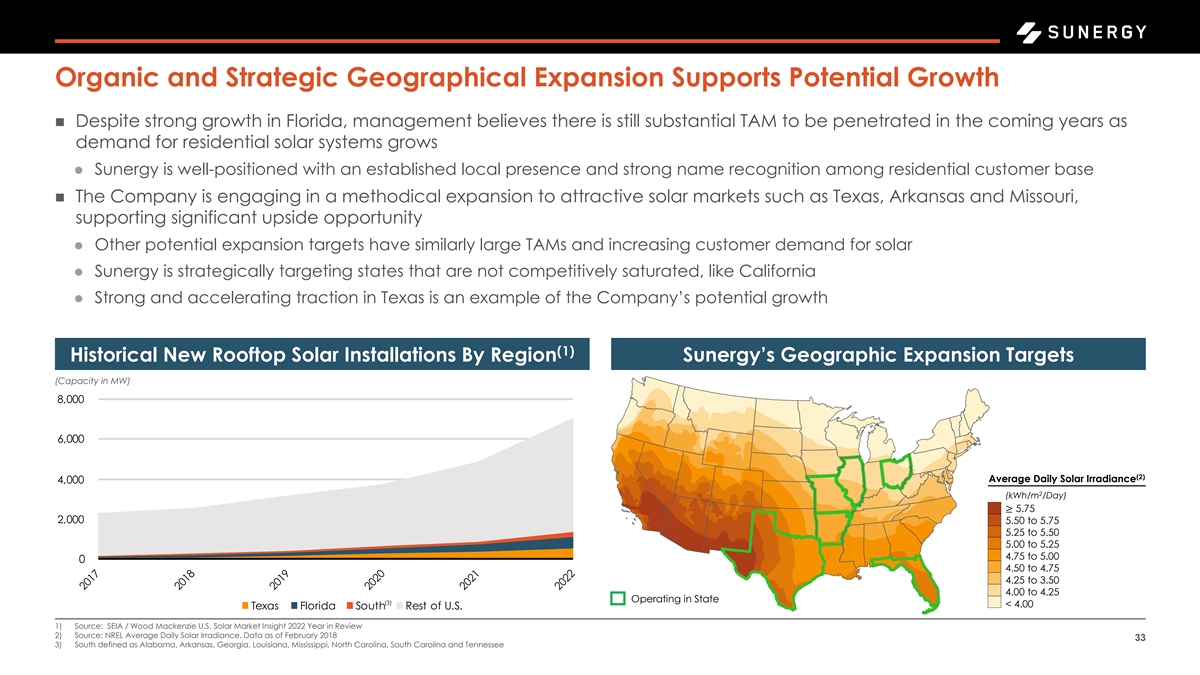
Organic and Strategic Geographical Expansion Supports Potential Growth
◼ Despite strong growth in Florida, management believes there is still substantial TAM to be penetrated in the coming years as demand for residential solar systems grows ⚫ Sunergy is well-positioned with an established local presence and
strong name recognition among residential customer base ◼ The Company is engaging in a methodical expansion to attractive solar markets such as Texas, Arkansas and Missouri, supporting significant upside opportunity ⚫ Other potential
expansion targets have similarly large TAMs and increasing customer demand for solar ⚫ Sunergy is strategically targeting states that are not competitively saturated, like California ⚫ Strong and accelerating traction in Texas is an
example of the Company’s potential growth (1) Historical New Rooftop Solar Installations By Region Sunergy’s Geographic Expansion Targets (Capacity in MW) ,000 ,000 (2) Average Daily Solar Irradiance 4,000 2 (kWh/m /Day) ≥ 5.75
2,000 5.50 to 5.75 5.25 to 5.50 5.00 to 5.25 4.75 to 5.00 0 4.50 to 4.75 4.25 to 3.50 4.00 to 4.25 Operating in State (3) < 4.00 Texas Florida South Rest of .US. 1) Source: SEIA / Wood Mackenzie U.S. Solar Market Insight 2022 Year in Review 2)
Source: NREL Average Daily Solar Irradiance. Data as of February 2018 33 3) South defined as Alabama, Arkansas, Georgia, Louisiana, Mississippi, North Carolina, South Carolina and Tennessee
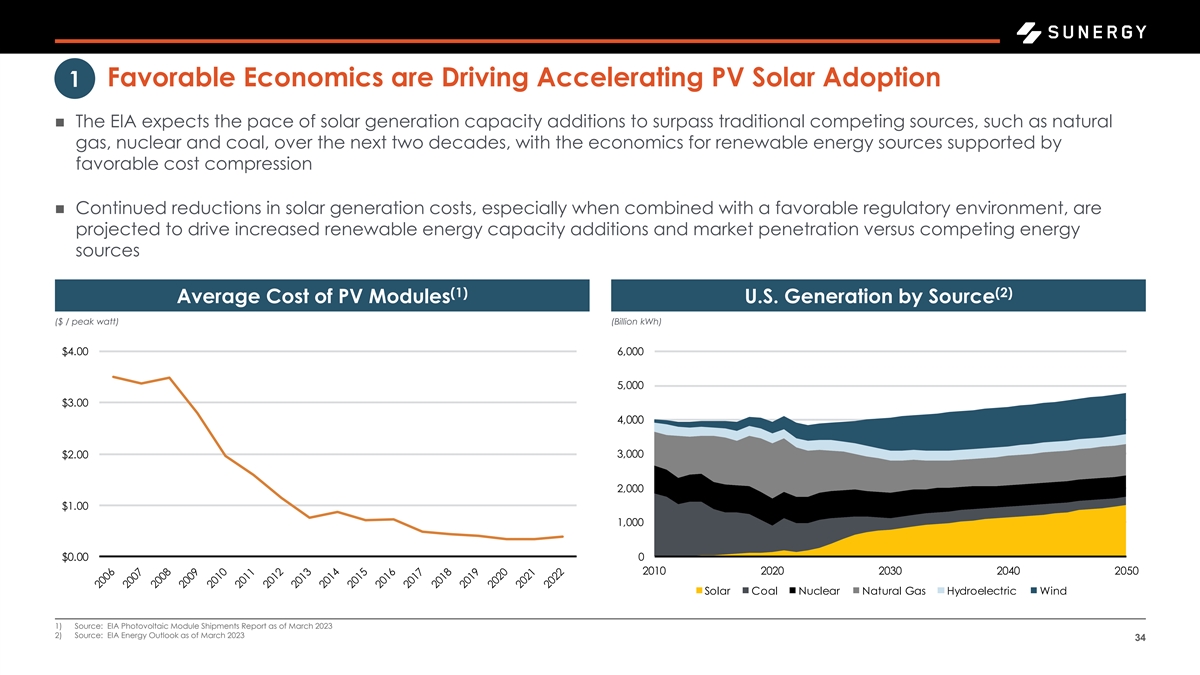
Favorable Economics are Driving Accelerating PV Solar Adoption 1 ◼
The EIA expects the pace of solar generation capacity additions to surpass traditional competing sources, such as natural gas, nuclear and coal, over the next two decades, with the economics for renewable energy sources supported by favorable cost
compression ◼ Continued reductions in solar generation costs, especially when combined with a favorable regulatory environment, are projected to drive increased renewable energy capacity additions and market penetration versus competing energy
sources (1) (2) Average Cost of PV Modules U.S. Generation by Source ($ / peak watt) (Billion kWh) 4.00 ,000 5,000 3.00 4,000 3,000 2.00 2,000 1.00 1,000 0 0.00 2010 2020 2030 2040 2050 Solar Coal Nuclear Natural Gas ydroelectric Wind 1) Source: EIA
Photovoltaic Module Shipments Report as of March 2023 2) Source: EIA Energy Outlook as of March 2023 34
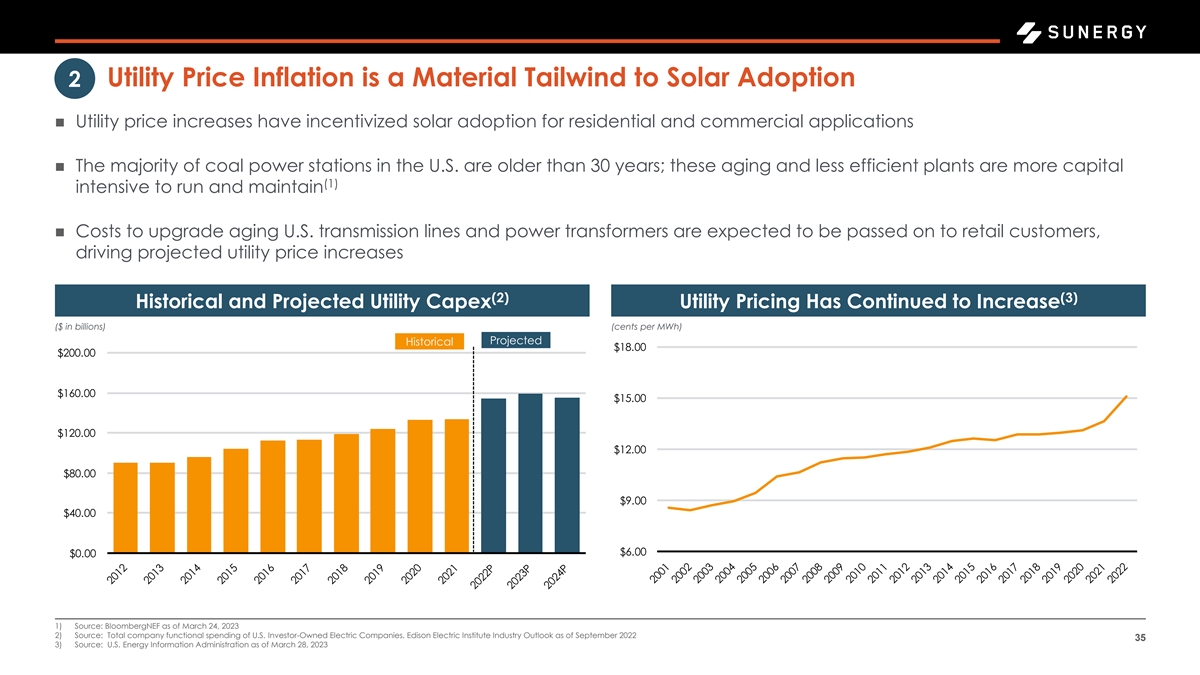
Utility Price Inflation is a Material Tailwind to Solar Adoption 2 ◼
Utility price increases have incentivized solar adoption for residential and commercial applications ◼ The majority of coal power stations in the U.S. are older than 30 years; these aging and less efficient plants are more capital (1)
intensive to run and maintain ◼ Costs to upgrade aging U.S. transmission lines and power transformers are expected to be passed on to retail customers, driving projected utility price increases (2) (3) Historical and Projected Utility Capex
Utility Pricing Has Continued to Increase ($ in billions) (cents per MWh) Projected Historical 1 .00 200.00 1 0.00 15.00 120.00 12.00 0.00 9.00 40.00 .00 0.00 1) Source: BloombergNEF as of March 24, 2023 2) Source: Total company functional spending
of U.S. Investor-Owned Electric Companies. Edison Electric Institute Industry Outlook as of September 2022 35 3) Source: U.S. Energy Information Administration as of March 28, 2023
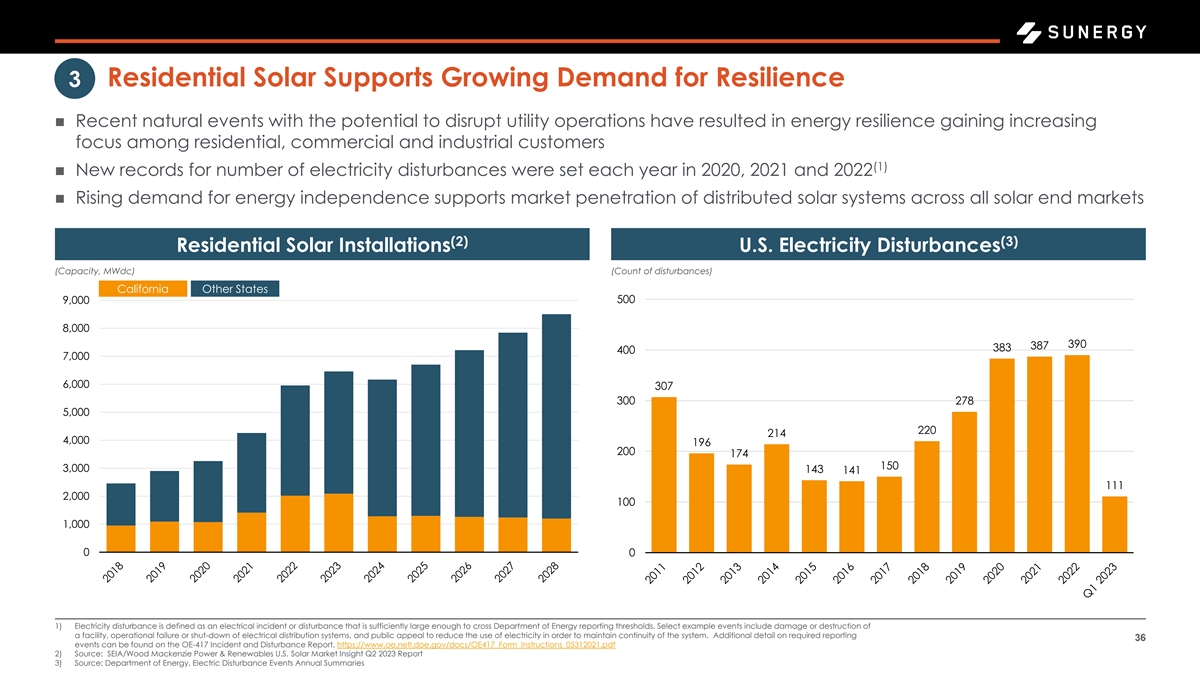
Residential Solar Supports Growing Demand for Resilience 3 ◼ Recent
natural events with the potential to disrupt utility operations have resulted in energy resilience gaining increasing focus among residential, commercial and industrial customers (1) ◼ New records for number of electricity disturbances were
set each year in 2020, 2021 and 2022 ◼ Rising demand for energy independence supports market penetration of distributed solar systems across all solar end markets (2) (3) Residential Solar Installations U.S. Electricity Disturbances (Capacity,
MWdc) (Count of disturbances) California Other States 500 9,000 8,000 390 387 383 400 7,000 6,000 307 300 278 5,000 220 214 4,000 196 200 174 150 3,000 143 141 111 2,000 100 1,000 0 0 1) Electricity disturbance is defined as an electrical incident
or disturbance that is sufficiently large enough to cross Department of Energy reporting thresholds. Select example events include damage or destruction of a facility, operational failure or shut-down of electrical distribution systems, and public
appeal to reduce the use of electricity in order to maintain continuity of the system. Additional detail on required reporting 36 events can be found on the OE-417 Incident and Disturbance Report.
https://www.oe.netl.doe.gov/docs/OE417_Form_Instructions_05312021.pdf 2) Source: SEIA/Wood Mackenzie Power & Renewables U.S. Solar Market Insight Q2 2023 Report 3) Source: Department of Energy, Electric Disturbance Events Annual
Summaries
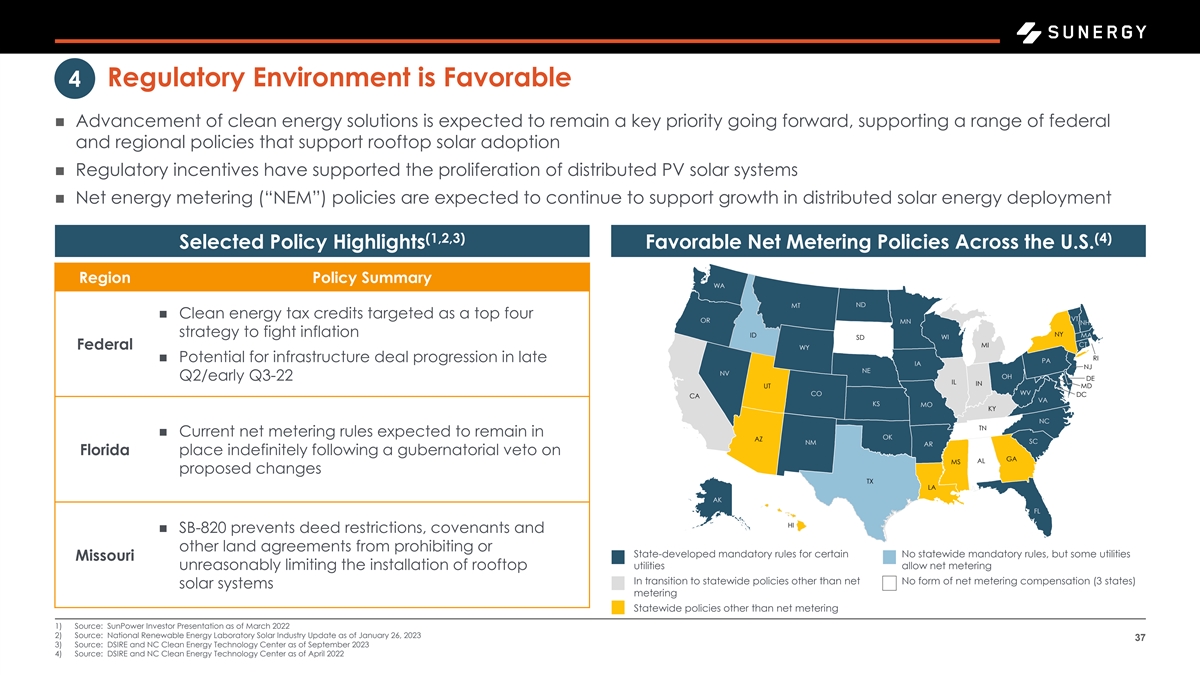
Regulatory Environment is Favorable 4 ◼ Advancement of clean energy
solutions is expected to remain a key priority going forward, supporting a range of federal and regional policies that support rooftop solar adoption ◼ Regulatory incentives have supported the proliferation of distributed PV solar systems
◼ Net energy metering (“NEM”) policies are expected to continue to support growth in distributed solar energy deployment (1,2,3) (4) Selected Policy Highlights Favorable Net Metering Policies Across the U.S. Region Policy Summary
WA MT ND ◼ Clean energy tax credits targeted as a top four VT OR MN NH NY strategy to fight inflation ID MA SD WI MI CT Federal WY RI ◼ Potential for infrastructure deal progression in late PA IA NJ NE NV OH Q2/early Q3-22 DE IL IN UT MD
WV CO DC CA VA KS MO KY NC TN ◼ Current net metering rules expected to remain in OK AZ SC NM AR Florida place indefinitely following a gubernatorial veto on GA AL MS proposed changes TX LA AK FL HI ◼ SB-820 prevents deed restrictions,
covenants and other land agreements from prohibiting or State-developed mandatory rules for certain No statewide mandatory rules, but some utilities Missouri utilities allow net metering unreasonably limiting the installation of rooftop In
transition to statewide policies other than net No form of net metering compensation (3 states) solar systems metering Statewide policies other than net metering 1) Source: SunPower Investor Presentation as of March 2022 2) Source: National
Renewable Energy Laboratory Solar Industry Update as of January 26, 2023 37 3) Source: DSIRE and NC Clean Energy Technology Center as of September 2023 4) Source: DSIRE and NC Clean Energy Technology Center as of April 2022
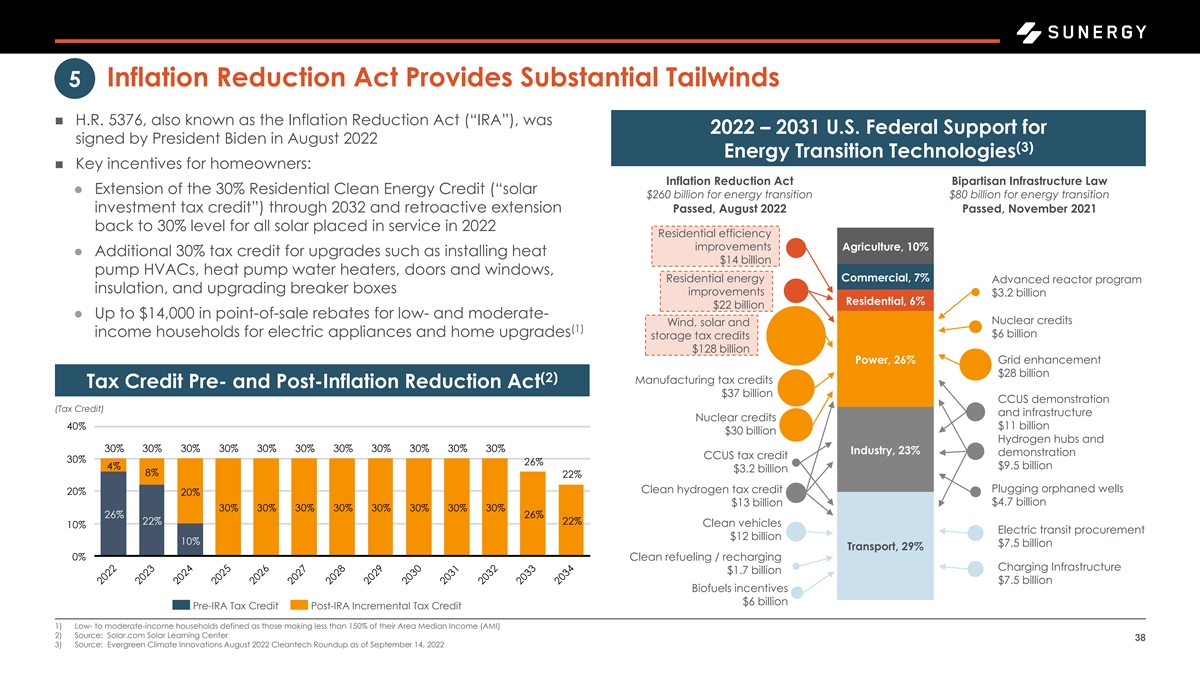
Inflation Reduction Act Provides Substantial Tailwinds 5 ◼ .R. 537 ,
also known as the Inflation Reduction Act (“IRA”), was 2022 – 2031 U.S. Federal Support for signed by President Biden in August 2022 (3) Energy Transition Technologies ◼ Key incentives for homeowners: Inflation Reduction Act
Bipartisan Infrastructure Law ⚫ Extension of the 30% Residential Clean Energy Credit (“solar $260 billion for energy transition $80 billion for energy transition investment tax credit”) through 2032 and retroactive extension
Passed, August 2022 Passed, November 2021 back to 30% level for all solar placed in service in 2022 Residential efficiency improvements Agriculture, 10% ⚫ Additional 30% tax credit for upgrades such as installing heat $14 billion pump HVACs,
heat pump water heaters, doors and windows, Commercial, 7% Residential energy Advanced reactor program insulation, and upgrading breaker boxes improvements $3.2 billion Residential, 6% $22 billion ⚫ Up to $14,000 in point-of-sale rebates for
low- and moderate- Nuclear credits Wind, solar and (1) income households for electric appliances and home upgrades $6 billion storage tax credits $128 billion Power, 26% Grid enhancement $28 billion (2) Manufacturing tax credits Tax Credit Pre- and
Post-Inflation Reduction Act $37 billion CCUS demonstration (Tax Credit) and infrastructure Nuclear credits $11 billion 40% $30 billion Hydrogen hubs and 30% 30% 30% 30% 30% 30% 30% 30% 30% 30% 30% Industry, 23% demonstration CCUS tax credit 30% 2 %
4% $9.5 billion $3.2 billion % 22% Plugging orphaned wells Clean hydrogen tax credit 20% 20% $4.7 billion $13 billion 30% 30% 30% 30% 30% 30% 30% 30% 2 % 2 % 22% 22% Clean vehicles 10% Electric transit procurement $12 billion 10% $7.5 billion
Transport, 29% 0% Clean refueling / recharging Charging Infrastructure $1.7 billion $7.5 billion Biofuels incentives $6 billion Pre-IRA Tax Credit Post-IRA Incremental Tax Credit 1) Low- to moderate-income households defined as those making less
than 150% of their Area Median Income (AMI) 2) Source: Solar.com Solar Learning Center 38 3) Source: Evergreen Climate Innovations August 2022 Cleantech Roundup as of September 14, 2022

Consumer Focus on Energy Efficiency Continues to Increase 6 ◼
Homeowner focus on residential energy efficiency and weatherization has accelerated as a result of inflation in electricity prices combined with the rising cost of energy commodities ◼ Demand for key energy efficiency solutions, including
insulation, energy efficient appliances and leak prevention, is expected to continue to increase ⚫ omeowners reported an average return on investment (“ROI”) of 117% on attic insulation renovations ⚫ Supportive policies and
incentives are projected to result in accelerated demand for these solutions (1) Energy Efficiency Projects Support Strong ROI Selected Energy Efficiency Solutions Sunergy East North Central Solution Highlights Offering East South Central Middle
Atlantic ▪ Preserves home’s interior temperature through installation Mountain Insulation ✓ of fiberglass insulation in attics New England and wall interiors Pacific ▪ Installation of advanced South Atlantic Efficient water
heaters, pool pumps, heat West North Central ✓ Appliances pumps and other energy West South Central efficient appliances National Average Sealing ▪ Air and duct sealing services to ✓ 0% 50% 100% 150% Services minimize energy loss
(% of project cost recouped at home sale) 1) Source: EnergySage, Regional ROIs on Attic Insulation as of March 2023 39
V. Appendix 40

Reconciliation of Non-GAAP Metrics Reconciliation of Revenue (Loss) to
EBITDA ($) FY2022A Net income (loss) $8,665,770 Depreciation and amortization 1,706,243 Other income: Other income, net 2,510 PPP loan forgiv eness ( 73,809) Interest expense 51,295 Tax prov ision / (benefit) - EBITDA $10,352,008 1) Source: Public
company fillings. 41
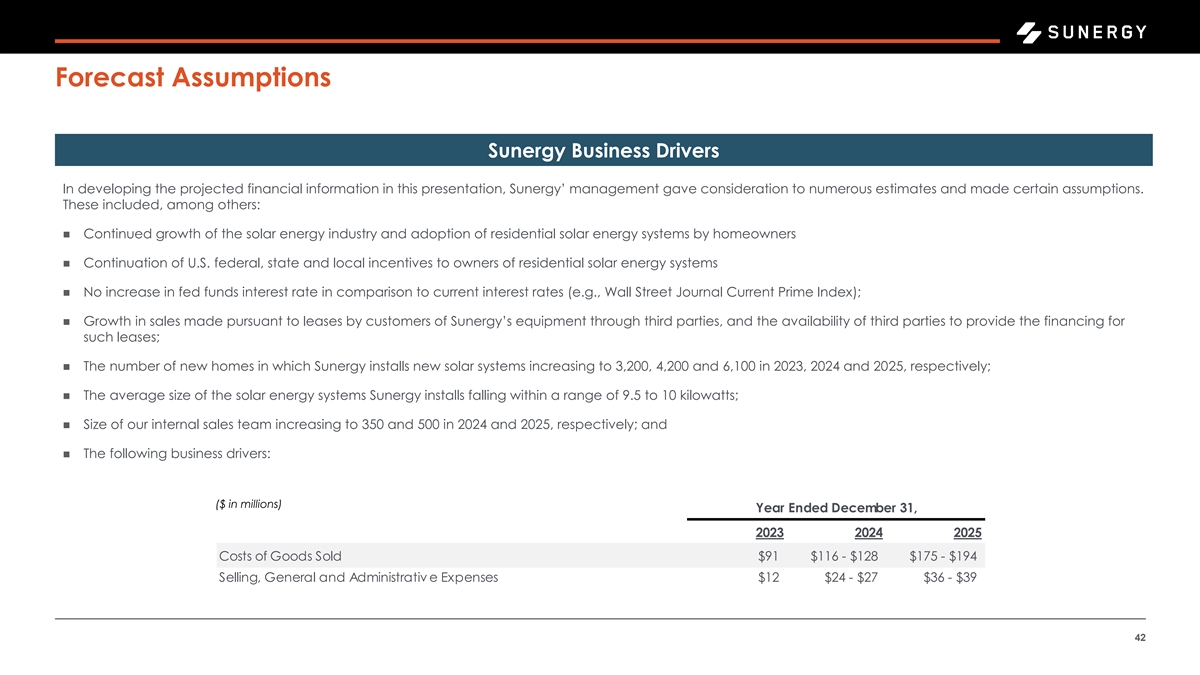
Forecast Assumptions Sunergy Business Drivers In developing the projected
financial information in this presentation, Sunergy’ management gave consideration to num timates and erous esmade certain assumptions. These included, among others: ◼ Continued growth of the solar energy industry and adoption of
residential solar energy systems by homeowners ◼ Continuation of U.S. federal, state and local incentives to owners of residential solar energy systems ◼ No increase in fed funds interest rate in comparison to current interest rates
(e.g., Wall Street Journal Current Prime Index); ◼ Growth in sales made pursuant to leases by customers of Sunergy’s equipment through third parties, and the av ird ai lab parti ility es to of pro th vide the financing for such leases;
◼ The number of new homes in which Sunergy installs new solar systems increasing to 3,200, 4,200 and 6,100 in 2023, 2024 and 2025, respectively; ◼ The average size of the solar energy systems Sunergy installs falling within a range of
9.5 to 10 kilowatts; ◼ Size of our internal sales team increasing to 350 and 500 in 2024 and 2025, respectively; and ◼ The following business drivers: ($ in millions) Year Ended December 31, 2023 2024 2025 Costs of Goods Sold $91 $116 -
$128 $175 - $194 Selling, General and Administrativ e Expenses $12 $24 - $27 $36 - $39 42
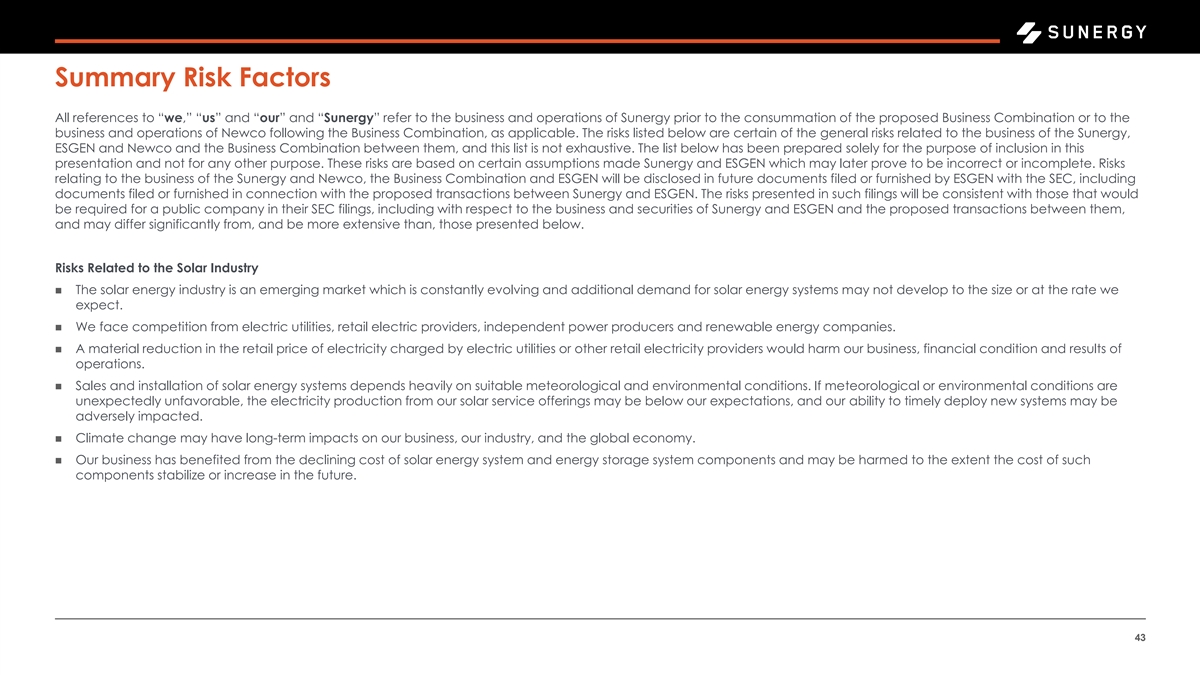
Summary Risk Factors All references to we “,” “
us” and our “ ” and Sunergy “ ” refer to the business and operations of Sunergy prior to the consummation of the proposed Business Combination or to the business and operations of Newco following the Business
Combination, as applicable. The risks listed below are certain of the general risks related to the business of the Sunergy, ESGEN and Newco and the Business Combination between them, and this list is not exhaustive. The list below has been prepared
solely for the purpose of inclusion in this presentation and not for any other purpose. These risks are based on certain assumptions made Sunergy and ESGEN which may later prove to be incorrect or incomplete. Risks relating to the business of the
Sunergy and Newco, the Business Combination and ESGEN will be disclosed in future documents filed or furnished by ESGEN with the SEC, including documents filed or furnished in connection with the proposed transactions between Sunergy and ESGEN. The
risks presented in such filings will be consistent with those that would be required for a public company in their SEC filings, including with respect to the business and securities of Sunergy and ESGEN and the proposed transactions between them,
and may differ significantly from, and be more extensive than, those presented below. Risks Related to the Solar Industry ◼ The solar energy industry is an emerging market which is constantly evolving and additional demand for solar energy
systems may not develop to the size or at the rate we expect. ◼ We face competition from electric utilities, retail electric providers, independent power producers and renewable energy companies. ◼ A material reduction in the retail
price of electricity charged by electric utilities or other retail electricity providers would harm our business, financial condition and results of operations. ◼ Sales and installation of solar energy systems depends heavily on suitable
meteorological and environmental conditions. If meteorological or environmental conditions are unexpectedly unfavorable, the electricity production from our solar service offerings may be below our expectations, and our ability to timely deploy new
systems may be adversely impacted. ◼ Climate change may have long-term impacts on our business, our industry, and the global economy. ◼ Our business has benefited from the declining cost of solar energy system and energy storage system
components and may be harmed to the extent the cost of such components stabilize or increase in the future. 43
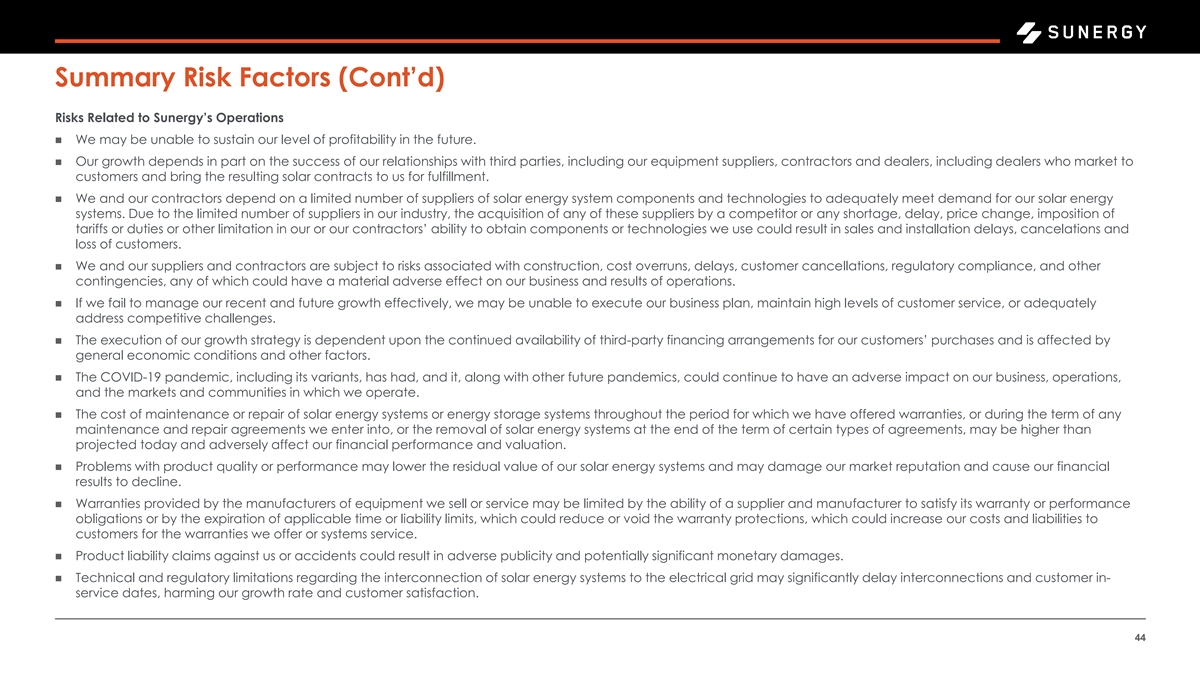
Summary Risk Factors (Cont’d) Risks Related to Sunergy’s
Operations ◼ We may be unable to sustain our level of profitability in the future. ◼ Our growth depends in part on the success of our relationships with third parties, including our equipment suppliers, contractors and dealers, including
dealers who market to customers and bring the resulting solar contracts to us for fulfillment. ◼ We and our contractors depend on a limited number of suppliers of solar energy system components and technologies to adequately meet demand for
our solar energy systems. Due to the limited number of suppliers in our industry, the acquisition of any of these suppliers by a competitor or any shortage, delay, price change, imposition of tariffs or duties or other limitation in our or our
contractors’ ability to obtain components or technologies we su lt us in e salcoul es and d re installation delays, cancelations and loss of customers. ◼ We and our suppliers and contractors are subject to risks associated with
construction, cost overruns, delays, customer cancellations, regulatory compliance, and other contingencies, any of which could have a material adverse effect on our business and results of operations. ◼ If we fail to manage our recent and
future growth effectively, we may be unable to execute our business plan, maintain high levels of customer service, or adequately address competitive challenges. ◼ The execution of our growth strategy is dependent upon the continued
availability of third-party financing arrangements for our customers’ purchases and is affected by general economic conditions and other factors. ◼ The COVID-19 pandemic, including its variants, has had, and it, along with other future
pandemics, could continue to have an adverse impact on our business, operations, and the markets and communities in which we operate. ◼ The cost of maintenance or repair of solar energy systems or energy storage systems throughout the period
for which we have offered warranties, or during the term of any maintenance and repair agreements we enter into, or the removal of solar energy systems at the end of the term of certain types of agreements, may be higher than projected today and
adversely affect our financial performance and valuation. ◼ Problems with product quality or performance may lower the residual value of our solar energy systems and may damage our market reputation and cause our financial results to decline.
◼ Warranties provided by the manufacturers of equipment we sell or service may be limited by the ability of a supplier and manufacturer to satisfy its warranty or performance obligations or by the expiration of applicable time or liability
limits, which could reduce or void the warranty protections, which could increase our costs and liabilities to customers for the warranties we offer or systems service. ◼ Product liability claims against us or accidents could result in adverse
publicity and potentially significant monetary damages. ◼ Technical and regulatory limitations regarding the interconnection of solar energy systems to the electrical grid may significantly delay interconnections and customer in- service
dates, harming our growth rate and customer satisfaction. 44
Summary Risk Factors (Cont’d) Risks Related to Sunergy’s
Operations (Cont’d) ◼ Our business is concentrated in certain markets, putting us at risk of region-specific disruptions, including hurricanes or other extreme weather events. ◼ Expansion into new sales channels could be costly and
time-consuming. As we enter new channels, we could be at a disadvantage relative to other companies who have more history in these spaces. ◼ Obtaining a sales contract with a potential customer does not guarantee that the potential customer
will not decide to cancel or that we will not need to cancel due to a failed inspection, which could cause us to generate no revenue despite incurring costs and adversely affect our results of operations. ◼ We may not realize the anticipated
benefits of past or future investments, strategic transactions, or acquisitions, and integration of these acquisitions may disrupt our business and management. ◼ Disruptions to our solar production metering and energy storage solutions could
negatively impact our revenue and increase our expenses. ◼ Our business may be harmed if we fail to properly protect our intellectual property, and we may also be required to defend against claims or indemnify others against claims that our
intellectual property infringes on the intellectual property rights of third parties. ◼ We rely substantially upon trade secret laws and contractual restrictions to protect our proprietary rights, and, if these rights are not sufficiently
protected, our ability to compete and generate revenue could suffer. ◼ We use “open source” software in our solutions, which may require that we release the source code of certain so toftware open so suurce bjectlicenses or subject
us to possible litigation or other actions that could adversely affect our business. ◼ Any security breach, unauthorized access or disclosure, or theft of data, including personal information, we, our third party service providers, and
suppliers gather, store, transmit, and use, or other hacking, cyber-attack, phishing attack, and unauthorized intrusions into or through our systems or those of our third party service providers, could harm our reputation, subject us to claims,
litigation, financial harm, and have an adverse impact on our business. ◼ Terrorist or cyberattacks against centralized utilities could adversely affect our business. ◼ We may be subject to information technology system failures or
network disruptions that could damage our business operations, financial conditions, or reputation. ◼ Our rebranding strategy and rebranding expected to follow the Business Combination will involve substantial costs and may not produce the
intended benefits if it is not favorably received by our customers. ◼ Damage to our brand and reputation or failure to expand our brand would harm our business and results of operations. ◼ The loss of one or more members of our senior
management or key personnel may adversely affect our operations. 45
Summary Risk Factors (Cont’d) Risks Related to Sunergy’s
Operations (Cont’d) ◼ A failure to hire and retain a sufficient number of employees and service providers in key functions would constrain our growth and our ability to timely complete customers’ projects and successfully manage
customer accounts. ◼ Regulators may limit the type of electricians qualified to install and service our solar and battery systems, or introduce other requirements on our installation other staff, which may result in workforce shortages,
operational delays, and increased costs. ◼ We have previously been, and may in the future be, subject to regulatory inquiries and litigation, all of which are costly, distracting to our core business and could result in an unfavorable outcome,
or a material adverse effect on our business, financial condition, results of operations, or the trading price of Sunergy’s securities. ◼ If we are unsuccessful in selling new service and products, including our add-on products, our
business, financial condition and results of operations could be adversely affected. ◼ Our operating results and our ability to grow may fluctuate from quarter to quarter and year to year, which could make our future performance difficult to
predict and could cause our operating results for a particular period to fall below expectations. ◼ We may be unable to generate sufficient cash flows or obtain access to external financing necessary to fund our operations and make adequate
capital investments as planned due to the general economic environment, cost inflation, and/or the market pressure driving down the average selling prices of our products and services, among other factors. ◼ Inflation could result in decreased
value from future contractual payments and higher expenses for labor and equipment, which, in turn, could adversely impact our reputation, business, financial condition, cash flows and results of operations. ◼ Volatility and increases or
fluctuations in interest rates raise our cost of capital and may adversely impact our business. ◼ We may incur debt in the future, which could introduce debt servicing costs and risks to our business. ◼ We have suppliers that are based
outside the United States, which may subject us to additional business risks, including logistical complexity and political instability. ◼ Our headquarters and other facilities, as well as the facilities of certain subcontractors and
suppliers, are located in regions that are subject to epidemics, earthquakes, floods, fires, and other natural disasters. 46
Summary Risk Factors (Cont’d) Risks Related to Regulation and Policy
◼ Our business currently depends on the availability of utility rebates, tax credits and other benefits, tax exemptions and exclusions, and other financial incentives on the federal, state, and/or local levels. We may be adversely affected by
changes in, and application of these laws or other incentives to us, and the expiration, elimination or reduction of these benefits could adversely impact our business. ◼ We rely on certain utility rate structures, such as net metering, to
offer competitive pricing to customers, and changes to those policies, may significantly reduce demand for electricity from our solar energy systems. ◼ Electric utility policies, statutes, and regulations and changes to such statutes or
regulations may present technical, regulatory and economic barriers to the purchase and use of our solar energy offerings that may significantly reduce demand for such offerings. ◼ We are not currently regulated as a utility under applicable
laws, but we may be subject to regulation as a utility in the future or become subject to new federal and state regulations for any additional solar service offerings we may introduce in the future. ◼ Changes to the applicable laws and
regulations governing direct-to-home sales and marketing may limit or restrict our ability to effectively compete. ◼ Increases in the cost or reduction in supply of solar energy system and energy storage system components due to tariffs or
trade restrictions imposed by the U.S. government could have an adverse effect on our business, financial condition and results of operations. ◼ Any failure to comply with laws and regulations relating to interactions by us or third parties
(such as our dealers and contractors) with customers or with licensing requirements applicable to our business could result in negative publicity, claims, investigations and litigation, and may adversely affect our financial performance. ◼
Compliance with environmental regulations can be expensive, and noncompliance with these regulations may result in adverse publicity and potentially significant monetary damages and fines. ◼ Our business is subject to complex and evolving U.S.
and international privacy and data protection laws, rules, policies and other obligations. Many of these laws and regulations are subject to change and uncertain interpretation and could result in claims, increased cost of operations or otherwise
harm our business. ◼ A failure to comply with laws and regulations relating to our interactions with employees, contractors, or dealers, could result in negative publicity, claims, investigations, and litigation, and adversely affect our
financial performance. ◼ Our ability to use our net operating loss carryforwards and certain other tax attributes may be limited. ◼ A change in our effective tax rate could have a significant adverse impact on our business, and an
adverse outcome resulting from examination of our income or other tax returns could adversely affect our results. 47

Summary Risk Factors (Cont’d) Risks Related to ESGEN and the
Business Combination ◼ An active trading market for the post-Business Combination Class A common stock, 0.0001 par value per share (the “Newco Stock”) Common , may not be available on a consistent basis to provide stockholders with
adequate liquidity. The price of the Newco Common Stock may be extremely volatile, and stockholders could lose a significant part of their investment. ◼ The Nasdaq or another national securities exchange may not list the Newco Common Stock or
other Newco securities on its exchange, which could limit investors’ ability to make transactions in the Newco Common Stock and subject to additional trading restrictions. ◼ The Business Combination may not be completed by ESGEN’s
business combination deadline in its organizational documents, ended as to date, am and ESGEN may fail to obtain an extension of the business combination deadline. ◼ ESGEN LLC (ESGEN’s “Sponsor”) and certain of ESGEN’s
other initial shareholders have entered into letter agreements n favo to r of vote the Busi i ness Combination, regardless of how ESGEN’s public shareholders vote. ◼ Since the initial shareholders of ESGEN, including our Sponsor and
ESGEN’s directors and executive officers, have hat are interes different, ts t or in addition to (and which may conflict with), the interests of ESGEN’s shareholders, conflicts of interest exist in determining whether the Busines atios n
Com with Sunergy bin is appropriate as our initial business combination. Such interests include that Sponsor, as well as ESGEN’s directors, will lose their entire respective ininve ESGEN stment if the s Business Combination or another business
combination is not completed. ◼ The ability of ESGEN’s public shareholders to exercise redemption rights with respect to the outstanding Class A resord , par val inary sha ue 0.0001 (“Class A ordinary shares”), of ESGEN could
increase the probability that the Business Combination will be unsuccessful. ◼ We and ESGEN expect to incur significant, non-recurring costs in connection with consummating the Business Combination and related transactions. ◼ The
Business Combination is subject to conditions, including certain conditions that may not be satisfied on a timely basis, if at all, which may adversely affect the price of the Class A ordinary shares. ◼ Past performance by ESGEN, including its
management team and affiliates, may not be indicative of future performance of an investment in ESGEN or the post-combination business. ◼ If ESGEN is unable to complete the Business Combination or another initial business combination by the
date by which it is required to consummate a business combination pursuant to ESGEN’s organizational documents, as such date may be extended from time to time, ESGEN will cease al except for l operations the purpose of winding up and ESGEN
will redeem the Class A ordinary shares and liquidate the trust account, in which case ESGEN’s public share onlhol y recei ders ve may approximately $10.00 per share and the public warrants will expire worthless ◼ The fairness opinion
obtained by ESGEN’s board of directors from its financial advisor will not be updated to refl inect circumstances changes between signing of the business combination agreement and the completion of the Business Combination. 48
Summary Risk Factors (Cont’d) Risk Relating to the Post-Business
Combination Company and its Common Stock ◼ We will incur increased costs as a result of operating as a public company, and our management will be required to devote substantial time to ensure compliance with public company responsibilities and
corporate governance practices. ◼ If we fail to maintain an effective system of disclosure controls and internal control over financial reporting, our ability to produce timely and accurate financial statements or comply with applicable
regulations could be impaired. ◼ If the Business Combination’s benefits do not meet the expectations of investors, stockholders or financial analys ketts,pri the ce of mar the Newco Common Stock may decline. ◼ Our quarterly
operating results may fluctuate significantly following the Business Combination. ◼ The price of the Newco Common Stock may be volatile and may decline. Unlike ESGEN, Newco will have no trust account to provide downside protection to its
investors. ◼ There is no guarantee that an active and liquid public market for the Newco Common Stock will develop following consummation of the Business Combination. ◼ If, following the Business Combination, securities or industry
analysts do not publish or cease publishing research or reports about us, our business, or our market, or if they change their recommendations regarding our common stock adversely, then the price and trading volume of our common stock could decline.
◼ Future resales of our outstanding shares may cause the market price of the Newco Common Stock or other securities to drop significantly, even if our business is doing well. ◼ A significant portion of our common stock following the
Business Combination will be restricted from immediate resale, but may be sold into the market in the future. This could cause the market price of the Newco Common Stock to drop significantly, even if our business is doing well. ◼ We may issue
some additional Newco Common Stock or other equity securities without shareholder approval in some circumstances, which would dilute post-Business Combination shareholders’ ownership interests and may depress the market price of Newco Common
Stock. ◼ Our Certificate of Incorporation that will be effective following the completion of the Business Combination will designate specific courts as the exclusive forum for certain litigation that may be initiated by our stockholders, which
could limit the ability of our stockholders to obtain a favorable judicial forum for disputes with us or with our directors, officers or employees and may discourage stockholders from bringing such claims. ◼ If we fail to comply with the
listing requirements of Nasdaq or another national securities exchange, we would face possible delisting, which would result in a limited public market for our securities and make obtaining future debt or equity financing more difficult for us.
◼ Because we will become a publicly traded company by means other than a traditional underwritten initial public offering, our post-Business Combination stockholders may face additional risks and uncertainties. ◼ We will be an
“emerging growth company” and a “smaller reporting company,” and if we take advantage of certain m exempti disclosure ons requ fro irements available to emerging growth companies, this could make our securities less
attractive to investors and may make it more difficult to compare our performance with other public companies. 49

50
ESGEN Acquisition (NASDAQ:ESACU)
Graphique Historique de l'Action
De Avr 2024 à Mai 2024

ESGEN Acquisition (NASDAQ:ESACU)
Graphique Historique de l'Action
De Mai 2023 à Mai 2024
