0001612630 False 0001612630 2023-09-13 2023-09-13 iso4217:USD xbrli:shares iso4217:USD xbrli:shares
UNITED STATES
SECURITIES AND EXCHANGE COMMISSION
Washington, D.C. 20549
_________________
FORM 8-K
_________________
CURRENT REPORT
Pursuant to Section 13 or 15(d)
of the Securities Exchange Act of 1934
Date of Report (Date of earliest event reported): September 13, 2023
_______________________________
The Joint Corp.
(Exact name of registrant as specified in its charter)
_______________________________
| Delaware | 001-36724 | 90-0544160 |
| (State or Other Jurisdiction of Incorporation) | (Commission File Number) | (I.R.S. Employer Identification No.) |
16767 N. Perimeter Drive, Suite 110
Scottsdale, Arizona 85260
(Address of Principal Executive Offices) (Zip Code)
(480) 245-5960
(Registrant's telephone number, including area code)
(Former name or former address, if changed since last report)
_______________________________
Check the appropriate box below if the Form 8-K filing is intended to simultaneously satisfy the filing obligation of the registrant under any of the following provisions:
| ☐ | Written communications pursuant to Rule 425 under the Securities Act (17 CFR 230.425) |
| ☐ | Soliciting material pursuant to Rule 14a-12 under the Exchange Act (17 CFR 240.14a-12) |
| ☐ | Pre-commencement communications pursuant to Rule 14d-2(b) under the Exchange Act (17 CFR 240.14d-2(b)) |
| ☐ | Pre-commencement communications pursuant to Rule 13e-4(c) under the Exchange Act (17 CFR 240.13e-4(c)) |
Securities registered pursuant to Section 12(b) of the Act:
| Title of each class | Trading Symbol(s) | Name of each exchange on which registered |
| Common Stock, $0.001 Par Value Per Share | JYNT | The NASDAQ Capital Market LLC |
Indicate by check mark whether the registrant is an emerging growth company as defined in Rule 405 of the Securities Act of 1933 (§230.405 of this chapter) or Rule 12b-2 of the Securities Exchange Act of 1934 (§240.12b-2 of this chapter).
Emerging growth company ☐
If an emerging growth company, indicate by check mark if the registrant has elected not to use the extended transition period for complying with any new or revised financial accounting standards provided pursuant to Section 13(a) of the Exchange Act. ☐
Item 2.02. Results of Operations and Financial Condition.
On September 13, 2023, The Joint Corp. (the “Company”) issued a press release announcing its preliminary financial results for the quarter ended June 30, 2023. The press release is furnished as Exhibit 99.1 to this Current Report on Form 8-K.
The information furnished in this Item 2.02 and Exhibit 99.1 shall not be deemed “filed” for purposes of Section 18 of the Securities Exchange Act of 1934, as amended (the “Exchange Act”), or otherwise subject to the liabilities of that section, nor shall it be incorporated by reference in any filing under the Securities Act of 1933, as amended, or the Exchange Act, except as expressly set forth by specific reference in such a filing.
Item 7.01. Regulation FD Disclosure.
The Company is posting an earnings presentation to its website at https://ir.thejoint.com/. A copy of the earnings presentation is being furnished herewith as Exhibit 99.2. The Company will use the earnings presentation during its earnings conference call on September 13, 2023 and also may use the earnings presentation from time to time in conversations with analysts, investors and others.
The information furnished in this Item 7.01 and Exhibit 99.2 shall not be deemed “filed” for purposes of Section 18 of the Exchange Act, or otherwise subject to the liabilities of that section, nor shall it be incorporated by reference in any filing under the Securities Act of 1933, as amended, or the Exchange Act, except as expressly set forth by specific reference in such a filing.
The information contained in Exhibit 99.2 is summary information that is intended to be considered in the context of the Company’s filings with the SEC. The Company undertakes no duty or obligation to publicly update or revise the information contained in this report, although it may do so from time to time as its management believes is warranted. Any such updating may be made through the filing of other reports or documents with the SEC, through press releases or through other public disclosure.
Item 9.01. Financial Statements and Exhibits.
SIGNATURE
Pursuant to the requirements of the Securities Exchange Act of 1934, the registrant has duly caused this report to be signed on its behalf by the undersigned hereunto duly authorized.
| | The Joint Corp. |
| | | |
| | | |
| Date: September 13, 2023 | By: | /s/ Peter D. Holt |
| | | Peter D. Holt |
| | | President and Chief Executive Officer |
| | | |
EXHIBIT 99.1
The Joint Corp. Reports Preliminary Second Quarter 2023 Financial Results
- Grew Q2 2023 Preliminary Revenue 18% and Preliminary Adjusted EBITDA 23% vs. Q2 2022 -
- Evaluating Programs to Cull Approximately 10% of the Corporate Portfolio -
SCOTTSDALE, Ariz., Sept. 13, 2023 (GLOBE NEWSWIRE) -- The Joint Corp. (NASDAQ: JYNT), a national operator, manager, and franchisor of chiropractic clinics, reported its preliminary financial results for the second quarter ended June 30, 2023.
Preliminary Financial Highlights: Q2 2023 Compared to Q2 2022
- Grew preliminary revenue 18% to $29.3 million.
- Reported preliminary operating loss of $375,000, compared to $1.3 million.
- Reported preliminary loss before income tax expense of $481,000, compared to $1.3 million.
- Increased system-wide sales1 by 13%, to $120.1 million.
- Reported system-wide comp sales2 of 5%.
- Reported preliminary Adjusted EBITDA of $3.2 million, compared to $2.6 million.
Q2 2023 Operating Highlights
- Sold 21 franchise licenses, compared to 17 in Q1 2023 and 24 in Q2 2022.
- Grew total clinic count to 890, 756 franchised and 134 company-owned or managed, up from 870 clinics at March 31, 2023.
- Opened 23 franchised clinics and three company-owned or managed greenfield clinics, for a total of 26 new clinics, as compared to 34 new clinics in Q2 2022.
- Closed four franchised clinics and two company-managed clinics, as compared to one franchised clinic in Q2 2022.
- Subsequent to quarter end through September 12, 2023, opened 19 franchised clinics and two greenfield clinics, bringing the total number of clinics opened to 911.
“Our system-wide sales, preliminary revenue, and preliminary Adjusted EBITDA grew in second quarter of 2023 compared to the prior year period, reflecting our ongoing franchise license sales, clinic openings, and new patient acquisition,” said Peter D. Holt, President and Chief Executive Officer of The Joint Corp. “Our team is dedicated to improving clinic performance and company profitability. To fuel greater increases in revenue and drive higher new patient acquisition counts, we are executing additional digital, automated and traditional marketing strategies. To lower our G&A expense run rate, we are implementing cost reduction efforts. And, to improve our bottom line, we are evaluating our corporate portfolio. As a first step, we expect to cull approximately 10% of our owned or managed clinics in accretive transactions. This strategy is supported by the chiropractic care market’s robust fundamentals. Pain remains an epidemic and continues to drive patients to natural, more holistic treatments. Americans are spending $19.5 billion annually on chiropractic care.”
Preliminary Financial Results for Second Quarter Ended June 30: 2023 Compared to 2022
Preliminary revenue was $29.3 million in the second quarter of 2023, compared to $24.9 million in the second quarter of 2022. The increase reflects a greater number of franchised and company-owned or managed clinics and continued organic growth. Preliminary cost of revenue was $2.6 million, compared to $2.3 million in the second quarter of 2022, reflecting the higher regional developer royalties and commissions associated with more franchised clinics.
Preliminary selling and marketing expenses were $4.7 million, up 23%, driven by the increase in advertising expenses from the larger number of clinics, an increase in local marketing expenditures by the company-owned or managed clinics, and the timing of the national marketing fund spend. Preliminary depreciation and amortization expenses increased 59% for the second quarter of 2023, as compared to the prior year period, primarily due to the increase in the number of greenfield clinics and the acquisition of franchised clinics.
Preliminary general and administrative expenses were $19.9 million, compared to $18.6 million in the second quarter of 2022, reflecting increases in costs to support clinic growth and in payroll to remain competitive in the tight labor market.
Preliminary loss from operations was $375,000, compared to $1.3 million in the second quarter of 2022. Preliminary loss before income tax expense as $481,000, compared to $1.3 million, in the second quarter of 2022.
Preliminary Adjusted EBITDA was $3.2 million, compared to $2.6 million in the second quarter of 2022. The company defines Adjusted EBITDA, a non-GAAP measure, as EBITDA before acquisition-related expenses, stock-based compensation expense, bargain purchase gain, net (gain)/loss on disposition or impairment, and other income related to employee retention credits. The company defines EBITDA as net income/(loss) before net interest, tax expense, depreciation, and amortization expenses.
Preliminary Financial Results for the Six Months Ended June 30: 2023 Compared to 2022
Preliminary revenue was $57.6 million in the first six months of 2023, compared to $47.1 million in the first six months of 2022. Preliminary net income before income tax expense was $2.7 million, compared to a preliminary net loss before income tax expense of $1.4 million, in the first six months of 2022. Preliminary Adjusted EBITDA was $5.3 million, compared to $4.4 million in the first six months of 2022.
Balance Sheet Liquidity
Unrestricted cash was $13.6 million at June 30, 2023, compared to $9.7 million at December 31, 2022. During the first half of 2023, cash provided by operating activities was $7.5 million, including the receipt of $4.8 million in employee retention credits, partially offset by investing $3.8 million in the development of greenfield clinics, improvements of existing clinics and the acquisition of a previously owned franchised clinics.
Preliminary 2023 Guidance
For 2023, management is providing preliminary amended financial guidance to reflect the preliminary second quarter financial results, new accounting procedures, current economic environment, and other factors. The company reiterated the clinic opening guidance.
- Revenue is now expected to be between $115.0 million and $118.0 million, compared to $101.9 million in 2022. Previous revenue guidance was between $123.0 million and $128.0 million.
- Adjusted EBITDA is now expected to be between $11.0 million and $12.5 million, compared to $11.5 million in 2022. Previous adjusted EBITDA guidance was between $12.5 million and $14.0 million.
- Franchised clinic openings are expected to be between 100 and 120, compared to 121 in 2022.
- Company-owned or managed greenfield clinic openings are expected to be between 8 and 12, compared to 16 in 2022.
Conference Call
The Joint Corp. management will host a conference call at 5:00 p.m. ET on Wednesday, September 13, 2023 to discuss the preliminary second quarter 2023 financial results. Shareholders and interested participants may listen to a live broadcast of the conference call by dialing (833) 630-0823 or (412) 317-1831 and ask to be joined into the ‘The Joint’ call approximately 15 minutes prior to the start time.
The live webcast of the call with accompanying slide presentation can be accessed in the IR events section https://ir.thejoint.com/events and will be available for approximately one year. An audio archive can be accessed for one week by dialing (877) 344-7529 or (412) 317-0088 and entering conference ID 9703868.
Commonly Discussed Performance Metrics
This release includes a presentation of commonly discussed performance metrics. System-wide sales include revenues at all clinics, whether operated by the company or by franchisees. While franchise sales are not recorded as revenues by the company, management believes the information is important in understanding the company’s financial performance, because these sales are the basis on which the company calculates and records royalty fees and are indicative of the financial health of the franchisee base. Comp sales include the revenues from both company-owned or managed clinics and franchised clinics that in each case have been open at least 13 full months and exclude any clinics that have closed.
Non-GAAP Financial Information; Preliminary Nature of Results
This release includes a presentation of non-GAAP financial measures. EBITDA and Adjusted EBITDA are presented because they are important measures used by management to assess financial performance, as management believes they provide a more transparent view of the company’s underlying operating performance and operating trends. Reconciliation of net income/(loss) to EBITDA and Adjusted EBITDA is presented in the table below. The company defines EBITDA as net income/(loss) before net interest, tax expense, depreciation, and amortization expenses. The company defines Adjusted EBITDA as EBITDA before acquisition-related expenses, bargain purchase gain, net (gain)/loss on disposition or impairment, stock-based compensation expenses, and other income related to employee retention credits.
EBITDA and Adjusted EBITDA do not represent and should not be considered alternatives to net income or cash flows from operations, as determined by accounting principles generally accepted in the United States, or GAAP. While EBITDA and Adjusted EBITDA are used as measures of financial performance and the ability to meet debt service requirements, they are not necessarily comparable to other similarly titled captions of other companies due to potential inconsistencies in the methods of calculation. EBITDA and Adjusted EBITDA should be reviewed in conjunction with the company’s financial statements filed with the SEC.
While the Company believes the preliminary results reported herein to be accurate, there can be no assurance that final reported results following the completion of the Company’s previously announced restatement and quarterly review by the Company’s independent auditors will not vary from those stated herein.
Forward-Looking Statements
This press release contains statements about future events and expectations that constitute forward-looking statements. Forward-looking statements are based on our beliefs, assumptions and expectations of industry trends, our future financial and operating performance and our growth plans, taking into account the information currently available to us. These statements are not statements of historical fact. Forward-looking statements involve risks and uncertainties that may cause our actual results to differ materially from the expectations of future results we express or imply in any forward-looking statements, and you should not place undue reliance on such statements. Factors that could contribute to these differences include, but are not limited to, our preliminary results differing from final results, possible negative effects of the restatement of our financial statements for 2021 and 2022 on our financial position, results of operations and cash flows, increases in our borrowing costs under our credit facility, given that borrowings under the credit facility bear interest at rates tied to certain rising benchmark interest rates; state laws limiting the use our business model, including prohibitions on advance payment for chiropractic services, which recently caused us to elect not to offer franchises in South Dakota and Wyoming; increased costs to comply with a new SEC reporting rule enhancing and standardizing disclosures regarding cybersecurity incidents and cybersecurity risk management, inability to identify and recruit enough qualified chiropractors and other personnel to staff our clinics, due in part to the nationwide labor shortage, an increase in operating expenses due to measures we may need to take to address such shortage, inflation, exacerbated by COVID-19 and the current war in Ukraine, which has increased our costs and which could otherwise negatively impact our business, the potential for further disruption to our operations and the unpredictable impact on our business of the COVID-19 outbreak and outbreaks of other contagious diseases, our failure to develop or acquire company-owned or managed clinics as rapidly as we intend, our failure to profitably operate company-owned or managed clinics, short-selling strategies and negative opinions posted on the internet which could drive down the market price of our common stock and result in class action lawsuits, our failure to remediate any material weaknesses in our internal control over financial reporting, which could negatively impact our ability to accurately report our financial results, prevent fraud, or maintain investor confidence, and other factors described in our filings with the SEC, including in the section entitled “Risk Factors” in our Annual Report on Form 10-K for the year ended December 31, 2022 filed with the SEC on March 10, 2023 and subsequently-filed current and quarterly reports. Words such as, "anticipates," "believes," "continues," "estimates," "expects," "goal," "objectives," "intends," "may," "opportunity," "plans," "potential," "near-term," "long-term," "projections," "assumptions," "projects," "guidance," "forecasts," "outlook," "target," "trends," "should," "could," "would," "will," and similar expressions are intended to identify such forward-looking statements. We qualify any forward-looking statements entirely by these cautionary factors. We assume no obligation to update or revise any forward-looking statements for any reason or to update the reasons actual results could differ materially from those anticipated in these forward-looking statements, even if new information becomes available in the future. Comparisons of results for current and any prior periods are not intended to express any future trends or indications of future performance, unless expressed as such, and should only be viewed as historical data.
Management will be disclosing in our Form 10-K/A that our management concluded that our internal controls over financial reporting were not effective as of December 31, 2021 and 2022. The details of this material weakness will be provided in our upcoming 10-K/A filing. We have undertaken remediation measures to address the material weakness, which we expect will be completed prior to the end of fiscal year 2022.
About The Joint Corp. (NASDAQ: JYNT)
The Joint Corp. (NASDAQ: JYNT) revolutionized access to chiropractic care when it introduced its retail healthcare business model in 2010. Today, it is the nation's largest operator, manager and franchisor of chiropractic clinics through The Joint Chiropractic network. The company is making quality care convenient and affordable, while eliminating the need for insurance, for millions of patients seeking pain relief and ongoing wellness. With more than 900 locations nationwide and over 12 million patient visits annually, The Joint Chiropractic is a key leader in the chiropractic industry. Consistently named to Franchise Times “Top 500+ Franchises” and Entrepreneur’s “Franchise 500” lists and recognized by FRANdata with the TopFUND award, as well as Franchise Business Review’s “Top Franchise for 2023,” “Most Profitable Franchises” and “Top Franchises for Veterans” ranking, The Joint Chiropractic is an innovative force, where healthcare meets retail.
For more information, visit www.thejoint.com. To learn about franchise opportunities, visit www.thejointfranchise.com.
Business Structure
The Joint Corp. is a franchisor of clinics and an operator of clinics in certain states. In Arkansas, California, Colorado, District of Columbia, Florida, Illinois, Kansas, Kentucky, Maryland, Michigan, Minnesota, New Jersey, New York, North Carolina, Oregon, Pennsylvania, Rhode Island, South Dakota, Tennessee, Washington, West Virginia and Wyoming, The Joint Corp. and its franchisees provide management services to affiliated professional chiropractic practices.
Media Contact: Margie Wojciechowski, The Joint Corp., margie.wojciechowski@thejoint.com
Investor Contact: Kirsten Chapman, LHA Investor Relations, 415-433-3777, thejoint@lhai.com
– Preliminary Financial Tables Follow –
| |
THE JOINT CORP. AND SUBSIDIARY AND AFFILIATES
|
PRELIMINARY CONDENSED CONSOLIDATED BALANCE SHEETS
|
(unaudited)
|
| |
| | June 30, 2023 | | Dec. 31, 2022 |
| ASSETS | (unaudited) | | (as restated, unaudited) |
| Current assets: | | | |
| Cash and cash equivalents | $ | 13,602,515 | | | $ | 9,745,066 | |
| Restricted cash | | 848,831 | | | | 805,351 | |
| Accounts receivable, net | | 3,534,828 | | | | 3,911,272 | |
| Deferred franchise and regional development costs, current portion | | 1,058,704 | | | | 1,054,060 | |
| Prepaid expenses and other current assets | | 3,306,964 | | | | 2,098,359 | |
| Assets held for sale | | 215,722 | | | | — | |
| Total current assets | | 22,567,564 | | | | 17,614,108 | |
| Property and equipment, net | | 17,627,933 | | | | 17,475,152 | |
| Operating lease right-of-use asset | | 22,641,632 | | | | 20,587,199 | |
| Deferred franchise and regional development costs, net of current portion | | 5,605,760 | | | | 5,707,678 | |
| Intangible assets, net | | 10,050,360 | | | | 10,928,295 | |
| Goodwill | | 8,493,407 | | | | 8,493,407 | |
| Deferred tax assets | | 11,591,955 | | | | 11,928,152 | |
| Deposits and other assets | | 768,943 | | | | 756,386 | |
| Total assets | $ | 99,347,554 | | | $ | 93,490,377 | |
| | | | |
| LIABILITIES AND STOCKHOLDERS' EQUITY | | | |
| Current liabilities: | | | |
| Accounts payable | $ | 1,576,085 | | | $ | 2,966,589 | |
| Accrued expenses | | 2,342,744 | | | | 1,069,610 | |
| Co-op funds liability | | 848,832 | | | | 805,351 | |
| Payroll liabilities ($0.6 million and $0.6 million attributable to VIE) | | 2,845,800 | | | | 2,030,510 | |
| Operating lease liability, current portion | | 5,880,954 | | | | 5,295,830 | |
| Finance lease liability, current portion | | 24,956 | | | | 24,433 | |
| Deferred franchise fee revenue, current portion | | 2,503,294 | | | | 2,468,601 | |
| Deferred revenue from company clinics ($5.0 million and $4.7 million attributable to VIE) | | 7,689,448 | | | | 7,471,549 | |
| Upfront Regional Developer Fees, current portion | | 406,965 | | | | 487,250 | |
| Other current liabilities | | 704,278 | | | | 597,294 | |
| Liabilities to be disposed of | | 155,622 | | | | — | |
| Total current liabilities | | 24,978,978 | | | | 23,217,017 | |
| Operating lease liability, net of current portion | | 20,029,654 | | | | 18,672,719 | |
| Finance lease liability, net of current portion | | 50,896 | | | | 63,507 | |
| Debt under the Credit Agreement | | 2,000,000 | | | | 2,000,000 | |
| Deferred franchise revenue, net of current portion | | 14,210,441 | | | | 14,161,134 | |
| Upfront Regional Developer Fees, net of current portion | | 1,183,106 | | | | 1,500,278 | |
| Other liabilities | | 1,287,879 | | | | 1,287,879 | |
| Total liabilities | | 63,740,954 | | | | 60,902,534 | |
| Commitments and contingencies | | | |
| Stockholders' equity: | | | |
| Series A preferred stock, $0.001 par value; 50,000 shares authorized, 0 issued and outstanding, as of June 30, 2023 and December 31, 2022 | | — | | | | — | |
| Common stock, $0.001 par value; 20,000,000 shares authorized, 14,772,520 shares issued and 14,740,485 shares outstanding as of June 30, 2023 and 14,560,353 shares issued and 14,528,487 outstanding as of December 31, 2022 | | 14,772 | | | | 14,560 | |
| Additional paid-in capital | | 46,443,706 | | | | 45,558,305 | |
| Treasury stock 32,035 shares as of June 30, 2023 and 31,866 shares as of December 31, 2022, at cost | | (859,279 | ) | | | (856,642 | ) |
| Accumulated deficit | | (10,017,599 | ) | | | (12,153,380 | ) |
| Total The Joint Corp. stockholders' equity | | 35,581,600 | | | | 32,562,843 | |
| Non-controlling Interest | | 25,000 | | | | 25,000 | |
| Total equity | | 35,606,600 | | | | 32,587,843 | |
| Total liabilities and stockholders' equity | $ | 99,347,554 | | | $ | 93,490,377 | |
| |
THE JOINT CORP. AND SUBSIDIARY AND AFFILIATES
|
PRELIMINARY CONDENSED CONSOLIDATED INCOME STATEMENTS
|
(unaudited)
|
| |
| | Three Months Ended | | Six Months Ended |
| | June 30, | | June 30, |
| | | 2023 | | | | 2022 | | | | 2023 | | | | 2022 | |
| | (unaudited) | | (as restated, unaudited) | | (unaudited) | | (as restated, unaudited) |
| Revenues: | | | | | | | |
| Revenues from company-owned or managed clinics | $ | 17,802,838 | | | $ | 14,492,972 | | | $ | 34,930,795 | | | $ | 27,099,971 | |
| Royalty fees | | 7,172,159 | | | | 6,411,214 | | | | 14,038,182 | | | | 12,420,146 | |
| Franchise fees | | 671,368 | | | | 686,886 | | | | 1,425,794 | | | | 1,327,851 | |
| Advertising fund revenue | | 2,041,050 | | | | 1,825,757 | | | | 3,993,455 | | | | 3,536,474 | |
| Software fees | | 1,234,812 | | | | 1,099,981 | | | | 2,444,817 | | | | 2,056,979 | |
| Regional developer fees | | — | | | | — | | | | — | | | | — | |
| Other revenues | | 384,957 | | | | 370,555 | | | | 774,962 | | | | 682,695 | |
| Total revenues | | 29,307,184 | | | | 24,887,365 | | | | 57,608,005 | | | | 47,124,116 | |
| Cost of revenues: | | | | | | | |
| Franchise and regional development cost of revenues | | 2,236,442 | | | | 1,904,936 | | | | 4,377,277 | | | | 3,705,961 | |
| IT cost of revenues | | 359,070 | | | | 352,156 | | | | 692,920 | | | | 662,115 | |
| Total cost of revenues | | 2,595,512 | | | | 2,257,092 | | | | 5,070,197 | | | | 4,368,076 | |
| Selling and marketing expenses | | 4,707,818 | | | | 3,839,724 | | | | 8,868,062 | | | | 7,127,212 | |
| Depreciation and amortization | | 2,329,267 | | | | 1,461,870 | | | | 4,544,322 | | | | 2,798,527 | |
| General and administrative expenses | | 19,904,796 | | | | 18,570,301 | | | | 39,943,272 | | | | 34,103,726 | |
| Total selling, general and administrative expenses | | 26,941,881 | | | | 23,871,895 | | | | 53,355,656 | | | | 44,029,465 | |
| Net loss on disposition or impairment | | 144,345 | | | | 88,844 | | | | 209,815 | | | | 95,749 | |
| Loss from operations | | (374,554 | ) | | | (1,330,466 | ) | | | (1,027,663 | ) | | | (1,369,174 | ) |
| Other income (expense), net | | (106,520 | ) | | | (19,286 | ) | | | 3,714,642 | | | | (35,434 | ) |
| (Loss) income before income tax expense | | (481,074 | ) | | | (1,349,752 | ) | | | 2,686,979 | | | | (1,404,608 | ) |
| Income tax (benefit) expense | | (290,691 | ) | | | (474,931 | ) | | | 551,198 | | | | (512,682 | ) |
| Net (loss) income | $ | (190,383 | ) | | $ | (874,821 | ) | | $ | 2,135,781 | | | $ | (891,926 | ) |
| Earnings per share: | | | | | | | |
| Basic earnings per share | $ | (0.01 | ) | | $ | (0.06 | ) | | $ | 0.15 | | | $ | (0.06 | ) |
| Diluted earnings per share | $ | (0.01 | ) | | $ | (0.06 | ) | | $ | 0.14 | | | $ | (0.06 | ) |
| Basic weighted average shares | | 14,684,035 | | | | 14,475,825 | | | | 14,625,435 | | | | 14,454,738 | |
| Diluted weighted average shares | | 14,952,363 | | | | 14,842,816 | | | | 14,907,593 | | | | 14,887,238 | |
| |
THE JOINT CORP. AND SUBSIDIARY AND AFFILIATES
|
PRELIMINARY CONDENSED CONSOLIDATED STATEMENTS OF CASH FLOWS
|
(unaudited)
|
| |
| | Six Months Ended |
| | June 30, |
| | | 2023 | | | | 2022 | |
| | (unaudited) | | (as restated, unaudited) |
| Cash flows from operating activities: | | | |
| Net income (loss) | $ | 2,135,781 | | | $ | (891,926 | ) |
| Adjustments to reconcile net income to net cash provided by operating activities: | | | |
| Depreciation and amortization | | 4,544,322 | | | | 2,798,527 | |
| Net loss on disposition or impairment | | 209,815 | | | | 95,749 | |
| Net franchise fees recognized upon termination of franchise agreements | | (20,050 | ) | | | (15,218 | ) |
| Deferred income taxes | | 336,197 | | | | (807,805 | ) |
| Stock based compensation expense | | 683,227 | | | | 663,747 | |
| Changes in operating assets and liabilities, net of acquisitions: | | | |
| Accounts receivable | | 376,444 | | | | 140,324 | |
| Prepaid expenses and other current assets | | (1,208,605 | ) | | | (267,159 | ) |
| Deferred franchise costs | | 51,268 | | | | (193,784 | ) |
| Deposits and other assets | | (12,557 | ) | | | (132,379 | ) |
| Accounts payable | | (1,440,375 | ) | | | (397,040 | ) |
| Accrued expenses | | 1,104,369 | | | | (823,079 | ) |
| Payroll liabilities | | 815,290 | | | | (2,043,788 | ) |
| Deferred revenue | | 245,363 | | | | 864,213 | |
| Upfront regional developer fees | | (397,457 | ) | | | (824,658 | ) |
| Other liabilities | | 70,110 | | | | 649,436 | |
| Net cash provided by operating activities | | 7,493,142 | | | | (1,184,840 | ) |
| | | | |
| Cash flows from investing activities: | | | |
| Acquisition of AZ clinics | | — | | | | (5,600,000 | ) |
| Acquisition of CA clinics | | (1,050,000 | ) | | | — | |
| Purchase of property and equipment | | (2,729,875 | ) | | | (3,164,961 | ) |
| Net cash used in investing activities | | (3,779,875 | ) | | | (8,764,961 | ) |
| | | | |
| Cash flows from financing activities: | | | |
| Payments of finance lease obligation | | (12,087 | ) | | | (38,022 | ) |
| Purchases of treasury stock under employee stock plans | | (2,637 | ) | | | (2,598 | ) |
| Proceeds from exercise of stock options | | 202,386 | | | | 113,673 | |
| Net cash provided by financing activities | | 187,662 | | | | 73,053 | |
| | | | |
| Increase (decrease) in cash, cash equivalents and restricted cash | | 3,900,929 | | | | (9,876,748 | ) |
| Cash, cash equivalents and restricted cash, beginning of period | | 10,550,417 | | | | 19,912,338 | |
| Cash, cash equivalents and restricted cash, end of period | $ | 14,451,346 | | | $ | 10,035,590 | |
| | | | |
| | June 30, | | June 30, |
| Reconciliation of cash, cash equivalents and restricted cash: | 2023 | | 2022 |
| Cash and cash equivalents | $ | 13,602,515 | | | $ | 9,370,611 | |
| Restricted cash | | 848,831 | | | | 664,979 | |
| | $ | 14,451,346 | | | $ | 10,035,590 | |
| |
THE JOINT CORP. AND SUBSIDIARY AND AFFILIATES
|
PRELIMINARY RECONCILIATION FOR GAAP TO NON-GAAP
|
| (unaudited) |
| |
| | Three Months Ended June 30, | | Six Months Ended June 30, |
| | | 2023 | | | | 2022 | | | | 2023 | | | | 2022 | |
| | (unaudited) | | (as restated, unaudited) | | (unaudited) | | (as restated, unaudited) |
| Non-GAAP Financial Data: | | | | | | | |
| Net (loss) income | $ | (190,383 | ) | | $ | (874,821 | ) | | $ | 2,135,781 | | | $ | (891,926 | ) |
| Net interest expense | | 14,937 | | | | 19,286 | | | | 64,661 | | | | 35,433 | |
| Depreciation and amortization expense | | 2,329,267 | | | | 1,461,870 | | | | 4,544,322 | | | | 2,798,527 | |
| Tax expense (benefit) | | (290,691 | ) | | | (474,931 | ) | | | 551,198 | | | | (512,682 | ) |
| EBITDA | | 1,863,130 | | | | 131,404 | | | | 7,295,962 | | | | 1,429,352 | |
| Stock compensation expense | | 417,017 | | | | 340,191 | | | | 683,227 | | | | 663,747 | |
| Acquisition related expenses | | 716,299 | | | | 2,074,153 | | | | 857,992 | | | | 2,228,668 | |
| Loss on disposition or impairment | | 144,345 | | | | 88,844 | | | | 209,815 | | | | 95,749 | |
| Other (income), net | | 91,583 | | | | — | | | | (3,779,304 | ) | | | — | |
| Adjusted EBITDA | $ | 3,232,374 | | | $ | 2,634,592 | | | $ | 5,267,692 | | | $ | 4,417,516 | |
1 System-wide sales include revenues at all clinics, whether operated or managed by the company or by franchisees. While franchised sales are not recorded as revenues by the company, management believes the information is important in understanding the company’s financial performance, because these revenues are the basis on which the company calculates and records royalty fees and are indicative of the financial health of the franchisee base.
2 Comp sales include the revenues from both company-owned or managed clinics and franchised clinics that in each case have been open at least 13 full months and exclude any clinics that have closed.
Exhibit 99.2

Preliminary Q2 2023 Investor Presentation As of June 30, 2023 | Reported on September 13, 2023 The Joint Corp. | NASDAQ: JYNT | thejoint.com

Safe Harbor Statements © 2023 The Joint Corp. All Rights Reserved. 2 Certain statements contained in this presentation are "forward - looking statements” about future events and expectations. Forward - looking statements are based on our beliefs, assumptions and expectations of industry trends, our future financial and operating performance and our growth plans, taking into account the information currently available to us. These statements are not statements of historical fact. Forward - looking statements involve risks and uncertainties that may cause our actual results to differ materially from the expectations of future results we express or imply in any forward - looking statements, and you should not place undue reliance on such statements. Factors that could contribute to these differences include, but are not limited to, our preliminary results differing from final results, possible negative effects of the restatement of our financial statements for 2021 and 2022 on our financial position, results of operations and cash flows, increases in our borrowing costs under our credit facility, given that borrowings under the credit facility bear interest at rates tied to certain rising benchmark interest rates; state laws limiting the use our business model, including prohibitions on advance payment for chiropractic services, which recently caused us to elect not to offer franchises in South Dakota and Wyoming; increased costs to comply with a new SEC reporting rule enhancing and standardizing disclosures regarding cybersecurity incidents and cybersecurity risk management, inability to identify and recruit enough qualified chiropractors and other personnel to staff our clinics, due in part to the nationwide labor shortage, an increase in operating expenses due to measures we may need to take to address such shortage, inflation, exacerbated by COVID - 19 and the current war in Ukraine, which has increased our costs and which could otherwise negatively impact our business, the potential for further disruption to our operations and the unpredictable impact on our business of the COVID - 19 outbreak and outbreaks of other contagious diseases, our failure to develop or acquire company - owned or managed clinics as rapidly as we intend, our failure to profitably operate company - owned or managed clinics, short - selling strategies and negative opinions posted on the internet which could drive down the market price of our common stock and result in class action lawsuits, our failure to remediate any material weaknesses in our internal control over financial reporting, which could negatively impact our ability to accurately report our financial results, prevent fraud, or maintain investor confidence, and other factors described in our filings with the SEC, including in the section entitled “Risk Factors” in our Annual Report on Form 10 - K for the year ended December 31, 2022 filed with the SEC on March 10, 2023 and subsequently - filed current and quarterly reports. Words such as, "anticipates," "believes," "continues," "estimates," "expects," "goal," "objectives," "intends," "may," "opportunity," "plans," "potential," "near - term," "long - term," "projections," "assumptions," "projects," "guidance," "forecasts," "outlook," "target," "trends," "should," "could," "would," "will," and similar expressions are intended to identify such forward - looking statements. We qualify any forward - looking statements entirely by these cautionary factors. We assume no obligation to update or revise any forward - looking statements for any reason or to update the reasons actual results could differ materially from those anticipated in these forward - looking statements, even if new information becomes available in the future. Comparisons of results for current and any prior periods are not intended to express any future trends or indications of future performance, unless expressed as such, and should only be viewed as historical data. Business Structure The Joint Corp. is a franchisor of clinics and an operator of clinics in certain states. In Arkansas, California, Colorado, District of Columbia, Florida, Illinois, Kansas, Kentucky, Maryland, Michigan, Minnesota, New Jersey, New York, North Carolina, Oregon, Pennsylvania, Rhode Island, South Dakota, Tennessee, Washington, West Virginia and Wyoming, The Joint Corp. and its franchisees provide management services to affiliated professional chiropractic practices.

OUR MODEL © 2023 The Joint Corp. All Rights Reserved. 3 Quality, convenient, affordable chiropractic care in a retail setting

OUR STAFF Serving patients seeking pain relief and ongoing health and wellness © 2023 The Joint Corp. All Rights Reserved. 4
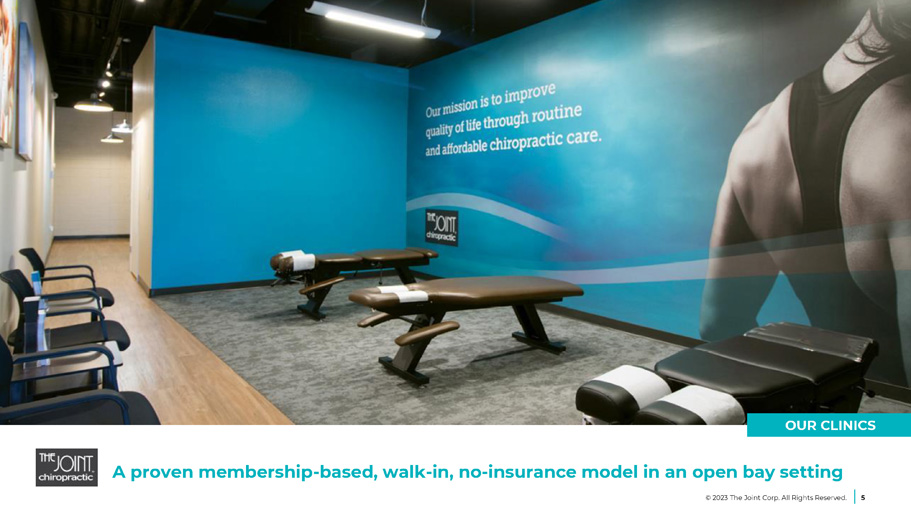
OUR CLINICS A proven membership - based, walk - in, no - insurance model in an open bay setting © 2023 The Joint Corp. All Rights Reserved. 5

Strong Operational KPIs 6 1 New patient survey completed early 2023. 1.6M unique patients treated in 2022 845K new patients in 2022 12.2M adjustments in 2022 34% of new patients were new to chiropractic 1 84% system - wide gross sales from monthly memberships in 2022 Up from 1.4M in 2021 ~287K patients in 2022 had never been to a chiropractor before Compared to 807K in 2021 Up from 10.9M in 2021 Compared to 85% in 2021 © 2023 The Joint Corp. All Rights Reserved.

Upside for Future Growth $19.5B growing chiropractic market 1 7 50% of Americans don’t know what the word “chiropractic” means 16% saw a chiropractor in the last 12 months 30% understand chiropractic but are scared Gallup - Palmer College of Chiropractic Report 2017 Gallup - Palmer College of Chiropractic Report 2018 Nucleus Marketing Lab 2018 1 IBIS US Industry Report, Chiropractors in the US, March 2022 © 2023 The Joint Corp. All Rights Reserved.

Substantial Opportunity for Market Share Growth 1 JAMA US Healthcare spending by Payer and Health Condition, 1996 - 2016, March 2020| 2 IBIS US Industry Report, Chiropractors in the US, March 2022 | 3 Internal Chiropractic Competitive Analysis, August 2019 | 4 Apex Reimbursement Specialists, Inc., 2018 | 5 American Chiropractic Asso c i a t i o © n 2 0 23 The Joint Corp. All Rights Reserved. 8 • $134B annual spending on back pain 1 • $19.5B annual spending on chiropractic care 2 • ~4% of chiropractic offered at chains 3 vs. ~12% for dentistry chains (DSOs) 4 • 80% of Americans experience back pain at least once in their lifetime 5 The Joint Chiropractic 2022 $435M, ~2% Other Chains 3 $350M, ~2% Independents $18.7B, ~96%
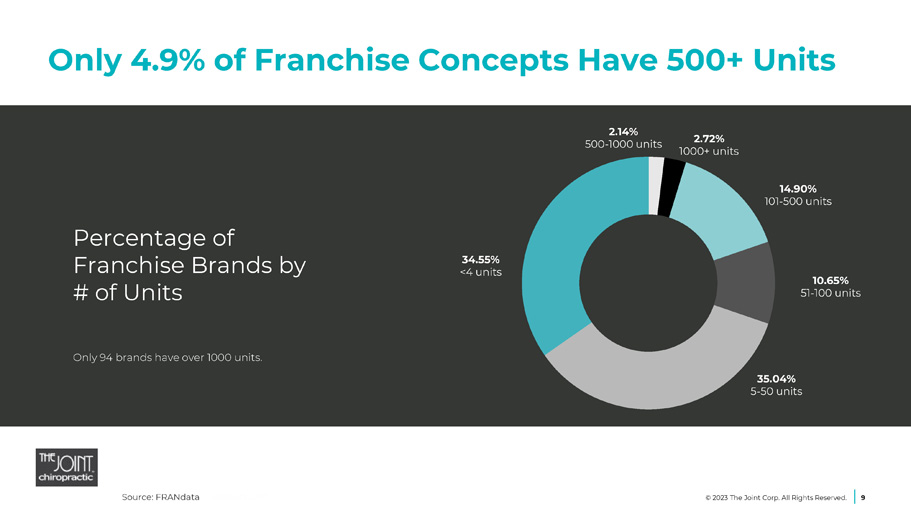
Only 4.9% of Franchise Concepts Have 500+ Units © 2023 The Joint Corp. All Rights Reserved. 9 Source: FRANdata Percentage of Franchise Brands by # of Units Only 94 brands have over 1000 units. 2.14% 500 - 1000 units 2.72% 1000+ units 14.90% 101 - 500 units 10.65% 51 - 100 units 35.04% 5 - 50 units 34.55% <4 units
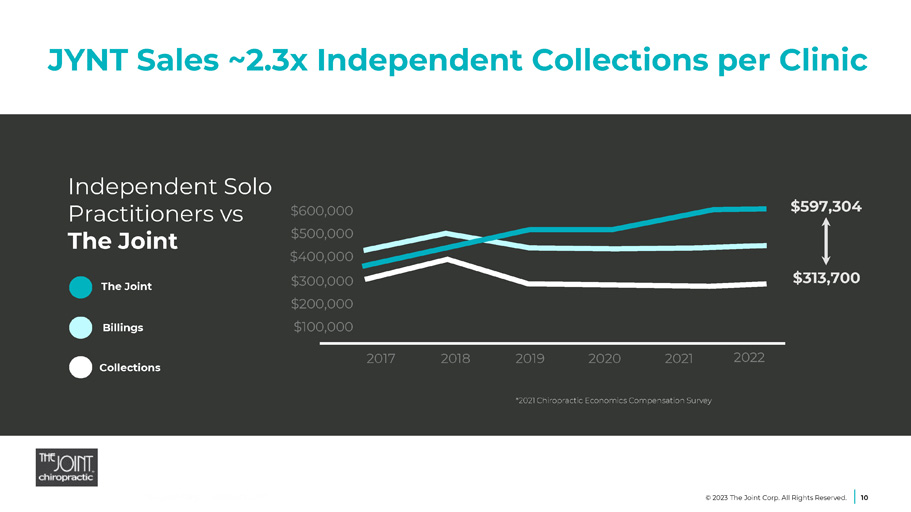
JYNT Sales ~2.3x Independent Collections per Clinic Independent Solo Practitioners vs The Joint The Joint Billings Collections *2021 Chiropractic Economics Compensation Survey $600,000 $500,000 $400,000 $300,000 $200,000 $100,000 2017 2018 2019 2020 2021 $597,304 $313,700 2022 © 2023 The Joint Corp. All Rights Reserved. 10
Top Franchise Recognition... Again © 2023 The Joint Corp. All Rights Reserved. 11
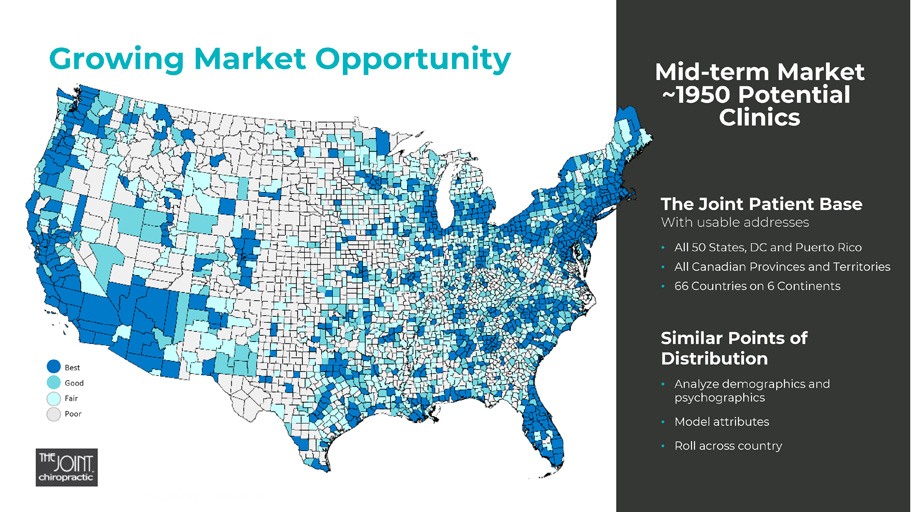
Best Good Fair Poor The Joint Patient Base With usable addresses • All 50 States, DC and Puerto Rico • All Canadian Provinces and Territories • 66 Countries on 6 Continents Similar Points of Distribution • Analyze demographics and psychographics • Model attributes • Roll across country Mid - term Market ~1950 Potential Clinics Growing Market Opportunity
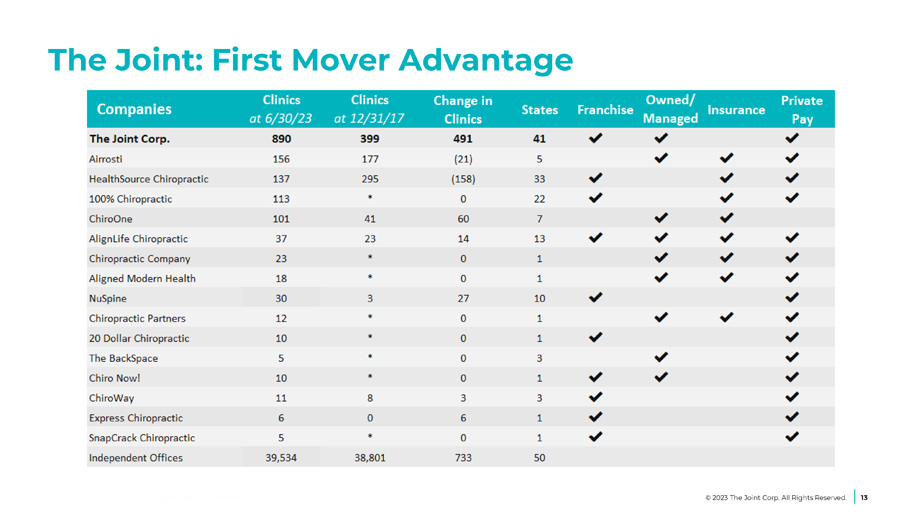
The Joint: First Mover Advantage 13 © 2023 The Joint Corp. All Rights Reserved.

© 2023 The Joint Corp. All Rights Reserved. 14 26 New Clinics in Q2 2023 Q2 2022 Q2 2023 24 21 Franchise Licenses Sold 31 23 Total New Franchised Clinics Opened 3 3 Greenfield Clinics Opened 4 3 Franchised Clinics Acquired 270 214 Clinics in Development 12 26 82 175 242 265 309 352 394 453 515 610 712 756 4 47 61 47 48 60 64 96 126 134 TOTAL CLINICS OPEN 1 Franchise Company Owned/Managed 1 In Q2 2023, The Joint closed four franchised clinics and two corporate - owned or managed clinics. In Q2 2022, The Joint closed one franchised clinics. The closure rate remains one of the lowest in the franchise community at less than 1 percent. 370 399 442 513 312 246 579 706 838 890
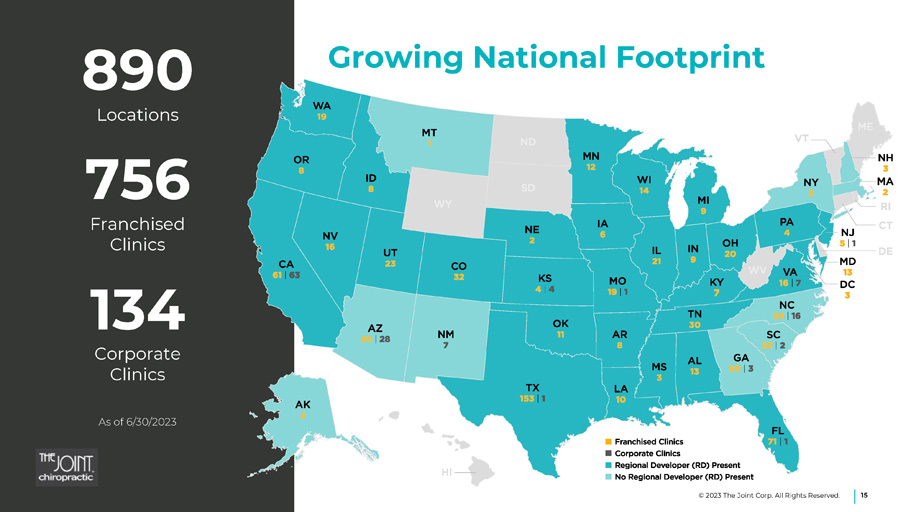
15 890 Locations 756 Franchised Clinics 134 Corporate Clinics Growing National Footprint As of 6/30/2023 © 2023 The Joint Corp. All Rights Reserved.
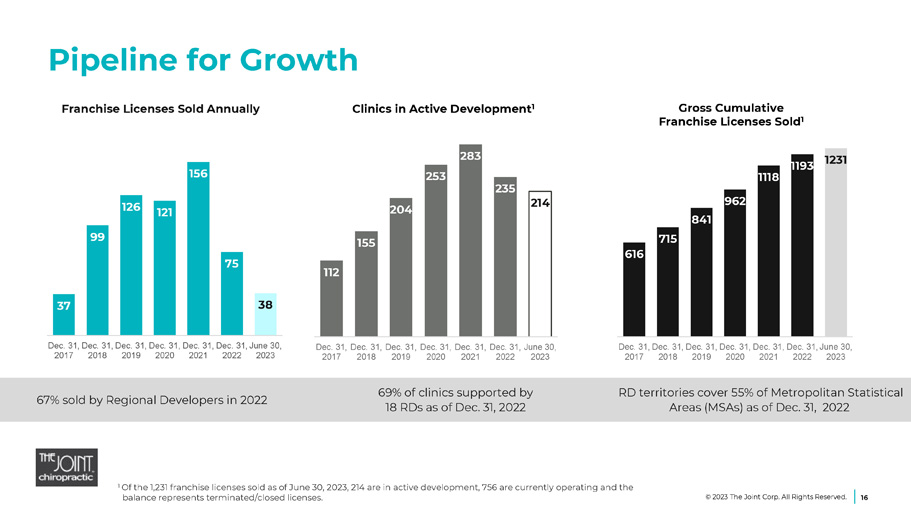
RD territories cover 55% of Metropolitan Statistical Areas (MSAs) as of Dec. 31, 2022 69% of clinics supported by 18 RDs as of Dec. 31, 2022 67% sold by Regional Developers in 2022 37 99 126 121 156 75 38 Dec. 31, Dec. 31, Dec. 31, Dec. 31, Dec. 31, Dec. 31, June 30, 2017 2018 2019 2020 2021 2022 2023 616 715 841 962 1118 1193 1231 Dec. 31, Dec. 31, Dec. 31, Dec. 31, Dec. 31, Dec. 31, June 30, 2017 2018 2019 2020 2021 2022 2023 112 155 204 253 283 235 214 Dec. 31, Dec. 31, Dec. 31, Dec. 31, Dec. 31, Dec. 31, June 30, 2017 2018 2019 2020 2021 2022 2023 Pipeline for Growth 16 1 Of the 1,231 franchise licenses sold as of June 30, 2023, 214 are in active development, 756 are currently operating and the balance represents terminated/closed licenses. Gross Cumulative Franchise Licenses Sold 1 Franchise Licenses Sold Annually Clinics in Active Development 1 © 2023 The Joint Corp. All Rights Reserved.
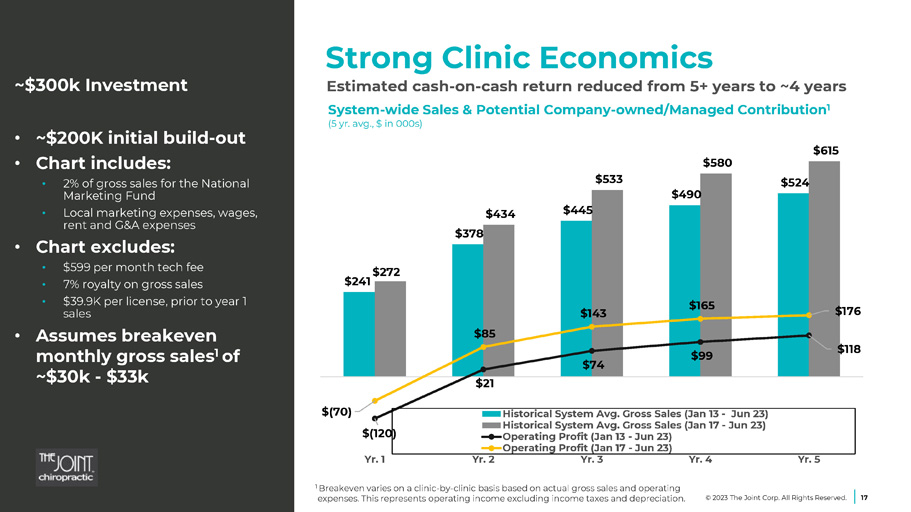
© 2023 The Joint Corp. All Rights Reserved. 17 Strong Clinic Economics ~$300k Investment • ~$200K initial build - out • Chart includes: • 2% of gross sales for the National Marketing Fund • Local marketing expenses, wages, rent and G&A expenses • Chart excludes: • $599 per month tech fee • 7% royalty on gross sales • $39.9K per license, prior to year 1 sales • Assumes breakeven monthly gross sales 1 of ~$30k - $33k 1 Breakeven varies on a clinic - by - clinic basis based on actual gross sales and operating expenses. This represents operating income excluding income taxes and depreciation. Estimated cash - on - cash return reduced from 5+ years to ~4 years System - wide Sales & Potential Company - owned/Managed Contribution 1 (5 yr. avg., $ in 000s) $241 $378 $445 $490 $524 $272 $434 $533 $580 $615 $21 $74 $99 $118 $(70) $85 $143 $165 $176 $(120) Yr. 1 Yr. 2 Yr. 5 Historical System Avg . Gross Sales (Jan 13 - Jun 23 ) Historical System Avg . Gross Sales (Jan 17 - Jun 23 ) Operating Profit (Jan 13 - Jun 23 ) Operating Profit (Jan 17 - Jun 23 ) Yr . 3 Yr . 4
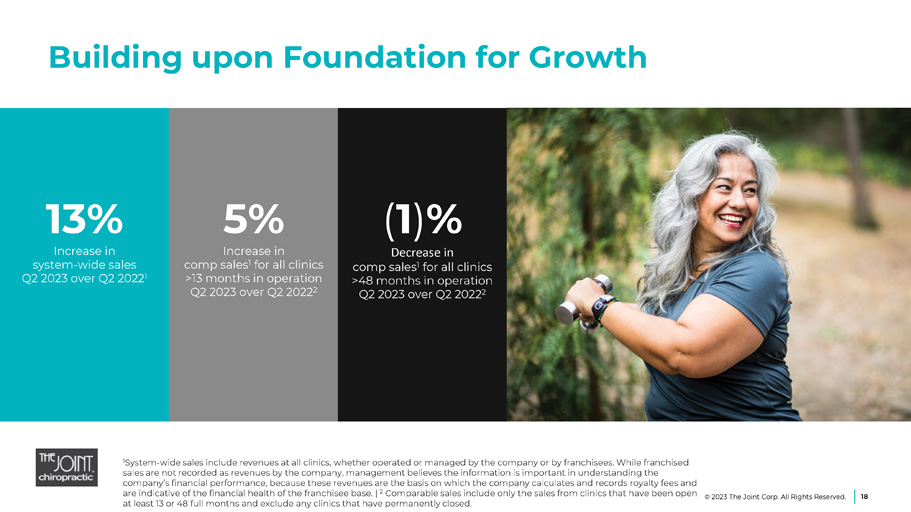
Building upon Foundation for Growth 18 © 2023 The Joint Corp. All Rights Reserved. 13% Increase in system - wide sales Q2 2023 over Q2 2022 1 5% Increase in comp sales 1 for all clinics >13 months in operation Q2 2023 over Q2 2022 2 ( 1 ) % Decrease in comp sales 1 for all clinics >48 months in operation Q2 2023 over Q2 2022 2 1 System - wide sales include revenues at all clinics, whether operated or managed by the company or by franchisees. While franchised sales are not recorded as revenues by the company, management believes the information is important in understanding the company’s financial performance, because these revenues are the basis on which the company calculates and records royalty fees and are indicative of the financial health of the franchisee base. | 2 Comparable sales include only the sales from clinics that have been open at least 13 or 48 full months and exclude any clinics that have permanently closed.

1 Reconciliation of Adjusted EBITDA to GAAP earnings is included in the appendix. | 2 Historically, company - owned or managed clinic openings included a combination of both greenfields and acquisitions. The company will continue to acquire previously franchised clinics. However, as these transactions are opportunistic, management will no longer include the acquired clinic estimate in guidance. To provide greater clarity, the 2023 company - owned or managed guidance includes greenfield clinic openings only. Amended Preliminary 2023 Financial Guidance 19 2023 High Guidance 2023 Low Guidance 2022 Actual $ in M $118.0 $115.0 $101.9 Revenues $12.5 $11.0 $11.5 Adjusted EBITDA 1 120 100 121 New Franchised Clinic Openings 12 8 16 New Greenfield Clinics 2 © 2023 The Joint Corp. All Rights Reserved.

Leading Market Growth The Joint Corp. 12 - yr. CAGR 62% 1 vs. Industry 5 - yr. CAGR 5.1% 2 People will continue to seek more noninvasive, holistic ways to manage their pain. We’ll be there to treat them. 1 For the period ended Dec. 31, 2022 2 March 2023 Kentley Insights Chiropractic Care Market Research Report 20 © 2023 The Joint Corp. All Rights Reserved. System - wide Sales ($ in M) 62% CAGR 1 (2010 - 2022) $8.1 $22.3 $98.6 $70.1 $46.2 $126.9 $165.1 $220.3 $260.0 $361.1 $435.3 $235.5
Driving Long - term Shareholder Value The most powerful brand - building tool is our storefronts . © 2023 The Joint Corp. All Rights Reserved. 21

Appendix © 2023 The Joint Corp. All Rights Reserved. 22

Preliminary Q2 2023 Financial Results © 2023 The Joint Corp. All Rights Reserved. 23 Differences Q2 2022 (as restated, unaudited) Q2 2023 (unaudited) $ in M 1 18% 23% 11% $4.4 3.3 1.1 $24.9 14.5 10.4 $29.3 17.8 11.5 Revenue • Corporate clinics • Franchise operations 15% 0.3 2.3 2.6 Cost of revenue 23% 0.9 3.8 4.7 Sales and marketing 59% 0.8 1.5 2.3 Depreciation and amortization 7% 1.3 18.6 19.9 G&A NA 1.0 (1.3) (0.4) Operating (loss) NA (0.1) (0.0) (0.1) Other (expense) NA (0.9) (1.3) (0.5) Loss) before income tax expense 23% 0.6 2.6 3.2 Adj. EBITDA 2 1 Due to rounding, numbers may not add up precisely to the totals. 2 Reconciliation of Adjusted EBITDA to GAAP earnings is included in the Appendix.
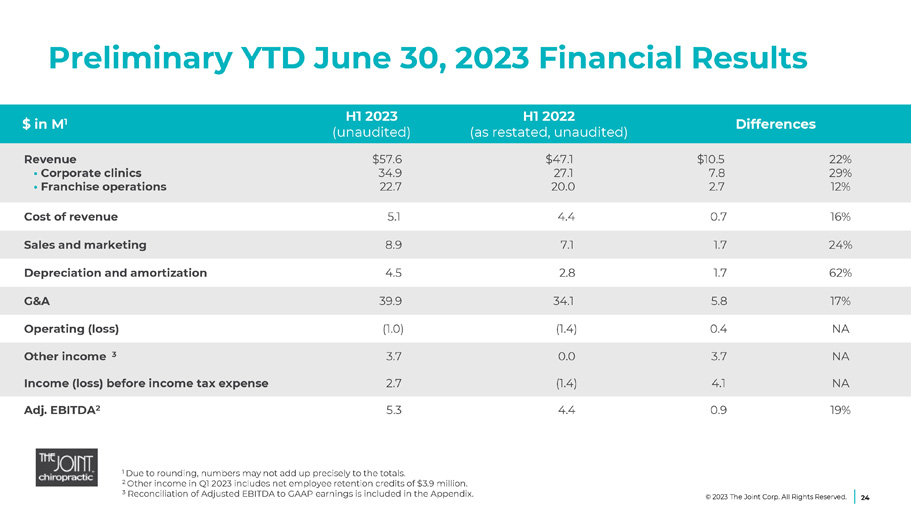
Preliminary YTD June 30, 2023 Financial Results 24 Differences H1 2022 (as restated, unaudited) H1 2023 (unaudited) $ in M 1 22% 29% 12% $10.5 7.8 2.7 $47.1 27.1 20.0 $57.6 34.9 22.7 Revenue • Corporate clinics • Franchise operations 16% 0.7 4.4 5.1 Cost of revenue 24% 1.7 7.1 8.9 Sales and marketing 62% 1.7 2.8 4.5 Depreciation and amortization 17% 5.8 34.1 39.9 G&A NA 0.4 (1.4) (1.0) Operating (loss) NA 3.7 0.0 3.7 Other income 3 NA 4.1 (1.4) 2.7 Income (loss) before income tax expense 19% 0.9 4.4 5.3 Adj. EBITDA 2 © 2023 The Joint Corp. All Rights Reserved. 1 Due to rounding, numbers may not add up precisely to the totals. 2 Other income in Q1 2023 includes net employee retention credits of $3.9 million. 3 Reconciliation of Adjusted EBITDA to GAAP earnings is included in the Appendix.
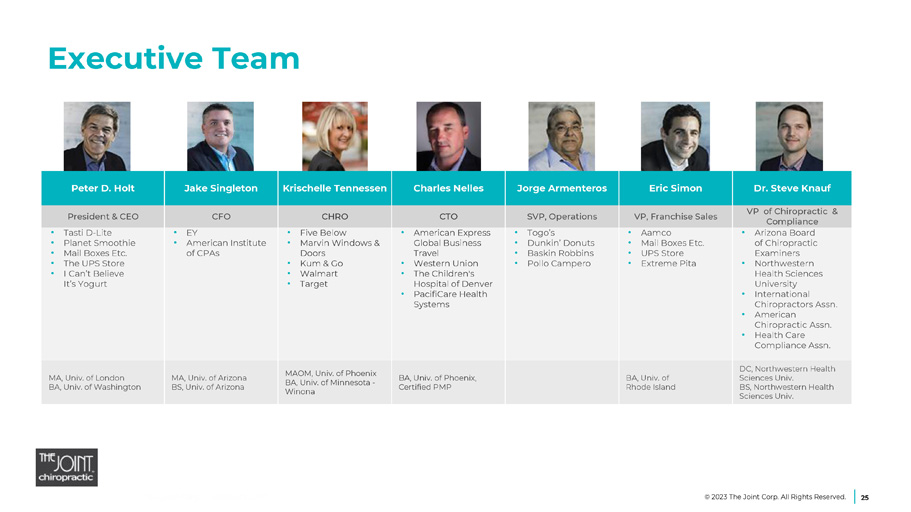
25 Executive Team Dr. Steve Knauf Eric Simon Jorge Armenteros Charles Nelles Krischelle Tennessen Jake Singleton Peter D. Holt VP of Chiropractic & Compliance VP, Franchise Sales SVP, Operations CTO CHRO CFO President & CEO • Arizona Board of Chiropractic Examiners • Northwestern Health Sciences University • International Chiropractors Assn. • American Chiropractic Assn. • Health Care Compliance Assn. • Aamco • Mail Boxes Etc. • UPS Store • Extreme Pita • Togo’s • Dunkin’ Donuts • Baskin Robbins • Pollo Campero • American Express Global Business Travel • Western Union • The Children's Hospital of Denver • PacifiCare Health Systems • Five Below • Marvin Windows & Doors • Kum & Go • Walmart • Target • EY • American Institute of CPAs • Tasti D - Lite • Planet Smoothie • Mail Boxes Etc. • The UPS Store • I Can’t Believe It’s Yogurt DC, Northwestern Health Sciences Univ. BS, Northwestern Health Sciences Univ. BA, Univ. of Rhode Island BA, Univ. of Phoenix, Certified PMP MAOM, Univ . of Phoenix BA, Univ . of Minnesota - Winona MA, Univ. of Arizona BS, Univ. of Arizona MA, Univ. of London BA, Univ. of Washington © 2023 The Joint Corp. All Rights Reserved.

Board of Directors Glenn J. Krevlin Abe Hong Peter D. Holt Suzanne M. Decker Ronald V. DaVella, CPA Matthew E. Rubel Director, 2019 Director, 2018 Director, 2016 Director, 2017 Director, 2014 Lead Director, 2017 • Founder, Managing Partner, & PM Glenhill Capital Advisors • Dir. Ember Technologies • Former Mgmt. or Dir. • Centric Brands • Design within Reach • Restoration Hardware • Cumberland Associates • The Goldman Sachs Group • EVP & CTO, Learning Care Group • Former Mgmt.: • Discount Tire Company • Red Rock Resorts • Starbucks Corp. • Technologent • Pres. & CEO, The Joint Corp. • Former Mgmt.: • Tasti D - Lite • Great Hills Partners • Mail Boxes, Etc. (now The UPS Store) • Director Intl.l Franchise Assn. (IFA) • Chair, International Affairs Network (IAN) • Former Exe. Project Sponsor and Chief HR Officer, Aspen Dental Mgmt • HR & Talent Acquisition Advisor, Bond Veterinary • Former Dir. Refresh Mental Health Davis Vision Companies • Financial Advisor: Manufacturing Succession Holding, and Universal Health • Vice Chair of the Strategic Advisory Board of Aura Ventures • Dir. Alkaline Water Co., Universal Health Group, Delta Dental of Arizona, and NorthStar Security • Former: Deloitte & Touche Mobile Home Parks NanoFlex Power Corp. and Amazing Lash Studio CFO & franchisee • Executive Chair KidKraft, Inc. • Chair, Holley Inc. & Mid Ocean Ptrs. PE Consumer Group • Former Dir. Hudson's Bay Co., HSNi & Treehouse Foods • Former: Roark Capital, TPG Capital, TPG Growth, Varsity Brands, Collective Brands, Cole Haan, J Crew, Popular Club Plan and more • Pres. Appointee, House Advisory Council on Trade Policy Negotiation BA, Wesleyan University MBA, New York University BE, U.S. Military Academy at West Point BA, Univ. of Washington MA, University of London BS, Russell Sage College BS, Queens College MBA, Pace University BS, Ohio University MBA, University of Miami
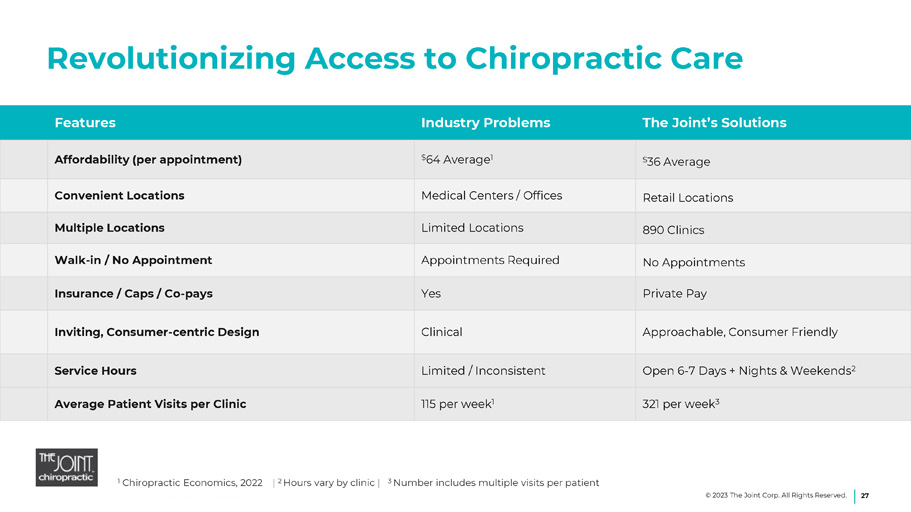
Revolutionizing Access to Chiropractic Care © 2023 The Joint Corp. All Rights Reserved. 27 1 Chiropractic Economics, 2022 | 2 Hours vary by clinic | 3 Number includes multiple visits per patient The Joint’s Solutions Industry Problems Features $ 36 Average $ 64 Average 1 Affordability (per appointment) Retail Locations Medical Centers / Offices Convenient Locations 890 Clinics Limited Locations Multiple Locations No Appointments Appointments Required Walk - in / No Appointment Private Pay Yes Insurance / Caps / Co - pays Approachable, Consumer Friendly Clinical Inviting, Consumer - centric Design Open 6 - 7 Days + Nights & Weekends 2 Limited / Inconsistent Service Hours 321 per week 3 115 per week 1 Average Patient Visits per Clinic

Patient Demographics 1 Patients who visited The Joint Chiropractic in 2022. The Joint 37.6 Years Median Age Generation Mix 19% Gen Z 45% Millennial 25% Gen X 11% Baby Boomer Gender 49% Female © 2023 The Joint Corp. All Rights Reserved. 28
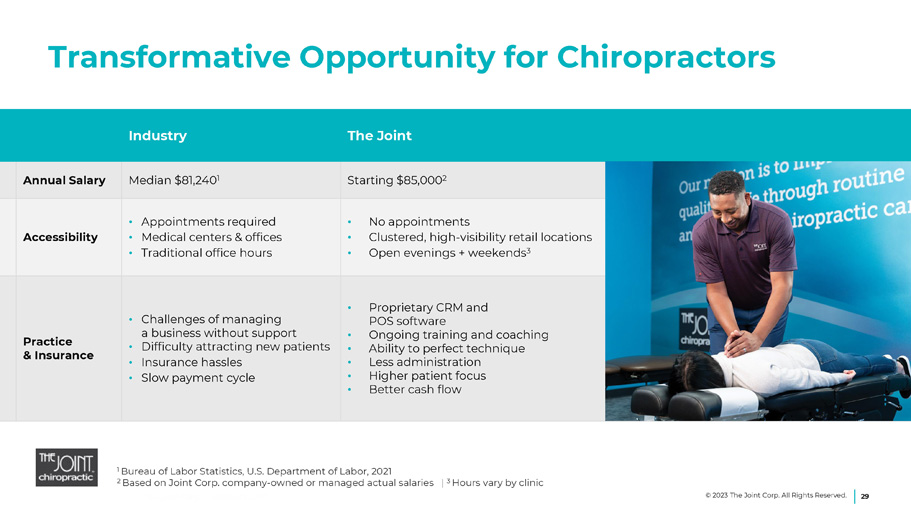
Transformative Opportunity for Chiropractors 1 Bureau of Labor Statistics, U.S. Department of Labor, 2021 2 Based on Joint Corp. company - owned or managed actual salaries | 3 Hours vary by clinic The Joint Industry Starting $85,000 2 Median $81,240 1 Annual Salary • No appointments • Clustered, high - visibility retail locations • Open evenings + weekends 3 • Appointments required • Medical centers & offices • Traditional office hours Accessibility • Proprietary CRM and POS software • Ongoing training and coaching • Ability to perfect technique • Less administration • Higher patient focus • Better cash flow • Challenges of managing a business without support • Difficulty attracting new patients • Insurance hassles • Slow payment cycle Practice & Insurance © 2023 The Joint Corp. All Rights Reserved. 29
Performance Metrics and Non - GAAP Measures © 2023 The Joint Corp. All Rights Reserved. 30 This presentation includes commonly discussed performance metrics. System - wide sales include sales at all clinics, whether operated by the company or by franchisees. While franchised sales are not recorded as revenues by the company, management believes the information is important in understanding the company’s financial performance, because these sales are the basis on which the company calculates and records royalty fees and are indicative of the financial health of the franchisee base. Comp sales include the sales from both company - owned or managed clinics and franchised clinics that in each case have been open at least 13 full months and exclude any clinics that have closed. This presentation includes non - GAAP financial measures. EBITDA and Adjusted EBITDA are presented because they are important measures used by management to assess financial performance, as management believes they provide a more transparent view of the Company’s underlying operating performance and operating trends than GAAP measures alone. Reconciliations of net loss to EBITDA and Adjusted EBITDA are presented where applicable. The Company defines EBITDA as net income/(loss) before net interest, tax expense, depreciation, and amortization expenses. The Company defines Adjusted EBITDA as EBITDA before acquisition - related expenses, bargain purchase net gain, gain/(loss) on disposition or impairment, stock - based compensation expenses and employee retention credits. EBITDA and Adjusted EBITDA do not represent and should not be considered alternatives to net income or cash flows from operations, as determined by accounting principles generally accepted in the United States, or GAAP. While EBITDA and Adjusted EBITDA are frequently used as measures of financial performance and the ability to meet debt service requirements, they are not necessarily comparable to other similarly titled captions of other companies due to potential inconsistencies in the methods of calculation. EBITDA and Adjusted EBITDA should be reviewed in conjunction with the Company’s financial statements filed with the SEC.
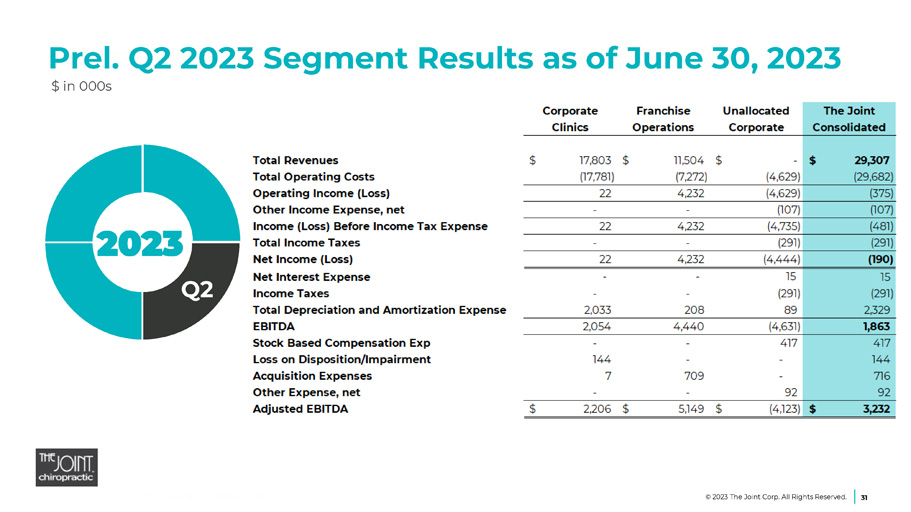
Prel. Q2 2023 Segment Results as of June 30, 2023 $ in 000s 2023 Q2 © 2023 The Joint Corp. All Rights Reserved. 31
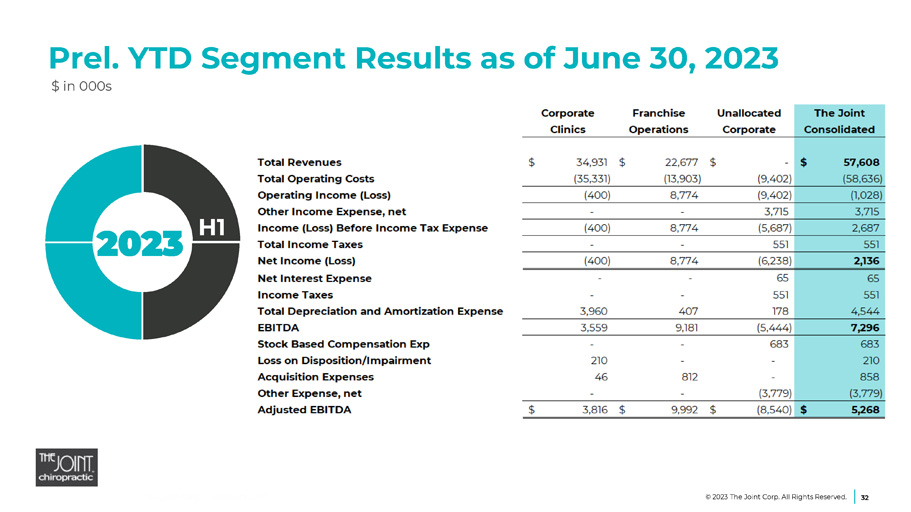
Prel. YTD Segment Results as of June 30, 2023 $ in 000s 2023 H1 © 2023 The Joint Corp. All Rights Reserved. 32

Preliminary GAAP – Non - GAAP Reconciliation $ in 000s © 2023 The Joint Corp. All Rights Reserved. 33

Jake Singleton, CFO jake.singleton@thejoint.com The Joint Corp. | 16767 N. Perimeter Dr., Suite 110, Scottsdale, AZ 85260 | (480) 245 - 5960 https://www.facebook.com/thejointchiro @thejointchiro © 2023 The Joint Corp. All Rights Reserved. 34 https://twitter.com/thejointchiro @thejointchiro https://www.youtube.com/thejointcorp @thejointcorp Peter D. Holt, President & CEO peter.holt@thejoint.com The Joint Corp. | 16767 N. Perimeter Dr., Suite 110, Scottsdale, AZ 85260 | (480) 245 - 5960 Kirsten Chapman, LHA Investor Relations thejoint@lhai.com LHA Investor Relations | 50 California Street, Suite 1500 | San Francisco, CA 94111| (415) 433 - 3777 Contact Information
v3.23.2
| X |
- DefinitionBoolean flag that is true when the XBRL content amends previously-filed or accepted submission.
| Name: |
dei_AmendmentFlag |
| Namespace Prefix: |
dei_ |
| Data Type: |
xbrli:booleanItemType |
| Balance Type: |
na |
| Period Type: |
duration |
|
| X |
- DefinitionFor the EDGAR submission types of Form 8-K: the date of the report, the date of the earliest event reported; for the EDGAR submission types of Form N-1A: the filing date; for all other submission types: the end of the reporting or transition period. The format of the date is YYYY-MM-DD.
| Name: |
dei_DocumentPeriodEndDate |
| Namespace Prefix: |
dei_ |
| Data Type: |
xbrli:dateItemType |
| Balance Type: |
na |
| Period Type: |
duration |
|
| X |
- DefinitionThe type of document being provided (such as 10-K, 10-Q, 485BPOS, etc). The document type is limited to the same value as the supporting SEC submission type, or the word 'Other'.
| Name: |
dei_DocumentType |
| Namespace Prefix: |
dei_ |
| Data Type: |
dei:submissionTypeItemType |
| Balance Type: |
na |
| Period Type: |
duration |
|
| X |
- DefinitionAddress Line 1 such as Attn, Building Name, Street Name
| Name: |
dei_EntityAddressAddressLine1 |
| Namespace Prefix: |
dei_ |
| Data Type: |
xbrli:normalizedStringItemType |
| Balance Type: |
na |
| Period Type: |
duration |
|
| X |
- Definition
+ References
+ Details
| Name: |
dei_EntityAddressCityOrTown |
| Namespace Prefix: |
dei_ |
| Data Type: |
xbrli:normalizedStringItemType |
| Balance Type: |
na |
| Period Type: |
duration |
|
| X |
- DefinitionCode for the postal or zip code
| Name: |
dei_EntityAddressPostalZipCode |
| Namespace Prefix: |
dei_ |
| Data Type: |
xbrli:normalizedStringItemType |
| Balance Type: |
na |
| Period Type: |
duration |
|
| X |
- DefinitionName of the state or province.
| Name: |
dei_EntityAddressStateOrProvince |
| Namespace Prefix: |
dei_ |
| Data Type: |
dei:stateOrProvinceItemType |
| Balance Type: |
na |
| Period Type: |
duration |
|
| X |
- DefinitionA unique 10-digit SEC-issued value to identify entities that have filed disclosures with the SEC. It is commonly abbreviated as CIK. Reference 1: http://www.xbrl.org/2003/role/presentationRef
-Publisher SEC
-Name Exchange Act
-Number 240
-Section 12
-Subsection b-2
| Name: |
dei_EntityCentralIndexKey |
| Namespace Prefix: |
dei_ |
| Data Type: |
dei:centralIndexKeyItemType |
| Balance Type: |
na |
| Period Type: |
duration |
|
| X |
- DefinitionIndicate if registrant meets the emerging growth company criteria. Reference 1: http://www.xbrl.org/2003/role/presentationRef
-Publisher SEC
-Name Exchange Act
-Number 240
-Section 12
-Subsection b-2
| Name: |
dei_EntityEmergingGrowthCompany |
| Namespace Prefix: |
dei_ |
| Data Type: |
xbrli:booleanItemType |
| Balance Type: |
na |
| Period Type: |
duration |
|
| X |
- DefinitionCommission file number. The field allows up to 17 characters. The prefix may contain 1-3 digits, the sequence number may contain 1-8 digits, the optional suffix may contain 1-4 characters, and the fields are separated with a hyphen.
| Name: |
dei_EntityFileNumber |
| Namespace Prefix: |
dei_ |
| Data Type: |
dei:fileNumberItemType |
| Balance Type: |
na |
| Period Type: |
duration |
|
| X |
- DefinitionTwo-character EDGAR code representing the state or country of incorporation.
| Name: |
dei_EntityIncorporationStateCountryCode |
| Namespace Prefix: |
dei_ |
| Data Type: |
dei:edgarStateCountryItemType |
| Balance Type: |
na |
| Period Type: |
duration |
|
| X |
- DefinitionThe exact name of the entity filing the report as specified in its charter, which is required by forms filed with the SEC. Reference 1: http://www.xbrl.org/2003/role/presentationRef
-Publisher SEC
-Name Exchange Act
-Number 240
-Section 12
-Subsection b-2
| Name: |
dei_EntityRegistrantName |
| Namespace Prefix: |
dei_ |
| Data Type: |
xbrli:normalizedStringItemType |
| Balance Type: |
na |
| Period Type: |
duration |
|
| X |
- DefinitionThe Tax Identification Number (TIN), also known as an Employer Identification Number (EIN), is a unique 9-digit value assigned by the IRS. Reference 1: http://www.xbrl.org/2003/role/presentationRef
-Publisher SEC
-Name Exchange Act
-Number 240
-Section 12
-Subsection b-2
| Name: |
dei_EntityTaxIdentificationNumber |
| Namespace Prefix: |
dei_ |
| Data Type: |
dei:employerIdItemType |
| Balance Type: |
na |
| Period Type: |
duration |
|
| X |
- DefinitionLocal phone number for entity.
| Name: |
dei_LocalPhoneNumber |
| Namespace Prefix: |
dei_ |
| Data Type: |
xbrli:normalizedStringItemType |
| Balance Type: |
na |
| Period Type: |
duration |
|
| X |
- DefinitionBoolean flag that is true when the Form 8-K filing is intended to satisfy the filing obligation of the registrant as pre-commencement communications pursuant to Rule 13e-4(c) under the Exchange Act. Reference 1: http://www.xbrl.org/2003/role/presentationRef
-Publisher SEC
-Name Exchange Act
-Number 240
-Section 13e
-Subsection 4c
| Name: |
dei_PreCommencementIssuerTenderOffer |
| Namespace Prefix: |
dei_ |
| Data Type: |
xbrli:booleanItemType |
| Balance Type: |
na |
| Period Type: |
duration |
|
| X |
- DefinitionBoolean flag that is true when the Form 8-K filing is intended to satisfy the filing obligation of the registrant as pre-commencement communications pursuant to Rule 14d-2(b) under the Exchange Act. Reference 1: http://www.xbrl.org/2003/role/presentationRef
-Publisher SEC
-Name Exchange Act
-Number 240
-Section 14d
-Subsection 2b
| Name: |
dei_PreCommencementTenderOffer |
| Namespace Prefix: |
dei_ |
| Data Type: |
xbrli:booleanItemType |
| Balance Type: |
na |
| Period Type: |
duration |
|
| X |
- DefinitionTitle of a 12(b) registered security. Reference 1: http://www.xbrl.org/2003/role/presentationRef
-Publisher SEC
-Name Exchange Act
-Number 240
-Section 12
-Subsection b
| Name: |
dei_Security12bTitle |
| Namespace Prefix: |
dei_ |
| Data Type: |
dei:securityTitleItemType |
| Balance Type: |
na |
| Period Type: |
duration |
|
| X |
- DefinitionName of the Exchange on which a security is registered. Reference 1: http://www.xbrl.org/2003/role/presentationRef
-Publisher SEC
-Name Exchange Act
-Number 240
-Section 12
-Subsection d1-1
| Name: |
dei_SecurityExchangeName |
| Namespace Prefix: |
dei_ |
| Data Type: |
dei:edgarExchangeCodeItemType |
| Balance Type: |
na |
| Period Type: |
duration |
|
| X |
- DefinitionBoolean flag that is true when the Form 8-K filing is intended to satisfy the filing obligation of the registrant as soliciting material pursuant to Rule 14a-12 under the Exchange Act. Reference 1: http://www.xbrl.org/2003/role/presentationRef
-Publisher SEC
-Name Exchange Act
-Section 14a
-Number 240
-Subsection 12
| Name: |
dei_SolicitingMaterial |
| Namespace Prefix: |
dei_ |
| Data Type: |
xbrli:booleanItemType |
| Balance Type: |
na |
| Period Type: |
duration |
|
| X |
- DefinitionTrading symbol of an instrument as listed on an exchange.
| Name: |
dei_TradingSymbol |
| Namespace Prefix: |
dei_ |
| Data Type: |
dei:tradingSymbolItemType |
| Balance Type: |
na |
| Period Type: |
duration |
|
| X |
- DefinitionBoolean flag that is true when the Form 8-K filing is intended to satisfy the filing obligation of the registrant as written communications pursuant to Rule 425 under the Securities Act. Reference 1: http://www.xbrl.org/2003/role/presentationRef
-Publisher SEC
-Name Securities Act
-Number 230
-Section 425
| Name: |
dei_WrittenCommunications |
| Namespace Prefix: |
dei_ |
| Data Type: |
xbrli:booleanItemType |
| Balance Type: |
na |
| Period Type: |
duration |
|
Joint (NASDAQ:JYNT)
Graphique Historique de l'Action
De Avr 2024 à Mai 2024

Joint (NASDAQ:JYNT)
Graphique Historique de l'Action
De Mai 2023 à Mai 2024
