PRICESMART, INC.
9740 Scranton Road
San Diego, California 92121
PROXY STATEMENT
for
ANNUAL MEETING OF STOCKHOLDERS
February 1, 2024
The Board of Directors of PriceSmart, Inc., a Delaware corporation (the “Company”), is soliciting proxies for use at the Annual Meeting of Stockholders of the Company to be held on February 1, 2024 (the “Annual Meeting”), and at any adjournments thereof. The Annual Meeting will be a virtual meeting via live audio webcast on the internet. You will be able to attend the Annual Meeting, vote and submit your questions during the meeting by visiting www.virtualshareholdermeeting.com/PSMT2024 and entering the 16-digit control number included in the Notice of Internet Availability or proxy card that you receive. For further information about the Annual Meeting, please see “Important Information about the Annual Meeting and Voting” beginning on page 3.
This Proxy Statement will be first sent to stockholders on or about December 19, 2023. You can submit your proxy by mail or you may provide voting instructions for your shares by telephone or via the internet. Instructions for voting by telephone, by using the internet or by mail are described on the enclosed proxy card. If you plan to attend the virtual Annual Meeting and wish to vote your shares personally, you may do so. Unless contrary instructions are indicated on the proxy, all shares represented by valid proxies received pursuant to this solicitation (and not revoked before they are voted) will be voted for the election of the Board of Directors’ nominees for directors, or for a substitute or substitutes selected by the Board of Directors in the event a nominee or nominees are unable to serve or decline to do so; for the approval, on an advisory basis, of the compensation of the Company’s executive officers for fiscal year 2023; for the approval, on an advisory basis, of the frequency of holding an advisory vote on executive compensation; for the approval of a proposed amendment to the Company’s Amended and Restated Certificate of Incorporation to limit the liability of officers; and for the ratification of the selection of Ernst & Young LLP as the Company’s independent registered public accounting firm for the fiscal year ending August 31, 2024. As to any other business that may properly come before the Annual Meeting and be submitted to a vote of the stockholders, Proxies received by the Board of Directors will be voted in accordance with the best judgment of the holders thereof.
A proxy may be revoked by written notice to the Secretary of the Company at any time prior to the Annual Meeting by executing a later proxy or by attending the virtual Annual Meeting and voting at the meeting.
The Company will bear the cost of solicitation of Proxies. In addition to the use of mails, Proxies may be solicited by personal interview, telephone, facsimile or e-mail, by officers, directors and other employees of the Company. The Company also will request persons, firms and corporations holding shares in their names, or in the names of their nominees, which are beneficially owned by others, to send, or cause to be sent, proxy material to, and obtain Proxies from, such beneficial owners and will reimburse such holders for their reasonable expenses in so doing.
The Company’s mailing address is 9740 Scranton Road, San Diego, California 92121.
Voting
Stockholders of record at the close of business on December 4, 2023 (the “Record Date”) will be entitled to notice of, and to vote at, the Annual Meeting or any adjournments thereof.
As of the Record Date, 30,516,876 shares of the Company’s common stock, $0.0001 par value per share (“Common Stock”), were outstanding, representing the only voting securities of the Company. Each share of Common Stock is entitled to one vote.
Votes cast by proxy or at the Annual Meeting will be counted by the person appointed by the Company to act as Inspector of Election for the Annual Meeting. The Inspector of Election will treat shares represented by proxies that reflect abstentions or include “broker non-votes” as shares that are present and entitled to vote for purposes of determining the presence of a quorum.
|
|
|
| PriceSmart, Inc. Notice of 2024 Annual Meeting of Stockholders and Proxy Statement |
|
1 |
Proposal 1 Election of Directors (continued)

legal matters and his significant experience with public companies contribute to the Board of Directors’ conclusion that he should serve as a director of the Company.
Sherry S. Bahrambeygui has been a director of the Company since November 2011 and served as Vice Chair of the Board from October 2016 to October 2017. Ms. Bahrambeygui served as Chief Executive Officer of the Company from January 2019 to February 2023 and as interim Chief Executive Officer from November 2018 to January 2019. Prior to her tenure as Chief Executive Officer, she served as the President and Managing Member of The Price Group, LLC, a private investment and management company, from 2007 to 2018. Before joining the Price Group, Ms. Bahrambeygui had a 15-year legal career as a litigator specializing in the health care, life sciences, consumer & retail, and real estate industries. She was the founding partner of Hosey & Bahrambeygui, LLP, a leading boutique civil litigation practice, from 1999 to 2007. In addition to her board service at the Company, Ms. Bahrambeygui has significant experience in corporate governance as a board member, trustee and attorney for numerous public, private and non-profit companies and boards. Ms. Bahrambeygui’s extensive international business, governance and leadership experience, strategic decision-making and ability to lead the Company through digital transformation and e-commerce expansion contribute to the Board of Directors’ conclusion that she should serve as director of the Company.
Jeffrey Fisher has been a director of the Company since November 2019. Since 2011, Mr. Fisher has served as the Chief Financial Officer and member of The Price Group, LLC, a private investment and management company. He also has been Chief Financial Officer and a director of Price Philanthropies Foundation, a private family foundation working to transform the lives of youth and families through grant making and youth programs, since May 2019. In addition, since January 2022, Mr. Fisher has served as CFO of the PriceSmart Foundation, a California nonprofit public benefit corporation which serves as the philanthropic partner for the Company, providing grants to nongovernmental organizations focused on youth development, economic development and community and environmental resilience in PriceSmart countries. He is also Chief Financial Officer of Aaron Price Fellows Foundation, La Jolla Fay, LLC, IvanFay, LLC, and RARSD, LLC. From 2004 to 2021, Mr. Fisher served as the Chief Financial Officer of PS Ivanhoe, LLC, a private real estate holding company. From January 2004 through December 2004, Mr. Fisher served as Chief Financial Officer of Price Legacy Corporation, a publicly traded Real Estate Investment Trust with approximately $1.2 billion in real estate assets. From October 2000 until joining Price Legacy, Mr. Fisher served as Chief Financial Officer of National Retail Partners, LLC, a private real estate company which owned and operated approximately $2.0 billion in real estate assets. From August 1993 to September 2000, Mr. Fisher served in various financial capacities of Burnham Pacific Properties, Inc., a publicly traded Real Estate Investment Trust. Prior to joining Burnham Pacific Properties, Mr. Fisher was a senior manager at Deloitte & Touche LLP, having started with them in 1983. Mr. Fisher is a certified public accountant. Mr. Fisher brings over 43 years of finance, accounting and investment experience, with an emphasis on real estate finance, and specific experience with public companies. Mr. Fisher’s extensive experience with finance and real estate matters, his experience as an executive of publicly traded companies and his accounting background contributed to the Board of Directors’ conclusion that he should serve as a director of the Company.
Gordon H. Hanson has been a director of the Company since April 2014. Mr. Hanson has been a tenured member of the faculty at the Harvard Kennedy School of Harvard University since January 2020. From 2001 through 2019, he was a tenured member of the economics faculty at the University of California, San Diego. From 1998 to 2001, he was a tenured member of management faculty at the University of Michigan, and from 1992 to 1998, he was on the economics faculty of the University of Texas. From 2009 until 2014, he served as a director of the Washington Office on Latin America, a non-profit organization working to promote civic advancement in the region, chairing their development committee. Mr. Hanson’s extensive background in the analysis of the economies of Latin America, including over 30 years of experience in consulting for international financial organizations, contribute to the Board of Directors’ conclusion that he should serve as director of the Company.
Beatriz V. Infante has been a director of the Company since January 2018. Since 2009, Ms. Infante has served as Chief Executive Officer of BusinessExcelleration LLC, a business consultancy specializing in corporate transformation and renewal. From 2010 until its acquisition by Infor in 2011, Ms. Infante was the Chief Executive Officer and a director of ENXSUITE
|
|
|
| 10 |
|
PriceSmart, Inc. Notice of 2024 Annual Meeting of Stockholders and Proxy Statement |
Information Regarding the Board of Directors
Board Meetings
The Company’s Board of Directors held five meetings during fiscal year 2023. No nominee for director who served as a director during the past year attended fewer than 75% of the aggregate of the total number of meetings of the Board of Directors and the total number of meetings of committees of the Board of Directors on which he or she served.
Board Leadership Structure; Lead Independent Director
The Company’s Board of Directors does not have a policy with respect to the separation of the offices of Chief Executive Officer and Board Chair. It is the Board’s view that rather than having a rigid policy, the Board, with the advice and assistance of the Nominating/Corporate Governance Committee, and upon consideration of all relevant factors and circumstances, will determine, as and when appropriate, whether to institute a formal policy.
In February 2023, upon the resignation of our prior Chief Executive Officer, our Chairman, Robert Price, became Interim Chief Executive Officer. The Board believes that having Mr. Price, who has served as the Company’s Chairman since 1997, is best situated to serve as our Interim Chief Executive Officer because of his previous experience serving the Company as Chief Executive Officer and his familiarity with the Company’s business and industry.
To ensure the appropriate level of oversight continues between our independent directors and the Interim Chief Executive Officer, the Board appointed our Vice Chairman, David Snyder, as Lead Independent Director in May 2023. As Lead Independent Director, Mr. Snyder presides over all meetings of the Board at which the Chairman is not present, including executive sessions of independent directors; calls meetings of the non-management directors, as appropriate; consults with the Chairman regarding Board meeting agendas, materials circulated to the Board and the Board’s calendar; and acts as the liaison between the independent directors and the Chairman. The Lead Independent Director also serves as the Board representative to external constituents of the Company, including stockholders.
Role of the Board of Directors in Risk Oversight
The Board of Directors oversees the Company’s risk management processes, either as a whole or through its committees. Committees of the Board of Directors review with management and the Company’s internal audit department the Company’s major risk exposures, their potential impact on the Company’s business and the steps the Company takes to manage such risk exposures. The Board of Directors’ risk oversight process includes receiving reports from committees of the Board of Directors and members of senior management.
Committees of the Board
Audit Committee. The Audit Committee, which currently consists of Mr. Janks, Ms. Infante, Dr. Márquez and Mr. Snyder, held seven meetings during fiscal year 2023. The Audit Committee oversees the Company’s accounting and financial reporting processes and the audits of its consolidated financial statements. The Committee reviews the annual audits conducted by the Company’s independent public accountants, reviews and evaluates internal accounting controls, is responsible for the selection of the Company’s independent public accountants, and conducts such reviews and examinations as it deems necessary with respect to the practices and policies of, and the relationship between, the Company and its independent public accountants. All committee members satisfy the Nasdaq Stock Market’s standards for “independence,” including applicable audit committee independence requirements, and the Board of Directors has determined that Mr. Janks qualifies as an “audit committee financial expert” within the meaning of the applicable SEC rules and regulations. The Audit Committee is governed by a written charter adopted by the Board of Directors, which is available on the Company’s public website at investors.pricesmart.com.
Compensation and Human Capital Committee. The Compensation and Human Capital Committee, which currently consists of Mr. Snyder, Mr. Fisher, Mr. Janks and Dr. Márquez, held ten meetings during fiscal year 2023. Each of the current members of
|
|
|
| PriceSmart, Inc. Notice of 2024 Annual Meeting of Stockholders and Proxy Statement |
|
13 |
Information Regarding the Board of Directors (continued)
the Compensation Committee satisfies the Nasdaq Stock Market’s standards for “independence,” including applicable compensation committee independence requirements. The Compensation Committee oversees the compensation philosophy for the Company and reviews and approves the compensation program for the Company’s executive officers. The Committee is authorized to evaluate and determine the compensation of the Company’s Chief Executive Officer and reviews and approves compensation for our President and Executive Vice Presidents. The Committee also administers, interprets and makes grants under the Company’s equity incentive award plans. The Compensation Committee is governed by a written charter adopted by the Board of Directors, which is available on the Company’s public website at investors.pricesmart.com.
Nominating/Corporate Governance Committee. The Nominating/Corporate Governance Committee, which currently consists of Mr. Janks, Mr. Hanson and Mr. Snyder, held one meeting during fiscal year 2023. Each of the current members of the Nominating/Corporate Governance Committee satisfies the Nasdaq Stock Market’s standards for “independence.” The Nominating/Corporate Governance Committee considers the slate of nominees to be presented for reelection at annual meetings of stockholders. The Nominating/Corporate Governance Committee also may evaluate and recommend candidates to add expertise and fill vacancies on the Board of Directors, which vacancies may be created by the departure of any directors or the expansion of the number of members of the Board of Directors. The Nominating/Corporate Governance Committee approved the nomination of the candidates reflected in Proposal 1. The Nominating/Corporate Governance Committee also assists the Board of Directors as needed in establishing corporate governance guidelines and other policies and procedures pertaining to corporate governance matters. The Nominating/Corporate Governance Committee is governed by a written charter adopted by the Board of Directors, which is available on the Company’s public website at investors.pricesmart.com.
Executive Committee. The Executive Committee, which currently consists of Mr. Robert Price, Mr. Snyder, Mr. Janks and Mr. David Price, held four meetings during fiscal year 2023. The Executive Committee has all powers and rights necessary to exercise the full authority of the Board of Directors in the management of the business and affairs of the Company, except as provided in the Delaware General Corporation Law or the bylaws of the Company.
Finance Committee. The Finance Committee, which currently consists of Mr. Janks, Mr. Fisher, Mr. Snyder and Mr. Thelan, held five meetings during fiscal year 2023. The Finance Committee reviews and makes recommendations with respect to (1) annual budgets, (2) investments, (3) financing arrangements and (4) the creation, incurrence, assumption or guaranty by the Company of any indebtedness, obligation or liability, except, in each case, for any such transactions entered into in the ordinary course of business of the Company.
Digital Transformation Committee. The Digital Transformation Committee, which currently consists of Ms. Infante, Ms. Bahrambeygui, Mr. Hanson, Mr. Janks and Mr. David Price, held four meetings during fiscal year 2023. The Digital Transformation Committee is charged with oversight of the Company’s omni-channel development and digital transformation to enhance membership and stockholder value.
Environmental and Social Responsibility Committee. The Environmental and Social Responsibility Committee, which currently consists of Dr. Márquez, Mr. Fisher, Mr. Hanson, Mr. David Price and Mr. Zurcher, held three meetings during fiscal year 2023. The Environmental and Social Responsibility Committee assists the Board in discharging its oversight responsibility related to environmental and social responsibility (“ESR”) matters, such as climate change impacts, energy and natural resources conservation, environmental and supply chain sustainability, human rights, employee health, safety and well-being, diversity and inclusion, public policy engagement, political contributions, corporate charitable and philanthropic activities and other ESR issues that are relevant and material to the Company and provides guidance to the Board and other Board committees on these matters.
Policy Governing Stockholder Communications with the Board of Directors
The Board of Directors welcomes communications from stockholders of the Company. Any stockholder who wishes to communicate with the Board of Directors or one or more members of the Board of Directors should do so in writing in care of
|
|
|
| 14 |
|
PriceSmart, Inc. Notice of 2024 Annual Meeting of Stockholders and Proxy Statement |
Information Regarding the Board of Directors (continued)
Supply Chain. To better assure the quality of what PriceSmart offers, we undertake regular audits and reviews of our manufacturers, producers and packagers to verify that they apply Best Manufacturing Practices and observe social responsibility rules in their facilities. One critical aspect of the audits is to confirm that these vendors adhere to safe labor practices. All vendors must pass the audits or PriceSmart will cease doing business with them.
Human Capital
As of August 31, 2023, we had approximately 11,000 employees. Approximately 96% of our employees were employed outside of the United States, and about 1,800 employees were represented by labor unions.
Developing a Diverse Workforce Representative of Our Markets
Fundamental to our mission is the ability to attract, retain, and develop a diverse workforce representative of the countries in which we operate. We are proud to hire from the local communities where we operate, which then enhances our understanding of the legal and operating environment of each country, so we can better serve our Members. We believe we provide our employees with excellent wages, as well as comprehensive benefit programs, which generally include life and health insurance and post-employment savings plans. We also seek to identify opportunities to support local businesses and communities, with the goal of improving the quality of life in the countries where we operate.
Talent Development and Learning
Providing employees with equal opportunities for development is a key focus for PriceSmart, and we strive to provide opportunities for each team member to learn and grow. We believe a focus on talent development leads to long-serving, loyal employees, which improves efficiencies in operations, thus resulting in higher quality service to our Members. In fiscal year 2023, we held more than 2,700 corporate talent development learning sessions, which included general leadership training as well as women-specific leadership training, in addition to courses on emotional intelligence and motivating employees. In addition, we offer a robust range of courses in technical and language skills, as well as instruction in wellness and valuable “life tools” such as the principles of managing personal or household finances, raising resilient children, and how to maintain healthy boundaries and a good work-life balance.
We also seek to promote from within, allowing us to develop the leadership strengths of our employees to provide a better overall customer experience for our Members.
Engaging our team through internal events — Diversity & Inclusion.
We strive to create a work environment that fosters a sense of belonging, inclusion, growth, and engagement for all our team members. Each month we facilitate a wide range of activities in the countries in which we operate, including celebrations of birthdays and work anniversaries, volunteering, employee appreciation, health and wellness events, and recreational opportunities such as football (soccer) games and 5K runs. We also send company-wide communications to celebrate events that recognize diversity and cultural heritage and educate team members about the history and significance of these events.
The activities we facilitate do more than bring employees together. They create platforms for celebrating our diversity, enriching our experiences, and fueling our shared journey toward success. In addition to promoting knowledge sharing, they empower our employees to grow personally and professionally, fostering an inclusive environment where we celebrate unique perspectives and strengthen our organizational culture.
|
|
|
| PriceSmart, Inc. Notice of 2024 Annual Meeting of Stockholders and Proxy Statement |
|
17 |
Executive and Director Compensation (continued)
but any unpaid bonus for any year prior to termination and a pro rata bonus for the year of termination (payable when all other bonuses are paid).
The employment agreements also contain confidentiality provisions, restrictions on solicitation of employees and interference with the Company’s customers and contracts, and other terms and conditions customary to executive employment agreements.
Equity Incentive Plan
Under the 2013 Equity Incentive Award Plan of PriceSmart, Inc., as amended (the “2013 Plan”), as of November 30, 2023, there were 618,182 shares of Common Stock subject to outstanding unvested restricted stock awards, 109,831 shares subject to outstanding restricted stock units, and 21,641 shares subject to outstanding performance stock units, and 718,236 shares of Common Stock were available for future grants.
The 2013 Plan provides that the Compensation Committee of the Board of Directors or a subcommittee thereof may grant or issue incentive stock options, non-qualified stock options, stock purchase rights, stock appreciation rights, restricted stock, deferred stock, dividend equivalents, performance awards, stock payments and other stock related benefits, or any combination thereof.
The 2013 Plan provides that in the event of a “Change in Control” or a “Corporate Transaction,” each as defined in the 2013 Plan, each outstanding award shall, immediately prior to the effective date of the Change in Control or Corporate Transaction, automatically become fully vested, exercisable or payable, as applicable, for all of the shares of Common Stock at the time subject to such award and, as applicable, may be exercised for any or all of those shares as fully vested shares of Common Stock, subject to prior achievement of vesting criteria in the case of performance stock units. In addition to the foregoing, in the event of termination of a plan participant’s service as a result of death or “disability,” any equity awards granted to such participant will, to the extent then unvested, automatically become fully vested, exercisable or payable, as applicable, for all of the shares of Common Stock at the time subject to such award and, as applicable, may be exercised for any or all of those shares as fully vested shares of Common Stock, subject to prior achievement of vesting criteria in the case of performance stock units.
The Retirement Plan of PriceSmart, Inc.
In 1998, the Company established a retirement plan. The retirement plan is designed to be a “qualified” plan under applicable provisions of the Internal Revenue Code of 1986, as amended, covering all employees, as defined in the retirement plan. Each year, participants may contribute up to 100% per pay period of their pre-tax annual compensation (as defined in the retirement plan) up to the maximum allowable by the Internal Revenue Code of 1986, as amended. Participants also may contribute amounts representing distributions from other qualified plans. Effective January 1, 2011, the Plan was amended to replace the Company match with a discretionary contribution of 4% of the employee’s eligible compensation up to the IRS maximum allowed to all employees regardless of their own salary deferrals. Effective January 1, 2016, the Company began providing up to a 2% matching contribution to non-officer employees who contribute at least 1% of their eligible pay, and during fiscal year 2019 expanded the 2% matching contribution to officers who contribute at least 1% of their eligible pay. Although the Company has not expressed any intent to do so, the Company has the right under the retirement plan to discontinue its contributions at any time and to terminate the retirement plan, subject to the provisions of Employee Retirement Income Security Act of 1974, as amended. All participants in the retirement plan are immediately vested in their accounts and earnings thereon.
|
|
|
| PriceSmart, Inc. Notice of 2024 Annual Meeting of Stockholders and Proxy Statement |
|
43 |
Pay vs Performance Disclosure - USD ($)
|
12 Months Ended |
Aug. 31, 2023 |
Aug. 31, 2022 |
Aug. 31, 2021 |
| Pay vs Performance Disclosure |
|
|
|
| Pay vs Performance Disclosure, Table |
Pay Versus Performance As required by Item 402(v) of Regulation S-K, we are providing the following information about the relationship between executive compensation actually paid and certain financial performance of the Company. For further information concerning the Company’s core compensation objectives, refer to the “ Compensation Discussion and Analysis ” above.
|
|
|
|
|
|
|
|
|
|
|
|
|
|
|
|
|
|
|
|
|
|
|
|
|
|
|
|
|
|
|
|
|
|
|
|
|
|
|
|
|
| |
|
|
|
|
|
|
|
|
|
|
|
|
|
Value of Initial Fixed $100
Investment Based On: |
|
|
|
|
|
|
|
|
|
|
|
|
|
|
|
|
|
|
Summary Compensation Table
Total for PEO |
|
|
Compensation Actually Paid
to PEO |
|
|
Average Summary Compensation Table Total for Non-PEO NEOs |
|
|
Average Compensation Actually Paid to Non-PEO NEOs |
|
|
|
|
|
Peer Group
Total
Shareholder
Return |
|
|
|
|
|
Adjusted
Operating
Income |
|
|
|
|
|
|
|
|
|
|
|
|
|
|
|
|
|
|
|
|
|
|
|
|
|
|
|
|
|
|
|
|
|
|
|
|
|
|
|
|
|
|
|
|
|
|
| |
|
|
|
|
|
|
|
|
|
|
|
|
|
|
|
|
|
|
|
|
|
|
|
|
|
|
|
|
|
|
| 2023 |
|
|
$— |
|
|
|
$ 8,595,042 |
|
|
|
$ — |
|
|
|
$5,356,031 |
|
|
|
$1,821,651 |
|
|
|
$1,994,184 |
|
|
|
$125 |
|
|
|
$103 |
|
|
|
$109,205 |
|
|
|
$205,128 |
|
| 2022 |
|
|
N/A |
|
|
|
10,182,186 |
|
|
|
N/A |
|
|
|
7,318,252 |
|
|
|
1,634,296 |
|
|
|
1,282,071 |
|
|
|
98 |
|
|
|
90 |
|
|
|
104,553 |
|
|
|
178,592 |
|
| 2021 |
|
|
N/A |
|
|
|
7,550,113 |
|
|
|
N/A |
|
|
|
9,430,543 |
|
|
|
1,260,906 |
|
|
|
1,631,591 |
|
|
|
130 |
|
|
|
113 |
|
|
|
98,159 |
|
|
|
151,678 |
|
|
During fiscal year 2023, Mr. Price and Ms. Bahrambeygui each served for a period of time as our Chief Executive Officer, as further described above under the heading “Compensation Discussion and Analysis,” and Ms. Bahrambeygui was our Chief Executive Officer for fiscal years 2022 and 2021. The dollar amounts reported in column (b) are the amounts of total compensation reported in the “Total” column of the “Summary Compensation Table” for Mr. Price and Ms. Bahrambeygui for the corresponding years in which each served as our Chief Executive Officer. |
|
The dollar amounts reported in column (c) represent the amounts of “compensation actually paid” to Mr. Price and Ms. Bahrambeygui, as computed in accordance with Item 402(v) of Regulation S-K, for the fiscal years in which each served as our Chief Executive Officer. The dollar amounts do not reflect the actual amount of compensation earned by or paid to Ms. Bahrambeygui during the applicable year. In accordance with the requirements of Item 402(v) of Regulation S-K, the following adjustments were made to the Summary Compensation Table total compensation for each year to determine the compensation actually paid for the relevant fiscal year: |
|
|
|
|
|
|
|
|
|
|
|
|
|
|
|
|
|
|
|
Reported
Summary
Compensation
Table
Total for PEO
|
|
|
Reported
Value of
Equity
Awards
|
|
|
|
|
|
Compensation
Actually Paid
to PEO
|
|
Mr. Price |
|
|
|
|
|
|
|
|
|
|
|
|
|
|
|
|
| 2023 |
|
$ |
— |
|
|
$ |
— |
|
|
$ |
— |
|
|
|
$ — |
|
Ms. Bahrambeygui |
|
|
|
|
|
|
|
|
|
|
|
|
|
|
|
|
| 2023 |
|
|
8,595,042 |
|
|
|
(6,237,921 |
) |
|
|
2,998,910 |
|
|
|
5,356,031 |
|
| 2022 |
|
|
10,182,186 |
|
|
|
(6,286,988 |
) |
|
|
3,423,054 |
|
|
|
7,318,252 |
|
| 2021 |
|
|
7,550,113 |
|
|
|
(3,576,958 |
) |
|
|
5,457,388 |
|
|
|
9,430,543 |
|
|
The grant date fair value of equity awards represents the total amounts reported in the “Stock Awards” and “Option Awards” column of the “Summary Compensation Table” for the applicable year. |
|
The equity award adjustments for each applicable year include the addition (or subtraction, as applicable) of the following: (i) the year-end fair value of any equity awards granted in the applicable year that are outstanding and unvested as of the end of the year; (ii) the amount of change as of the end of the applicable year (from the end of the prior fiscal year) in fair value of any equity awards granted in prior years that are outstanding and unvested as of the end of the applicable year; and (iii) for equity awards granted in prior years that vest in the applicable year, the amount equal to the change as of the vesting date (from the end of the prior fiscal year) in fair value. The Company did not (i) grant any equity awards that were granted and vested in the same year or (ii) pay any dividends or other earnings on equity awards that are not otherwise reflected in the fair value of the equity award. The amounts deducted or added in calculating the equity award adjustments are as follows: |
|
|
|
|
|
|
|
|
|
|
|
|
|
|
|
|
|
|
|
|
|
|
|
|
|
|
|
|
|
| |
|
Year-end Fair Value of Unvested Equity Awards Granted in the Year
|
|
|
Year-Over-
Year
Change in
Fair Value
of
Outstanding
and
Unvested
Equity
Awards
|
|
|
Fair
Value as
of
Vesting
Date of
Equity
Awards
Granted
and
Vested in
the Year |
|
|
Year-
Over-
Year
Change
in Fair
Value of
Equity
Awards
Granted
in Prior
Years
that
Vested
in the
Year ($) |
|
|
Fair Value
at the End
of the
Prior Year
of Equity
Awards
that
Failed to
Meet
Vesting
Conditions
in the
Year ($) |
|
|
Value of
Dividends or
Other
Earnings
Paid on
Stock or
Option
Awards not
Otherwise
Reflected in
Fair Value or
Total
Compensation
($) |
|
|
Total Equity
Award
Adjustments
($) |
|
Price, Robert |
|
|
|
|
|
|
|
|
|
| 2023 |
|
$ |
— |
|
|
$ |
— |
|
|
$ |
— |
|
|
|
$— |
|
|
$ |
— |
|
|
$ |
— |
|
|
$ |
— |
|
Bahrambeygui, Sherry |
|
|
|
|
|
|
|
|
|
| 2023 |
|
|
2,919,221 |
|
|
|
— |
|
|
|
2,471,250 |
|
|
|
(448,033 |
) |
|
|
(1,943,528 |
) |
|
|
— |
|
|
|
2,998,910 |
|
| 2022 |
|
|
3,868,201 |
|
|
|
(503,048 |
) |
|
|
1,127,973 |
|
|
|
(476,450 |
) |
|
|
(593,624 |
) |
|
|
— |
|
|
|
3,423,054 |
|
| 2021 |
|
|
3,180,659 |
|
|
|
432,177 |
|
|
|
1,210,595 |
|
|
|
(633,958 |
) |
|
|
— |
|
|
|
— |
|
|
|
5,457,388 |
|
|
The dollar amounts reported in column (d) represent the average of the amounts reported for the Company’s NEOs as a group (excluding our Chief Executive Officers) in the “Total” column of the “Summary Compensation Table” in each applicable year. The names of the NEOs (excluding our Chief Executive Officers) included for purposes of calculating the average amounts for each applicable year are as follows: (i) for 2023, Michael L. McCleary, John D. Hildebrandt, Francisco Velasco, Ana Luisa Bianchi and Nicolas Maslowski; (ii) for 2022, Mr. McCleary, Mr. Hildebrandt, Mr. Velasco, Juan Ignacio Biehl and William J. Naylon; and (iii) for 2021, Mr. McCleary, Mr. Naylon, Mr. Velasco and Mr. Hildebrandt. |
|
The dollar amounts reported in column (e) represent the average amount of “compensation actually paid” to the NEOs as a group (excluding our Chief Executive Officers), as computed in accordance with Item 402(v) of Regulation S-K. The dollar amounts do not reflect the actual average amount of compensation earned by or paid to the NEOs as a group (excluding our Chief Executive Officers) during the applicable year and were not considered by the Compensation Committee at the time it made decisions with respect to the compensation of the NEOs. In accordance with the requirements of Item 402(v) of Regulation S-K, the following adjustments were made to average total compensation for the NEOs as a group (excluding our Chief Executive Officers) for each fiscal year to determine the compensation actually paid, using the same methodology described above in Note 2: |
|
|
|
|
|
|
|
|
|
|
|
|
|
|
|
|
|
|
|
Average Reported Summary Compensation Table Total for Non-PEO NEOs
|
|
|
Average
Reported
Value of
Equity
Awards
|
|
|
Average
Equity
Award
Adjustments
|
|
|
Average Compensation Actually Paid to Non-PEO NEOs
|
|
| 2023 |
|
$ |
1,821,651 |
|
|
$ |
(614,734 |
) |
|
$ |
787,266 |
|
|
|
$1,994,184 |
|
| 2022 |
|
|
1,634,296 |
|
|
|
(586,315 |
) |
|
|
234,091 |
|
|
|
1,282,071 |
|
| 2021 |
|
|
1,260,906 |
|
|
|
(368,831 |
) |
|
|
739,516 |
|
|
|
1,631,591 |
|
|
The amounts deducted or added in calculating the total average equity award adjustments are as follows: |
|
|
|
|
|
|
|
|
|
|
|
|
|
|
|
|
|
|
|
|
|
|
|
|
|
|
|
|
|
| |
|
Year-end Fair Value of Unvested Equity Awards Granted in the Year
|
|
|
Year-Over-
Year Change
in Fair Value
of Outstanding
and
Unvested
Equity
Awards
|
|
|
Fair
Value
as of
Vesting
Date of
Equity
Awards
Granted
and
Vested
in the
Year |
|
|
Year-
Over-
Year
Change
in Fair
Value
of
Equity
Awards
Granted
in Prior
Years
that
Vested
in the
Year
|
|
|
Fair
Value at
the End
of the
Prior
Year of
Equity
Awards
that
Failed to
Meet
Vesting
Conditions
in the
Year
|
|
|
Value of
Dividends or
Other
Earnings
Paid on
Stock or
Option
Awards not
Otherwise
Reflected in
Fair Value or
Total
Compensation
($) |
|
|
Total Equity
Award
Adjustments
($) |
|
| 2023 |
|
$ |
624,093 |
|
|
$ |
44,866 |
|
|
$ |
178,658 |
|
|
|
$33,492 |
|
|
$ |
(93,842 |
) |
|
$ |
— |
|
|
$ |
787,266 |
|
| 2022 |
|
|
295,066 |
|
|
|
(61,519 |
) |
|
|
105,339 |
|
|
|
(104,796 |
) |
|
|
— |
|
|
|
— |
|
|
|
234,091 |
|
| 2021 |
|
|
342,290 |
|
|
|
159,235 |
|
|
|
110,223 |
|
|
|
127,768 |
|
|
|
— |
|
|
|
— |
|
|
|
739,516 |
|
|
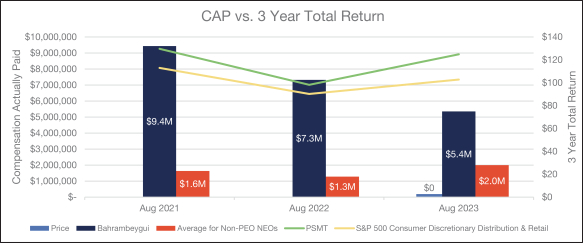
Cumulative TSR is calculated by dividing the sum of the cumulative amount of dividends for the measurement period, assuming dividend reinvestment, and the difference between the Company’s share price at the end and the beginning of the measurement period by the Company’s share price at the beginning of the measurement period. |
|
Represents the weighted peer group TSR, weighted according to the respective companies’ stock market capitalization at the beginning of each period for which a return is indicated. The peer group used for this purpose is the following published industry index: the S&P 500 Consumer Discretionary Distribution & Retail Index over the same period. |
|
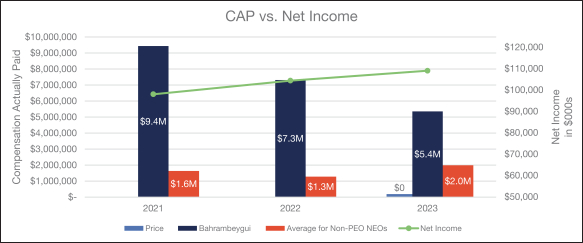
The dollar amounts reported represent the amount of net income reflected in the Company’s audited financial statements for the applicable year. |
|
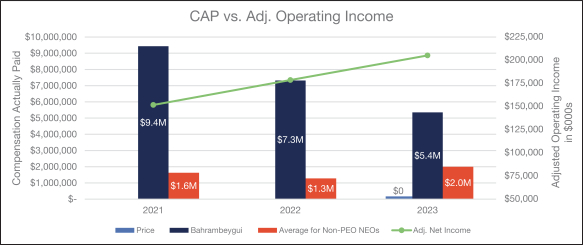
“Adjusted Operating Income” is measured as reported Operating Income adjusted for items that are not the result of our normal operations. For fiscal year 2023, the Compensation Committee approved add backs for the impact of separation costs associated with our Chief Executive Officer departure, less savings associated with our Interim CEO’s choosing to decline to receive compensation for his services; the write-off of certain VAT receivables following unfavorable court rulings; $2.1 million of Aeropost-related write-offs in the first quarter of fiscal year 2023 and $660,000 of a receivable written-off in connection with the settlement in the third quarter of fiscal year 2023 of a claim for indemnification from the buyer of the Aeropost business; a $5.1 million adjustment representing 50% of impairment and closure costs and other unbudgeted losses associated with our Trinidad sustainable packaging plant; and a $9.2 million charge to settle minimum tax litigation in one of our markets. While the Company uses various financial and non-financial performance measures for the purpose of evaluating performance for the Company’s compensation programs, the Company has determined that Adjusted Operating Income is the financial performance measure that, in the Company’s and the Compensation Committee’s assessment, represents the most important performance measure (that is not otherwise required to be disclosed in the table) used by the Company to link compensation actually paid to the Company’s NEOs, for the most recently completed fiscal year, to Company performance. Reconciliation and further information for Adjusted Operating Income can be found on Appendix A. |
|
|
|
| Company Selected Measure Name |
Adjusted Operating Income
|
|
|
| Named Executive Officers, Footnote |
The dollar amounts reported in column (d) represent the average of the amounts reported for the Company’s NEOs as a group (excluding our Chief Executive Officers) in the “Total” column of the “Summary Compensation Table” in each applicable year. The names of the NEOs (excluding our Chief Executive Officers) included for purposes of calculating the average amounts for each applicable year are as follows: (i) for 2023, Michael L. McCleary, John D. Hildebrandt, Francisco Velasco, Ana Luisa Bianchi and Nicolas Maslowski; (ii) for 2022, Mr. McCleary, Mr. Hildebrandt, Mr. Velasco, Juan Ignacio Biehl and William J. Naylon; and (iii) for 2021, Mr. McCleary, Mr. Naylon, Mr. Velasco and Mr. Hildebrandt.
|
|
|
| Peer Group Issuers, Footnote |
Represents the weighted peer group TSR, weighted according to the respective companies’ stock market capitalization at the beginning of each period for which a return is indicated. The peer group used for this purpose is the following published industry index: the S&P 500 Consumer Discretionary Distribution & Retail Index over the same period.
|
|
|
| Adjustment To PEO Compensation, Footnote |
|
The dollar amounts reported in column (c) represent the amounts of “compensation actually paid” to Mr. Price and Ms. Bahrambeygui, as computed in accordance with Item 402(v) of Regulation S-K, for the fiscal years in which each served as our Chief Executive Officer. The dollar amounts do not reflect the actual amount of compensation earned by or paid to Ms. Bahrambeygui during the applicable year. In accordance with the requirements of Item 402(v) of Regulation S-K, the following adjustments were made to the Summary Compensation Table total compensation for each year to determine the compensation actually paid for the relevant fiscal year: |
|
|
|
|
|
|
|
|
|
|
|
|
|
|
|
|
|
|
|
Reported
Summary
Compensation
Table
Total for PEO
|
|
|
Reported
Value of
Equity
Awards
|
|
|
|
|
|
Compensation
Actually Paid
to PEO
|
|
Mr. Price |
|
|
|
|
|
|
|
|
|
|
|
|
|
|
|
|
| 2023 |
|
$ |
— |
|
|
$ |
— |
|
|
$ |
— |
|
|
|
$ — |
|
Ms. Bahrambeygui |
|
|
|
|
|
|
|
|
|
|
|
|
|
|
|
|
| 2023 |
|
|
8,595,042 |
|
|
|
(6,237,921 |
) |
|
|
2,998,910 |
|
|
|
5,356,031 |
|
| 2022 |
|
|
10,182,186 |
|
|
|
(6,286,988 |
) |
|
|
3,423,054 |
|
|
|
7,318,252 |
|
| 2021 |
|
|
7,550,113 |
|
|
|
(3,576,958 |
) |
|
|
5,457,388 |
|
|
|
9,430,543 |
|
|
The grant date fair value of equity awards represents the total amounts reported in the “Stock Awards” and “Option Awards” column of the “Summary Compensation Table” for the applicable year. |
|
The equity award adjustments for each applicable year include the addition (or subtraction, as applicable) of the following: (i) the year-end fair value of any equity awards granted in the applicable year that are outstanding and unvested as of the end of the year; (ii) the amount of change as of the end of the applicable year (from the end of the prior fiscal year) in fair value of any equity awards granted in prior years that are outstanding and unvested as of the end of the applicable year; and (iii) for equity awards granted in prior years that vest in the applicable year, the amount equal to the change as of the vesting date (from the end of the prior fiscal year) in fair value. The Company did not (i) grant any equity awards that were granted and vested in the same year or (ii) pay any dividends or other earnings on equity awards that are not otherwise reflected in the fair value of the equity award. The amounts deducted or added in calculating the equity award adjustments are as follows: |
|
|
|
|
|
|
|
|
|
|
|
|
|
|
|
|
|
|
|
|
|
|
|
|
|
|
|
|
|
| |
|
Year-end Fair Value of Unvested Equity Awards Granted in the Year
|
|
|
Year-Over-
Year
Change in
Fair Value
of
Outstanding
and
Unvested
Equity
Awards
|
|
|
Fair
Value as
of
Vesting
Date of
Equity
Awards
Granted
and
Vested in
the Year |
|
|
Year-
Over-
Year
Change
in Fair
Value of
Equity
Awards
Granted
in Prior
Years
that
Vested
in the
Year ($) |
|
|
Fair Value
at the End
of the
Prior Year
of Equity
Awards
that
Failed to
Meet
Vesting
Conditions
in the
Year ($) |
|
|
Value of
Dividends or
Other
Earnings
Paid on
Stock or
Option
Awards not
Otherwise
Reflected in
Fair Value or
Total
Compensation
($) |
|
|
Total Equity
Award
Adjustments
($) |
|
Price, Robert |
|
|
|
|
|
|
|
|
|
| 2023 |
|
$ |
— |
|
|
$ |
— |
|
|
$ |
— |
|
|
|
$— |
|
|
$ |
— |
|
|
$ |
— |
|
|
$ |
— |
|
Bahrambeygui, Sherry |
|
|
|
|
|
|
|
|
|
| 2023 |
|
|
2,919,221 |
|
|
|
— |
|
|
|
2,471,250 |
|
|
|
(448,033 |
) |
|
|
(1,943,528 |
) |
|
|
— |
|
|
|
2,998,910 |
|
| 2022 |
|
|
3,868,201 |
|
|
|
(503,048 |
) |
|
|
1,127,973 |
|
|
|
(476,450 |
) |
|
|
(593,624 |
) |
|
|
— |
|
|
|
3,423,054 |
|
| 2021 |
|
|
3,180,659 |
|
|
|
432,177 |
|
|
|
1,210,595 |
|
|
|
(633,958 |
) |
|
|
— |
|
|
|
— |
|
|
|
5,457,388 |
|
|
|
|
| Non-PEO NEO Average Total Compensation Amount |
$ 1,821,651
|
$ 1,634,296
|
$ 1,260,906
|
| Non-PEO NEO Average Compensation Actually Paid Amount |
$ 1,994,184
|
1,282,071
|
1,631,591
|
| Adjustment to Non-PEO NEO Compensation Footnote |
|
The dollar amounts reported in column (e) represent the average amount of “compensation actually paid” to the NEOs as a group (excluding our Chief Executive Officers), as computed in accordance with Item 402(v) of Regulation S-K. The dollar amounts do not reflect the actual average amount of compensation earned by or paid to the NEOs as a group (excluding our Chief Executive Officers) during the applicable year and were not considered by the Compensation Committee at the time it made decisions with respect to the compensation of the NEOs. In accordance with the requirements of Item 402(v) of Regulation S-K, the following adjustments were made to average total compensation for the NEOs as a group (excluding our Chief Executive Officers) for each fiscal year to determine the compensation actually paid, using the same methodology described above in Note 2: |
|
|
|
|
|
|
|
|
|
|
|
|
|
|
|
|
|
|
|
Average Reported Summary Compensation Table Total for Non-PEO NEOs
|
|
|
Average
Reported
Value of
Equity
Awards
|
|
|
Average
Equity
Award
Adjustments
|
|
|
Average Compensation Actually Paid to Non-PEO NEOs
|
|
| 2023 |
|
$ |
1,821,651 |
|
|
$ |
(614,734 |
) |
|
$ |
787,266 |
|
|
|
$1,994,184 |
|
| 2022 |
|
|
1,634,296 |
|
|
|
(586,315 |
) |
|
|
234,091 |
|
|
|
1,282,071 |
|
| 2021 |
|
|
1,260,906 |
|
|
|
(368,831 |
) |
|
|
739,516 |
|
|
|
1,631,591 |
|
|
The amounts deducted or added in calculating the total average equity award adjustments are as follows: |
|
|
|
|
|
|
|
|
|
|
|
|
|
|
|
|
|
|
|
|
|
|
|
|
|
|
|
|
|
| |
|
Year-end Fair Value of Unvested Equity Awards Granted in the Year
|
|
|
Year-Over-
Year Change
in Fair Value
of Outstanding
and
Unvested
Equity
Awards
|
|
|
Fair
Value
as of
Vesting
Date of
Equity
Awards
Granted
and
Vested
in the
Year |
|
|
Year-
Over-
Year
Change
in Fair
Value
of
Equity
Awards
Granted
in Prior
Years
that
Vested
in the
Year
|
|
|
Fair
Value at
the End
of the
Prior
Year of
Equity
Awards
that
Failed to
Meet
Vesting
Conditions
in the
Year
|
|
|
Value of
Dividends or
Other
Earnings
Paid on
Stock or
Option
Awards not
Otherwise
Reflected in
Fair Value or
Total
Compensation
($) |
|
|
Total Equity
Award
Adjustments
($) |
|
| 2023 |
|
$ |
624,093 |
|
|
$ |
44,866 |
|
|
$ |
178,658 |
|
|
|
$33,492 |
|
|
$ |
(93,842 |
) |
|
$ |
— |
|
|
$ |
787,266 |
|
| 2022 |
|
|
295,066 |
|
|
|
(61,519 |
) |
|
|
105,339 |
|
|
|
(104,796 |
) |
|
|
— |
|
|
|
— |
|
|
|
234,091 |
|
| 2021 |
|
|
342,290 |
|
|
|
159,235 |
|
|
|
110,223 |
|
|
|
127,768 |
|
|
|
— |
|
|
|
— |
|
|
|
739,516 |
|
|
|
|
| Compensation Actually Paid vs. Total Shareholder Return |
Compensation Actually Paid and Cumulative TSR; Cumulative TSR of the Company and the S&P 500 Consumer Discretionary Distribution & Retail Index The following graph sets forth the relationship between the compensation actually paid to Mr. Price, Ms. Bahrambeygui, the average amount of compensation actually paid to our other NEOs, the Company’s cumulative TSR over the three most recently completed fiscal years and the TSR of the S&P 500 Consumer Discretionary Distribution & Retail Index over the same period.
|
|
|
| Compensation Actually Paid vs. Net Income |
Compensation Actually Paid and Net Income The following graph sets forth the relationship between the compensation actually paid to Mr. Price, Ms. Bahrambeygui, the average amount of compensation actually paid to our other NEOs, the average amount of compensation actually paid to our other NEOs, and the Company’s net income over the three most recently completed fiscal years.
|
|
|
| Compensation Actually Paid vs. Company Selected Measure |
Compensation Actually Paid and Adjusted Operating Income The following graph sets forth the relationship between compensation actually paid to Mr. Price, Ms. Bahrambeygui, the average amount of compensation actually paid to our other NEOs, the average amount of compensation actually paid to our other NEOs, and our Adjusted Operating Income during the three most recently completed fiscal years.
|
|
|
| Total Shareholder Return Vs Peer Group |
Compensation Actually Paid and Cumulative TSR; Cumulative TSR of the Company and the S&P 500 Consumer Discretionary Distribution & Retail Index The following graph sets forth the relationship between the compensation actually paid to Mr. Price, Ms. Bahrambeygui, the average amount of compensation actually paid to our other NEOs, the Company’s cumulative TSR over the three most recently completed fiscal years and the TSR of the S&P 500 Consumer Discretionary Distribution & Retail Index over the same period.
|
|
|
| Tabular List, Table |
Financial Performance Measure As described in greater detail in the “ Compensation Discussion and Analysis ,” the Company’s executive compensation program reflects a mix of objective financial performance measures that seek to align the interests of the stockholders and executives. These measures include:
• |
|
Adjusted Operating Income |
• |
|
Adjusted Total Revenues |
• |
|
Net Merchandise Sales—Constant Currency |
|
|
|
| Total Shareholder Return Amount |
$ 125
|
98
|
130
|
| Peer Group Total Shareholder Return Amount |
103
|
90
|
113
|
| Net Income (Loss) |
$ 109,205,000
|
$ 104,553,000
|
$ 98,159,000
|
| Company Selected Measure Amount |
205,128,000
|
178,592,000
|
151,678,000
|
| Measure:: 1 |
|
|
|
| Pay vs Performance Disclosure |
|
|
|
| Name |
Adjusted Operating Income
|
|
|
| Measure:: 2 |
|
|
|
| Pay vs Performance Disclosure |
|
|
|
| Name |
Adjusted Total Revenues
|
|
|
| Measure:: 3 |
|
|
|
| Pay vs Performance Disclosure |
|
|
|
| Name |
Net Merchandise Sales—Constant Currency
|
|
|
| Robert Price [Member] |
|
|
|
| Pay vs Performance Disclosure |
|
|
|
| PEO Name |
Mr. Price
|
|
|
| Sherry Bahrambeygui [Member] |
|
|
|
| Pay vs Performance Disclosure |
|
|
|
| PEO Total Compensation Amount |
$ 8,595,042
|
$ 10,182,186
|
$ 7,550,113
|
| PEO Actually Paid Compensation Amount |
$ 5,356,031
|
7,318,252
|
9,430,543
|
| PEO Name |
Ms. Bahrambeygui
|
|
|
| PEO | Sherry Bahrambeygui [Member] | Year End Fair Value of Unvested Equity Awards Granted in the Year [Member] |
|
|
|
| Pay vs Performance Disclosure |
|
|
|
| Adjustment to Compensation, Amount |
$ 2,919,221
|
3,868,201
|
3,180,659
|
| PEO | Sherry Bahrambeygui [Member] | Year Over Year Change in Fair Value of Outstanding and Unvested Equity Awards [Member] |
|
|
|
| Pay vs Performance Disclosure |
|
|
|
| Adjustment to Compensation, Amount |
|
(503,048)
|
432,177
|
| PEO | Sherry Bahrambeygui [Member] | Fair Value as of Vesting Date of Equity Awards Granted and Vested in the Year [Member] |
|
|
|
| Pay vs Performance Disclosure |
|
|
|
| Adjustment to Compensation, Amount |
2,471,250
|
1,127,973
|
1,210,595
|
| PEO | Sherry Bahrambeygui [Member] | Year Over Year Change in Fair Value of Equity Awards Granted in Prior Years that Vested in the Year [Member] |
|
|
|
| Pay vs Performance Disclosure |
|
|
|
| Adjustment to Compensation, Amount |
(448,033)
|
(476,450)
|
(633,958)
|
| PEO | Sherry Bahrambeygui [Member] | Fair Value at the End of the Prior Year of Equity Awards that Failed to Meet Vesting Conditions in the Year [Member] |
|
|
|
| Pay vs Performance Disclosure |
|
|
|
| Adjustment to Compensation, Amount |
(1,943,528)
|
(593,624)
|
|
| PEO | Sherry Bahrambeygui [Member] | Equity Award Adjustments [Member] |
|
|
|
| Pay vs Performance Disclosure |
|
|
|
| Adjustment to Compensation, Amount |
2,998,910
|
3,423,054
|
5,457,388
|
| PEO | Sherry Bahrambeygui [Member] | Reported Value of Equity Awards [Member] |
|
|
|
| Pay vs Performance Disclosure |
|
|
|
| Adjustment to Compensation, Amount |
(6,237,921)
|
(6,286,988)
|
(3,576,958)
|
| Non-PEO NEO | Year End Fair Value of Unvested Equity Awards Granted in the Year [Member] |
|
|
|
| Pay vs Performance Disclosure |
|
|
|
| Adjustment to Compensation, Amount |
624,093
|
295,066
|
342,290
|
| Non-PEO NEO | Year Over Year Change in Fair Value of Outstanding and Unvested Equity Awards [Member] |
|
|
|
| Pay vs Performance Disclosure |
|
|
|
| Adjustment to Compensation, Amount |
44,866
|
(61,519)
|
159,235
|
| Non-PEO NEO | Fair Value as of Vesting Date of Equity Awards Granted and Vested in the Year [Member] |
|
|
|
| Pay vs Performance Disclosure |
|
|
|
| Adjustment to Compensation, Amount |
178,658
|
105,339
|
110,223
|
| Non-PEO NEO | Year Over Year Change in Fair Value of Equity Awards Granted in Prior Years that Vested in the Year [Member] |
|
|
|
| Pay vs Performance Disclosure |
|
|
|
| Adjustment to Compensation, Amount |
33,492
|
(104,796)
|
127,768
|
| Non-PEO NEO | Fair Value at the End of the Prior Year of Equity Awards that Failed to Meet Vesting Conditions in the Year [Member] |
|
|
|
| Pay vs Performance Disclosure |
|
|
|
| Adjustment to Compensation, Amount |
(93,842)
|
|
|
| Non-PEO NEO | Equity Award Adjustments [Member] |
|
|
|
| Pay vs Performance Disclosure |
|
|
|
| Adjustment to Compensation, Amount |
787,266
|
234,091
|
739,516
|
| Non-PEO NEO | Reported Value of Equity Awards [Member] |
|
|
|
| Pay vs Performance Disclosure |
|
|
|
| Adjustment to Compensation, Amount |
$ (614,734)
|
$ (586,315)
|
$ (368,831)
|