UNITED STATES
SECURITIES AND EXCHANGE COMMISSION
Washington, D.C. 20549
FORM N-CSR
CERTIFIED SHAREHOLDER REPORT OF REGISTERED
MANAGEMENT
INVESTMENT COMPANIES
Investment Company Act file number 811-22553
Miller/Howard High Income Equity Fund
(Exact name of registrant as specified in charter)
45 Pine Grove Ave, Suite 301
Kingston, NY 12401
(Address of principal executive offices) (Zip code)
Catherine Johnston
Miller/Howard Investments, Inc.
45 Pine Grove Ave, Suite 301
Kingston, NY 12401
(Name and address of agent for service)
(845) 679-9166
Registrant's telephone number, including area code
Date of fiscal year end: October 31, 2023
Date of reporting period: April 30, 2023
Item 1. Reports to Stockholders.
Table of Contents
| |
|
1 |
Letter from President of the Fund |
6 |
Allocation of Portfolio Investments |
7 |
Schedule of Investments |
10 |
Statement of Assets and Liabilities |
11 |
Statement of Operations |
12 |
Statements of Changes in Net Assets |
13 |
Statement of Cash Flows |
14 |
Financial Highlights |
16 |
Notes to Financial Statements |
27 |
Additional Information |
30 |
Privacy Policy |
April 30, 2023 | Semi-Annual Report |

Dear Shareholders,
Thank you for investing in the Miller/Howard High Income Equity Fund (the “Fund”). Our goal for this Fund is to provide our Shareholders with a high level of income coupled with the potential for capital appreciation. We apply rigorous fundamental financial analysis to stock selection, looking for candidates that we believe exhibit strong dividend prospects and have the potential to raise those dividends in the future.
Market Summary1
During the Fund’s fiscal semi-annual period—November 1, 2022 through April 30, 2023—the broad equity market experienced gains. The S&P 500 Index gained 8.61% and the Russell 1000 Index gained 7.99%. The dispersion between growth and value stocks was meaningful, with the Russell 1000 Growth Index gaining 11.50%, while the Russell 1000 Value Index performed worse than the broad market and growth stocks, returning 4.51%.
Performance of dividend stocks was disappointing. The NASDAQ US Broad Dividend Achievers Index, composed of stocks with long-term historic dividend growth, underperformed the broad market indices—the S&P 500 Index and Russell 1000 Index—with a gain of 5.90%. The Dow Jones US Select Dividend Index, composed of stocks with high dividend yields, underperformed the broad market indices with a total return of 1.54%.
Recently the interest rate on a 2-year Treasury bond has been below the Fed funds rate—meaning the bond market is predicting that the Fed will begin cutting interest rates within a year. In essence, the bond market believes that economic growth will turn negative soon, and it suggests that we’ll see at least some evidence that inflation is coming under control—the two conditions the Fed would require before reducing rates.
A mild recession, like a spring rain, could create the conditions for economic growth to resume without causing undue hardship. In that scenario, unemployment would potentially rise moderately, suppressing wage inflation. Capital spending and consumer spending would likely slow, without an abrupt stop. The more unnerving scenario would be a flurry of bankruptcies that have an unpredictable domino effect on other aspects of the economy. In 2008, the banking sector was first to tip over, so naturally, it remains suspect. However, we believe that the regulatory systems and capital requirements adopted following the financial crisis make it unlikely that bad credit performance would undermine the US banking system.
1 Returns illustrated reflect the total return with dividends reinvested sourced from Bloomberg.
1 |
Semi-Annual Report | April 30, 2023 |
Additionally, following the bank run scare in March, we expect banks to pull back on lending in order to preserve capital. The Fed’s survey of senior loan officers indicates that standards were tightening for commercial and industrial loans, as well as a range of consumer loans, even before the demise of Silicon Valley Bank, Signature Bank, and Credit Suisse (these stocks were not held). We believe upcoming survey results will reflect further contraction. Historically, the senior loan officer survey has been an excellent predictor of recessions. The contraction in credit standards combined with the Fed’s continued interest rate hikes make a recession more likely than not, in our view.
Portfolio Performance
During the Fund’s fiscal semi-annual period from November 1, 2022 through April 30, 2023, the net asset value (NAV) per share experienced an increase of 3.33%, compared with the S&P 500’s 8.61% gain, on a total return basis. The market price of the Fund can sell at a premium or discount to NAV. The Fund’s market price (NYSE) return was 0.30%, and the Fund’s market total return (NYSE with dividends reinvested) was 3.29% for the semi-annual period. On the last day of the period, the Fund was trading at a -7.2% discount to NAV.
Looking at the performance drivers during the semi-annual period, by individual holdings, the top stock contributors were in the materials, consumer discretionary, and energy sectors. Rio Tinto Plc (RIO) reported strong iron ore volumes and price in late 2022. Ralph Lauren Corp (RL) beat consensus estimates for EPS and revenue; brick and mortar store sales held flat and digital sales decreased by 1%, while wholesale revenue increased by 8%. TotalEnergies SE reported mixed results in late 2022 as refining, marketing, and chemicals were strong, but natural gas, and free cash flow were weak. Overall, energy sector stocks were strong in late 2022.
Top detractors were in the financials and energy sectors. In financials, Keycorp (KEY) and US Bancorp (USB) traded down with other regional banks, triggered by the failure of Silicon Valley Bank (not held) and other bank turmoil. Ovintiv Inc (OVV) is weighted toward domestic gas that has experienced pricing pressure.
Dividend growth is important to this portfolio because the prices of higher-yielding stocks are based, in large part, on the income they provide. As income rises, an investor may expect the asset price to increase commensurately (though other factors may enter into this equation in the short term). We seek companies that not only pay high dividends or distributions now but that also are likely, in our view, to increase dividends in the future. During the reporting period, 20 of our stocks declared dividend increases, with individual increases averaging 15.95% growth year-over-year, excluding special dividends on an unweighted basis. Some stocks declared dividend increases multiple times in the period. The Fund also captured three special dividends that were paid during the semi-annual period.
We are enhancing the income in the portfolio through the sale of options. For the fiscal semi-annual period ended April 30, 2023, we sold calls on 33 positions, of which 22 expired worthless after we collected the premium, and we had 11 exercised. Zero positions remained open as of April 30, 2023. Our option positions’ notional value represented 0% of total assets as of the end of the period, below the 30% limitation.
April 30, 2023 | Semi-Annual Report |
2 |
As the prospectus indicates, the portfolio managers have the ability to employ modest leverage as a tool to reach our portfolio income objectives. As of April 30, 2023, we have borrowed an amount equal to 16.6% of the managed assets of the Fund at an average interest rate during the 6-month period of 5.1%. The use of leverage could increase volatility but, in our view, the inherent volatility of the portfolio is sufficiently low as to warrant this modest level of leverage.
Distributions to Shareholders
The distribution to Shareholders for the six months of the semi-annual period was $0.051 per share.
The Fund’s current indicated distribution rate based on its closing price on the New York Stock Exchange on April 28, 2023 ($10.16) was 6.02%. The current indicated distribution rate based on the Fund’s NAV per share ($10.95) was 5.59%. The Fund currently intends to continue to pay monthly distributions to its shareholders. We should note that, since inception, this distribution has been supported by income earned by the Fund. “Income” here means regular and special dividends (some of which are distributions from MLPs and REITs, which might be considered Return of Capital for tax and GAAP purposes) and option premiums. The Fund has earned three special dividends during the semi-annual period. With any special dividends, premiums from selling options, regular dividends and distributions from the portfolio, and our use of leverage, we expect to continue to generate sufficient income to cover these declared distributions.
Looking Ahead
At Miller/Howard, we favor dividend-paying stocks because we like the discipline it imposes on managements to run their businesses for the benefit of shareholders. We also believe that commitment to a regular dividend represents a signal from management that they actually see their cash flows as safe and stable.
Over the past 30 calendar years, high-dividend-yield stocks within the S&P 500 had a total return compound average growth rate (CAGR) of 10.3%, compared to the S&P 500 Index’s CAGR of 9.6%. Not only did high-dividend-yield stocks outperform the S&P 500 over the past 30 years, they also generated those higher returns with lower volatility. We believe these results demonstrate the wealth that can be generated by owning profitable, dividend-paying companies and allowing those investments to compound over long periods.
Without a doubt, the current environment is challenging, and despite threats of a looming recession, the broad market had a strong number of dividend increases. Some investors may be tempted to make a heroic move such as going to cash, precious metals, or some other strategy viewed as “risk free.” As always, we strongly discourage market timing. Good markets have always followed bad, and missing a sharp upturn can be very costly. Human nature causes us to extrapolate what we have just seen, not what is coming. If you feel it defies human nature to stay in the market during turbulent times, we would agree. But, historically, it has always been the right thing to do for the long term.
As always, we continue to monitor both our holdings and the universe of high-yield equities, looking to ensure that the Fund continues to produce a high level of income from companies that have a high current yield, prospects for dividend growth, and financial strength.
We thank our Shareholders for their participation and continued support.
3 |
Semi-Annual Report | April 30, 2023 |
IMPORTANT DISCLOSURES AND RISKS
The views expressed in this report reflect those as of the date this is written and may not reflect the author’s views on the date this report is first published or anytime thereafter. These views are subject to change at any time, based on market and other conditions and should not be construed as a recommendation or advice of any kind. These views are intended to assist shareholders in understanding the Fund’s investment methodology and do not constitute investment advice. This report may contain discussions about investments that may or may not be held by the Fund as of the date of this report. All current and future holdings are subject to risk and to change. The material may also contain forward-looking statements that involve risk and uncertainty, and there is no guarantee they will come to pass.
There can be no assurance that the Fund will achieve its investment objective. The net asset value of the Fund will fluctuate with the value of the underlying securities. Performance data quoted represents past results. Past performance is no guarantee of future results. The Fund is not able to predict whether its shares will trade above, below, or at net asset value in the future. This information does not represent an offer, or the solicitation of an offer, to buy or sell securities of the Fund.
An investment in the Miller/Howard High Income Equity Fund is subject to risk, including the possible loss of principal. Fund risks include, but are not limited to, the following: Non-US markets may be smaller, less liquid and more volatile than the major markets in the United States and, as a result, Fund share values may be more volatile. Trading in non-US markets typically involves higher expense than trading in the United States. The Fund may have difficulties enforcing its legal or contractual rights in a foreign country. These additional risks may be heightened for securities of companies located in, or with significant operations in emerging market countries.
Companies that issue dividend yielding equity securities are not required to continue to pay dividends on such stock. The Fund may be exposed to liquidity risk that effect the Fund’s ability to sell particular securities or close call option positions at an advantageous price or in a timely manner. The Fund invests in small and medium size companies, which carry greater risk than with larger, more established companies.
MLP entities are typically focused in the energy, natural resources and real estate sectors of the economy. A downturn in the energy, natural resources or real estate sectors of the economy could have an adverse impact on the Fund. Changes to current tax law and regulations could affect the treatment of distributions, including (but not limited to) ordinary income, capital gains or return of capital.
Dow Jones US Select Dividend Index aims to represent the leading stocks in the United States by dividend yield. Constituent weightings are assigned annually based on indicated annual dividend yield.
NASDAQ US Broad Dividend Achievers Index is a market cap index composed of stocks that have been selected annually based on stocks of companies that have historically increased and paid dividends annually and are listed on AMEX, NYSE, or NASDAQ.
April 30, 2023 | Semi-Annual Report |
4 |
The Russell 1000® Index measures the performance of the large-cap segment of the US equity universe. It is a subset of the Russell 3000® Index and includes approximately 1,000 of the largest securities based on a combination of their market cap and current index membership. The Russell 1000® Index is constructed to provide a comprehensive and unbiased barometer for the large-cap segment and is completely reconstituted annually to ensure new and growing equities are included.
Russell 1000 Growth Index is comprised of large- and mid-cap U.S. equities that show characteristics of growth. These characteristics of growth include higher price-to-book ratios and higher forecasted growth.
Russell 1000 Value Index measures the performance of the large-cap value segment of the U.S. equity universe. It includes those Russell 1000 companies with lower price-to-book ratios and lower expected growth values.
The Standard & Poor’s 500 Index (“S&P 500 Index”) is a capitalization-weighted index of 500 widely held common stocks. The index is designed to measure performance of the broad domestic economy through changes in the aggregate market value of 500 stocks representing all major industries.
One cannot invest directly in an index.
5 |
Semi-Annual Report | April 30, 2023 |
Miller/Howard High Income Equity Fund
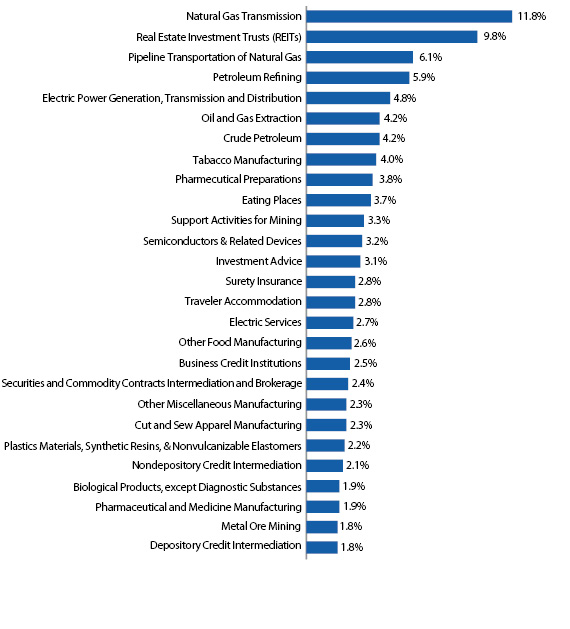
Allocation of Portfolio Investments
(Expressed as a Percentage of Long-Term Investments)
April 30, 2023
(Unaudited)
See accompanying Notes to Financial Statements | April 30, 2023 | Semi-Annual Report |
6 |
Miller/Howard High Income Equity Fund
Schedule of Investments
April 30, 2023
(Unaudited)
| |
|
Shares |
|
|
Fair Value |
|
Business Development Companies — 2.6% |
|
|
|
|
|
|
|
|
Business Credit Institutions — 2.6% |
|
|
|
|
|
|
|
|
Hercules Capital, Inc. (b) |
|
|
400,000 |
|
|
$ |
5,296,000 |
|
Total Business Development Companies (Cost $4,859,720) |
|
|
|
|
|
|
5,296,000 |
|
| |
|
|
|
|
|
|
|
|
Common Stock — 76.7% |
|
|
|
|
|
|
|
|
Biological Products, except Diagnostic Substances — 2.0% |
|
|
|
|
|
|
|
|
Gilead Sciences, Inc. (d) |
|
|
50,000 |
|
|
|
4,110,500 |
|
Crude Petroleum — 4.4% |
|
|
|
|
|
|
|
|
EOG Resources, Inc. |
|
|
36,000 |
|
|
|
4,300,920 |
|
Pioneer Natural Resources Co. |
|
|
22,000 |
|
|
|
4,786,100 |
|
| |
|
|
|
|
|
|
9,087,020 |
|
Cut and Sew Apparel Manufacturing — 2.4% |
|
|
|
|
|
|
|
|
Ralph Lauren Corp. |
|
|
42,400 |
|
|
|
4,867,096 |
|
Depository Credit Intermediation — 1.9% |
|
|
|
|
|
|
|
|
Ally Financial, Inc. (b) |
|
|
150,000 |
|
|
|
3,957,000 |
|
Eating Places — 3.9% |
|
|
|
|
|
|
|
|
Cracker Barrel Old Country Store, Inc. (b) |
|
|
75,000 |
|
|
|
7,962,000 |
|
Electric Power Generation, Transmission and Distribution — 5.0% |
|
|
|
|
|
|
|
|
Exelon Corp. (c) |
|
|
130,000 |
|
|
|
5,517,200 |
|
Portland General Electric Co. (b) |
|
|
94,400 |
|
|
|
4,778,528 |
|
| |
|
|
|
|
|
|
10,295,728 |
|
Electric Services — 2.8% |
|
|
|
|
|
|
|
|
Dominion Energy, Inc. (b) |
|
|
100,000 |
|
|
|
5,714,000 |
|
Metal Ore Mining — 1.9% |
|
|
|
|
|
|
|
|
Vale SA ADR |
|
|
275,000 |
|
|
|
3,962,750 |
|
Nondepository Credit Intermediation — 2.3% |
|
|
|
|
|
|
|
|
OneMain Holdings, Inc. (b) |
|
|
120,000 |
|
|
|
4,604,400 |
|
Oil and Gas Extraction — 4.5% |
|
|
|
|
|
|
|
|
Canadian Natural Resources Ltd. (c) |
|
|
150,000 |
|
|
|
9,145,500 |
|
Other Food Manufacturing — 2.8% |
|
|
|
|
|
|
|
|
Conagra Brands, Inc. (c) |
|
|
150,000 |
|
|
|
5,694,000 |
|
Other Miscellaneous Manufacturing — 2.4% |
|
|
|
|
|
|
|
|
British American Tobacco Plc ADR (c) |
|
|
135,000 |
|
|
|
5,001,750 |
|
Petroleum Refining — 6.2% |
|
|
|
|
|
|
|
|
Phillips 66 |
|
|
54,000 |
|
|
|
5,346,000 |
|
TotalEnergies SE ADR (c) |
|
|
115,000 |
|
|
|
7,351,950 |
|
| |
|
|
|
|
|
|
12,697,950 |
|
Pharmaceutical and Medicine Manufacturing — 2.0% |
|
|
|
|
|
|
|
|
Novo Nordisk A/S ADR (b) |
|
|
24,000 |
|
|
|
4,010,160 |
|
Pharmaceutical Preparations — 4.0% |
|
|
|
|
|
|
|
|
AbbVie, Inc. (d) |
|
|
22,000 |
|
|
|
3,324,640 |
|
Johnson & Johnson (d) |
|
|
30,000 |
|
|
|
4,911,000 |
|
| |
|
|
|
|
|
|
8,235,640 |
|
7 |
Semi-Annual Report | April 30, 2023 | See accompanying Notes to Financial Statements |
Miller/Howard High Income Equity Fund
Schedule of Investments (continued)
April 30, 2023
(Unaudited)
| |
|
Shares |
|
|
Fair Value |
|
Pipeline Transportation of Natural Gas — 6.5% |
|
|
|
|
|
|
|
|
Antero Midstream Corp. (b) |
|
|
250,000 |
|
|
$ |
2,690,000 |
|
Equitrans Midstream Corp. (b) |
|
|
270,000 |
|
|
|
1,390,500 |
|
TC Energy Corp. (c) |
|
|
220,000 |
|
|
|
9,138,800 |
|
| |
|
|
|
|
|
|
13,219,300 |
|
Plastics Materials, Synthetic Resins, & Nonvulcanizable Elastomers — 2.3% |
|
|
|
|
LyondellBasell Industries N.V. (Netherlands) (d) |
|
|
50,000 |
|
|
|
4,730,500 |
|
Securities and Commodity Contracts Intermediation and Brokerage — 2.5% |
|
|
|
|
The Goldman Sachs Group Inc |
|
|
15,000 |
|
|
|
5,151,600 |
|
Semiconductors & Related Devices — 3.3% |
|
|
|
|
|
|
|
|
Texas Instruments, Inc. (c) |
|
|
40,500 |
|
|
|
6,771,600 |
|
Support Activities for Mining — 3.5% |
|
|
|
|
|
|
|
|
BHP Group Ltd. ADR (b) |
|
|
120,000 |
|
|
|
7,084,800 |
|
Surety Insurance — 3.0% |
|
|
|
|
|
|
|
|
Old Republic International Corp. (c) |
|
|
240,000 |
|
|
|
6,064,800 |
|
Tobacco Manufacturing — 4.2% |
|
|
|
|
|
|
|
|
Altria Group, Inc. (c) |
|
|
180,000 |
|
|
|
8,551,800 |
|
Traveler Accommodation — 2.9% |
|
|
|
|
|
|
|
|
Vail Resorts, Inc. (c) |
|
|
25,000 |
|
|
|
6,013,000 |
|
Total Common Stock (Cost $156,386,455) |
|
|
|
|
|
|
156,932,894 |
|
| |
|
|
|
|
|
|
|
|
Master Limited Partnership — 15.7% |
|
|
|
|
|
|
|
|
Investment Advice — 3.3% |
|
|
|
|
|
|
|
|
AllianceBernstein Holding LP (c) |
|
|
190,000 |
|
|
|
6,642,400 |
|
Natural Gas Transmission — 12.4% |
|
|
|
|
|
|
|
|
Energy Transfer L.P. (d) |
|
|
750,500 |
|
|
|
9,666,440 |
|
Enterprise Products Partners L.P. (d) |
|
|
300,000 |
|
|
|
7,893,000 |
|
MPLX LP (c) |
|
|
224,000 |
|
|
|
7,837,760 |
|
| |
|
|
|
|
|
|
25,397,200 |
|
Total Master Limited Partnership (Cost $22,112,515) |
|
|
|
|
|
|
32,039,600 |
|
| |
|
|
|
|
|
|
|
|
Real Estate Investment Trusts (REITs) — 10.3% |
|
|
|
|
|
|
|
|
Apple Hospitality REIT, Inc. (b)(c) |
|
|
380,000 |
|
|
|
5,658,200 |
|
Lamar Advertising Co. |
|
|
70,000 |
|
|
|
7,397,600 |
|
Sabra Health Care REIT, Inc. (c) |
|
|
275,000 |
|
|
|
3,135,000 |
|
Spirit Realty Capital, Inc. (b) |
|
|
130,000 |
|
|
|
4,999,800 |
|
Total Real Estate Investment Trusts (REITs) (Cost $23,294,015) |
|
|
|
|
|
|
21,190,600 |
|
| |
|
|
|
|
|
|
|
|
Short-Term Investments — 0.6% |
|
|
|
|
|
|
|
|
Morgan Stanley Institutional Liquidity Fund - Treasury Portfolio, 4.71% (a) |
|
|
1,199,835 |
|
|
|
1,199,835 |
|
Total Short-Term Investments (Cost $1,199,835) |
|
|
|
|
|
|
1,199,835 |
|
See accompanying Notes to Financial Statements | April 30, 2023 | Semi-Annual Report |
8 |
Miller/Howard High Income Equity Fund
Schedule of Investments (continued)
April 30, 2023
(Unaudited)
| |
|
Shares |
|
|
Fair Value |
|
Investments Purchased with Proceeds from Securities Lending — 23.5% |
|
|
|
|
Mount Vernon Liquid Assets Portfolio, LLC, 4.96% (a) |
|
|
48,033,869 |
|
|
$ |
48,033,869 |
|
Total Investments Purchased with Proceeds from Securities Lending (Cost 48,033,869) |
|
|
|
|
|
|
48,033,869 |
|
| |
|
|
|
|
|
|
|
|
Total Investments — 129.4% (cost $255,886,409) |
|
|
|
|
|
|
264,692,798 |
|
Other Assets and Liabilities — (29.4)% |
|
|
|
|
|
|
(60,102,089 |
) |
Total Net Assets Applicable to Common Stockholders — 100.0% |
|
|
|
|
|
$ |
204,590,709 |
|
Note: Percentages indicated are based on the net assets of the Fund.
ADR American Depository Receipt
|
(a)
|
Rate indicated is the current yield as of April 30, 2023.
|
|
(b)
|
All or a portion of this security is on loan.
|
|
(c)
|
All or a portion of this security has been pledged as collateral in connection with the Fund’s Special Custody Account Agreement. As of April 30, 2023, the total value of securites pledged as collateral for the Special Custody Account Agreement was $87,546,076.
|
|
(d)
|
All or a portion of the security represents collateral for written options. The value of the securities segregated as collateral for written options is $34,636,080, which is 16.9% of total net assets.
|
9 |
Semi-Annual Report | April 30, 2023 | See accompanying Notes to Financial Statements |
Miller/Howard High Income Equity Fund
Statement of Assets and Liabilities
April 30, 2023
(Unaudited)
Assets: |
|
|
|
|
Investments in unaffiliated securities, at value (Identified cost - $255,886,409) (1) |
|
$ |
264,692,798 |
|
Receivable for investments sold |
|
|
1,579,903 |
|
Dividends and interest receivable |
|
|
674,159 |
|
Cash |
|
|
128,224 |
|
Cash at broker |
|
|
29,681 |
|
Other assets |
|
|
36,998 |
|
Total Assets |
|
|
267,141,763 |
|
| |
|
|
|
|
LIABILITIES: |
|
|
|
|
Loans payable |
|
|
14,000,000 |
|
Payable for collateral on securities loaned |
|
|
48,033,869 |
|
Accrued professional fees |
|
|
170,368 |
|
Payable to Adviser |
|
|
166,903 |
|
Accrued interest expense |
|
|
114,824 |
|
Accrued administration expense |
|
|
32,013 |
|
Accrued shareholder reporting expenses |
|
|
16,783 |
|
Other liabilities |
|
|
16,294 |
|
Total Liabilities |
|
|
62,551,054 |
|
NET ASSETS |
|
$ |
204,590,709 |
|
| |
|
|
|
|
NET ASSETS consist of: |
|
|
|
|
Paid-in capital |
|
$ |
239,215,963 |
|
Accumulated losses |
|
|
(34,625,254 |
) |
Total Net Assets |
|
$ |
204,590,709 |
|
Shares at April 30, 2023 |
|
|
18,690,675 |
|
NET ASSET VALUE PER COMMON SHARE OUTSTANDING |
|
$ |
10.95 |
|
|
(1)
|
Including securities on loan at a value of $47,227,835.
|
See accompanying Notes to Financial Statements | April 30, 2023 | Semi-Annual Report |
10 |
Miller/Howard High Income Equity Fund
Statement of Operations
For the Six Months Ended April 30, 2023
(Unaudited)
Investment Income: |
|
|
|
|
Dividend income (net of $138,455 foreign withholding tax) |
|
$ |
4,906,606 |
|
Interest income |
|
|
127,144 |
|
Securities lending income |
|
|
48,246 |
|
Total Investment Income |
|
|
5,081,996 |
|
| |
|
|
|
|
Expenses: |
|
|
|
|
Interest expense |
|
|
1,149,849 |
|
Advisory fees |
|
|
1,136,404 |
|
Professional fees |
|
|
223,780 |
|
Administration fees |
|
|
97,281 |
|
Trustees’ fees and expenses |
|
|
68,000 |
|
Compliance fees |
|
|
34,712 |
|
Miscellaneous |
|
|
26,929 |
|
Transfer agent fees and expenses |
|
|
15,982 |
|
Shareholder reporting expenses |
|
|
15,431 |
|
Registration and filing fees |
|
|
15,258 |
|
Custodian fees and expenses |
|
|
15,004 |
|
Total Expenses |
|
|
2,798,630 |
|
Net Investment Income |
|
|
2,283,366 |
|
| |
|
|
|
|
Net Realized and Unrealized Gain (Loss): |
|
|
|
|
Net realized gain (loss) on: |
|
|
|
|
Investments in unaffiliated securities |
|
|
(7,048,232 |
) |
Options |
|
|
1,060,863 |
|
Foreign currency translations |
|
|
29,313 |
|
Net realized gain (loss) |
|
|
(5,958,056 |
) |
Net change in unrealized appreciation (depreciation) on: |
|
|
|
|
Investments in unaffiliated securities |
|
|
10,523,764 |
|
Net change in unrealized appreciation (depreciation) |
|
|
10,523,764 |
|
Net realized and unrealized gain (loss) |
|
|
4,565,708 |
|
Net Increase (Decrease) in Net Assets resulting from Operations |
|
$ |
6,849,074 |
|
11 |
Semi-Annual Report | April 30, 2023 | See accompanying Notes to Financial Statements |
Miller/Howard High Income Equity Fund
Statements of Changes in Net Assets
| |
|
For the
six months
ended
April 30, 2023
(Unaudited) |
|
|
For the
year ended
October 31,
2022 |
|
Change in Net Assets: |
|
|
|
|
|
|
|
|
From Operations: |
|
|
|
|
|
|
|
|
Net investment income |
|
$ |
2,283,366 |
|
|
$ |
6,789,641 |
|
Net realized gain (loss) |
|
|
(5,958,056 |
) |
|
|
17,554,363 |
|
Net change in unrealized appreciation (depreciation) |
|
|
10,523,764 |
|
|
|
(15,499,887 |
) |
Net increase (decrease) in net assets resulting from operations |
|
|
6,849,074 |
|
|
|
8,844,117 |
|
Dividends and Distributions to Shareholders from: |
|
|
|
|
|
|
|
|
Net investment income |
|
|
(5,719,346 |
) |
|
|
(7,714,433 |
) |
Return of capital |
|
|
— |
|
|
|
(3,107,468 |
) |
Total dividends and distributions to shareholders |
|
|
(5,719,346 |
) |
|
|
(10,821,901 |
) |
Total increase (decrease) in net assets |
|
|
1,129,728 |
|
|
|
(1,977,784 |
) |
| |
|
|
|
|
|
|
|
|
Net Assets: |
|
|
|
|
|
|
|
|
Beginning of year/period |
|
|
203,460,981 |
|
|
|
205,438,765 |
|
End of year/period |
|
$ |
204,590,709 |
|
|
$ |
203,460,981 |
|
See accompanying Notes to Financial Statements | April 30, 2023 | Semi-Annual Report |
12 |
Miller/Howard High Income Equity Fund
Statement of Cash Flows
For the Six Months Ended April 30, 2023
(Unaudited)
Cash Flows from Operating Activities: |
|
|
|
|
Net increase in net assets resulting from operations |
|
$ |
6,849,074 |
|
Adjustments to reconcile net increase in net assets resulting from operations to net cash provided by operating activities: |
|
|
|
|
Purchases of long-term investments |
|
|
(131,317,577 |
) |
Net purchases and sales of short-term investments |
|
|
11,162,767 |
|
Proceeds from sales of long-term investments |
|
|
150,883,538 |
|
Proceeds from option transactions |
|
|
1,747,537 |
|
Return of capital on distributions received |
|
|
1,456,985 |
|
Decrease in collateral for securities loaned |
|
|
6,050,159 |
|
Decrease in payable upon return of securities loaned |
|
|
(6,050,159 |
) |
Net decrease in dividends and interest receivable and other assets |
|
|
91,733 |
|
Net decrease in accrued expenses and other liabilities |
|
|
(43,245 |
) |
Net change in unrealized appreciation (depreciation) of investment securities |
|
|
(10,523,764 |
) |
Net realized gain on investment securities |
|
|
5,987,369 |
|
Cash provided by operating activities |
|
|
36,294,417 |
|
| |
|
|
|
|
Cash Flows from Financing Activities: |
|
|
|
|
Decrease in line of credit |
|
|
(30,500,000 |
) |
Dividends paid |
|
|
(5,719,346 |
) |
Cash used in financing activities |
|
|
(36,219,346 |
) |
| |
|
|
|
|
Increase in cash |
|
|
75,071 |
|
Cash at beginning of period |
|
|
82,834 |
|
Cash and Cash at Broker at end of period |
|
$ |
157,905 |
|
| |
|
|
|
|
Supplemental Disclosure of Cash Flow and Non-cash Information: |
|
|
|
|
Interest paid |
|
$ |
1,189,601 |
|
13 |
Semi-Annual Report | April 30, 2023 | See accompanying Notes to Financial Statements |
Miller/Howard High Income Equity Fund
Financial Highlights
| |
|
For the
six months
ended |
|
|
For the period/year ended |
|
| |
|
April 30, 2023
(Unaudited) |
|
|
October 31,
2022 |
|
|
October 31,
2021 |
|
|
October 31,
2020 |
|
|
October 31,
2019 |
|
|
October 31,
2018 |
|
Per Common Share Data (1) |
|
|
|
|
|
|
|
|
|
|
|
|
|
|
|
|
|
|
|
|
|
|
|
|
Net asset value, beginning of year/period |
|
$ |
10.89 |
|
|
$ |
10.99 |
|
|
$ |
6.94 |
|
|
$ |
10.55 |
|
|
$ |
11.03 |
|
|
$ |
12.43 |
|
Income from Investment Operations |
|
|
|
|
|
|
|
|
|
|
|
|
|
|
|
|
|
|
|
|
|
|
|
|
Net investment income (loss) |
|
|
0.12 |
|
|
|
0.37 |
|
|
|
0.29 |
|
|
|
0.28 |
|
|
|
0.44 |
|
|
|
0.46 |
|
Net realized and unrealized gains (losses) |
|
|
0.25 |
|
|
|
0.11 |
|
|
|
4.32 |
|
|
|
(3.05 |
) |
|
|
0.42 |
|
|
|
(0.49 |
) |
Total from investment operations |
|
|
0.37 |
|
|
|
0.48 |
|
|
|
4.61 |
|
|
|
(2.77 |
) |
|
|
0.86 |
|
|
|
(0.03 |
) |
Distributions to Common Stockholders |
|
|
|
|
|
|
|
|
|
|
|
|
|
|
|
|
|
|
|
|
|
|
|
|
Net investment income |
|
|
(0.31 |
) |
|
|
(0.41 |
) |
|
|
(0.53 |
) |
|
|
(0.17 |
) |
|
|
(0.29 |
) |
|
|
(0.44 |
) |
Return of capital |
|
|
— |
|
|
|
(0.17 |
) |
|
|
(0.03 |
) |
|
|
(0.69 |
) |
|
|
(1.10 |
) |
|
|
(0.95 |
) |
Total distributions to common stockholders |
|
|
(0.31 |
) |
|
|
(0.58 |
) |
|
|
(0.56 |
) |
|
|
(0.86 |
) |
|
|
(1.39 |
) |
|
|
(1.39 |
) |
Organizational and Offering costs on issuance of common stock |
|
|
— |
|
|
|
— |
|
|
|
— |
|
|
|
— |
|
|
|
— |
|
|
|
— |
|
Premiums less commissions and offering costs on issuance of common stock |
|
|
— |
|
|
|
— |
|
|
|
— |
|
|
|
0.02 |
(2) |
|
|
0.05 |
(2) |
|
|
0.02 |
(2) |
Total capital stock transactions |
|
|
— |
|
|
|
— |
|
|
|
— |
|
|
|
0.02 |
|
|
|
0.05 |
|
|
|
0.02 |
|
Net asset value, end of year/period |
|
$ |
10.95 |
|
|
$ |
10.89 |
|
|
$ |
10.99 |
|
|
$ |
6.94 |
|
|
$ |
10.55 |
|
|
$ |
11.03 |
|
Per common share market value, end of year/period |
|
$ |
10.16 |
|
|
$ |
10.13 |
|
|
$ |
10.30 |
|
|
$ |
5.98 |
|
|
$ |
11.79 |
|
|
$ |
11.08 |
|
Total investment return based on market value (3) |
|
|
3.29 |
% |
|
|
4.04 |
% |
|
|
82.84 |
% |
|
|
(43.27 |
)% |
|
|
20.99 |
% |
|
|
(5.57 |
)% |
Total investment return based on net asset value (4) |
|
|
3.33 |
% |
|
|
4.36 |
% |
|
|
67.61 |
% |
|
|
(26.93 |
)% |
|
|
8.70 |
% |
|
|
(0.32 |
)% |
See accompanying Notes to Financial Statements | April 30, 2023 | Semi-Annual Report |
14 |
Miller/Howard High Income Equity Fund
Financial Highlights (continued)
| |
|
For the
six months
ended |
|
|
For the period/year ended |
|
| |
|
April 30, 2023
(Unaudited) |
|
|
October 31,
2022 |
|
|
October 31,
2021 |
|
|
October 31,
2020 |
|
|
October 31,
2019 |
|
|
October 31,
2018 |
|
Supplemental Data and Ratios |
|
|
|
|
|
|
|
|
|
|
|
|
|
|
|
|
|
|
|
|
|
|
|
|
Net assets applicable to common stockholders, end of year/period (000’s) |
|
$ |
204,591 |
|
|
$ |
203,461 |
|
|
$ |
205,439 |
|
|
$ |
129,777 |
|
|
$ |
186,905 |
|
|
$ |
165,339 |
|
Ratio of expenses to average net assets |
|
|
2.67 |
%(7) |
|
|
2.34 |
% |
|
|
2.19 |
% |
|
|
2.39 |
% |
|
|
2.51 |
% |
|
|
2.33 |
% |
Ratio of net investment income to average net assets |
|
|
2.18 |
%(7) |
|
|
3.26 |
% |
|
|
2.85 |
% |
|
|
3.39 |
% |
|
|
4.05 |
% |
|
|
3.90 |
% |
Ratio of interest expense to average net assets |
|
|
1.10 |
%(7) |
|
|
0.42 |
% |
|
|
0.21 |
% |
|
|
0.30 |
% |
|
|
0.64 |
% |
|
|
0.45 |
% |
Borrowings outstanding (000’s) |
|
$ |
14,000 |
|
|
$ |
44,500 |
|
|
$ |
50,500 |
|
|
$ |
32,300 |
|
|
$ |
37,500 |
|
|
$ |
37,500 |
|
Asset coverage per $1,000 of indebtedness (5) |
|
$ |
15,614 |
|
|
$ |
5,572 |
|
|
$ |
5,068 |
|
|
$ |
5,018 |
|
|
$ |
5,984 |
|
|
$ |
5,409 |
|
Portfolio turnover rate |
|
|
54 |
%(6) |
|
|
116 |
% |
|
|
155 |
% |
|
|
277 |
% |
|
|
166 |
% |
|
|
100 |
% |
|
(1)
|
Information presented relates to a share of common stock outstanding for the entire period. Calculated using average shares outstanding method.
|
|
(2)
|
Represents the premium on the at the market offering of $0.028, $0.076, and $0.046 per share, respectively, less underwriting and offering costs of $0.009, $0.028, and $0.027, respectively, per share for the years ended October 31, 2020, October 31, 2019, and October 31, 2018.
|
|
(3)
|
Total investment return is calculated assuming a purchase of common stock at the beginning of the period (or initial public offering price) and a sale at the closing price on the last day of the period reported (excluding brokerage commissions). The calculation also assumes reinvestment of distributions at actual prices pursuant to the Fund’s dividend reinvestment plan.
|
|
(4)
|
Total investment return is calculated assuming a purchase of common stock at the net asset value at the beginning of the period (or initial public offering price) and a sale at the net asset value on the last day of the year reported. The calculation also assumes reinvestment of distributions at actual prices pursuant to the Fund’s dividend reinvestment plan.
|
|
(5)
|
Asset coverage per $1,000 indebtedness is calculated by subtracting the Fund’s liabilities and indebtedness not represented by senior securities from the Fund’s total assets, dividing the result by the aggregate amount of the Fund’s senior securities representing indebtedness then outstanding, and multiplying the result by 1,000.
|
15 |
Semi-Annual Report | April 30, 2023 | See accompanying Notes to Financial Statements |
Miller/Howard High Income Equity Fund
Notes to Financial Statements
April 30, 2023
(Unaudited)
1. Organization
Miller/Howard High Income Equity Fund (the “Fund”) was formed as a Delaware statutory trust on April 21, 2011, and is registered under the Investment Company Act of 1940 (the “1940 Act”) as a closed-end, diversified management investment company. The Fund is managed by Miller/Howard Investments, Inc. (“Adviser”). The Fund commenced operations on November 24, 2014. The Fund’s stock is listed on the New York Stock Exchange under the symbol “HIE.”
The Fund will terminate on November 24, 2024, absent shareholder approval to extend such term. If the Fund’s Board of Trustees (“Board”) believes that under the current market conditions it is in the best interest of the Fund’s shareholders to do so, the Board may extend the termination date for one year, to November 24, 2025, without a shareholder vote upon the affirmative vote of three-quarters of the Board’s trustees then in office.
The Fund’s primary investment objective is to seek a high level of current income. As a secondary objective the Fund seeks capital appreciation when consistent with its primary investment objective. There can be no assurance that the Fund will achieve its investment objectives. The Fund will attempt to achieve its investment objectives by investing, under normal market conditions, at least 80% of its total assets in dividend or distribution paying equity securities of U.S. companies and non-U.S. companies traded on U.S. exchanges.
2. Significant Accounting Policies
The following is a summary of significant accounting policies followed by the Fund in preparation of its financial statements. The policies are in conformity with accounting principles generally accepted in the United States of America (“U.S. GAAP”). The Fund is an investment company and, accordingly, follows the investment company accounting and reporting guidance of the Financial Accounting Standards Board (“FASB”) Accounting Standards Codification (“ASC”) Topic 946, Investment Companies.
A. Use of Estimates
The preparation of financial statements in conformity with U.S. GAAP requires management to make estimates and assumptions that affect the reported amount of assets and liabilities, recognition of distribution income and disclosure of contingent assets and liabilities at the date of the financial statements. Actual results could differ from those estimates.
B. Security Valuation
Portfolio securities are valued at their current market value determined on the basis of market quotations or, if market quotations are not readily available or are deemed unreliable, at “fair value” as determined in accordance with procedures established by and under the general supervision of the Fund’s Board.
April 30, 2023 | Semi-Annual Report |
16 |
Miller/Howard High Income Equity Fund
Notes to Financial Statements (continued)
April 30, 2023
(Unaudited)
In general, the market values of securities which are readily available and deemed reliable are determined as follows: securities listed on a national securities exchange (other than securities listed on the NASDAQ Stock Market, Inc. (“NASDAQ”)) or on a foreign securities exchange are valued at the last sale price at the close of the exchange or foreign securities exchange. If there has been no sale on such day, the securities are valued at the mean price. Securities listed on more than one exchange are valued by reference to the principal exchange on which the securities are traded; securities listed only on NASDAQ are valued in accordance with the NASDAQ Official Closing Price; listed or over the counter (“OTC”) market put or call options are valued at the mid level between the current bid and ask prices. If either a current bid or current ask price is unavailable, the Adviser will have discretion to determine the best valuation (e.g., last trade price in the case of listed options).
Other securities may be valued on the basis of prices provided by a pricing service or at a price obtained from one or more of the major broker-dealers. In cases where broker-dealer quotes are obtained, the Adviser may establish procedures whereby changes in market yields or spreads are used to adjust, on a daily basis, a recently obtained quoted price on a security.
Securities for which market quotations are not readily available (including restricted securities) or are deemed unreliable are valued at fair value. Factors considered in making this determination may include, but are not limited to, information obtained by contacting the issuer, analysts, and analysis of the issuer’s financial statements or other available documents. In addition, the Fund may use fair value pricing for securities primarily traded in non-U.S. markets because most foreign markets close well before the Fund values its securities at 4:00 p.m., Eastern Time. The earlier close of these foreign markets gives rise to the possibility that significant events, including broad market moves, may have occurred in the interim and may materially affect the value of those securities.
The global outbreak of COVID-19 (commonly referred to as “coronavirus”) has disrupted economic markets and the prolonged economic impact is uncertain. The ultimate economic fallout from the pandemic, and the long-term impact on economies, markets, industries and individual issuers, are not known. The operational and financial performance of the issuers of securities in which the Fund invests depends on future developments, including the duration and spread of the outbreak, and such uncertainty may in turn adversely affect the value and liquidity of the Fund’s investments, and negatively impact the Fund’s performance.
C. Fair Value Measurement
Fair value is defined as the price that would be received to sell an asset or paid to transfer a liability in an orderly transaction between market participants at the measurement date. A three-tier hierarchy is utilized to maximize the use of observable market data and minimize the use of unobservable inputs and to establish classification of fair value measurements for disclosure purposes. Inputs refer broadly to the assumptions that market participants would use in pricing
17 |
Semi-Annual Report | April 30, 2023 |
Miller/Howard High Income Equity Fund
Notes to Financial Statements (continued)
April 30, 2023
(Unaudited)
the asset or liability, including assumptions about risk. For example, market participants would consider the risk inherent in a particular valuation technique used to measure fair value, such as a pricing model, and/or the risk inherent in the inputs to the valuation technique. Inputs may be observable or unobservable. Observable inputs are inputs that reflect the assumptions market participants would use in pricing the asset or liability and are developed based on market data obtained from sources independent of the reporting entity. Unobservable inputs are inputs that reflect the reporting entity’s own assumptions about the assumptions market participants would use in pricing the asset or liability and are developed based on the best information available in the circumstances. The three-tier hierarchy of inputs is summarized in the three broad levels listed below.
Level 1 – quoted prices in active markets for identical securities
Level 2 – other significant observable inputs (including quoted prices for similar securities, interest rates, prepayment speeds, credit risk, etc.)
Level 3 – significant unobservable inputs (including the Fund’s own assumptions in determining the fair value of investments)
The availability of observable inputs can vary from security to security and is affected by a wide variety of factors, including, for example, the type of security, whether the security is new and not yet established in the marketplace, the liquidity of markets, and other characteristics particular to the security. To the extent that valuation is based on models or inputs that are less observable or unobservable in the market, the determination of fair value requires more judgment. Accordingly, the degree of judgment exercised in determining fair value is greatest for instruments categorized in level 3.
The inputs used to measure fair value may fall into different levels of the fair value hierarchy. In such cases, for disclosure purposes, the level in the fair value hierarchy within which the fair value measurement falls in its entirety is determined based on the lowest level input that is significant to the fair value measurement in its entirety.
April 30, 2023 | Semi-Annual Report |
18 |
Miller/Howard High Income Equity Fund
Notes to Financial Statements (continued)
April 30, 2023
(Unaudited)
As of April 30, 2023, the Fund’s assets and liabilities carried at market value were classified as follows:
Investments in Securities(a) |
|
Total |
|
|
Level 1 |
|
|
Level 2 |
|
|
Level 3 |
|
Assets |
|
|
|
|
|
|
|
|
|
|
|
|
|
|
|
|
Business Development Companies |
|
$ |
5,296,000 |
|
|
$ |
5,296,000 |
|
|
$ |
— |
|
|
$ |
— |
|
Common Stock |
|
|
156,932,894 |
|
|
|
156,932,894 |
|
|
|
— |
|
|
|
— |
|
Master Limited Partnerships |
|
|
32,039,600 |
|
|
|
32,039,600 |
|
|
|
— |
|
|
|
— |
|
Real Estate Investment Trusts |
|
|
21,190,600 |
|
|
|
21,190,600 |
|
|
|
— |
|
|
|
— |
|
Short-Term Investment(b) |
|
|
1,199,835 |
|
|
|
1,199,835 |
|
|
|
— |
|
|
|
— |
|
Investments Purchased as Securities Lending Collateral(c) |
|
|
48,033,869 |
|
|
|
— |
|
|
|
— |
|
|
|
— |
|
Total Investment in Securities |
|
$ |
264,692,798 |
|
|
$ |
216,658,929 |
|
|
$ |
— |
|
|
$ |
— |
|
|
(a)
|
All industry classifications are identified in the Schedule of Investments.
|
|
(b)
|
Short-term investment is a sweep investment for cash balances in the Fund at April 30, 2023.
|
|
(c)
|
Certain investments that are measured at fair value using the net asset value per share (or its equivalent) have not been categorized in the fair value hierarchy in accordance with ASC 820. The fair value amounts presented in the table are intended to permit reconciliation of the fair value hierarchy to the amounts presented in the Statement of Assets and Liabilities.
|
The Fund did not hold any Level 3 Securities during the period ended April 30, 2023.
D. Security Transactions and Investment Income
Security transactions are accounted for on the date the securities are purchased or sold (trade date). Realized gains and losses are reported on a specific identified cost basis. Interest income is recognized on the accrual basis. Dividend income and distributions are recognized on the ex-dividend date, and withholding taxes on foreign dividends have been provided for in accordance with the Fund’s understanding of the applicable country’s tax rules and rates.
The Fund may hold the securities of real estate investments trusts (“REITs”). Distributions from such investments may include income, capital gains and return of capital. The Fund may also hold the securities of master limited partnerships (“MLPs”). Distributions from such investments may include income and return of capital. The actual character of amounts received during the year is not known until after the REIT and MLP fiscal year ends. The Fund records the character of distributions received from REITs and MLPs during the year based on estimates available. The characterization of distributions received by the Fund may be subsequently revised based on the information received from the REITs and MLPs after their tax reporting periods conclude.
19 |
Semi-Annual Report | April 30, 2023 |
Miller/Howard High Income Equity Fund
Notes to Financial Statements (continued)
April 30, 2023
(Unaudited)
E. Foreign Currency Translation
The books and records of the Fund are maintained in U.S. dollars. Foreign currency transactions are translated into U.S. dollars on the following basis: (i) market value of investment securities, assets and liabilities at the daily rates of exchange, and (ii) purchases and sales of investment securities, dividend and interest income, and certain expenses at the rates of exchange prevailing on the respective dates of such transactions. For financial reporting purposes, the Fund does not isolate changes in the exchange rate of investment securities from the fluctuations arising from changes in the market prices of securities. However, for Federal income tax purposes, the Fund does isolate and treat as ordinary income the effect of changes in foreign exchange rates on realized gain or loss from the sale of investment securities, and payables and receivables arising from trade-date and settlement-date differences.
F. Dividends and Distributions to Shareholders
The Fund intends to make regular monthly cash distributions of all or a portion of its investment company taxable income (which includes ordinary income and short-term capital gains) to common shareholders. The Fund also intends to make annual distributions of its “net capital gain” (which is the excess of net long-term capital gains over net short-term capital losses). The Fund will pay common shareholders annually at least 90% of its investment company taxable income. Various factors will affect the level of the Fund’s investment company taxable income, such as its asset mix. To permit the Fund to maintain more stable monthly distributions, the Fund may from time to time distribute less than the entire amount of income earned in a particular period, which would be available to supplement future distributions. As a result, the distributions paid by the Fund for any particular monthly period may be more or less than the amount of income actually earned by the Fund during that period.
Dividends from net investment income and distributions from realized gains from investment transactions have been determined in accordance with Federal income tax regulations and may differ from net investment income and realized gains recorded by the Fund for financial reporting purposes. These differences, which could be temporary or permanent in nature may result in reclassification of distributions; however, net investment income, net realized gains and losses, and net assets are not affected.
G. Federal Income Taxation
The Fund has elected to be treated as, and to qualify each year for special tax treatment afforded to, a regulated investment company (“RIC”) under Subchapter M of the Internal Revenue Code (“IRC”). In order to qualify as a RIC, the Fund must, among other things, satisfy income, asset diversification and distribution requirements. As long as it so qualifies, the Fund will not be subject to U.S. federal income tax to the extent that it distributes annually its investment company taxable income and its net capital gain. The Fund intends to distribute at least annually all or substantially all of such income and gain. If the Fund retains any investment company
April 30, 2023 | Semi-Annual Report |
20 |
Miller/Howard High Income Equity Fund
Notes to Financial Statements (continued)
April 30, 2023
(Unaudited)
taxable income or net capital gain, it will be subject to U.S. federal income tax on the retained amount at regular corporate tax rates. In addition, if the Fund fails to qualify as a RIC for any taxable year, it will be subject to U.S. federal income tax on all of its income and gains at regular corporate tax rates.
H. Derivative Financial Instruments
The Fund provides disclosure regarding derivatives and hedging activity to allow investors to understand how and why the Fund uses derivatives, how derivatives are accounted for, and how derivative instruments affect the Fund’s results of operations and financial position.
The Fund occasionally sells (“writes”) put options on securities already held in its portfolio or securities that are candidates for inclusion in the portfolio. The strategy is designed to provide the Fund with the ability to acquire securities that the Adviser is interested in at attractive valuations while generating realized gains from premiums as a means to enhance distributions.
The Fund may occasionally purchase put options. A purchaser of a put option has the right, but not the obligation, to sell the underlying instrument at an agreed upon price (“strike price”) to the option seller.
The Fund occasionally sells (“writes”) call options on securities already held in its portfolio. The strategy is designed to generate realized gains from premiums as a means to enhance distributions.
The Fund may occasionally purchase call options. A purchaser of a call option has the right, but not the obligation, to purchase the underlying instrument at the strike price from the option seller.
Written Options – Premiums received by the Fund for written options are included in the Statement of Assets and Liabilities. The amount of the liability is adjusted daily to reflect the fair value of the written option and any change in fair value is recorded as unrealized appreciation (depreciation). Premiums received from written options that expire are treated as realized gains. The Fund records a realized gain (loss) on written options based on whether the cost of the closing transaction exceeds the premium received. If a call option is exercised by the option buyer, the premium received by the Fund is added to the proceeds from the sale of the underlying security to the option buyer and compared to the cost of the closing transaction to determine whether there has been a realized gain or loss. If a put option is exercised by an option buyer, the premium received by the option seller reduces the cost basis of the purchased security.
Written uncovered call options subject the Fund to unlimited risk of loss. Written covered call options limit the upside potential of a security above the strike price. Put options written subject the Fund to risk of loss if the value of the security declines below the exercise price.
21 |
Semi-Annual Report | April 30, 2023 |
Miller/Howard High Income Equity Fund
Notes to Financial Statements (continued)
April 30, 2023
(Unaudited)
Purchased Options – Premiums paid by the Fund for purchased options are included in the Statement of Assets and Liabilities as an investment. The option is adjusted daily to reflect the fair value of the option and any change in fair value is recorded as unrealized appreciation or depreciation of investments. If the option is allowed to expire, the Fund will lose the entire premium paid and record a realized loss for the premium amount. Premiums paid for purchased options which are exercised or closed are added to the amounts paid or offset against the proceeds on the underlying investment transaction to determine the realized gain/loss or cost basis of the security.
The Fund has adopted the disclosure provision of FASB ASC 815, Derivatives and Hedging. ASC 815 requires enhanced disclosures about the Fund’s use of and accounting for derivative instruments and the effect of derivative instruments on the Fund’s results of operations and financial position. Tabular disclosure regarding derivative fair value and gain/loss by contract type (e.g., interest rate contracts, foreign exchange contracts, credit contracts, etc.) is required and derivatives accounted for as hedging instruments under ASC 815 must be disclosed separately from those that do not qualify for hedge accounting. Even though the Fund may use derivatives in an attempt to achieve an economic hedge, the Fund’s derivatives are not accounted for as hedging instruments under ASC 815.
The following table presents the effect of derivatives on the Statement of Operations for the period ended April 30, 2023:
Derivatives not accounted for as
hedging instruments under ASC 815 |
|
Location of
Gains (Losses) on
Derivatives |
|
|
Net Realized
Gain (Loss) on
Derivatives |
|
|
Net Change
in Unrealized
Appreciation
(Depreciation) on
Derivatives |
|
Written equity options |
|
|
Options |
|
|
$ |
1,060,863 |
|
|
$ |
0 |
|
The average monthly notional value of written options for the Fund for the period ended April 30, 2023 was $4,351,963.
3. Concentration of Risk
The Fund’s investment objective is to seek a high level of current income. Under normal conditions, the Fund will have at least 80% of its total assets (including any assets obtained through leverage) invested in dividend or distribution paying equity securities of U.S. companies and non-U.S. companies traded on U.S. exchanges. Equity securities the Fund may invest in include common stocks, preferred stocks, convertible securities, warrants, depository receipts and equity interests in trust and other entities. The Fund may also invest up to 25% of its total assets in securities of MLPs.
April 30, 2023 | Semi-Annual Report |
22 |
Miller/Howard High Income Equity Fund
Notes to Financial Statements (continued)
April 30, 2023
(Unaudited)
4. Agreements and Related Party Transactions
The Fund has entered into an Investment Advisory Agreement (the “Agreement”) with the Adviser. Under the terms of the Agreement, the Fund in the period ended April 30, 2023 paid the Adviser a fee equal to an annual rate of 0.90% of the Fund’s average weekly Managed Assets (defined as the average weekly total assets minus all accrued expenses incurred in the normal course of operations other than liabilities or obligations attributable to investment leverage, including, without limitation, investment leverage obtained though (i) indebtedness of any type (including, without limitation, borrowing through a credit facility or the issuance of debt securities), (ii) the issuance of preferred stock or other similar preference securities and/or (iii) the reinvestment of collateral received for securities loaned in accordance with the Fund’s investment objectives and policies). The Adviser earned $1,136,404 in advisory fees for the period ended April 30, 2023.
U.S. Bank Global Fund Services serves as the Fund’s administrator and fund accountant.
American Stock Transfer & Trust Company, LLC serves as the Fund’s transfer agent, registrar and dividend disbursing agent and agent for the automatic dividend reinvestment plan.
U.S. Bank, N.A. serves as the Fund’s custodian.
One of the Fund’s Trustees is an employee of the Adviser.
5. Income Taxes
The Fund intends to continue to qualify as a regulated investment company under Subchapter M of the Internal Revenue Code and distribute all or substantially all of its taxable income. Accordingly, no provision for federal income taxes is included in the financial statements.
The tax character of dividends paid to shareholders during the years ended October 31, 2021 and 2022, were as follows:
| |
Ordinary
Income |
Net
Long Term
Capital Gains |
Return of
Capital |
Total
Distributions
Paid |
2021 |
$9,839,524 |
$— |
$627,254 |
$10,466,778 |
2022 |
$7,714,433 |
$— |
$3,107,468 |
$10,821,901 |
The amount and character of income and capital gain distribution to be paid, if any, are determined in accordance with federal income tax regulations, which may differ from U.S. GAAP. These differences could be temporary or permanent in nature. To the extent these differences are permanent in nature, such differences are reclassified at the end of the fiscal year among
23 |
Semi-Annual Report | April 30, 2023 |
Miller/Howard High Income Equity Fund
Notes to Financial Statements (continued)
April 30, 2023
(Unaudited)
accumulated losses and paid-in capital. Accordingly, on October 31, 2022, accumulated losses were decreased by $193,572 and paid-in capital was decreased by $193,572. This reclassification has no effect on the net assets of the Fund.
The following information is provided on a tax basis as of October 31, 2022:
Cost of investments |
|
$ |
298,321,255 |
|
Unrealized appreciation |
|
$ |
22,318,298 |
|
Unrealized depreciation |
|
$ |
(23,906,257 |
) |
Net unrealized appreciation (depreciation) |
|
$ |
(1,587,959 |
) |
Undistributed ordinary income |
|
|
— |
|
Undistributed long term gains |
|
|
— |
|
Distributable earnings |
|
|
— |
|
Other accumulated gain/(loss) |
|
$ |
(34,167,023 |
) |
Total accumulated gain/(loss) |
|
$ |
(35,754,982 |
) |
At October 31, 2022 the Fund had capital loss carry forwards for federal income tax purposes available to offset future capital gains as follows:
| |
|
Non-Expiring |
|
Short-Term |
|
$ |
8,534,050 |
|
Long-Term |
|
$ |
25,632,973 |
|
Total |
|
$ |
34,167,023 |
|
The Fund utilized $16,401,201 of capital loss carry forwards during the fiscal year.
The Fund recognizes the tax benefits of uncertain tax positions only where the position is “more likely than not” to be sustained assuming examination by tax authorities. Management has analyzed the Fund’s tax positions, and has concluded that no liability for unrecognized tax benefits should be recorded related to uncertain tax positions expected to be taken on U.S. tax returns and state tax returns of the Fund. The tax years 2019 through 2022 are open to examination by the tax authorities in the United States. The Fund is not aware of any tax positions for which it is reasonably possible that the total amounts of unrecognized tax benefits will change materially in the next 12 months. It is the Fund’s policy to record interest and penalties related to uncertain tax benefits as a component of income taxes, as appropriate.
6. Investment Transactions
For the year ended April 30, 2023, the Fund purchased (at cost) and sold securities (proceeds received) in the amount of $131,317,547 and $147,477,023 (excluding short-term securities), respectively.
April 30, 2023 | Semi-Annual Report |
24 |
Miller/Howard High Income Equity Fund
Notes to Financial Statements (continued)
April 30, 2023
(Unaudited)
7. Common Stock
The Fund has unlimited shares of capital stock authorized and 18,690,675 shares outstanding at April 30, 2023. There were no transactions in common stock for the period ended April 30, 2023.
8. Special Custody Account Agreement
On September 19, 2017, the Fund entered into a $50,000,000 Special Custody Account Agreement (“Agreement”) with Interactive Brokers LLC (“Interactive Brokers”). The following shows the key terms of this agreement:
Loan Amount |
Interest Rate |
$0-$100,000 |
Federal Funds Rate + 1.50% |
$100,000.01-$1,000,000 |
Federal Funds Rate + 1.00% |
$1,000,000.01-$50,000,000 |
Federal Funds Rate + 0.75% |
$50,000,000.01+ |
Federal Funds Rate + 0.50% |
The average principal balance and interest rate for the period ended April 30, 2023 were $42,219,562 and 5.15%, respectively. On March 16, 2021, the Agreement was amended to increase the borrowing limit to $65,000,000. At April 30, 2023, the principal balance outstanding was $14,000,000 at an interest rate of 5.68%. The Fund may borrow up to an additional $51,000.000 under the Agreement.
Under the terms of the Agreement, the outstanding principal balance must be collateralized with securities of the Fund in an amount as specified in the Agreement. In addition, the Fund must maintain asset coverage required under the 1940 Act. If the Fund fails to maintain the required asset coverage, it may be required to repay a portion of an outstanding balance until the coverage requirement has been met. At April 30, 2023, the Fund was in compliance with the terms of the Agreement.
9. Securities Lending
The Fund may lend up to 33 1/3% of the value of the securities in its portfolio to brokers, dealers and financial institutions (but not individuals) under terms of participation in a securities lending program administered by U.S. Bank N.A. (“the Custodian”). The securities lending agreement requires that loans are collateralized at all times in an amount equal to at least 102% of the value of any loaned securities at the time of the loan, plus accrued interest. The fund receives income from securities lending from fees paid to the Fund by the borrowers and/or from the reinvestment of the cash collateral. Funds typically compensate their lending agents with a share of the revenue generated by the lending program, and may pay lending agents an additional fee for managing the cash collateral reinvestment. The amount of security lending income depends on a number of factors including the type of security and length of the loan. The Fund continues to receive dividends on the securities loaned during the borrowing period.
25 |
Semi-Annual Report | April 30, 2023 |
Miller/Howard High Income Equity Fund
Notes to Financial Statements (continued)
April 30, 2023
(Unaudited)
Gain or loss in the fair value of securities loaned that may occur during the term of the loan will be for the account of the Fund. The Fund has the right under the terms of the securities lending agreement to recall the securities from the borrower on demand. The cash collateral is invested by the Custodian in accordance with approved investment guidelines. Those guidelines require the cash collateral to be invested in readily marketable, high quality, short-term obligations; however, such investments are subject to risk of payment delays or default on the part of the issuer or counterparty or otherwise may not generate sufficient interest to support the cost associated with lending. The Fund could also experience delays in recovering its securities and possible loss of income or value if the borrower fails to return the borrowed securities, although the Fund is indemnified from these risks by contract with the Custodian.
As of April 30, 2023, the value of securities on loan and payable for collateral due to broker were $47,227,835 and $48,033,869, respectively.
The cash collateral received was invested in the Mount Vernon Liquid Assets Portfolio, LLC (“Portfolio”) as shown on the Schedule of Investments. The Portfolio is a private fund that invests in high-quality, short term investments, similar to a money market fund. However, the Portfolio is not registered with the Securities and Exchange Commission (“SEC”) and is not required to meet the regulatory requirements of a money market fund registered with the SEC. The Portfolio is only offered to participants in the Custodian’s security lending program.
10. Indemnifications
Under the Fund’s organizational documents, its officers and trustees are indemnified against certain liabilities arising out of the performance of their duties to the Fund. In addition, in the normal course of business, the Fund may enter into contracts that provide general indemnification to other parties. The Fund’s maximum exposure under these arrangements is unknown, as this would involve future claims that may be made against the Fund that have not yet occurred, and may not occur.
11. Subsequent Events
In preparing these financial statements, the Fund has evaluated events and transactions through the date of issuance for potential recognition or disclosure resulting from subsequent events. This evaluation did not result in any subsequent events that necessitated disclosures and/or adjustments to the financial statements.
April 30, 2023 | Semi-Annual Report |
26 |
Miller/Howard High Income Equity Fund
Additional Information
April 30, 2023
(Unaudited)
Trustees and Officers Compensation
The Fund does not compensate any of its trustees who are “interested persons,” as defined in Section 2(a)(19) of the 1940 Act. For the period ended April 30, 2023, the aggregate compensation paid by the Fund to the independent trustees was $61,500. The Fund did not pay any special compensation to any of its trustees or officers. Further, Mr. Paul Kazarian has agreed to serve as an Independent Trustee of the Fund without compensation from the Fund or the Fund Complex.
Forward-Looking Statements
This report contains “forward-looking statements” within the meaning of the Securities Act of 1933 and the Securities Exchange Act of 1934. By their nature, all forward-looking statements involve risks and uncertainties, and actual results could differ materially from those contemplated by the forward-looking statements. Several factors that could materially affect the Fund’s actual results are the performance of the portfolio of investments held by it, the conditions in the U.S. and international financial markets, the price at which shares of the Fund will trade in the public markets and other factors discussed in filings with the SEC.
Proxy Voting Policies
The Board of Trustees of the Fund has delegated the voting of proxies for Fund securities to the Adviser pursuant to the Adviser’s proxy voting policies and procedures. Under these policies and procedures, the Adviser will vote proxies related to Fund securities in the best interests of the Fund and its shareholders.
A description of the policies and procedures the Fund used to determine how to vote proxies relating to portfolio securities owned by the Fund is available without charge upon request by calling the Fund at (845) 679-9166. Information regarding how the Fund voted the proxies related to the portfolio of securities during the period ended June 30 is available without charge by accessing this information on the SEC’s web site at www.sec.gov.
Availability of Quarterly Portfolio Holdings Schedule
The Fund files a complete schedules of portfolio holdings with the SEC for its first and third fiscal quarters as an exhibit to their reports on Form N-PORT. The Fund’s filings on Form N-PORT are available without charge, upon request on the SEC’s website (http://www.sec.gov) and by calling (845) 679-9166.
Prospectus and Statement of Additional Information (“SAI”)
The SAI includes additional information about the Fund and is available upon request without charge by calling the Fund at (845) 679-9166 or by visiting the SEC’s web site at www.sec.gov.
27 |
Semi-Annual Report | April 30, 2023 |
Miller/Howard High Income Equity Fund
Additional Information (continued)
April 30, 2023
(Unaudited)
Repurchase of Securities
Notice is hereby given in accordance with Section 23(c) of the Investment Company Act of 1940 that the Fund may from time to time purchase its shares of common stock in the open market when Fund shares are trading at a discount from their net asset value.
Certifications
The Fund’s President submitted to the New York Stock Exchange (“NYSE”) the annual CEO certification as required by Section 303A.12(a) of the NYSE Listed Fund Manual.
Net Asset Value
The Net Asset Value per share appears in the Publicly Traded Funds column, under the heading “World Equity Funds,” in Monday’s The Wall Street Journal. It is also listed in Barron’s Mutual Funds/Closed End Funds section under the heading “World Equity Funds.”
The Nasdaq symbol for the Net Asset Value per share is “XHIEX.” The Net Asset Value per share may be obtained each day by calling the Fund at (845) 679-9166.
Automatic Dividend Reinvestment Plan (the “Fund’s Plan”)
Many of you have questions about the Fund’s Automatic Dividend Reinvestment Plan. We urge shareholders who want to take advantage of the Fund’s Plan and whose shares are held in “Street Name,” to consult your financial advisor about participating in the Fund’s Plan.
Under the Fund’s Automatic Dividend Reinvestment Plan, a shareholder whose common shares are registered in his or her own name will have all distributions reinvested automatically by American Stock Transfer & Trust Company, LLC, the Fund’s Transfer Agent, unless the shareholder elects to receive cash. Distributions with respect to shares registered in the name of a broker-dealer or other nominee (that is, in “street name”) will be reinvested by the broker or nominee in additional shares under the Fund’s Plan, unless the service is not provided by the broker or nominee or the shareholder elects to receive dividends and distributions in cash. Investors who own common shares registered in street name should consult their broker-dealers for details regarding reinvestment. A participant in the Fund’s Plan may elect to receive all dividends in cash by contacting American Stock Transfer & Trust Company, LLC (the “Plan agent”) in writing at the address specified on the back cover or by calling the Plan agent at 1(800) 278-4353. Under the Fund’s Plan, whenever the market price of the common shares, including brokerage commissions, is equal to or exceeds net asset value at the time shares are valued for purposes of determining the number of shares equivalent to the cash distribution, participants in the Fund’s Plan will receive newly issued common shares. The number of shares to be issued will be computed at a per share rate equal to the greater of (i) the net asset value as most recently determined or (ii) 95% of the then-current market price of the common shares. The valuation date is the distribution payment date or, if that date is not a trading day on the NYSE, the next trading day. If the net asset value of the common shares at the time of valuation exceeds the
April 30, 2023 | Semi-Annual Report |
28 |
Miller/Howard High Income Equity Fund
Additional Information (continued)
April 30, 2023
(Unaudited)
market price of the common shares, participants will receive shares purchased by the Fund’s Plan agent in the open market. If the Fund should declare a distribution payable only in cash, the Plan agent will buy the common shares for the Fund’s Plan in the open market, on the NYSE or elsewhere, for the participants’ accounts, except that the Plan agent will terminate purchases in the open market and instead the Fund will distribute newly issued shares at a per share rate equal to the greater of net asset value or 95% of market value if, following the commencement of such purchases, the market value of the common shares plus estimated brokerage commissions exceeds net asset value. The automatic reinvestment of dividends and other distributions will not relieve participants of any U.S. federal, state or local income tax that may be payable (or required to be withheld) on such dividends or other distributions.
29 |
Semi-Annual Report | April 30, 2023 |
Miller/Howard High Income Equity Fund
Privacy Policy
(Unaudited)
Privacy Policy
In order to conduct its business, Miller/Howard High Income Equity Fund, through its transfer agent, American Stock Transfer & Trust Company, LLC, collects and maintains certain nonpublic personal information about its shareholders of record with respect to transactions in shares of the Fund’s securities. This information includes the shareholder’s name and address, taxpayer identification number, share ownership and/or history, and dividend elections. The Fund does not collect or maintain personal information about its shareholders whose shares are held in “street name” by a financial institution such as a bank or broker.
The Fund does not disclose any nonpublic personal information about the Fund’s shareholders or former shareholders to third parties unless necessary to process a transaction, service an account or as otherwise permitted by law.
To protect your personal information, the Fund restricts access to nonpublic personal information about the Fund’s shareholders to those employees who need to know that information to provide services to the Fund’s shareholders. The Fund also maintains physical, electronic and procedural safeguards to protect your nonpublic personal information.
April 30, 2023 | Semi-Annual Report |
30 |
(This page intentionally left blank)
31 |
Semi-Annual Report | April 30, 2023 |
Miller/Howard High Income Equity Fund
Trustees and Officers
James E. Hillman,
Chairman of the Board
Roger Conrad,
Independent Trustee
Charles I. Leone,
Independent Trustee
Mayra Martinez-Sacco,
Independent Trustee
Paul Kazarian
Independent Trustee
Catherine Johnston,
President and Trustee
Charles Atkins,
Chief Compliance Officer
Brian Helhoski,
Chief Financial Officer
Gregory Powell,
Vice President
Eva Horowitz,
Secretary
|
Investment Advisor
Miller/Howard Investments, Inc.
P.O. Box 1598
Kingston, NY 12402
Legal Counsel
Shearman & Sterling LLP
599 Lexington Avenue
New York, NY 10022
Custodian
U.S. Bank, N.A.
1555 N. Rivercenter Drive, Suite 302
Milwaukee, WI 53202
Transfer Agent
American Stock Transfer & Trust Company, LLC
6201 15th Avenue
Brooklyn, NY 11219
Fund Administrator
U.S. Bank Global Fund Services
777 E. Wisconsin Avenue
Milwaukee, WI 53202
Independent Registered Public Accounting Firm
Deloitte & Touche LLP
555 E. Wells Street
Suite 1400
Milwaukee, WI 53202
|

Item 2. Code of Ethics.
Not applicable for semi-annual reports.
Item 3. Audit Committee Financial Expert.
Not applicable for semi-annual reports.
Item 4. Principal Accountant Fees and Services.
Not applicable for semi-annual reports.
Item 5. Audit Committee of Listed Registrants.
Not applicable for semi-annual reports.
Item 6. Investments.
| (a) | Schedule of Investments is included as part of the report to shareholders filed under Item 1 of this Form. |
Item 7. Disclosure of Proxy Voting Policies and
Procedures for Closed-End Management Investment Companies.
Not applicable for semi-annual reports.
Item 8. Portfolio Managers of Closed-End Management Investment Companies.
Not applicable for semi-annual reports.
Item 9. Purchases of Equity Securities by Closed-End
Management Investment Company and Affiliated Purchasers.
| Period |
(a)
Total Number of Shares (or Units) Purchased |
(b)
Average Price Paid per Share (or Unit) |
(c)
Total Number of Shares (or Units) Purchased as Part of Publicly Announced Plans or Programs |
(d)
Maximum Number (or Approximate Dollar Value) of Shares (or Units) that May Yet Be Purchased Under the Plans or Programs |
| Month #1 11/01/22-11/30/22 |
0 |
0 |
0 |
0 |
| Month #2 12/01/22-12/31/22 |
0 |
0 |
0 |
0 |
| Month #3 01/01/23-01/31/23 |
0 |
0 |
0 |
0 |
| Month #4 02/01/23-02/28/23 |
0 |
0 |
0 |
0 |
| Month #5 03/01/23-03/31/23 |
0 |
0 |
0 |
0 |
| Month #6 04/01/23-04/30/23 |
0 |
0 |
0 |
0 |
| Total |
0 |
0 |
0 |
0 |
Item 10. Submission of Matters to a Vote of Security Holders.
There have been no material changes to the procedures by which shareholders
may recommend nominees to the registrant’s board of trustees.
Item 11. Controls and Procedures.
| (a) | The Registrant’s President and Chief Financial Officer have reviewed the Registrant's disclosure controls and procedures (as
defined in Rule 30a-3(c) under the Investment Company Act of 1940 (the “Act”)) as of a date within 90 days of the filing of
this report, as required by Rule 30a-3(b) under the Act and Rules 13a-15(b) or 15d-15(b) under the Securities Exchange Act of 1934. Based
on their review, such officers have concluded that the disclosure controls and procedures are effective in ensuring that information required
to be disclosed in this report is appropriately recorded, processed, summarized and reported and made known to them by others within the
Registrant and by the Registrant’s service provider. |
| (b) | There were no changes in the Registrant's internal control over financial reporting (as defined in Rule 30a-3(d) under the Act) that
occurred during the second fiscal quarter of the period covered by this report that have materially affected, or are reasonably likely
to materially affect, the Registrant's internal control over financial reporting. |
Item 12. Disclosure of Securities Lending Activities for Closed-End
Management Investment Companies
Not applicable for semi-annual reports.
Item 13. Exhibits.
| (a) | (1) Any code of ethics or amendment thereto, that is the subject of the disclosure required by Item 2, to the extent that the registrant
intends to satisfy Item 2 requirements through filing an exhibit. Not Applicable |
(2) A separate certification for each principal executive
officer and principal financial officer pursuant to Section 302 of the Sarbanes-Oxley Act of 2002. Filed herewith.
(3) Any written solicitation to purchase securities under
Rule 23c-1 under the Act sent or given during the period covered by the report by or on behalf of the registrant to 10 or more persons.
Not applicable
(4) Change in the registrant’s independent public accountant.
There was no change in the registrant’s independent public accountant for the period covered by this report.
| (b) | Certifications pursuant to Section 906 of the Sarbanes-Oxley Act of 2002. Furnished herewith. |
SIGNATURES
Pursuant
to the requirements of the Securities Exchange Act of 1934 and the Investment Company Act of 1940, the registrant has duly caused
this report to be signed on its behalf by the undersigned, thereunto duly authorized.
| (Registrant) |
Miller/Howard High Income Equity Fund |
|
| |
|
|
| By (Signature and Title) |
/s/ Catherine Johnston |
|
| |
Catherine Johnston, President |
|
| |
|
|
| Date |
7/6/23 |
|
Pursuant
to the requirements of the Securities Exchange Act of 1934 and the Investment Company Act of 1940, this report has been signed
below by the following persons on behalf of the registrant and in the capacities and on the dates indicated.
| By (Signature and Title) |
/s/ Catherine Johnston |
|
| |
Catherine Johnston, President |
|
| |
|
|
| Date |
7/6/23 |
|
| |
|
|
| By (Signature and Title) |
/s/ Brian Helhoski |
|
| |
Brian Helhoski, Chief Financial Officer |
|
| |
|
|
| Date |
7/6/23 |
|
EX.99.CERT
CERTIFICATIONS
I, Catherine Johnston, certify that:
| 1. | I have reviewed this report on Form N-CSR of Miller/Howard High Income Equity Fund; |
| 2. | Based on my knowledge, this report does not contain any untrue statement of a material fact or omit to state a material fact necessary
to make the statements made, in light of the circumstances under which such statements were made, not misleading with respect to the period
covered by this report; |
| 3. | Based on my knowledge, the financial statements, and other financial information included in this report, fairly present in all material
respects the financial condition, results of operations, changes in net assets, and cash flows (if the financial statements are required
to include a statement of cash flows) of the registrant as of, and for, the periods presented in this report; |
| 4. | The registrant’s other certifying officer(s) and I are responsible for establishing and maintaining disclosure controls and
procedures (as defined in Rule 30a-3(c) under the Investment Company Act of 1940) and internal control over financial reporting (as defined
in Rule 30a-3(d) under the Investment Company Act of 1940) for the registrant and have: |
| (a) | Designed such disclosure controls and procedures, or caused such disclosure controls and procedures to be designed under our supervision,
to ensure that material information relating to the registrant, including its consolidated subsidiaries, is made known to us by others
within those entities, particularly during the period in which this report is being prepared; |
| (b) | Designed such internal control over financial reporting, or caused such internal control over financial reporting to be designed under
our supervision, to provide reasonable assurance regarding the reliability of financial reporting and the preparation of financial statements
for external purposes in accordance with generally accepted accounting principles; |
| (c) | Evaluated the effectiveness of the registrant's disclosure controls and procedures and presented in this report our conclusions about
the effectiveness of the disclosure controls and procedures, as of a date within 90 days prior to the filing date of this report based
on such evaluation; and |
| (d) | Disclosed in this report any change in the registrant’s internal control over financial reporting that occurred during the period
covered by this report that has materially affected, or is reasonably likely to materially affect, the registrant’s internal control
over financial reporting; and |
| 5. | The registrant’s other certifying officer(s) and I have disclosed to the registrant’s auditors and the audit committee
of the registrant’s board of directors (or persons performing the equivalent functions): |
| (a) | All significant deficiencies and material weaknesses in the design or operation of internal control over financial reporting which
are reasonably likely to adversely affect the registrant’s ability to record, process, summarize, and report financial information;
and |
| (b) | Any fraud, whether or not material, that involves management or other employees who have a significant role in the registrant’s
internal control over financial reporting. |
| Date: |
7/6/23 |
|
/s/ Catherine
Johnston |
|
|
|
|
Catherine
Johnston
President |
|
EX.99.CERT
CERTIFICATIONS
I, Brian Helhoski, certify that:
| 1. | I have reviewed this report on Form N-CSR of Miller/Howard High Income Equity Fund; |
| 2. | Based on my knowledge, this report does not contain any untrue statement of a material fact or omit to state a material fact necessary
to make the statements made, in light of the circumstances under which such statements were made, not misleading with respect to the period
covered by this report; |
| 3. | Based on my knowledge, the financial statements, and other financial information included in this report, fairly present in all material
respects the financial condition, results of operations, changes in net assets, and cash flows (if the financial statements are required
to include a statement of cash flows) of the registrant as of, and for, the periods presented in this report; |
| 4. | The registrant’s other certifying officer(s) and I are responsible for establishing and maintaining disclosure controls and
procedures (as defined in Rule 30a-3(c) under the Investment Company Act of 1940) and internal control over financial reporting (as defined
in Rule 30a-3(d) under the Investment Company Act of 1940) for the registrant and have: |
| (a) | Designed such disclosure controls and procedures, or caused such disclosure controls and procedures to be designed under our supervision,
to ensure that material information relating to the registrant, including its consolidated subsidiaries, is made known to us by others
within those entities, particularly during the period in which this report is being prepared; |
| (b) | Designed such internal control over financial reporting, or caused such internal control over financial reporting to be designed under
our supervision, to provide reasonable assurance regarding the reliability of financial reporting and the preparation of financial statements
for external purposes in accordance with generally accepted accounting principles; |
| (c) | Evaluated the effectiveness of the registrant’s disclosure controls and procedures and presented in this report our conclusions
about the effectiveness of the disclosure controls and procedures, as of a date within 90 days prior to the filing date of this report
based on such evaluation; and |
| (d) | Disclosed in this report any change in the registrant’s internal control over financial reporting that occurred during the period
covered by this report that has materially affected, or is reasonably likely to materially affect, the registrant’s internal control
over financial reporting; and |
| 5. | The registrant’s other certifying officer(s) and I have disclosed to the registrant’s auditors and the audit committee
of the registrant’s board of directors (or persons performing the equivalent functions): |
| (a) | All significant deficiencies and material weaknesses in the design or operation of internal control over financial reporting which
are reasonably likely to adversely affect the registrant’s ability to record, process, summarize, and report financial information;
and |
| (b) | Any fraud, whether or not material, that involves management or other employees who have a significant role in the registrant’s
internal control over financial reporting. |
| Date: |
7/6/23 |
|
/s/ Brian Helhoski |
|
|
|
|
Brian Helhoski
Chief Financial Officer |
EX.99.906CERT
Certification Pursuant to Section 906 of the
Sarbanes-Oxley Act
Pursuant to Section 906 of the Sarbanes-Oxley Act
of 2002, each of the undersigned officers of the Miller/Howard High Income Equity Fund, does hereby certify, to such officer’s
knowledge, that the report on Form N-CSR of the Miller/Howard High Income Equity Fund for the period ended April 30, 2023 fully
complies with the requirements of Section 13(a) or 15(d) of the Securities Exchange Act of 1934, as applicable, and that the
information contained in the Form N-CSR fairly presents, in all material respects, the financial condition and results of operations
of the Miller/Howard High Income Equity Fund for the stated period.
| /s/ Catherine Johnston
|
|
/s/ Brian Helhoski |
|
|
Catherine Johnston
President,
Miller/Howard High Income Equity Fund |
|
Brian Helhoski
Chief Financial Officer,
Miller/Howard High Income Equity Fund
|
|
This statement accompanies this report on Form N-CSR pursuant to Section
906 of the Sarbanes-Oxley Act of 2002 and shall not be deemed as filed by Miller/Howard High Income Equity Fund for purposes of Section
18 of the Securities Exchange Act of 1934.
Miller Howard High Incom... (NYSE:HIE)
Graphique Historique de l'Action
De Avr 2024 à Mai 2024

Miller Howard High Incom... (NYSE:HIE)
Graphique Historique de l'Action
De Mai 2023 à Mai 2024
