Setting of Salaries and Annual Cash Incentive Compensation
The Compensation Committee typically makes its decisions related to salaries and annual cash incentive targets at the start of each fiscal year. This timing allows the Compensation Committee to take into account Jabil’s financial results in the prior fiscal year and the plans and expectations for the current fiscal year when establishing such salaries and targets. If a NEO’s role changes or an officer is promoted, compensation elements may be adjusted later in the fiscal year.
Long-Term Incentive Compensation Award Practices
Long-term incentive awards are typically granted to our executives at the start of each fiscal year following the completion and release of financial results for the preceding fiscal year, so that relevant information is available to the Compensation Committee and the market price of our common stock reflects this information. The dates for the meetings at which such grants are made are set well in advance of such meetings. The Compensation Committee may also make grants of long-term incentive awards at other times during the year due to special circumstances, which include a change in an officer role, the hiring or promotion of an officer, an acquisition or to align compensation with new strategic goals. We do not seek to time long-term incentive awards to take advantage of information, either positive or negative, about Jabil which has not been publicly disclosed.
In deciding the type and value of equity compensation to grant, the Compensation Committee typically takes into account a variety of considerations, such as Jabil’s financial performance, the need to retain experienced and talented employees to execute the strategies of the business, the accounting and tax impacts of the grant, the dilutive effect to the stockholders, the incentive opportunity Jabil desires to provide to the NEOs, the executive’s role and responsibilities, individual performance, internal equity and the historical level of actual compensation realized as compared to the value targeted. Additionally, the Compensation Committee utilizes peer group and compensation survey data to provide context for its determinations of these grants.
A majority of equity incentive awards granted to our NEOs are performance-based, with vesting conditioned on Jabil’s EPS or the Relative TSR metric, each measured over a three-year performance period. These metrics are described in detail under “NEO Long-Term Incentives”.
Time-based RSU awards are also granted to the NEOs. We believe that time-based RSU awards with service-based vesting over multiple years provides the recipient with the potential for long-term value directly aligned with the stock price and requires long-term service. We believe that time-based RSUs align with our guiding principle of creating a compensation package that is competitive, promotes retention, focuses on financial performance and balances the at-risk elements.
Other Compensation Policies and Considerations
In general, the Company offers limited additional compensation components to our NEOs, reflecting our cost-sensitive philosophy. For fiscal year 2023, we incurred tax gross-up and tax preparation service fees for Mr. Wilson that are one-time compensation not reflective of “ordinary” cash compensation. For all other NEOs, the value of the other benefits comprising “All Other Compensation” was minimal, as disclosed in detail in the Fiscal Year 2023 Summary Compensation Table and the related notes.
All of the programs we offer, with the exception of the non-qualified deferred compensation program, are also offered to a broad-based group of our employees.
Retirement and Pension Plan, Death and Disability
Our 401(k) Retirement Plan (“401(k) Plan”) includes a Company matching contribution. Eligible officers who retire receive additional time for vesting and settlement of certain equity and equity-based grants. Awards vest according to the provisions within the equity award agreements. Eligibility is determined based upon the age and/or years of service of the particular officer. The Compensation Committee may, in its discretion, award a bonus for the year of retirement and also may, in its discretion, pro rate this bonus for service through the date of retirement. Unvested time-based RSUs fully vest upon termination due to death or disability. In the event of death, a pro rata portion of unvested performance-based RSUs may vest, and in the event of a termination due to disability, a pro rata portion of unvested performance-based RSUs may
|
|
|
|
|
| |
|
|
|

|
|
Jabil Inc. Fiscal Year 2023 Proxy Statement |
|
31 |
remain outstanding and eligible for future vesting based on the actual level of achievement of the performance goals.
Severance and Termination
Upon a termination for any reason whatsoever, NEOs generally receive the pro rata portion of salary earned to the date of termination and pro-rata payment of the annual cash incentive compensation. Unvested RSUs are forfeited upon termination of employment unless there is a change in control or, for certain awards, the NEO is retirement-eligible, dies or becomes disabled. On a case-by-case basis, Jabil has at the time of termination entered into severance pay agreements with certain officers for various reasons, including but not limited to obtaining agreements from departing employees not to compete with Jabil for specified periods of time.
Mr. Robert L. Katz, Executive Vice President, will leave the Company effective December 31, 2023. In connection with his departure, Mr. Katz entered into a Mutual Separation Agreement and Release dated November 9, 2022. Mr. Katz did not receive compensation arising from this agreement in fiscal year 2023. Due to the transition of his duties, he was no longer considered an executive officer of the Company on August 31, 2023.
Mr. Steven Borges, Executive Vice President and CEO Diversified Manufacturing Services will leave the Company effective December 31, 2024. In connection with his departure, Mr. Borges entered into a Mutual Separation Agreement and Release dated August 21, 2023. Mr. Borges did not receive compensation arising from this agreement in fiscal year 2023.
Change in Control Arrangements
Awards granted under the Equity Incentive Plan may vest under certain circumstances in connection with a change in control. In addition, any shares of Jabil stock that may be deferred and that continue to be reserved under the non-qualified deferred compensation program are distributed upon a change in control.
In the event of a change in control, any award outstanding under the Equity Incentive Plan will become fully vested on the earlier of (i) the applicable vesting date under the original vesting schedule, (ii) the first anniversary of the date of the change in control if the grantee has remained as an employee, consultant or non-employee director, or (iii) the date the grantee is terminated without cause or resigns for good reason. However, an award will not fully vest due to a change in control if the grantee is terminated for cause or resigns without good reason prior to the first anniversary of the date of such change in control.
With respect to the Equity Incentive Plan, the above discussion assumes that the outstanding awards are continued, assumed or replaced in connection with the change in control by the surviving or successor entity or its parent. If the awards are not continued, assumed or replaced, then the awards will be immediately fully vested on the change in control or, at the discretion of the Compensation Committee, such awards may be terminated and cashed out. In addition, under the Equity Incentive Plan, for purposes of these accelerated vesting provisions, any performance objectives for any performance measurement period that is in process at the time of the change in control are deemed to have been achieved at the greater of target or the level actually achieved through the change in control (with similar performance assumed achieved through the remainder of the performance period).
A summary of potential payments upon termination or a change in control for NEOs is set forth in “Potential Payments upon Termination or a Change in Control.”
Non-Qualified Deferred Compensation
U.S. executives may participate in a non-qualified deferred compensation program to voluntarily elect to defer up to 75% of salary and up to 100% of annual cash bonus. Participant deferrals are credited by book entry to the participant’s deferral contribution account. Jabil does not make, and is not required to make, any matching contributions to this program. Jabil may, however, decide to make discretionary contributions to the program to restore any 401(k) match a participant lost due to participation in this program. Executives meeting certain criteria may also voluntarily defer receipt of compensation upon vesting of RSUs.
|
|
|
|
|
| |
|
|
|
|
|
|
Jabil Inc. Fiscal Year 2023 Proxy Statement |
|
32 |
the Board of Directors whether to accept such offer. The Board will act on the recommendation within 90 days following the recommendation. For additional information regarding the majority voting standard, see “Majority Voting for Directors.”
Proposals 2, 3, 4 and 5
Proposals 2, 4 and 5 are approved by an affirmative vote of a majority of the shares present or represented at the Annual Meeting and actually cast on each Proposal. With respect to Proposal 3, the frequency that receives the highest number of votes cast will be the stockholders’ recommendation as to the frequency of future advisory stockholder votes to approve Jabil’s executive compensation. Abstentions and broker non-votes, if any, will have no effect on the approval of Proposals 2, 3, 4 and 5.
Meeting Access and Additional Information
You are entitled to attend the virtual Annual Meeting only if you were a stockholder of record as of Record Date, or you hold a valid proxy for the Annual Meeting. You may attend the Virtual Annual Meeting, vote, and submit a question during the Annual Meeting by visiting www.virtualshareholdermeeting.com/JBL2024 and using your 16-digit control number to enter the meeting provided on the Notice of Internet Availability of Proxy Materials (“Notice”) or your proxy card (if applicable). Please follow the directions, which are posted on the platform during the virtual meeting for technical support if needed. Stockholders whose shares are held in “street name” and who do not receive a control number should consult their voting instruction form or Notice of Internet Availability and may need to obtain a legal proxy from their brokerage firm, bank or other organization in advance of the virtual annual meeting in order to participate.
Voting via the Internet or Telephone
For Shares Directly Registered in the Name of the Stockholder
If your shares are registered directly in your name with Computershare Trust Company, N.A. (“Computershare”), Jabil’s transfer agent, you may vote as set forth on the Notice, or, if you received paper copies in the mail of the proxy materials, by mailing in the proxy or via the Internet or telephone as described in the proxy card.
Specific instructions to be followed by any registered stockholder interested in voting via the Internet or telephone are set forth on the Notice or the proxy card. Votes submitted via the Internet or telephone by a registered stockholder must be received by 11:59 p.m. (ET) on January 24, 2024.
For Shares Registered in the Name of a Brokerage or Bank
If your shares are held in an account at a brokerage firm, bank or other organization, then you are the beneficial owner of shares held in “street name” and you will receive instructions on how to vote from the holder of record. Votes submitted via the Internet through the street name program must be received by 11:59 p.m. (ET) on January 24, 2024.
Notice and Access
We are delivering proxy materials to many stockholders via the Internet under the Notice and Access rules of the SEC. If you receive the Notice and prefer to receive a paper or e-mail copy of the proxy materials, follow the instructions in the Notice for making this request and the proxy materials will be sent promptly to you via the preferred method.
You may elect to receive future notices of meetings and proxy materials electronically via the Internet, if then made available by Jabil. If you have previously consented to Jabil’s Internet delivery program, your consent will remain in effect until you cancel your enrolment, which you are free to do at any time. If you have not yet enrolled in Jabil’s Internet delivery program, we strongly encourage you to do so as it is a cost-effective way for Jabil to send you the proxy materials. Instructions to participate in the Internet delivery program are set forth on the Notice and proxy card. When next year’s proxy materials are available, you may be sent an e-mail telling you how to access them electronically. Please note that, while we are using the rules enacted by the SEC regarding the electronic distribution of proxy materials on websites, as
|
|
|
|
|
| |
|
|
|
|
|
|
Jabil Inc. Fiscal Year 2023 Proxy Statement |
|
55 |
Pay vs Performance Disclosure - USD ($)
|
12 Months Ended |
Aug. 31, 2023 |
Aug. 31, 2022 |
Aug. 31, 2021 |
| Pay vs Performance Disclosure |
|
|
|
| Pay vs Performance Disclosure, Table |
The following tables show the relationship between executive “compensation actually paid” and certain financial performance of the Company as determined under Item 402(v) of Regulation S-K. For further information concerning the Company’s pay for performance philosophy and how the Company aligns executive compensation with the Company’s performance, refer to “Compensation Matters – Compensation Discussion and Analysis.”
|
|
|
|
|
|
|
|
|
|
|
|
|
|
|
|
|
|
|
|
|
|
|
|
|
|
|
|
|
Average
Summary
Compensation
Table |
|
Average
Compensation
Actually |
|
Value of Initial Fixed
$100 Investment |
|
|
|
|
| |
Summary Compensation Table Total for PEO |
|
|
|
Total Stockholder Return ($) |
|
Peer Group Total Stockholder Return ($) |
| |
|
Mondello |
|
Wilson |
|
Mondello |
|
Wilson |
|
|
|
|
|
|
|
|
|
|
|
|
|
|
16,601,000 |
|
10,237,971 |
|
66,953,485 |
|
24,823,983 |
|
3,837,569 |
|
10,481,156 |
|
340.37 |
|
143.65 |
|
818,000,000 |
|
1,733,000,000 |
|
|
16,435,268 |
|
N/A |
|
10,587,003 |
|
N/A |
|
4,370,388 |
|
4,105,552 |
|
178.70 |
|
129.75 |
|
996,000,000 |
|
1,543,000,000 |
|
|
15,629,573 |
|
N/A |
|
55,963,228 |
|
N/A |
|
5,228,688 |
|
12,711,957 |
|
182.13 |
|
144.77 |
|
696,000,000 |
|
1,241,000,000 |
|
The dollar amounts reported in column (b) are the amounts reported for Mr. Kenneth Wilson, our Chief Executive Officer since May 1, 2023, and for Mr. Mark Mondello, our Chief Executive Officer during the remainder of 2023 and for each of the other years shown in the “Total” column in our Summary Compensation Table. Refer to the “Compensation Matters – Summary Compensation Table”. |
|
The dollar amounts reported in column (c) represent the amount of “compensation actually paid” to Messrs. Wilson and Mondello as computed in accordance with Item 402(v) of Regulation S-K and do not reflect the total compensation actually realized or received by Messrs. Wilson and Mondello, respectively. In accordance with these rules, these amounts reflect “Total Compensation” as set forth in the Summary Compensation Table for each year, adjusted as shown below. Equity values are calculated in accordance with FASB ASC Topic 718, and the assumptions used are consistent with those disclosed on the grant date, with values changing primarily due to changes in the Company’s stock price and performance on the metrics applicable to those awards. |
|
|
|
|
|
|
|
|
|
|
|
|
|
|
|
|
|
|
|
|
|
|
Compensation Actually Paid to PEO |
|
|
|
|
|
|
|
|
|
|
|
|
|
|
Wilson
|
|
|
|
Mondello
|
|
|
|
Mondello
|
|
|
|
|
|
Summary Compensation Table Total |
|
|
10,237,971 |
|
|
|
16,601,000 |
|
|
|
16,435,268 |
|
|
|
15,629,573 |
|
Less, value of “Stock Awards” reported in Summary Compensation Table |
|
|
(6,219,513 |
) |
|
|
(11,310,600 |
) |
|
|
(11,110,207 |
) |
|
|
(11,159,600 |
) |
Plus, year-end fair value of outstanding and unvested equity awards granted in the year and were unvested at year-end |
|
|
13,819,912 |
|
|
|
25,132,433 |
|
|
|
10,938,307 |
|
|
|
23,695,520 |
|
Plus, year over year change in fair value of outstanding and unvested equity awards granted in prior years that were unvested at year-end |
|
|
6,430,336 |
|
|
|
35,847,153 |
|
|
|
999,140 |
|
|
|
26,754,549 |
|
Plus (less), change in fair value from the prior year-end through the applicable vesting date of equity awards granted in prior years that vested or were rescinded in the year* |
|
|
555,277 |
|
|
|
683,499 |
|
|
|
(6,675,505 |
) |
|
|
1,043,186 |
|
Compensation Actually Paid to PEO |
|
|
24,823,983 |
|
|
|
66,953,485 |
|
|
|
10,587,003 |
|
|
|
55,963,228 |
|
|
*Reflects the impact of Mr. Mondello’s voluntarily rescission of the portion of his FY2019 Performance-Based RSUs that was scheduled to vest above target in fiscal year 2022 based on the Company’s Relative TSR performance. Accordingly, Mr. Mondello requested that his payout be capped at the target payout level. |
|
The dollar amounts reported in column (d) represent the average of the amounts reported for the Company’s named executive officers (NEOs) as a group (excluding Mr. Mondello for all years shown and Mr. Wilson for 2023) in the “Total” column of the Summary Compensation Table in each applicable year. The names of each of the NEOs included for these purposes in each applicable year are as follows: (i) for 2023, Mr. Dastoor, Mr. Borges, Mr. Creadon, Mr. McCoy and Mr. Katz; (ii) for 2022, Mr. Dastoor, Mr. Borges, Mr. Wilson, Mr. Johnson and Mr. Loparco; and (iii) for 2021, Mr. Dastoor, Mr. Borges, Mr. Loparco and Mr. Wilson. |
|
The dollar amounts reported in column (e) represent the average amount of “compensation actually paid” to the NEOs as a group (excluding Mr. Mondello for all years shown and Mr. Wilson for 2023), as computed in accordance with Item 402(v) of Regulation S-K. In accordance with these rules, these amounts reflect “Total Compensation” as set forth in the Summary Compensation Table for each year, adjusted as shown below. Equity values are calculated in accordance with FASB ASC Topic 718, and the assumptions used are |
| |
consistent with those disclosed on the grant date, with values changing primarily due to changes in the Company’s stock price and performance on the metrics applicable to those awards. |
|
|
|
|
|
|
|
|
|
|
|
|
|
|
|
|
|
Average Compensation Actually Paid to Non-PEO NEOs |
|
|
|
|
|
|
|
|
Average Summary Compensation Table Total |
|
|
3,837,569 |
|
|
|
4,370,388 |
|
|
|
5,228,688 |
|
Less, average value of Stock Awards reported in Summary Compensation Table |
|
|
(1,822,095 |
) |
|
|
(1,945,226 |
) |
|
|
(3,262,453 |
) |
Plus, average year-end fair value of outstanding and unvested equity awards granted in the year and were unvested at year-end |
|
|
4,048,739 |
|
|
|
1,581,509 |
|
|
|
5,964,144 |
|
Plus, average year over year change in fair value of outstanding and unvested equity awards granted in prior years that were unvested at year-end |
|
|
4,097,774 |
|
|
|
121,089 |
|
|
|
4,637,203 |
|
Plus (less), average change in fair value from the prior year-end through the applicable vesting date of equity awards granted in prior years that vested in the year |
|
|
319,169 |
|
|
|
(22,208 |
) |
|
|
144,375 |
|
Average Compensation Actually Paid to Non-PEO NEOs |
|
|
10,481,156 |
|
|
|
4,105,552 |
|
|
|
12,711,957 |
|
|
Total Stockholder Return (TSR) is calculated by dividing (a) the sum of (i) the cumulative amount of dividends for the measurement period, assuming dividend reinvestment, and (ii) the difference between the Company’s stock price at the end of each fiscal year shown and the beginning of the measurement period, and the beginning of the measurement period by (b) the Company’s stock price at the beginning of the measurement period. The beginning of the measurement period for each year in the table is August 31, 2020. |
|
The peer group used for this purpose is the following published industry index: S&P MidCap 400 Index. |
|
The dollar amounts reported represent the amount of net income reflected in the Company’s audited financial statements for the applicable year. |
|
The Company-selected Measure is CANCOI, which is described in detail in the section “Compensation Matters – Compensation Discussion and Analysis – NEO Fiscal Year 2023 Compensation.” CANCOI is a non-GAAP financial measure. See Annex A to this proxy statement for a reconciliation of GAAP to non-GAAP financial measures. |
|
|
|
| Company Selected Measure Name |
CANCOI
|
|
|
| Named Executive Officers, Footnote |
|
The dollar amounts reported in column (d) represent the average of the amounts reported for the Company’s named executive officers (NEOs) as a group (excluding Mr. Mondello for all years shown and Mr. Wilson for 2023) in the “Total” column of the Summary Compensation Table in each applicable year. The names of each of the NEOs included for these purposes in each applicable year are as follows: (i) for 2023, Mr. Dastoor, Mr. Borges, Mr. Creadon, Mr. McCoy and Mr. Katz; (ii) for 2022, Mr. Dastoor, Mr. Borges, Mr. Wilson, Mr. Johnson and Mr. Loparco; and (iii) for 2021, Mr. Dastoor, Mr. Borges, Mr. Loparco and Mr. Wilson. |
|
|
|
| Peer Group Issuers, Footnote |
|
The peer group used for this purpose is the following published industry index: S&P MidCap 400 Index. |
|
|
|
| Adjustment To PEO Compensation, Footnote |
|
The dollar amounts reported in column (c) represent the amount of “compensation actually paid” to Messrs. Wilson and Mondello as computed in accordance with Item 402(v) of Regulation S-K and do not reflect the total compensation actually realized or received by Messrs. Wilson and Mondello, respectively. In accordance with these rules, these amounts reflect “Total Compensation” as set forth in the Summary Compensation Table for each year, adjusted as shown below. Equity values are calculated in accordance with FASB ASC Topic 718, and the assumptions used are consistent with those disclosed on the grant date, with values changing primarily due to changes in the Company’s stock price and performance on the metrics applicable to those awards. |
|
|
|
|
|
|
|
|
|
|
|
|
|
|
|
|
|
|
|
|
|
|
Compensation Actually Paid to PEO |
|
|
|
|
|
|
|
|
|
|
|
|
|
|
Wilson
|
|
|
|
Mondello
|
|
|
|
Mondello
|
|
|
|
|
|
Summary Compensation Table Total |
|
|
10,237,971 |
|
|
|
16,601,000 |
|
|
|
16,435,268 |
|
|
|
15,629,573 |
|
Less, value of “Stock Awards” reported in Summary Compensation Table |
|
|
(6,219,513 |
) |
|
|
(11,310,600 |
) |
|
|
(11,110,207 |
) |
|
|
(11,159,600 |
) |
Plus, year-end fair value of outstanding and unvested equity awards granted in the year and were unvested at year-end |
|
|
13,819,912 |
|
|
|
25,132,433 |
|
|
|
10,938,307 |
|
|
|
23,695,520 |
|
Plus, year over year change in fair value of outstanding and unvested equity awards granted in prior years that were unvested at year-end |
|
|
6,430,336 |
|
|
|
35,847,153 |
|
|
|
999,140 |
|
|
|
26,754,549 |
|
Plus (less), change in fair value from the prior year-end through the applicable vesting date of equity awards granted in prior years that vested or were rescinded in the year* |
|
|
555,277 |
|
|
|
683,499 |
|
|
|
(6,675,505 |
) |
|
|
1,043,186 |
|
Compensation Actually Paid to PEO |
|
|
24,823,983 |
|
|
|
66,953,485 |
|
|
|
10,587,003 |
|
|
|
55,963,228 |
|
|
*Reflects the impact of Mr. Mondello’s voluntarily rescission of the portion of his FY2019 Performance-Based RSUs that was scheduled to vest above target in fiscal year 2022 based on the Company’s Relative TSR performance. Accordingly, Mr. Mondello requested that his payout be capped at the target payout level. |
|
|
|
| Non-PEO NEO Average Total Compensation Amount |
$ 3,837,569
|
$ 4,370,388
|
$ 5,228,688
|
| Non-PEO NEO Average Compensation Actually Paid Amount |
$ 10,481,156
|
4,105,552
|
12,711,957
|
| Adjustment to Non-PEO NEO Compensation Footnote |
|
The dollar amounts reported in column (e) represent the average amount of “compensation actually paid” to the NEOs as a group (excluding Mr. Mondello for all years shown and Mr. Wilson for 2023), as computed in accordance with Item 402(v) of Regulation S-K. In accordance with these rules, these amounts reflect “Total Compensation” as set forth in the Summary Compensation Table for each year, adjusted as shown below. Equity values are calculated in accordance with FASB ASC Topic 718, and the assumptions used are |
| |
consistent with those disclosed on the grant date, with values changing primarily due to changes in the Company’s stock price and performance on the metrics applicable to those awards. |
|
|
|
|
|
|
|
|
|
|
|
|
|
|
|
|
|
Average Compensation Actually Paid to Non-PEO NEOs |
|
|
|
|
|
|
|
|
Average Summary Compensation Table Total |
|
|
3,837,569 |
|
|
|
4,370,388 |
|
|
|
5,228,688 |
|
Less, average value of Stock Awards reported in Summary Compensation Table |
|
|
(1,822,095 |
) |
|
|
(1,945,226 |
) |
|
|
(3,262,453 |
) |
Plus, average year-end fair value of outstanding and unvested equity awards granted in the year and were unvested at year-end |
|
|
4,048,739 |
|
|
|
1,581,509 |
|
|
|
5,964,144 |
|
Plus, average year over year change in fair value of outstanding and unvested equity awards granted in prior years that were unvested at year-end |
|
|
4,097,774 |
|
|
|
121,089 |
|
|
|
4,637,203 |
|
Plus (less), average change in fair value from the prior year-end through the applicable vesting date of equity awards granted in prior years that vested in the year |
|
|
319,169 |
|
|
|
(22,208 |
) |
|
|
144,375 |
|
Average Compensation Actually Paid to Non-PEO NEOs |
|
|
10,481,156 |
|
|
|
4,105,552 |
|
|
|
12,711,957 |
|
|
|
|
| Compensation Actually Paid vs. Total Shareholder Return |
Compensation Actually Paid and Company TSR As demonstrated by the following chart, the amount of CAP to the Company’s CEOs for the applicable year and the average amount of CAP to the Company’s other NEOs as a group is aligned with the Company’s cumulative TSR over the three years presented in the table. The alignment of CAP reflects the fact that a significant portion of the compensation paid to our CEOs and to the other NEOs is comprised of equity awards, as described in more detail in “Compensation Matters – Compensation Discussion and Analysis.”
|
|
|
| Compensation Actually Paid vs. Net Income |
Compensation Actually Paid and Net Income The following chart demonstrates the amount of CAP to the Company’s CEOs for the applicable year and the average amount of CAP to the Company’s other NEOs as a group in relation to the Company’s net income over the last three fiscal years. The Company does not use net income as a performance measure in the overall executive compensation program.
|
|
|
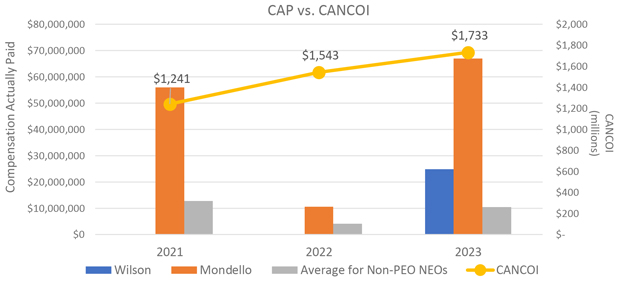
| Compensation Actually Paid vs. Company Selected Measure |
Compensation Actually Paid and CANCOI The following graph demonstrates the amount of CAP to our CEOs and the average amount of CAP to the Company’s other NEOs as a group in relation to the Company’s CANCOI (as described above and in the Annex to this proxy statement), over the three years presented in the Pay Versus Performance table. While the Company uses numerous financial performance measures for the purpose of evaluating performance for the Company’s compensation programs, the Company has determined that CANCOI is the financial performance measure that, in the Company’s assessment, represents the most important performance measure (that is not otherwise required to be disclosed in the table) used by the Company to link CAP to the Company’s NEOs, for the most recently completed fiscal year, to Company performance. As described in more detail in “Compensation Matters – Compensation Discussion and Analysis,” the Company utilizes CANCOI when setting goals in the Company’s annual cash incentive program because it views CANCOI as a key corporate metric that takes into account both revenue and expense.
|
|
|
| Total Shareholder Return Vs Peer Group |
Company TSR and S&P MidCap 400 Index As demonstrated by the following chart, the Company’s cumulative TSR over the three-year period presented in the table was 240.37% while the cumulative TSR of the peer group presented for this purpose, the S&P MidCap 400 Index, was 43.65% over the three years presented in the table.
|
|
|
| Tabular List, Table |
Financial Performance Measures As described in greater detail under “Compensation Matters – Compensation Discussion and Analysis,” the Company’s executive compensation program reflects a variable philosophy. The metrics that the Company uses for both our long-term and short-term incentive awards are selected based on an objective of incentivizing our NEOs to increase the value of our enterprise for our stockholders. In addition to CANCOI, our Company selected measure, the most important financial performance measures used by the Company to link executive compensation actually paid to the Company’s NEOs, for the most recently completed fiscal year, to the Company’s performance are as follows:
|
|
|
| Total Shareholder Return Amount |
$ 340.37
|
178.7
|
182.13
|
| Peer Group Total Shareholder Return Amount |
143.65
|
129.75
|
144.77
|
| Net Income (Loss) |
$ 818,000,000
|
$ 996,000,000
|
$ 696,000,000
|
| Company Selected Measure Amount |
1,733,000,000
|
1,543,000,000
|
1,241,000,000
|
| Measure:: 1 |
|
|
|
| Pay vs Performance Disclosure |
|
|
|
| Name |
CANCOI
|
|
|
| Non-GAAP Measure Description |
|
The Company-selected Measure is CANCOI, which is described in detail in the section “Compensation Matters – Compensation Discussion and Analysis – NEO Fiscal Year 2023 Compensation.” CANCOI is a non-GAAP financial measure. See Annex A to this proxy statement for a reconciliation of GAAP to non-GAAP financial measures. |
|
|
|
| Measure:: 2 |
|
|
|
| Pay vs Performance Disclosure |
|
|
|
| Name |
Margin
|
|
|
| Measure:: 3 |
|
|
|
| Pay vs Performance Disclosure |
|
|
|
| Name |
Free Cash Flow
|
|
|
| Measure:: 4 |
|
|
|
| Pay vs Performance Disclosure |
|
|
|
| Name |
Core EPS
|
|
|
| Measure:: 5 |
|
|
|
| Pay vs Performance Disclosure |
|
|
|
| Name |
Relative TSR
|
|
|
| Mr. Kenneth Wilson [Member] |
|
|
|
| Pay vs Performance Disclosure |
|
|
|
| PEO Total Compensation Amount |
$ 10,237,971
|
|
|
| PEO Actually Paid Compensation Amount |
$ 24,823,983
|
|
|
| PEO Name |
Mr. Kenneth Wilson
|
|
|
| Mr. Mark Mondello [Member] |
|
|
|
| Pay vs Performance Disclosure |
|
|
|
| PEO Total Compensation Amount |
$ 16,601,000
|
$ 16,435,268
|
$ 15,629,573
|
| PEO Actually Paid Compensation Amount |
$ 66,953,485
|
10,587,003
|
55,963,228
|
| PEO Name |
Mr. Mark Mondello
|
|
|
| PEO | Mr. Kenneth Wilson [Member] | Stock Awards [Member] |
|
|
|
| Pay vs Performance Disclosure |
|
|
|
| Adjustment to Compensation, Amount |
$ (6,219,513)
|
|
|
| PEO | Mr. Kenneth Wilson [Member] | Fair Value of Outstanding and Unvested Equity Awards Granted in the Year and Were Unvested [Member] |
|
|
|
| Pay vs Performance Disclosure |
|
|
|
| Adjustment to Compensation, Amount |
13,819,912
|
|
|
| PEO | Mr. Kenneth Wilson [Member] | Change In Fair Value of Outstanding and Unvested Equity Awards Granted in Prior Years that Were Unvested [Member] |
|
|
|
| Pay vs Performance Disclosure |
|
|
|
| Adjustment to Compensation, Amount |
6,430,336
|
|
|
| PEO | Mr. Kenneth Wilson [Member] | Change in Fair Value from the Prior YearEnd Through the Applicable Vesting Date of Equity Awards Granted [Member] |
|
|
|
| Pay vs Performance Disclosure |
|
|
|
| Adjustment to Compensation, Amount |
555,277
|
|
|
| PEO | Mr. Mark Mondello [Member] | Stock Awards [Member] |
|
|
|
| Pay vs Performance Disclosure |
|
|
|
| Adjustment to Compensation, Amount |
(11,310,600)
|
(11,110,207)
|
(11,159,600)
|
| PEO | Mr. Mark Mondello [Member] | Fair Value of Outstanding and Unvested Equity Awards Granted in the Year and Were Unvested [Member] |
|
|
|
| Pay vs Performance Disclosure |
|
|
|
| Adjustment to Compensation, Amount |
25,132,433
|
10,938,307
|
23,695,520
|
| PEO | Mr. Mark Mondello [Member] | Change In Fair Value of Outstanding and Unvested Equity Awards Granted in Prior Years that Were Unvested [Member] |
|
|
|
| Pay vs Performance Disclosure |
|
|
|
| Adjustment to Compensation, Amount |
35,847,153
|
999,140
|
26,754,549
|
| PEO | Mr. Mark Mondello [Member] | Change in Fair Value from the Prior YearEnd Through the Applicable Vesting Date of Equity Awards Granted [Member] |
|
|
|
| Pay vs Performance Disclosure |
|
|
|
| Adjustment to Compensation, Amount |
683,499
|
(6,675,505)
|
1,043,186
|
| Non-PEO NEO | Stock Awards [Member] |
|
|
|
| Pay vs Performance Disclosure |
|
|
|
| Adjustment to Compensation, Amount |
(1,822,095)
|
(1,945,226)
|
(3,262,453)
|
| Non-PEO NEO | Fair Value of Outstanding and Unvested Equity Awards Granted in the Year and Were Unvested [Member] |
|
|
|
| Pay vs Performance Disclosure |
|
|
|
| Adjustment to Compensation, Amount |
4,048,739
|
1,581,509
|
5,964,144
|
| Non-PEO NEO | Change In Fair Value of Outstanding and Unvested Equity Awards Granted in Prior Years that Were Unvested [Member] |
|
|
|
| Pay vs Performance Disclosure |
|
|
|
| Adjustment to Compensation, Amount |
4,097,774
|
121,089
|
4,637,203
|
| Non-PEO NEO | Change in Fair Value from the Prior YearEnd Through the Applicable Vesting Date of Equity Awards Granted [Member] |
|
|
|
| Pay vs Performance Disclosure |
|
|
|
| Adjustment to Compensation, Amount |
$ 319,169
|
$ (22,208)
|
$ 144,375
|