Form NPORT-P - Monthly Portfolio Investments Report on Form N-PORT (Public)
21 Novembre 2023 - 10:38PM
Edgar (US Regulatory)
September 30, 2023
(unaudited)
| |
|
|
Shares
|
|
|
Value (a)
|
|
| Common Stocks — 99.2% |
|
|
Energy — 83.0%
|
|
|
Equipment & Services — 7.6%
|
|
|
Baker Hughes Company
|
|
|
|
|
367,600 |
|
|
|
|
$ |
12,983,632 |
|
|
|
Halliburton Company
|
|
|
|
|
177,353 |
|
|
|
|
|
7,182,797 |
|
|
|
Schlumberger N.V.
|
|
|
|
|
473,433 |
|
|
|
|
|
27,601,144 |
|
|
|
TechnipFMC plc
|
|
|
|
|
173,800 |
|
|
|
|
|
3,535,092 |
|
|
| |
|
|
|
|
51,302,665 |
|
|
|
Exploration & Production — 23.8%
|
|
|
APA Corporation
|
|
|
|
|
56,000 |
|
|
|
|
|
2,301,600 |
|
|
|
Canadian Natural Resources Limited
|
|
|
|
|
69,200 |
|
|
|
|
|
4,475,164 |
|
|
|
Chord Energy Corporation
|
|
|
|
|
225 |
|
|
|
|
|
36,466 |
|
|
|
Chord Energy Corporation warrants, strike price $166.37, 1 warrant for .5774 share, expires 9/1/24 (b)
|
|
|
|
|
2,654 |
|
|
|
|
|
72,826 |
|
|
|
Chord Energy Corporation warrants, strike price $133.70, 1 warrant for .5774 share, expires 9/1/25 (b)
|
|
|
|
|
1,327 |
|
|
|
|
|
23,554 |
|
|
|
ConocoPhillips
|
|
|
|
|
419,576 |
|
|
|
|
|
50,265,205 |
|
|
|
Coterra Energy Inc.
|
|
|
|
|
150,100 |
|
|
|
|
|
4,060,205 |
|
|
|
Devon Energy Corporation
|
|
|
|
|
126,000 |
|
|
|
|
|
6,010,200 |
|
|
|
Diamondback Energy, Inc.
|
|
|
|
|
95,600 |
|
|
|
|
|
14,806,528 |
|
|
|
EOG Resources, Inc.
|
|
|
|
|
132,267 |
|
|
|
|
|
16,766,165 |
|
|
|
EQT Corporation
|
|
|
|
|
61,400 |
|
|
|
|
|
2,491,612 |
|
|
|
Hess Corporation
|
|
|
|
|
122,789 |
|
|
|
|
|
18,786,717 |
|
|
|
Marathon Oil Corporation
|
|
|
|
|
315,900 |
|
|
|
|
|
8,450,325 |
|
|
|
Occidental Petroleum Corporation
|
|
|
|
|
166,251 |
|
|
|
|
|
10,786,365 |
|
|
|
Pioneer Natural Resources Company
|
|
|
|
|
96,900 |
|
|
|
|
|
22,243,395 |
|
|
|
|
|
|
|
161,576,327 |
|
|
|
Integrated Oil & Gas — 37.6%
|
|
|
Cenovus Energy Inc.
|
|
|
|
|
257,700 |
|
|
|
|
|
5,365,314 |
|
|
|
Chevron Corporation
|
|
|
|
|
542,271 |
|
|
|
|
|
91,437,736 |
|
|
|
Exxon Mobil Corporation
|
|
|
|
|
1,344,330 |
|
|
|
|
|
158,066,321 |
|
|
| |
|
|
|
|
254,869,371 |
|
|
|
Refining & Marketing — 8.9%
|
|
|
Marathon Petroleum Corporation
|
|
|
|
|
173,312 |
|
|
|
|
|
26,229,038 |
|
|
|
Phillips 66
|
|
|
|
|
180,975 |
|
|
|
|
|
21,744,146 |
|
|
|
Valero Energy Corporation
|
|
|
|
|
86,000 |
|
|
|
|
|
12,187,060 |
|
|
|
|
|
|
|
60,160,244 |
|
|
Schedule of Investments (continued)
September 30, 2023
(unaudited)
| |
|
|
Shares
|
|
|
Value (a)
|
|
|
Storage & Transportation — 5.1%
|
|
|
Kinder Morgan, Inc.
|
|
|
|
|
401,592 |
|
|
|
|
$ |
6,658,395 |
|
|
|
ONEOK, Inc.
|
|
|
|
|
137,900 |
|
|
|
|
|
8,746,997 |
|
|
|
Targa Resources Corp.
|
|
|
|
|
116,100 |
|
|
|
|
|
9,952,092 |
|
|
|
Williams Companies, Inc.
|
|
|
|
|
282,950 |
|
|
|
|
|
9,532,586 |
|
|
| |
|
|
|
|
34,890,070 |
|
|
|
Materials — 16.2%
|
|
|
Chemicals — 12.0%
|
|
|
Air Products and Chemicals, Inc.
|
|
|
|
|
19,900 |
|
|
|
|
|
5,639,660 |
|
|
|
Albemarle Corporation
|
|
|
|
|
9,000 |
|
|
|
|
|
1,530,360 |
|
|
|
Celanese Corporation
|
|
|
|
|
36,177 |
|
|
|
|
|
4,540,937 |
|
|
|
CF Industries Holdings, Inc.
|
|
|
|
|
24,769 |
|
|
|
|
|
2,123,694 |
|
|
|
Corteva Inc.
|
|
|
|
|
66,245 |
|
|
|
|
|
3,389,094 |
|
|
|
Dow, Inc.
|
|
|
|
|
65,745 |
|
|
|
|
|
3,389,812 |
|
|
|
DuPont de Nemours, Inc.
|
|
|
|
|
95,926 |
|
|
|
|
|
7,155,120 |
|
|
|
Eastman Chemical Company
|
|
|
|
|
8,900 |
|
|
|
|
|
682,808 |
|
|
|
Ecolab Inc.
|
|
|
|
|
45,600 |
|
|
|
|
|
7,724,640 |
|
|
|
FMC Corporation
|
|
|
|
|
10,055 |
|
|
|
|
|
673,383 |
|
|
|
International Flavors & Fragrances Inc.
|
|
|
|
|
21,006 |
|
|
|
|
|
1,431,979 |
|
|
|
Linde plc
|
|
|
|
|
67,300 |
|
|
|
|
|
25,059,155 |
|
|
|
LyondellBasell Industries N.V.
|
|
|
|
|
61,800 |
|
|
|
|
|
5,852,460 |
|
|
|
Mosaic Company
|
|
|
|
|
25,601 |
|
|
|
|
|
911,396 |
|
|
|
PPG Industries, Inc.
|
|
|
|
|
47,800 |
|
|
|
|
|
6,204,440 |
|
|
|
Sherwin-Williams Company
|
|
|
|
|
21,200 |
|
|
|
|
|
5,407,060 |
|
|
| |
|
|
|
|
81,715,998 |
|
|
|
Construction Materials — 1.2%
|
|
|
Martin Marietta Materials, Inc.
|
|
|
|
|
5,200 |
|
|
|
|
|
2,134,496 |
|
|
|
Vulcan Materials Company
|
|
|
|
|
30,300 |
|
|
|
|
|
6,121,206 |
|
|
| |
|
|
|
|
8,255,702 |
|
|
|
Containers & Packaging — 0.9%
|
|
|
Amcor plc
|
|
|
|
|
125,100 |
|
|
|
|
|
1,145,916 |
|
|
|
Avery Dennison Corporation
|
|
|
|
|
5,500 |
|
|
|
|
|
1,004,685 |
|
|
|
Ball Corporation
|
|
|
|
|
23,300 |
|
|
|
|
|
1,159,874 |
|
|
|
International Paper Company
|
|
|
|
|
21,500 |
|
|
|
|
|
762,605 |
|
|
|
Packaging Corporation of America
|
|
|
|
|
5,900 |
|
|
|
|
|
905,945 |
|
|
|
Sealed Air Corporation
|
|
|
|
|
8,900 |
|
|
|
|
|
292,454 |
|
|
|
WestRock Company
|
|
|
|
|
15,400 |
|
|
|
|
|
551,320 |
|
|
| |
|
|
|
|
5,822,799 |
|
|
Schedule of Investments (continued)
September 30, 2023
(unaudited)
| |
|
|
Shares
|
|
|
Value (a)
|
|
|
Metals & Mining — 2.1%
|
|
|
Freeport-McMoRan, Inc.
|
|
|
|
|
127,000 |
|
|
|
|
$ |
4,735,830 |
|
|
Newmont Corporation
|
|
|
|
|
70,300 |
|
|
|
|
|
2,597,585 |
|
|
Nucor Corporation
|
|
|
|
|
22,200 |
|
|
|
|
|
3,470,970 |
|
|
Steel Dynamics, Inc.
|
|
|
|
|
12,526 |
|
|
|
|
|
1,343,038 |
|
|
Teck Resources Limited
|
|
|
|
|
54,600 |
|
|
|
|
|
2,352,714 |
|
| |
|
|
|
|
14,500,137 |
|
| Total Common Stocks |
|
|
(Cost $461,186,068)
|
|
|
|
|
|
|
|
|
|
|
673,093,313 |
|
| Short-Term Investments — 0.8% |
|
|
Money Market Funds — 0.8%
|
|
|
Northern Institutional Treasury Premier
Portfolio, 5.20% (c)
|
|
|
|
|
178,172 |
|
|
|
|
|
178,172 |
|
|
Western Asset Institutional Liquid Reserves
Fund, 5.41% (c)
|
|
|
|
|
5,004,751 |
|
|
|
|
|
5,004,251 |
|
| Total Short-Term Investments |
|
|
(Cost $5,181,692)
|
|
|
|
|
|
|
|
|
|
|
5,182,423 |
|
| Total — 100.0% of Net Assets |
|
|
(Cost $466,367,760)
|
|
|
|
|
|
|
|
|
|
|
678,275,736 |
|
| Other Assets Less Liabilities — 0.0% |
|
|
|
|
|
|
|
|
|
|
(25,755) |
|
|
| Net Assets — 100.0% |
|
|
|
|
|
|
|
|
|
$
|
678,249,981
|
|
| |
Total Return Swap Agreements — 0.0%
|
Description
|
|
|
|
|
|
|
|
|
|
|
Value and
Unrealized
Appreciation
(Assets)
|
|
|
Value and
Unrealized
Depreciation
(Liabilities)
|
|
|
Terms
|
|
|
Contract
Type
|
|
|
Underlying
Security
|
|
|
Termination
Date
|
|
|
Notional
Amount
|
|
|
Receive total return on underlying
security and pay financing
amount based on notional
amount and daily U.S. Federal
Funds rate plus 0.55%.
|
|
|
Long
|
|
|
Crown Holdings, Inc.
(35,900 shares) |
|
|
8/1/2024
|
|
|
|
$ |
3,127,059 |
|
|
|
|
$ |
12,608 |
|
|
|
$ —
|
|
|
Pay total return on underlying security and receive financing amount based on notional amount and daily U.S. Federal Funds rate less 0.45%.
|
|
|
Short
|
|
|
Materials Select
Sector SPDR Fund
(37,600 shares)
|
|
|
8/1/2024
|
|
|
|
|
(3,118,364) |
|
|
|
|
|
187,590 |
|
|
|
—
|
|
| Gross unrealized gain on open total return swap agreements |
|
|
|
$ |
200,198 |
|
|
|
$ —
|
|
| Net unrealized gain on open total return swap agreements (d) |
|
|
|
$ |
200,198 |
|
|
|
|
|
(a)
Common stocks and warrants are listed on the New York Stock Exchange or NASDAQ and are valued at the last reported sale price on the day of valuation.
(b)
Presently non-dividend paying.
(c)
Rate presented is as of period-end and represents the annualized yield earned over the previous seven days.
(d)
Counterparty for all open total return swap agreements is Morgan Stanley.
Information regarding transactions in equity securities during the quarter can be found on our website at: www.adamsfunds.com.
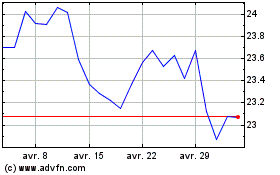
Adams Natural Resources (NYSE:PEO)
Graphique Historique de l'Action
De Mar 2024 à Avr 2024

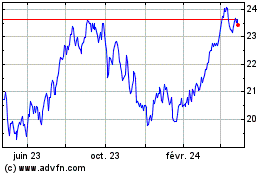
Adams Natural Resources (NYSE:PEO)
Graphique Historique de l'Action
De Avr 2023 à Avr 2024
