000085042912/312024Q3FALSExbrli:sharesiso4217:USDiso4217:USDxbrli:sharestg:lbsiso4217:BRLxbrli:pureiso4217:CNY00008504292024-01-012024-09-3000008504292024-11-0100008504292024-09-3000008504292023-12-3100008504292024-07-012024-09-3000008504292023-07-012023-09-3000008504292023-01-012023-09-300000850429us-gaap:ProductMember2024-07-012024-09-300000850429us-gaap:ProductMember2023-07-012023-09-300000850429us-gaap:ProductMember2024-01-012024-09-300000850429us-gaap:ProductMember2023-01-012023-09-300000850429us-gaap:ShippingAndHandlingMember2024-07-012024-09-300000850429us-gaap:ShippingAndHandlingMember2023-07-012023-09-300000850429us-gaap:ShippingAndHandlingMember2024-01-012024-09-300000850429us-gaap:ShippingAndHandlingMember2023-01-012023-09-300000850429us-gaap:RetainedEarningsMember2024-07-012024-09-300000850429us-gaap:RetainedEarningsMember2023-07-012023-09-300000850429us-gaap:AccumulatedOtherComprehensiveIncomeMember2024-07-012024-09-300000850429us-gaap:AccumulatedOtherComprehensiveIncomeMember2023-07-012023-09-300000850429us-gaap:RetainedEarningsMember2024-01-012024-09-300000850429us-gaap:RetainedEarningsMember2023-01-012023-09-300000850429us-gaap:AccumulatedOtherComprehensiveIncomeMember2024-01-012024-09-300000850429us-gaap:AccumulatedOtherComprehensiveIncomeMember2023-01-012023-09-3000008504292022-12-3100008504292023-09-300000850429us-gaap:CommonStockMember2024-06-300000850429us-gaap:RetainedEarningsMember2024-06-300000850429tg:TrustForSavingRestorationPlanMember2024-06-300000850429us-gaap:AccumulatedOtherComprehensiveIncomeMember2024-06-3000008504292024-06-300000850429us-gaap:CommonStockMember2024-07-012024-09-300000850429us-gaap:CommonStockMember2024-09-300000850429us-gaap:RetainedEarningsMember2024-09-300000850429tg:TrustForSavingRestorationPlanMember2024-09-300000850429us-gaap:AccumulatedOtherComprehensiveIncomeMember2024-09-300000850429us-gaap:CommonStockMember2023-12-310000850429us-gaap:RetainedEarningsMember2023-12-310000850429tg:TrustForSavingRestorationPlanMember2023-12-310000850429us-gaap:AccumulatedOtherComprehensiveIncomeMember2023-12-310000850429us-gaap:CommonStockMember2024-01-012024-09-300000850429us-gaap:CommonStockMember2023-06-300000850429us-gaap:RetainedEarningsMember2023-06-300000850429tg:TrustForSavingRestorationPlanMember2023-06-300000850429us-gaap:AccumulatedOtherComprehensiveIncomeMember2023-06-3000008504292023-06-300000850429us-gaap:CommonStockMember2023-07-012023-09-300000850429tg:TrustForSavingRestorationPlanMember2023-07-012023-09-300000850429us-gaap:CommonStockMember2023-09-300000850429us-gaap:RetainedEarningsMember2023-09-300000850429tg:TrustForSavingRestorationPlanMember2023-09-300000850429us-gaap:AccumulatedOtherComprehensiveIncomeMember2023-09-300000850429us-gaap:CommonStockMember2022-12-310000850429us-gaap:RetainedEarningsMember2022-12-310000850429tg:TrustForSavingRestorationPlanMember2022-12-310000850429us-gaap:AccumulatedOtherComprehensiveIncomeMember2022-12-310000850429us-gaap:CommonStockMember2023-01-012023-09-300000850429tg:TrustForSavingRestorationPlanMember2023-01-012023-09-300000850429us-gaap:OtherExpenseMember2024-01-012024-09-300000850429tg:ThirdPartyFinancialInstitutionsMember2024-09-300000850429tg:ThirdPartyFinancialInstitutionsMember2023-12-310000850429tg:SurfaceProtectionFilmsMember2023-07-012023-09-300000850429tg:SurfaceProtectionFilmsMember2023-01-012023-09-3000008504292023-01-012023-12-310000850429us-gaap:PensionPlansDefinedBenefitMember2024-07-012024-09-300000850429us-gaap:PensionPlansDefinedBenefitMember2023-07-012023-09-300000850429us-gaap:OtherPostretirementBenefitPlansDefinedBenefitMember2024-07-012024-09-300000850429us-gaap:OtherPostretirementBenefitPlansDefinedBenefitMember2023-07-012023-09-300000850429us-gaap:PensionPlansDefinedBenefitMember2024-01-012024-09-300000850429us-gaap:PensionPlansDefinedBenefitMember2023-01-012023-09-300000850429us-gaap:OtherPostretirementBenefitPlansDefinedBenefitMember2024-01-012024-09-300000850429us-gaap:OtherPostretirementBenefitPlansDefinedBenefitMember2023-01-012023-09-300000850429tg:AccruedExpensesMember2024-09-300000850429us-gaap:AccumulatedTranslationAdjustmentMember2024-06-300000850429us-gaap:AccumulatedGainLossNetCashFlowHedgeParentMember2024-06-300000850429us-gaap:AccumulatedDefinedBenefitPlansAdjustmentMember2024-06-300000850429us-gaap:AccumulatedTranslationAdjustmentMember2024-07-012024-09-300000850429us-gaap:AccumulatedGainLossNetCashFlowHedgeParentMember2024-07-012024-09-300000850429us-gaap:AccumulatedDefinedBenefitPlansAdjustmentMember2024-07-012024-09-300000850429us-gaap:AccumulatedTranslationAdjustmentMember2024-09-300000850429us-gaap:AccumulatedGainLossNetCashFlowHedgeParentMember2024-09-300000850429us-gaap:AccumulatedDefinedBenefitPlansAdjustmentMember2024-09-300000850429us-gaap:AccumulatedTranslationAdjustmentMember2023-12-310000850429us-gaap:AccumulatedGainLossNetCashFlowHedgeParentMember2023-12-310000850429us-gaap:AccumulatedDefinedBenefitPlansAdjustmentMember2023-12-310000850429us-gaap:AccumulatedTranslationAdjustmentMember2024-01-012024-09-300000850429us-gaap:AccumulatedGainLossNetCashFlowHedgeParentMember2024-01-012024-09-300000850429us-gaap:AccumulatedDefinedBenefitPlansAdjustmentMember2024-01-012024-09-300000850429us-gaap:AccumulatedTranslationAdjustmentMember2023-06-300000850429us-gaap:AccumulatedGainLossNetCashFlowHedgeParentMember2023-06-300000850429us-gaap:AccumulatedDefinedBenefitPlansAdjustmentMember2023-06-300000850429us-gaap:AccumulatedTranslationAdjustmentMember2023-07-012023-09-300000850429us-gaap:AccumulatedGainLossNetCashFlowHedgeParentMember2023-07-012023-09-300000850429us-gaap:AccumulatedDefinedBenefitPlansAdjustmentMember2023-07-012023-09-300000850429us-gaap:AccumulatedTranslationAdjustmentMember2023-09-300000850429us-gaap:AccumulatedGainLossNetCashFlowHedgeParentMember2023-09-300000850429us-gaap:AccumulatedDefinedBenefitPlansAdjustmentMember2023-09-300000850429us-gaap:AccumulatedTranslationAdjustmentMember2022-12-310000850429us-gaap:AccumulatedGainLossNetCashFlowHedgeParentMember2022-12-310000850429us-gaap:AccumulatedDefinedBenefitPlansAdjustmentMember2022-12-310000850429us-gaap:AccumulatedTranslationAdjustmentMember2023-01-012023-09-300000850429us-gaap:AccumulatedGainLossNetCashFlowHedgeParentMember2023-01-012023-09-300000850429us-gaap:AccumulatedDefinedBenefitPlansAdjustmentMember2023-01-012023-09-300000850429tg:AluminumFuturesContractsMember2024-09-300000850429tg:AluminumFuturesContractsMember2023-12-310000850429tg:AluminumFuturesContractsMemberus-gaap:DesignatedAsHedgingInstrumentMemberus-gaap:PrepaidExpensesAndOtherCurrentAssetsMember2024-09-300000850429tg:AluminumFuturesContractsMemberus-gaap:DesignatedAsHedgingInstrumentMemberus-gaap:PrepaidExpensesAndOtherCurrentAssetsMember2023-12-310000850429tg:AluminumFuturesContractsMemberus-gaap:DesignatedAsHedgingInstrumentMembertg:AccruedExpensesMember2024-09-300000850429tg:AluminumFuturesContractsMemberus-gaap:DesignatedAsHedgingInstrumentMembertg:AccruedExpensesMember2023-12-310000850429tg:AluminumFuturesContractsMemberus-gaap:DesignatedAsHedgingInstrumentMemberus-gaap:OtherNoncurrentLiabilitiesMember2024-09-300000850429tg:AluminumFuturesContractsMemberus-gaap:DesignatedAsHedgingInstrumentMemberus-gaap:OtherNoncurrentLiabilitiesMember2023-12-310000850429tg:AluminumFuturesContractsMemberus-gaap:DesignatedAsHedgingInstrumentMember2024-09-300000850429tg:AluminumFuturesContractsMemberus-gaap:DesignatedAsHedgingInstrumentMember2023-12-310000850429tg:Oct2018Membertg:TerphaneLtdaMember2024-01-012024-09-300000850429tg:Oct24Membertg:TerphaneLtdaMember2024-09-300000850429tg:Nov24Membertg:TerphaneLtdaMember2024-09-300000850429tg:Dec24Membertg:TerphaneLtdaMember2024-09-300000850429tg:TerphaneLtdaMember2024-09-300000850429us-gaap:PrepaidExpensesAndOtherCurrentAssetsMemberus-gaap:DesignatedAsHedgingInstrumentMember2024-09-300000850429us-gaap:PrepaidExpensesAndOtherCurrentAssetsMemberus-gaap:DesignatedAsHedgingInstrumentMember2023-12-310000850429us-gaap:OtherNoncurrentAssetsMemberus-gaap:DesignatedAsHedgingInstrumentMember2024-09-300000850429us-gaap:OtherNoncurrentAssetsMemberus-gaap:DesignatedAsHedgingInstrumentMember2023-12-310000850429tg:AccruedExpensesMemberus-gaap:DesignatedAsHedgingInstrumentMember2024-09-300000850429tg:AccruedExpensesMemberus-gaap:DesignatedAsHedgingInstrumentMember2023-12-310000850429tg:AluminumFuturesContractsMemberus-gaap:CashFlowHedgingMemberus-gaap:CostOfSalesMember2024-07-012024-09-300000850429tg:AluminumFuturesContractsMemberus-gaap:CashFlowHedgingMemberus-gaap:CostOfSalesMember2023-07-012023-09-300000850429tg:ForeignCurrencyForwardsAndOptionsMemberus-gaap:CashFlowHedgingMemberus-gaap:CostOfSalesMember2024-07-012024-09-300000850429tg:ForeignCurrencyForwardsAndOptionsMemberus-gaap:CashFlowHedgingMemberus-gaap:SellingGeneralAndAdministrativeExpensesMember2024-07-012024-09-300000850429tg:ForeignCurrencyForwardsAndOptionsMemberus-gaap:CashFlowHedgingMemberus-gaap:CostOfSalesMember2023-07-012023-09-300000850429tg:ForeignCurrencyForwardsAndOptionsMemberus-gaap:CashFlowHedgingMemberus-gaap:SellingGeneralAndAdministrativeExpensesMember2023-07-012023-09-300000850429tg:AluminumFuturesContractsMemberus-gaap:CashFlowHedgingMemberus-gaap:CostOfSalesMember2024-01-012024-09-300000850429tg:AluminumFuturesContractsMemberus-gaap:CashFlowHedgingMemberus-gaap:CostOfSalesMember2023-01-012023-09-300000850429tg:ForeignCurrencyForwardsAndOptionsMemberus-gaap:CashFlowHedgingMemberus-gaap:CostOfSalesMember2024-01-012024-09-300000850429tg:ForeignCurrencyForwardsAndOptionsMemberus-gaap:CashFlowHedgingMemberus-gaap:SellingGeneralAndAdministrativeExpensesMember2024-01-012024-09-300000850429tg:ForeignCurrencyForwardsAndOptionsMemberus-gaap:CashFlowHedgingMemberus-gaap:CostOfSalesMember2023-01-012023-09-300000850429tg:ForeignCurrencyForwardsAndOptionsMemberus-gaap:CashFlowHedgingMemberus-gaap:SellingGeneralAndAdministrativeExpensesMember2023-01-012023-09-300000850429tg:BrazilianMember2024-01-012024-09-300000850429tg:TerphaneLtdaMember2024-01-012024-09-300000850429tg:AluminumExtrusionsMember2024-07-012024-09-300000850429tg:AluminumExtrusionsMember2023-07-012023-09-300000850429tg:AluminumExtrusionsMember2024-01-012024-09-300000850429tg:AluminumExtrusionsMember2023-01-012023-09-300000850429tg:PEFilmsMember2024-07-012024-09-300000850429tg:PEFilmsMember2023-07-012023-09-300000850429tg:PEFilmsMember2024-01-012024-09-300000850429tg:PEFilmsMember2023-01-012023-09-300000850429tg:FlexiblePackagingFilmsMemberDomain2024-07-012024-09-300000850429tg:FlexiblePackagingFilmsMemberDomain2023-07-012023-09-300000850429tg:FlexiblePackagingFilmsMemberDomain2024-01-012024-09-300000850429tg:FlexiblePackagingFilmsMemberDomain2023-01-012023-09-300000850429tg:FlexiblePackagingFilmsMember2024-07-012024-09-300000850429tg:FlexiblePackagingFilmsMember2023-07-012023-09-300000850429tg:FlexiblePackagingFilmsMember2024-01-012024-09-300000850429tg:FlexiblePackagingFilmsMember2023-01-012023-09-300000850429tg:KaleoMember2023-01-012023-01-310000850429tg:KaleoMember2023-07-012023-09-300000850429tg:KaleoMember2024-01-012024-09-300000850429tg:KaleoMember2023-01-012023-09-300000850429us-gaap:OperatingSegmentsMembertg:AluminumExtrusionsMember2024-09-300000850429us-gaap:OperatingSegmentsMembertg:AluminumExtrusionsMember2023-12-310000850429us-gaap:OperatingSegmentsMembertg:PEFilmsMember2024-09-300000850429us-gaap:OperatingSegmentsMembertg:PEFilmsMember2023-12-310000850429us-gaap:OperatingSegmentsMembertg:FlexiblePackagingFilmsMember2024-09-300000850429us-gaap:OperatingSegmentsMembertg:FlexiblePackagingFilmsMember2023-12-310000850429us-gaap:OperatingSegmentsMembertg:SubtotalMember2024-09-300000850429us-gaap:OperatingSegmentsMembertg:SubtotalMember2023-12-310000850429us-gaap:OperatingSegmentsMembertg:GeneralCorporateMember2024-09-300000850429us-gaap:OperatingSegmentsMembertg:GeneralCorporateMember2023-12-310000850429us-gaap:OperatingSegmentsMember2024-09-300000850429us-gaap:OperatingSegmentsMember2023-12-310000850429country:US2024-07-012024-09-300000850429country:US2023-07-012023-09-300000850429country:US2024-01-012024-09-300000850429country:US2023-01-012023-09-300000850429srt:AsiaMembertg:ExportsFromUnitedStatesMember2024-07-012024-09-300000850429srt:AsiaMembertg:ExportsFromUnitedStatesMember2023-07-012023-09-300000850429srt:AsiaMembertg:ExportsFromUnitedStatesMember2024-01-012024-09-300000850429srt:AsiaMembertg:ExportsFromUnitedStatesMember2023-01-012023-09-300000850429srt:LatinAmericaMembertg:ExportsFromUnitedStatesMember2024-07-012024-09-300000850429srt:LatinAmericaMembertg:ExportsFromUnitedStatesMember2023-07-012023-09-300000850429srt:LatinAmericaMembertg:ExportsFromUnitedStatesMember2024-01-012024-09-300000850429srt:LatinAmericaMembertg:ExportsFromUnitedStatesMember2023-01-012023-09-300000850429country:CAtg:ExportsFromUnitedStatesMember2024-07-012024-09-300000850429country:CAtg:ExportsFromUnitedStatesMember2023-07-012023-09-300000850429country:CAtg:ExportsFromUnitedStatesMember2024-01-012024-09-300000850429country:CAtg:ExportsFromUnitedStatesMember2023-01-012023-09-300000850429srt:EuropeMembertg:ExportsFromUnitedStatesMember2024-07-012024-09-300000850429srt:EuropeMembertg:ExportsFromUnitedStatesMember2023-07-012023-09-300000850429srt:EuropeMembertg:ExportsFromUnitedStatesMember2024-01-012024-09-300000850429srt:EuropeMembertg:ExportsFromUnitedStatesMember2023-01-012023-09-300000850429country:BRtg:OperationsOutsideUnitedStatesMember2024-07-012024-09-300000850429country:BRtg:OperationsOutsideUnitedStatesMember2023-07-012023-09-300000850429country:BRtg:OperationsOutsideUnitedStatesMember2024-01-012024-09-300000850429country:BRtg:OperationsOutsideUnitedStatesMember2023-01-012023-09-300000850429srt:AsiaMembertg:OperationsOutsideUnitedStatesMember2024-07-012024-09-300000850429srt:AsiaMembertg:OperationsOutsideUnitedStatesMember2023-07-012023-09-300000850429srt:AsiaMembertg:OperationsOutsideUnitedStatesMember2024-01-012024-09-300000850429srt:AsiaMembertg:OperationsOutsideUnitedStatesMember2023-01-012023-09-300000850429tg:NonresidentialBuildingAndConstructionMembertg:AluminumExtrusionsMember2024-07-012024-09-300000850429tg:NonresidentialBuildingAndConstructionMembertg:AluminumExtrusionsMember2023-07-012023-09-300000850429tg:NonresidentialBuildingAndConstructionMembertg:AluminumExtrusionsMember2024-01-012024-09-300000850429tg:NonresidentialBuildingAndConstructionMembertg:AluminumExtrusionsMember2023-01-012023-09-300000850429tg:ConsumerDurablesMembertg:AluminumExtrusionsMember2024-07-012024-09-300000850429tg:ConsumerDurablesMembertg:AluminumExtrusionsMember2023-07-012023-09-300000850429tg:ConsumerDurablesMembertg:AluminumExtrusionsMember2024-01-012024-09-300000850429tg:ConsumerDurablesMembertg:AluminumExtrusionsMember2023-01-012023-09-300000850429tg:AutomotiveMembertg:AluminumExtrusionsMember2024-07-012024-09-300000850429tg:AutomotiveMembertg:AluminumExtrusionsMember2023-07-012023-09-300000850429tg:AutomotiveMembertg:AluminumExtrusionsMember2024-01-012024-09-300000850429tg:AutomotiveMembertg:AluminumExtrusionsMember2023-01-012023-09-300000850429tg:ResidentialBuildingAndConstructionMembertg:AluminumExtrusionsMember2024-07-012024-09-300000850429tg:ResidentialBuildingAndConstructionMembertg:AluminumExtrusionsMember2023-07-012023-09-300000850429tg:ResidentialBuildingAndConstructionMembertg:AluminumExtrusionsMember2024-01-012024-09-300000850429tg:ResidentialBuildingAndConstructionMembertg:AluminumExtrusionsMember2023-01-012023-09-300000850429tg:ElectricalMembertg:AluminumExtrusionsMember2024-07-012024-09-300000850429tg:ElectricalMembertg:AluminumExtrusionsMember2023-07-012023-09-300000850429tg:ElectricalMembertg:AluminumExtrusionsMember2024-01-012024-09-300000850429tg:ElectricalMembertg:AluminumExtrusionsMember2023-01-012023-09-300000850429tg:MachineryandEquipmentBNLDomaintg:AluminumExtrusionsMember2024-07-012024-09-300000850429tg:MachineryandEquipmentBNLDomaintg:AluminumExtrusionsMember2023-07-012023-09-300000850429tg:MachineryandEquipmentBNLDomaintg:AluminumExtrusionsMember2024-01-012024-09-300000850429tg:MachineryandEquipmentBNLDomaintg:AluminumExtrusionsMember2023-01-012023-09-300000850429tg:DistributionMembertg:AluminumExtrusionsMember2024-07-012024-09-300000850429tg:DistributionMembertg:AluminumExtrusionsMember2023-07-012023-09-300000850429tg:DistributionMembertg:AluminumExtrusionsMember2024-01-012024-09-300000850429tg:DistributionMembertg:AluminumExtrusionsMember2023-01-012023-09-300000850429tg:AluminumExtrusionsSubtotalMembertg:AluminumExtrusionsMember2024-07-012024-09-300000850429tg:AluminumExtrusionsSubtotalMembertg:AluminumExtrusionsMember2023-07-012023-09-300000850429tg:AluminumExtrusionsSubtotalMembertg:AluminumExtrusionsMember2024-01-012024-09-300000850429tg:AluminumExtrusionsSubtotalMembertg:AluminumExtrusionsMember2023-01-012023-09-300000850429tg:SurfaceProtectionFilmsMembertg:PEFilmsMember2024-07-012024-09-300000850429tg:SurfaceProtectionFilmsMembertg:PEFilmsMember2023-07-012023-09-300000850429tg:SurfaceProtectionFilmsMembertg:PEFilmsMember2024-01-012024-09-300000850429tg:SurfaceProtectionFilmsMembertg:PEFilmsMember2023-01-012023-09-300000850429tg:OverwrapPackagingMembertg:PEFilmsMember2024-07-012024-09-300000850429tg:OverwrapPackagingMembertg:PEFilmsMember2023-07-012023-09-300000850429tg:OverwrapPackagingMembertg:PEFilmsMember2024-01-012024-09-300000850429tg:OverwrapPackagingMembertg:PEFilmsMember2023-01-012023-09-300000850429tg:FilmProductsSubtotalMembertg:PEFilmsMember2024-07-012024-09-300000850429tg:FilmProductsSubtotalMembertg:PEFilmsMember2023-07-012023-09-300000850429tg:FilmProductsSubtotalMembertg:PEFilmsMember2024-01-012024-09-300000850429tg:FilmProductsSubtotalMembertg:PEFilmsMember2023-01-012023-09-300000850429tg:ABLRevolvingFacilityMember2024-09-300000850429us-gaap:BaseRateMember2024-01-012024-09-300000850429us-gaap:SecuredOvernightFinancingRateSofrMember2024-01-012024-09-300000850429tg:Over66Of125MillionAggregateCommitmentMember2024-01-012024-09-300000850429tg:Over66Of125MillionAggregateCommitmentMember2024-09-300000850429tg:LessThan66ButOver33Of125MillionAggregateCommitmentMember2024-01-012024-09-300000850429tg:LessThan66ButOver33Of125MillionAggregateCommitmentMember2024-09-300000850429tg:LessThan33Of125MillionAggregateCommitmentMember2024-01-012024-09-300000850429tg:LessThan33Of125MillionAggregateCommitmentMember2024-09-300000850429tg:Sep24Member2024-09-300000850429tg:Oct24Member2024-09-300000850429tg:Nov24Member2024-09-300000850429tg:Dec24Member2024-09-300000850429tg:Jan25Member2024-09-300000850429tg:Feb25Member2024-09-300000850429tg:Mar25Member2024-09-300000850429tg:Apr25Member2024-09-300000850429tg:May25Member2024-09-300000850429tg:Jun25Member2024-09-300000850429tg:Jul25Member2024-09-300000850429tg:Aug25Member2024-09-300000850429tg:Sep25Member2024-09-300000850429tg:TerphaneBrazilLoanMember2024-09-300000850429tg:TerphaneBrazilLoanMember2024-01-012024-09-300000850429tg:TredegarIntercompanyMember2024-09-300000850429tg:GuangzhouTredegarLoanMember2024-09-300000850429tg:GuangzhouTredegarLoanMember2024-01-012024-09-300000850429tg:FlexiblePackagingFilmsMember2024-09-30
UNITED STATES
SECURITIES AND EXCHANGE COMMISSION
Washington, D.C. 20549
FORM 10-Q
(Mark One) | | | | | |
| x | QUARTERLY REPORT PURSUANT TO SECTION 13 OR 15(d) OF THE SECURITIES EXCHANGE ACT OF 1934 |
For the quarterly period ended September 30, 2024
OR | | | | | |
| ¨ | TRANSITION REPORT PURSUANT TO SECTION 13 OR 15(d) OF THE SECURITIES EXCHANGE ACT OF 1934 |
For the transition period from to
Commission file number 1-10258
Tredegar Corporation
(Exact Name of Registrant as Specified in Its Charter)
| | | | | | | | |
| Virginia | | 54-1497771 |
(State or Other Jurisdiction of
Incorporation or Organization) | | (I.R.S. Employer
Identification No.) |
| | | | | | | | | | | |
| 1100 Boulders Parkway | | |
| Richmond, | Virginia | | 23225 |
| (Address of Principal Executive Offices) | | (Zip Code) |
Registrant’s Telephone Number, Including Area Code: (804) 330-1000
Securities registered pursuant to Section 12(b) of the Act: | | | | | | | | |
| Title of each class | Trading Symbol(s) | Name of each exchange on which registered |
| Common stock, no par value | TG | New York Stock Exchange |
Indicate by check mark whether the registrant (1) has filed all reports required to be filed by Section 13 or 15(d) of the Securities Exchange Act of 1934 during the preceding 12 months (or for such shorter period that the registrant was required to file such reports), and (2) has been subject to such filing requirements for the past 90 days. Yes x No ¨
Indicate by check mark whether the registrant has submitted electronically every Interactive Data File required to be submitted pursuant to Rule 405 of Regulation S-T (232.405 of this chapter) during the preceding 12 months (or for such shorter period that the registrant was required to submit such files). Yes x No ¨
Indicate by check mark whether the registrant is a large accelerated filer, an accelerated filer, a non-accelerated filer, a smaller reporting company, or an emerging growth company. See the definitions of “large accelerated filer,” “accelerated filer,” “smaller reporting company,” and “emerging growth company” in Rule 12b-2 of the Exchange Act. | | | | | | | | | | | | | | | | | | | | | | | |
| Large accelerated filer | | ¨ | Accelerated filer | x | Smaller reporting company | | x |
| | | | | |
| Non-accelerated filer | | ¨ | | Emerging growth company | | ☐ |
If an emerging growth company, indicate by check mark if the registrant has elected not to use the extended transition period for complying with any new or revised financial accounting standards provided pursuant to Section 13(a) of the Exchange Act. ¨
Indicate by check mark whether the registrant is a shell company (as defined in Rule 12b-2 of the Exchange Act). Yes ☐ No x
The number of shares of Common Stock, no par value, outstanding as of November 1, 2024: 34,360,952
Tredegar Corporation
Table of Contents
PART I - FINANCIAL INFORMATION
Item 1. Financial Statements.
Tredegar Corporation
Condensed Consolidated Balance Sheets
(In Thousands, Except Share Data)
(Unaudited) | | | | | | | | | | | |
| September 30, | | December 31, |
| 2024 | | 2023 |
| Assets | | | |
| Current assets: | | | |
| Cash and cash equivalents | $ | 2,724 | | | $ | 9,660 | |
| Restricted cash | 3,864 | | | 3,795 | |
| Accounts and other receivables, net | 81,636 | | | 67,938 | |
| Income taxes recoverable | 954 | | | 1,182 | |
| Inventories | 88,058 | | | 82,037 | |
| Prepaid expenses and other | 11,026 | | | 12,065 | |
| Total current assets | 188,262 | | | 176,677 | |
| Property, plant and equipment, at cost | 541,608 | | | 541,046 | |
| Less: accumulated depreciation | (372,920) | | | (357,591) | |
| Net property, plant and equipment | 168,688 | | | 183,455 | |
| Right-of-use leased assets | 15,663 | | | 11,848 | |
| Identifiable intangible assets, net | 8,361 | | | 9,851 | |
| Goodwill | 35,717 | | | 35,717 | |
| Deferred income taxes | 22,765 | | | 25,034 | |
| Other assets | 3,085 | | | 3,879 | |
| Total assets | $ | 442,541 | | | $ | 446,461 | |
| Liabilities and Shareholders’ Equity | | | |
| Current liabilities: | | | |
| Accounts payable | $ | 89,070 | | | $ | 95,023 | |
| Accrued expenses | 24,000 | | | 24,442 | |
| Lease liability, short-term | 2,824 | | | 2,107 | |
| Short-term debt | 1,356 | | | — | |
| ABL revolving facility (matures June 30, 2026) | 122,000 | | | 126,322 | |
| Income taxes payable | 8 | | | 1,210 | |
| Total current liabilities | 239,258 | | | 249,104 | |
| Lease liability, long-term | 13,963 | | | 10,942 | |
| Long-term debt | 20,000 | | | 20,000 | |
| Pension and other postretirement benefit obligations, net | 6,464 | | | 6,643 | |
| | | |
| Other non-current liabilities | 4,408 | | | 4,119 | |
| Total liabilities | 284,093 | | | 290,808 | |
| Shareholders’ equity: | | | |
Common stock, no par value (authorized shares 150,000,000, issued and outstanding 34,510,556 shares at September 30, 2024 and 34,408,638 shares at December 31, 2023) | 63,031 | | | 61,606 | |
Common stock held in trust for savings restoration plan (118,543 shares at September 30, 2024 and December 31, 2023) | (2,233) | | | (2,233) | |
| Accumulated other comprehensive income (loss): | | | |
| Foreign currency translation adjustment | (88,777) | | | (83,037) | |
| Gain (loss) on derivative financial instruments | (141) | | | 801 | |
| Pension and other postretirement benefit adjustments | 457 | | | 539 | |
| Retained earnings | 186,111 | | | 177,977 | |
| Total shareholders’ equity | 158,448 | | | 155,653 | |
| Total liabilities and shareholders’ equity | $ | 442,541 | | | $ | 446,461 | |
See accompanying notes to the condensed consolidated financial statements.
Tredegar Corporation
Condensed Consolidated Statements of Income (Loss)
(In Thousands, Except Per Share Data)
(Unaudited)
| | | | | | | | | | | | | | | | | | | | | | | |
| Three Months Ended September 30, | | Nine Months Ended September 30, |
| | 2024 | | 2023 | | 2024 | | 2023 |
| Revenues and other items: | | | | | | | |
| Sales | $ | 182,051 | | | $ | 166,192 | | | $ | 548,022 | | | $ | 535,481 | |
| Other income (expense), net | (22) | | | (51) | | | 310 | | | 210 | |
| 182,029 | | | 166,141 | | | 548,332 | | | 535,691 | |
| Costs and expenses: | | | | | | | |
| Cost of goods sold | 151,676 | | | 144,539 | | | 442,384 | | | 457,332 | |
| Freight | 7,085 | | | 6,733 | | | 20,833 | | | 19,977 | |
| Selling, general and administrative | 21,795 | | | 21,350 | | | 59,940 | | | 57,244 | |
| Research and development | 475 | | | 794 | | | 994 | | | 3,375 | |
| Amortization of identifiable intangibles | 462 | | | 465 | | | 1,410 | | | 1,433 | |
| Pension and postretirement benefits | 54 | | | 3,118 | | | 163 | | | 9,955 | |
| Interest expense | 3,480 | | | 3,106 | | | 10,314 | | | 7,791 | |
| Asset impairments and costs associated with exit and disposal activities, net of adjustments | — | | | 4,633 | | | 587 | | | 4,702 | |
| Pension settlement loss | — | | | 25,612 | | | — | | | 25,612 | |
| Goodwill impairment | — | | | 19,478 | | | — | | | 34,891 | |
| Total | 185,027 | | | 229,828 | | | 536,625 | | | 622,312 | |
| Income (loss) before income taxes | (2,998) | | | (63,687) | | | 11,707 | | | (86,621) | |
| Income tax expense (benefit) | 948 | | | (13,307) | | | 3,573 | | | (16,307) | |
| Net income (loss) | $ | (3,946) | | | $ | (50,380) | | | $ | 8,134 | | | $ | (70,314) | |
| | | | | | | |
| Earnings (loss) per share: | | | | | | | |
| Basic | $ | (0.11) | | | $ | (1.47) | | | $ | 0.24 | | | $ | (2.06) | |
| Diluted | $ | (0.11) | | | $ | (1.47) | | | $ | 0.24 | | | $ | (2.06) | |
| | | | | | | |
| Shares used to compute earnings (loss) per share: | | | | | | | |
| Basic | 34,391 | | | 34,264 | | | 34,364 | | | 34,081 | |
| Diluted | 34,391 | | | 34,264 | | | 34,364 | | | 34,081 | |
See accompanying notes to the condensed consolidated financial statements.
Tredegar Corporation
Condensed Consolidated Statements of Comprehensive Income (Loss)
(In Thousands)
(Unaudited)
| | | | | | | | | | | |
| Three Months Ended September 30, |
| | 2024 | | 2023 |
| Net income (loss) | $ | (3,946) | | | $ | (50,380) | |
| Other comprehensive income (loss): | | | |
Unrealized foreign currency translation adjustment (net of tax expense of $4 in 2024 and net of tax expense of $25 in 2023) | 1,496 | | | (1,818) | |
Derivative financial instruments adjustment (net of tax expense of $120 in 2024 and net of tax benefit of $538 in 2023) | 423 | | | 69 | |
| Pension & other postretirement benefit adjustment: | | | |
| Net gains (losses) and prior service costs | — | | | 442 | |
Recognition in earnings of net actuarial loss for pension settlement and related tax of $5,581 | — | | | 20,031 | |
Amortization of prior service costs and net gains or losses (net of tax benefit of $7 in 2024 and net of tax expense of $637 in 2023) | (27) | | | 1,949 | |
| Other comprehensive income (loss) | 1,892 | | | 20,673 | |
| Comprehensive income (loss) | $ | (2,054) | | | $ | (29,707) | |
| | | | | | | | | | | |
| Nine Months Ended September 30, |
| | 2024 | | 2023 |
| Net income (loss) | $ | 8,134 | | | $ | (70,314) | |
| Other comprehensive income (loss): | | | |
Unrealized foreign currency translation adjustment (net of tax benefit of $466 in 2024 and net of tax expense of $640 in 2023) | (5,740) | | | 923 | |
Derivative financial instruments adjustment (net of tax benefit of $273 in 2024 and net of tax expense of $798 in 2023) | (942) | | | 1,706 | |
| Pension & other postretirement benefit adjustment: | | | |
| Net gains (losses) and prior service costs | — | | | 442 | |
Recognition in earnings of net actuarial loss for pension settlement and related tax of $5,581 | — | | | 20,031 | |
Amortization of prior service costs and net gains or losses (net of tax benefit of $23 in 2024 and net of tax expense of $1,911 in 2023) | (82) | | | 6,522 | |
| Other comprehensive income (loss) | (6,764) | | | 29,624 | |
| Comprehensive income (loss) | $ | 1,370 | | | $ | (40,690) | |
See accompanying notes to the condensed consolidated financial statements.
Tredegar Corporation
Condensed Consolidated Statements of Cash Flows
(In Thousands)
(Unaudited) | | | | | | | | | | | |
| Nine Months Ended September 30, |
| 2024 | | 2023 |
| Cash flows from operating activities: | | | |
| Net income (loss) | $ | 8,134 | | | $ | (70,314) | |
| Adjustments for noncash items: | | | |
| Depreciation | 18,372 | | | 19,516 | |
| Amortization of identifiable intangibles | 1,410 | | | 1,433 | |
| Reduction of right-of-use lease asset | 1,735 | | | 1,633 | |
| Goodwill impairment | — | | | 34,891 | |
| Deferred income taxes | 2,975 | | | (16,820) | |
| Accrued pension and post-retirement benefits | 163 | | | 9,955 | |
| Pension settlement loss | — | | | 25,612 | |
| Stock-based compensation expense | 1,950 | | | 1,196 | |
| Gain on investment in kaléo | (144) | | | (262) | |
| Write-down of Richmond, Virginia Technical Center assets | — | | | 3,387 | |
| Changes in assets and liabilities: | | | |
| Accounts and other receivables | (14,683) | | | 14,630 | |
| Inventories | (8,711) | | | 49,589 | |
| Income taxes recoverable/payable | (952) | | | (1,688) | |
| Prepaid expenses and other | (286) | | | (142) | |
| Accounts payable and accrued expenses | (3,454) | | | (27,970) | |
| Lease liability | (2,118) | | | (1,669) | |
| Pension and postretirement benefit plan contributions | (455) | | | (455) | |
| Other, net | 2,117 | | | 1,716 | |
| Net cash provided by (used in) operating activities | 6,053 | | | 44,238 | |
| Cash flows from investing activities: | | | |
| Capital expenditures | (7,696) | | | (22,270) | |
| Proceeds from the sale of kaléo | 144 | | | 262 | |
| Proceeds from the sale of assets | 83 | | | — | |
| Net cash provided by (used in) investing activities | (7,469) | | | (22,008) | |
| Cash flows from financing activities: | | | |
| Borrowings | 519,274 | | | 87,000 | |
| Debt principal payments | (522,240) | | | (69,000) | |
| Dividends paid | — | | | (8,884) | |
| Debt financing costs | (587) | | | (1,404) | |
| | | |
| Net cash provided by (used in) financing activities | (3,553) | | | 7,712 | |
| Effect of exchange rate changes on cash | (1,898) | | | (570) | |
| Increase (decrease) in cash, cash equivalents and restricted cash | (6,867) | | | 29,372 | |
| Cash, cash equivalents and restricted cash at beginning of period | 13,455 | | | 19,232 | |
| Cash, cash equivalents and restricted cash at end of period | $ | 6,588 | | | $ | 48,604 | |
See accompanying notes to the condensed consolidated financial statements.
Tredegar Corporation
Condensed Consolidated Statements of Shareholders’ Equity
(In Thousands, Except Share and Per Share Data)
(Unaudited)
The following summarizes the changes in shareholders’ equity for the three month period ended September 30, 2024:
| | | | | | | | | | | | | | | | | | | | | | | | | | | | | |
| Common Stock | | Retained Earnings | | Trust for Savings Restoration Plan | | Accumulated Other Comprehensive Income (Loss) | | Total Shareholders’ Equity |
Balance July 1, 2024 | $ | 62,493 | | | $ | 190,057 | | | $ | (2,233) | | | $ | (90,353) | | | $ | 159,964 | |
| Net income (loss) | — | | | (3,946) | | | — | | | — | | | (3,946) | |
| Foreign currency translation adjustment | — | | | — | | | — | | | 1,496 | | | 1,496 | |
| Derivative financial instruments adjustment | — | | | — | | | — | | | 423 | | | 423 | |
| Amortization of prior service costs and net gains or losses | — | | | — | | | — | | | (27) | | | (27) | |
| | | | | | | | | |
| | | | | | | | | |
| | | | | | | | | |
| Stock-based compensation expense | 538 | | | — | | | — | | | — | | | 538 | |
| | | | | | | | | |
| | | | | | | | | |
Balance September 30, 2024 | $ | 63,031 | | | $ | 186,111 | | | $ | (2,233) | | | $ | (88,461) | | | $ | 158,448 | |
The following summarizes the changes in shareholders’ equity for the nine month period ended September 30, 2024:
| | | | | | | | | | | | | | | | | | | | | | | | | | | | | |
| | Common
Stock | | Retained
Earnings | | Trust for
Savings
Restoration
Plan | | Accumulated Other
Comprehensive Income (Loss) | | Total
Shareholders’
Equity |
Balance January 1, 2024 | $ | 61,606 | | | $ | 177,977 | | | $ | (2,233) | | | $ | (81,697) | | | $ | 155,653 | |
| Net income (loss) | — | | | 8,134 | | | — | | | — | | | 8,134 | |
| Foreign currency translation adjustment | — | | | — | | | — | | | (5,740) | | | (5,740) | |
| Derivative financial instruments adjustment | — | | | — | | | — | | | (942) | | | (942) | |
| Amortization of prior service costs and net gains or losses | — | | | — | | | — | | | (82) | | | (82) | |
| | | | | | | | | |
| Stock-based compensation expense | 1,651 | | | — | | | — | | | — | | | 1,651 | |
| Repurchase of employee common stock for tax withholdings | (226) | | | — | | | — | | | — | | | (226) | |
| | | | | | | | | |
Balance September 30, 2024 | $ | 63,031 | | | $ | 186,111 | | | $ | (2,233) | | | $ | (88,461) | | | $ | 158,448 | |
The following summarizes the changes in shareholders’ equity for the three month period ended September 30, 2023:
| | | | | | | | | | | | | | | | | | | | | | | | | | | | | |
| | Common
Stock | | Retained
Earnings | | Trust for
Savings
Restoration
Plan | | Accumulated Other
Comprehensive Income (Loss) | | Total
Shareholders’
Equity |
| Balance at July 1, 2023 | $ | 60,078 | | | $ | 263,933 | | | $ | (2,218) | | | $ | (138,644) | | | $ | 183,149 | |
| Net income (loss) | — | | | (50,380) | | | — | | | — | | | (50,380) | |
| Foreign currency translation adjustment | — | | | — | | | — | | | (1,818) | | | (1,818) | |
| Derivative financial instruments adjustment | — | | | — | | | — | | | 69 | | | 69 | |
| Amortization of prior service costs and net gains or losses | — | | | — | | | — | | | 1,949 | | | 1,949 | |
| Net gains or (losses) and prior service costs | — | | | — | | | — | | | 442 | | | 442 | |
| Recognition in earnings of net actuarial loss for pension settlement | — | | | — | | | — | | | 20,031 | | | 20,031 | |
| | | | | | | | | |
| Stock-based compensation expense | 749 | | | — | | | — | | | — | | | 749 | |
| | | | | | | | | |
| Tredegar common stock purchased by trust for savings restoration plan | — | | | 15 | | | (15) | | | — | | | — | |
| Balance at September 30, 2023 | $ | 60,827 | | | $ | 213,568 | | | $ | (2,233) | | | $ | (117,971) | | | $ | 154,191 | |
The following summarizes the changes in shareholders’ equity for the nine month period ended September 30, 2023:
| | | | | | | | | | | | | | | | | | | | | | | | | | | | | |
| | Common
Stock | | Retained
Earnings | | Trust for
Savings
Restoration
Plan | | Accumulated Other
Comprehensive Income (Loss) | | Total
Shareholders’
Equity |
| Balance at January 1, 2023 | $ | 58,824 | | | $ | 292,721 | | | $ | (2,188) | | | $ | (147,595) | | | $ | 201,762 | |
| Net income (loss) | — | | | (70,314) | | | — | | | — | | | (70,314) | |
| Foreign currency translation adjustment | — | | | — | | | — | | | 923 | | | 923 | |
| Derivative financial instruments adjustment | — | | | — | | | — | | | 1,706 | | | 1,706 | |
| Amortization of prior service costs and net gains or losses | — | | | — | | | — | | | 6,522 | | | 6,522 | |
| Net gains or (losses) and prior service costs | — | | | — | | | — | | | 442 | | | 442 | |
| Recognition in earnings of net actuarial loss for pension settlement | — | | | — | | | — | | | 20,031 | | | 20,031 | |
Cash dividends declared ($0.26 per share) | — | | | (8,884) | | | — | | | — | | | (8,884) | |
| Stock-based compensation expense | 2,257 | | | — | | | — | | | — | | | 2,257 | |
| Repurchase of employee common stock for tax withholdings | (254) | | | — | | | — | | | — | | | (254) | |
| Tredegar common stock purchased by trust for savings restoration plan | — | | | 45 | | | (45) | | | — | | | — | |
| Balance at September 30, 2023 | $ | 60,827 | | | $ | 213,568 | | | $ | (2,233) | | | $ | (117,971) | | | $ | 154,191 | |
See accompanying notes to the condensed consolidated financial statements.
TREDEGAR CORPORATION
NOTES TO THE CONDENSED CONSOLIDATED FINANCIAL STATEMENTS
(Unaudited)
1. BASIS OF PRESENTATION AND SUMMARY OF SIGNIFICANT ACCOUNTING POLICIES
In the opinion of management, the accompanying condensed consolidated financial statements of Tredegar Corporation and its subsidiaries (“Tredegar,” “the Company,” “we,” “us” or “our”) contain all adjustments necessary to state fairly, in all material respects, Tredegar’s condensed consolidated financial position as of September 30, 2024, the condensed consolidated results of operations for the three and nine months ended September 30, 2024 and 2023, the condensed consolidated cash flows for the nine months ended September 30, 2024 and 2023, and the condensed consolidated changes in shareholders’ equity for the three and nine months ended September 30, 2024 and 2023, in accordance with U.S. generally accepted accounting principles (“GAAP”). All such adjustments, unless otherwise detailed in the notes to the condensed consolidated financial statements, are deemed to be of a normal, recurring nature.
The Company operates on a calendar fiscal year except for the Aluminum Extrusions segment, which operates on a 52/53-week fiscal year basis. As such, the fiscal third quarter for 2024 and 2023 for this segment references 13-week periods ended September 29, 2024 and September 24, 2023, respectively. The Company does not believe the impact of reporting the results of this segment as stated above is material to the consolidated financial results. The Company may fund or receive cash from the Aluminum Extrusions segment based on Aluminum Extrusion’s cash flows from operations during the intervening period from Aluminum Extrusion’s fiscal quarter end and the Company’s fiscal quarter end.
The condensed consolidated financial statements as of December 31, 2023 that is included herein was derived from the audited consolidated financial statements provided in the Company’s Annual Report on Form 10-K for the year ended December 31, 2023 (“2023 Form 10-K”) but does not include all disclosures required by GAAP. These financial statements should be read in conjunction with the audited consolidated financial statements and related notes included in the 2023 Form 10-K.
The results of operations for the three and nine months ended September 30, 2024, are not necessarily indicative of the results to be expected for the full year.
Sale of Flexible Packaging Films
On September 1, 2023, the Company announced that it had entered into a definitive agreement to sell its Flexible Packaging Films business (also referred to as "Terphane") to Oben Group (the "Terphane Sale"). Completion of the sale is contingent upon the satisfaction of customary closing conditions, including the receipt of certain competition filing approvals by authorities in Brazil and Colombia.
The Colombian authority cleared the merger review regarding the transaction in early February 2024. On October 27, 2023, the Company filed the requisite competition forms with the Administrative Council for Economic Defense (“CADE”) in Brazil. As part of the Brazilian merger review process regarding the sale of Terphane to Oben Group ("Oben"), on May 13, 2024, the General Superintendence of the Administrative Council for Economic Defense ("SG-CADE") issued a non-binding opinion ("SG Opinion") recommending the rejection of the transaction. Following this first stage of the two-stage Brazilian merger review process for complex transactions, the case was submitted to the CADE Tribunal, in accordance with the customary Brazilian merger review process.
As of September 30, 2024, the Company reported results for Terphane as a continuing operation, due to the uncertainty related to the Brazilian merger review process. On October 16, 2024, CADE approved a merger control agreement allowing Tredegar to proceed with the sale of Terphane to Oben. This approval was the indication that the sale of Terphane was probable. Refer to Note 11 for additional information.
Closure of PE Films Technical Center
In August 2023, the Company adopted a plan to close the PE Films technical center in Richmond, VA and reduce its efforts to develop and sell films supporting the semiconductor market. Research & development activities for PE Films are now being performed at the production facility in Pottsville, PA. PE Films continues to have new business opportunities primarily relating to surface protection films that protect components of flat panel and flexible displays. All activities ceased at the PE Films technical center in Richmond, VA as of the end of the first quarter of 2024. The Company recognized expense incurred through September 30, 2024 associated with the exit activities of $0.2 million for building closure costs. In addition, the Company recognized a non-cash loss on the lease abandonment ($0.3 million).
Supply Chain Financing
As of September 30, 2024 and December 31, 2023, $11.8 million and $15.8 million, respectively, of the Company’s accounts payable were financed by participating suppliers through third-party financial institutions.
Goodwill
The Company assesses goodwill for impairment when events or circumstances indicate that the carrying value may not be recoverable, or, at a minimum, on an annual basis (December 1st of each year). As of September 30, 2024, the Company’s reporting units with goodwill were Surface Protection in PE Films ("Surface Protection") and Futura in Aluminum Extrusions (“Futura”). No events or circumstances were identified during the third quarter of 2024 that indicate that Surface Protection's fair value is more likely than not less than its carrying amount. No events or circumstances were identified during the third quarter of 2023 that indicated that Futura’s fair value was more likely than not less than its carrying amount.
Uncertainty about the timing of a recovery in the consumer electronics market persists, and manufacturers in the supply chain for consumer electronics continue to experience reduced capacity utilization and inventory corrections. In light of the limited visibility on the timing of a recovery and the expected adverse future impact to the Surface Protection business, coupled with a cautious outlook on new product development opportunities, the Company performed a Step 1 goodwill impairment analysis of the Surface Protection component of PE Films, as of September 30, 2023. This analysis utilized projections that contemplate the expected market recovery and business conditions, including for its three significant customers, as these events indicated Surface Protection’s fair value is more likely than not less than its carrying amount.
The Company estimated the fair value of Surface Protection at September 30, 2023 by: (i) computing an estimated enterprise value (“EV”) utilizing the discounted cash flow method (the “DCF Method”), (ii) applying adjustments for any surplus or deficient working capital, (iii) adding cash and cash equivalents, and (iv) subtracting interest-bearing debt. The DCF Method was used, incorporating Surface Protection’s latest projections which reflect updated expected market recovery levels, feasibility of launching new product applications, competitive pricing and cash flows associated with production efficiencies, as well as consideration of cost savings and inventory corrections.
The analysis concluded that the fair value of Surface Protection was less than its carrying value, thus a non-cash partial goodwill impairment of $19.5 million ($15.1 million after deferred income tax benefits) was recognized during the third quarter of 2023 and $34.9 million ($27.0 million after deferred income tax benefits) during the first nine months of 2023.
Accounting standards not yet adopted
In October 2023, the Financial Accounting Standards Board ("FASB") issued Accounting Standards Update ("ASU") 2023-06 to amend various paragraphs in the Accounting Standards Codification ("ASC") to primarily reflect the issuance of U.S. Securities and Exchange Commission ("SEC") Staff Bulletin No. 33-10532. ASU 2023-06 will impact various disclosure areas, including the statement of cash flows, accounting changes and error corrections, earnings per share, debt, equity, derivatives, and transfers of financial assets. The amendments in this ASU 2023-06 will be effective on the date the related disclosures are removed from Regulation S-X or Regulation S-K by the SEC and will no longer be effective if the SEC has not removed the applicable disclosure requirement by June 30, 2027. Early adoption is not permitted. The Company does not expect a material impact from the adoption of this standard on our consolidated financial statements and related disclosures.
In November 2023, the FASB issued ASU 2023-07 to improve reportable segment disclosure and requirements, primarily through the enhanced disclosures about significant segment expenses. ASU 2023-07 expands public entities’ segment disclosures by requiring disclosure of significant segment expenses that are regularly provided to the chief operating decision maker ("CODM") and included within each reported measure of segment profit or loss, an amount and description of its composition for other segment items, and interim disclosures of a reportable segment’s profit or loss and assets. This ASU is effective for fiscal years beginning after December 15, 2023 and interim periods beginning after December 15, 2024, with early adoption permitted. The amendments in this ASU are to be applied retrospectively to all prior periods presented in the financial statements. The Company has three reportable segments and continues to evaluate additional disclosures that may be required in its Form 10-K for the year ended December 31, 2024.
In December 2023, the FASB issued ASU 2023-09 to improve the income tax disclosures related to the rate reconciliation and income taxes paid information and to improve the effectiveness of income tax disclosures. The amendments in this ASU will require the Company to disclose specified additional information in its income tax rate reconciliation and provide additional information for reconciling items that meet a quantitative threshold. ASU 2023-09 will also require the Company to disaggregate its income taxes paid disclosure by federal, state and foreign taxes, with further disaggregation required for significant individual jurisdictions. This ASU is effective for annual periods beginning after December 15, 2024; early adoption is permitted. The Company is currently evaluating the impact of this standard on our consolidated financial statements and related disclosures.
2. ACCOUNTS AND OTHER RECEIVABLES
As of September 30, 2024 and December 31, 2023, accounts and other receivables, net include the following: | | | | | | | | | | | |
| (In thousands) | September 30, 2024 | | December 31, 2023 |
| Customer receivables | $ | 81,735 | | | $ | 67,183 | |
| Other receivables | 2,327 | | | 3,056 | |
| Total accounts and other receivables | 84,062 | | | 70,239 | |
| Less: Allowance for bad debts | (2,426) | | | (2,301) | |
| Total accounts and other receivables, net | $ | 81,636 | | | $ | 67,938 | |
3. INVENTORIES
The components of inventories are as follows: | | | | | | | | | | | |
| (In thousands) | September 30, 2024 | | December 31, 2023 |
| Finished goods | $ | 31,782 | | | $ | 29,821 | |
| Work-in-process | 8,332 | | | 7,830 | |
| Raw materials | 23,497 | | | 21,939 | |
| Stores, supplies and other | 24,447 | | | 22,447 | |
| Total | $ | 88,058 | | | $ | 82,037 | |
4. PENSION AND OTHER POSTRETIREMENT BENEFITS
Tredegar sponsored a noncontributory defined benefit (pension) plan covering certain current and former U.S. employees. As of January 31, 2018, the plan no longer accrued benefits associated with crediting employees for service, thereby freezing all future benefits under the plan. On February 10, 2022, Tredegar announced the initiation of a process to terminate and settle its frozen defined benefit pension plan through lump sum distributions and the purchase of annuity contracts. On November 3, 2023, the pension plan termination and settlement process for the Company was completed, and the remaining pension plan obligation was transferred to Massachusetts Mutual Life Insurance Company. During 2023, the Company recognized a total pre-tax pension settlement loss of $92.3 million.
During the third quarter of 2023, the Company remeasured the pension plan, which resulted in a pre-tax pension settlement loss in the condensed consolidated results of operation of $25.6 million. The remeasurement of the pension benefit obligation and plan assets was triggered by $64.5 million of lump sum distributions from the pension plan assets which exceeded the pension plan's service and interest cost.
Tredegar also has a non-qualified supplemental pension plan covering certain employees. Effective December 31, 2005, further participation in this plan was terminated and benefit accruals for existing participants were frozen. Pension expense recognized for this plan was immaterial in the three and nine months ended September 30, 2024 and 2023. This information has been included in the pension benefit table below.
The components of net periodic benefit cost for the pension and other postretirement benefit programs reflected in the condensed consolidated statements of income for the three and nine months ended September 30, 2024 and 2023, are shown below: | | | | | | | | | | | | | | | | | | | | | | | |
| Pension Benefits | | Other Post-Retirement Benefits |
| | Three Months Ended September 30, | | Three Months Ended September 30, |
| (In thousands) | 2024 | | 2023 | | 2024 | | 2023 |
| Service cost | $ | — | | | $ | — | | | $ | 3 | | | $ | 3 | |
| Interest cost | 20 | | | 2,786 | | | 65 | | | 71 | |
| Expected return on plan assets | — | | | (2,328) | | | — | | | — | |
Pension settlement loss(a) | — | | | 25,612 | | | — | | | — | |
| Amortization of prior service costs, (gains) losses and net transition asset | 3 | | | 2,644 | | | (37) | | | (58) | |
| Net periodic benefit cost | $ | 23 | | | $ | 28,714 | | | $ | 31 | | | $ | 16 | |
| | | | | | | |
| Pension Benefits | | Other Post-Retirement Benefits |
| | Nine Months Ended September 30, | | Nine Months Ended September 30, |
| (In thousands) | 2024 | | 2023 | | 2024 | | 2023 |
| Service cost | $ | — | | | $ | — | | | $ | 8 | | | $ | 9 | |
| Interest cost | 57 | | | 8,842 | | | 203 | | | 213 | |
| Expected return on plan assets | — | | | (7,542) | | | — | | | — | |
Pension settlement loss(a) | — | | | 25,612 | | | — | | | — | |
| Amortization of prior service costs, (gains) losses and net transition asset | 15 | | | 8,609 | | | (120) | | | (176) | |
| Net periodic benefit cost | $ | 72 | | | $ | 35,521 | | | $ | 91 | | | $ | 46 | |
| (a) Pension settlement loss, included in the consolidated statements of operation, represents pension settlement charges due to lump sum payments to participants. |
Pension and other postretirement liabilities were $7.1 million and $7.3 million at September 30, 2024 and December 31, 2023, respectively ($0.7 million included in “Accrued expenses” at September 30, 2024 and December 31, 2023 with the remainder included in “Pension and other postretirement benefit obligations, net” in the condensed consolidated balance sheets).
Tredegar funds its other postretirement benefits on a claims-made basis; for 2024, the Company anticipates the amount will be consistent with amounts paid for the year ended December 31, 2023, or approximately $0.4 million.
5. EARNINGS PER SHARE
Basic earnings per share is computed by dividing net income (loss) by the weighted average number of shares of common stock outstanding. Diluted earnings per share is computed by dividing net income (loss) by the weighted average common and potentially dilutive common equivalent shares outstanding, determined as follows:
| | | | | | | | | | | | | | | | | | | | | | | |
| | Three Months Ended September 30, | | Nine Months Ended September 30, |
| (In thousands) | 2024 | | 2023 | | 2024 | | 2023 |
| Weighted average shares outstanding used to compute basic earnings per share | 34,391 | | | 34,264 | | | 34,364 | | | 34,081 | |
| Incremental dilutive shares attributable to stock options and restricted stock | — | | | — | | | — | | | — | |
| Shares used to compute diluted earnings per share | 34,391 | | | 34,264 | | | 34,364 | | | 34,081 | |
Incremental shares attributable to stock options and restricted stock are computed under the treasury stock method using the average market price during the related period. If the Company had reported net income for the three months ended September 30, 2024, average out-of-the-money options to purchase shares that were excluded from the calculation of incremental shares attributable to stock options and restricted stock would have been 2,353,905. Average out-of-the-money options to purchase shares that were excluded from the calculation of incremental shares attributable to stock options and
restricted stock were 2,550,542 for the nine months ended September 30, 2024. If the Company had reported net income for the three and nine months ended September 30, 2023, the average out-of-the-money options to purchase shares that would be excluded from the calculation of incremental shares attributable to stock options and restricted stock would have been 3,019,333 and 2,893,677, respectively.
6. ACCUMULATED OTHER COMPREHENSIVE INCOME (LOSS)
The changes in accumulated other comprehensive income (loss) by component for the three months ended September 30, 2024.
| | | | | | | | | | | | | | | | | | | | | | | |
| (In thousands) | Foreign Currency Translation | | Gain (Loss) on Derivative Financial Instruments | | Pension & Other Postretirement Benefit Adjust | | Total Accumulated Other Comprehensive Income (Loss) |
| Balance at July 1, 2024 | $ | (90,273) | | | $ | (564) | | | $ | 484 | | | $ | (90,353) | |
| Other comprehensive income (loss) | 1,500 | | | 262 | | | — | | | 1,762 | |
| Income tax (expense) benefit | (4) | | | (41) | | | — | | | (45) | |
| Other comprehensive income (loss), net of tax | 1,496 | | | 221 | | | — | | | 1,717 | |
| Reclassification adjustment to net income (loss) | — | | | 281 | | | (34) | | | 247 | |
| Income tax (expense) benefit | — | | | (79) | | | 7 | | | (72) | |
| Reclassification adjustment to net income (loss), net of tax | — | | | 202 | | | (27) | | | 175 | |
| Other comprehensive income (loss), net of tax | 1,496 | | | 423 | | | (27) | | | 1,892 | |
Balance at September 30, 2024 | $ | (88,777) | | | $ | (141) | | | $ | 457 | | | $ | (88,461) | |
The changes in accumulated other comprehensive income (loss) by component for the nine months ended September 30, 2024.
| | | | | | | | | | | | | | | | | | | | | | | |
| (In thousands) | Foreign Currency Translation | | Gain (Loss) on Derivative Financial Instruments | | Pension & Other Postretirement Benefit Adjust | | Total Accumulated Other Comprehensive Income (Loss) |
| Balance at January 1, 2024 | $ | (83,037) | | | $ | 801 | | | $ | 539 | | | $ | (81,697) | |
| Other comprehensive income (loss) | (6,206) | | | (1,435) | | | — | | | (7,641) | |
| Income tax (expense) benefit | 466 | | | 275 | | | — | | | 741 | |
| Other comprehensive income (loss), net of tax | (5,740) | | | (1,160) | | | — | | | (6,900) | |
| Reclassification adjustment to net income (loss) | — | | | 220 | | | (105) | | | 115 | |
| Income tax (expense) benefit | — | | | (2) | | | 23 | | | 21 | |
| Reclassification adjustment to net income (loss), net of tax | — | | | 218 | | | (82) | | | 136 | |
| Other comprehensive income (loss), net of tax | (5,740) | | | (942) | | | (82) | | | (6,764) | |
Balance at September 30, 2024 | $ | (88,777) | | | $ | (141) | | | $ | 457 | | | $ | (88,461) | |
The changes in accumulated other comprehensive income (loss) by component for the three months ended September 30, 2023.
| | | | | | | | | | | | | | | | | | | | | | | |
| (In thousands) | Foreign Currency Translation | | Gain (Loss) on Derivative Financial Instruments | | Pension & Other Postretirement Benefit Adjust | | Total Accumulated Other Comprehensive Income (Loss) |
| Balance at July 1, 2023 | $ | (83,338) | | | $ | (843) | | | $ | (54,463) | | | $ | (138,644) | |
| Other comprehensive income (loss) | (1,793) | | | 2,287 | | | 442 | | | 936 | |
| Income tax (expense) benefit | (25) | | | (197) | | | — | | | (222) | |
| Other comprehensive income (loss), net of tax | (1,818) | | | 2,090 | | | 442 | | | 714 | |
| Reclassification adjustment to net income (loss) | — | | | (2,756) | | | 28,198 | | | 25,442 | |
| Income tax (expense) benefit | — | | | 735 | | | (6,218) | | | (5,483) | |
| Reclassification adjustment to net income (loss), net of tax | — | | | (2,021) | | | 21,980 | | | 19,959 | |
| Other comprehensive income (loss), net of tax | (1,818) | | | 69 | | | 22,422 | | | 20,673 | |
Balance at September 30, 2023 | $ | (85,156) | | | $ | (774) | | | $ | (32,041) | | | $ | (117,971) | |
The changes in accumulated other comprehensive income (loss) by component for the nine months ended September 30, 2023.
| | | | | | | | | | | | | | | | | | | | | | | |
| (In thousands) | Foreign Currency Translation | | Gain (Loss) on Derivative Financial Instruments | | Pension & Other Postretirement Benefit Adjust | | Total Accumulated Other Comprehensive Income (Loss) |
| Balance at January 1, 2023 | $ | (86,079) | | | $ | (2,480) | | | $ | (59,036) | | | $ | (147,595) | |
| Other comprehensive income (loss) | 1,563 | | | 7,852 | | | 442 | | | 9,857 | |
| Income tax (expense) benefit | (640) | | | (2,228) | | | — | | | (2,868) | |
| Other comprehensive income (loss), net of tax | 923 | | | 5,624 | | | 442 | | | 6,989 | |
| Reclassification adjustment to net income (loss) | — | | | (5,350) | | | 34,045 | | | 28,695 | |
| Income tax (expense) benefit | — | | | 1,432 | | | (7,492) | | | (6,060) | |
| Reclassification adjustment to net income (loss), net of tax | — | | | (3,918) | | | 26,553 | | | 22,635 | |
| Other comprehensive income (loss), net of tax | 923 | | | 1,706 | | | 26,995 | | | 29,624 | |
Balance at September 30, 2023 | $ | (85,156) | | | $ | (774) | | | $ | (32,041) | | | $ | (117,971) | |
The amounts reclassified out of accumulated other comprehensive income (loss) related to pension and other postretirement benefits is included in the computation of net periodic pension costs. See Note 4 for additional details.
7. DERIVATIVES
Tredegar uses derivative financial instruments for the purpose of hedging margin exposure from fixed-price forward sales contracts in Aluminum Extrusions and exposure from currency volatility that exists as part of ongoing business operations in Flexible Packaging Films. These derivative financial instruments are designated as and qualify as cash flow hedges and are recognized in the condensed consolidated balance sheet at fair value. If individual derivative instruments with the same counterparty can be settled on a net basis, the Company records the corresponding derivative fair values as a net asset or net liability.
In the normal course of business, Aluminum Extrusions enters into fixed-price forward sales contracts with a small subset of its customers for the future sale of fixed quantities of aluminum extrusions at scheduled intervals. In order to hedge margin exposure created from the fixing of future sales prices relative to volatile raw material (aluminum) costs, Aluminum Extrusions enters into a combination of forward purchase commitments and futures contracts to acquire or hedge aluminum, based on the scheduled purchases for the firm sales commitments. The fixed-price firm sales commitments and related hedging instruments have durations generally no longer than 12 months. The notional amount of aluminum futures contracts that hedged future purchases of aluminum to meet fixed-price forward sales contract obligations was $6.0 million (4.3 million pounds of aluminum) at September 30, 2024 and $7.7 million (5.6 million pounds of aluminum) at December 31, 2023.
The table below summarizes the location and gross amounts of aluminum futures contract fair values (Level 2) in the condensed consolidated balance sheets as of September 30, 2024 and December 31, 2023: | | | | | | | | | | | | | | | | | | | | | | | |
| | September 30, 2024 | | December 31, 2023 |
| (In thousands) | Balance Sheet
Account | | Fair
Value | | Balance Sheet
Account | | Fair
Value |
| Derivatives Designated as Hedging Instruments | | | | | | | |
Asset derivatives: Aluminum futures contracts | Prepaid expenses and other | | $ | 354 | | | Prepaid expenses and other | | $ | — | |
| | | | | | | |
Liability derivatives: Aluminum futures contracts | Accrued expenses | | (128) | | | Accrued expenses | | (483) | |
| Aluminum futures contracts | Other non-current liabilities | | — | | | Other non-current liabilities | | (9) | |
| Net asset (liability) | | | $ | 226 | | | | | $ | (492) | |
In the event that a counterparty to an aluminum fixed-price forward sales contract chooses not to take delivery of its aluminum extrusions, the customer is contractually obligated to compensate Aluminum Extrusions for any losses on the related aluminum futures and/or forward contracts through the date of cancellation.
The Company's earnings are exposed to foreign currency exchange risk primarily through the translation of the financial statements of subsidiaries that have a functional currency other than the U.S. Dollar. The Company estimates that the net mismatch translation exposure for the Flexible Packaging Film's business unit in Brazil (“Terphane Ltda.”) of its sales and raw materials quoted or priced in U.S. Dollars and its variable conversion, fixed conversion and sales, general and administrative costs (before depreciation and amortization) quoted or priced in Brazilian Real ("R$") will result in an annual net cost of R$139 million for the full year of 2024.
Terphane Ltda. had the following outstanding foreign exchange average forward rate contracts to purchase Brazilian Real and sell U.S. Dollars as of September 30, 2024: | | | | | | | | | | | | | | |
| USD Notional Amount (000s) | Average Forward Rate Contracted on USD/BRL | R$ Equivalent Amount (000s) | Applicable Month | Estimated % of Terphane Ltda. R$ Operating Cost Exposure Hedged |
| | | | |
| | | | |
| | | | |
| | | | |
| | | | |
| | | | |
| | | | |
| | | | |
| | | | |
| | | | |
| | | | |
| | | | |
| | | | |
| | | | |
| | | | |
| | | | |
| | | | |
| | | | |
| $1,851 | 5.4225 | R$10,037 | Oct-24 | 87% |
| $1,837 | 5.4403 | R$9,994 | Nov-24 | 86% |
| $1,801 | 5.4580 | R$9,830 | Dec-24 | 85% |
| $5,489 | 5.4402 | R$29,861 | | 85% |
These foreign currency exchange contracts have been designated and qualify as cash flow hedges of Terphane Ltda.’s forecasted sales to customers quoted or priced in U.S. Dollars over that period. By changing the currency risk associated with these U.S. Dollar sales, the derivatives have the effect of offsetting operating costs quoted or priced in Brazilian Real and decreasing the net exposure to Brazilian Real in the condensed consolidated statements of income.
The table below summarizes the location and gross amounts of foreign currency forward contract fair values (Level 2) in the condensed consolidated balance sheets as of September 30, 2024 and December 31, 2023: | | | | | | | | | | | | | | | | | | | | | | | | |
| | September 30, 2024 | | December 31, 2023 |
| (In thousands) | Balance Sheet
Account | | Fair
Value | | Balance Sheet
Account | | | Fair
Value |
| Derivatives Designated as Hedging Instruments | | | | | | | | |
Asset derivatives: Foreign currency forward contracts | Prepaid expenses and other | | $ | 219 | | | Prepaid expenses and other | | | $ | 2,050 | |
| Foreign currency forward contracts | Other assets | | — | | | Other assets | | | 146 | |
Liability derivatives: Foreign currency forward contracts | Accrued expenses | | (299) | | | Other non-current liabilities | | | — | |
| | | | | | | | |
| Net asset (liability) | | | $ | (80) | | | | | | $ | 2,196 | |
These derivative contracts involve elements of market risk that are not reflected on the condensed consolidated balance sheet, including the risk of dealing with counterparties and their ability to meet the terms of the contracts. The counterparties to any forward purchase commitments are major aluminum brokers and suppliers, and the counterparties to any aluminum futures contracts are major financial institutions. Fixed-price forward sales contracts are only made available to the most credit-worthy customers. The counterparties to the Company’s foreign currency cash flow hedge contracts are major financial institutions.
The pre-tax effect on net income (loss) and other comprehensive income (loss) of derivative instruments classified as cash flow hedges and described in the previous paragraphs for the three and nine month periods ended September 30, 2024 and 2023 is summarized in the table below: | | | | | | | | | | | | | | | | | | | | | | | | | | | | | | | | |
| Cash Flow Derivative Hedges |
| | Three Months Ended September 30, |
| | Aluminum Futures Contracts | | Foreign Currency Forwards |
| (In thousands) | 2024 | | 2023 | | 2024 | | 2023 |
| Amount of pre-tax gain (loss) recognized in other comprehensive income (loss) | $ | 10 | | | $ | 2,908 | | | $ | — | | $ | 252 | | | $ | — | | | $ | (621) | |
| Location of gain (loss) reclassified from accumulated other comprehensive income (loss) into net income (effective portion) | Cost of goods sold | | Cost of goods sold | | Cost of goods sold | Selling, general & admin | | Cost of goods sold | | Selling, general & admin |
| Amount of pre-tax gain (loss) reclassified from accumulated other comprehensive income (loss) to net income (effective portion) | $ | (153) | | | $ | 1,716 | | | $ | 16 | | $ | (144) | | | $ | 16 | | | $ | 1,024 | |
| | Nine Months Ended September 30, |
| | Aluminum Futures Contracts | | Foreign Currency Forwards |
| | 2024 | | 2023 | | 2024 | | 2023 |
| Amount of pre-tax gain (loss) recognized in other comprehensive income (loss) | $ | 56 | | | $ | 4,867 | | | $ | — | | $ | (1,491) | | | $ | — | | | $ | 2,985 | |
| Location of gain (loss) reclassified from accumulated other comprehensive income (loss) into net income (effective portion) | Cost of goods sold | | Cost of goods sold | | Cost of goods sold | Selling, general & admin | | Cost of goods sold | | Selling, general & admin |
| Amount of pre-tax gain (loss) reclassified from accumulated other comprehensive income (loss) to net income (effective portion) | $ | (662) | | | $ | 3,273 | | | $ | 46 | | $ | 396 | | | $ | 46 | | | $ | 2,031 | |
As of September 30, 2024, the Company expects $0.1 million of unrealized after-tax gains on aluminum and foreign currency derivative instruments reported in accumulated other comprehensive income (loss) to be reclassified to earnings within the next 12 months. For the three and nine month periods ended September 30, 2024 and 2023, net gains or losses realized, from previously unrealized net gains or losses on hedges that had been discontinued, were not material.
8. INCOME TAXES
Tredegar recorded tax expense (benefit) of $3.6 million on pre-tax income (loss) of $11.7 million in the first nine months of 2024. The effective tax rate in the first nine months of 2024 was 30.5% and 18.8% in the first nine months of 2023. The change in effective tax rate was primarily due to pre-tax income in the first nine months of 2024 versus a pre-tax loss in the first nine months of 2023. During the first nine months of 2024, Tredegar increased the valuation allowance on existing deferred tax assets as a result of the sale of Terphane by $1.0 million.
The effective tax rate for the first nine months of 2024 varies from the 21% statutory rate primarily due to foreign rate differences and non-deductible expenses offset by Brazilian tax incentives and federal tax credits.
The Brazilian federal statutory income tax rate is a composite of 34.0% (25.0% of income tax and 9.0% of social contribution on income). Terphane Ltda.’s manufacturing facility in Brazil is the beneficiary of certain income tax incentives that allow for a reduction in the statutory Brazilian federal income tax rate to 15.25% levied on the operating profit on certain of its products. The incentives have been granted for a 10-year period, from the commencement date of January 1, 2015 and were to expire at the end of 2024. Terphane Ltda. has been granted an additional three years of tax incentives through the end of 2027.
9. BUSINESS SEGMENTS
The Company’s business segments are Aluminum Extrusions, PE Films, and Flexible Packaging Films. Information by business segment is reported below. There are no accounting transactions between segments and no allocations to segments.
The Company’s reportable segments are based on its method of internal reporting, which is generally segregated by differences in products. Accounting standards for presentation of segments require an approach based on the way the Company organizes the segments for making operating decisions and how the CODM assesses performance. Earnings before interest, taxes, depreciation and amortization ("EBITDA") from ongoing operations is the key profitability measure used by the CODM (Tredegar’s President and Chief Executive Officer) for purposes of assessing financial performance. The Company uses sales less freight (“net sales”) as its measure of revenues from external customers at the segment level. This measure is separately included in the financial information regularly provided to the CODM.
The following table presents net sales and EBITDA from ongoing operations by segment for the three and nine months ended September 30, 2024 and 2023:
| | | | | | | | | | | | | | | | | | | | | | | |
| Three Months Ended September 30, | | Nine Months Ended September 30, |
| (In thousands) | 2024 | | 2023 | | 2024 | | 2023 |
| Net Sales | | | | | | | |
| Aluminum Extrusions | $ | 115,717 | | | $ | 109,410 | | | $ | 349,353 | | | $ | 364,607 | |
| PE Films | 24,879 | | | 19,938 | | | 78,811 | | | 56,036 | |
| Flexible Packaging Films | 34,370 | | | 30,111 | | | 99,025 | | | 94,861 | |
| Total net sales | 174,966 | | | 159,459 | | | 527,189 | | | 515,504 | |
| Add back freight | 7,085 | | | 6,733 | | | 20,833 | | | 19,977 | |
| Sales as shown in the condensed consolidated statements of income (loss) | $ | 182,051 | | | $ | 166,192 | | | $ | 548,022 | | | $ | 535,481 | |
| EBITDA from Ongoing Operations | | | | | | | |
| Aluminum Extrusions: | | | | | | | |
| Ongoing operations: | | | | | | | |
| EBITDA | $ | 6,177 | | | $ | 5,113 | | | $ | 31,624 | | | $ | 29,968 | |
| Depreciation & amortization | (4,404) | | | (4,683) | | | (13,392) | | | (13,252) | |
| EBIT | 1,773 | | | 430 | | | 18,232 | | | 16,716 | |
| Plant shutdowns, asset impairments, restructurings and other | (2,170) | | | (1,483) | | | (4,986) | | | (1,821) | |
| PE Films: | | | | | | | |
| Ongoing operations: | | | | | | | |
| EBITDA | 5,876 | | | 4,037 | | | 22,913 | | | 6,700 | |
| Depreciation & amortization | (1,299) | | | (2,111) | | | (3,944) | | | (5,305) | |
| EBIT | 4,577 | | | 1,926 | | | 18,969 | | | 1,395 | |
| Plant shutdowns, asset impairments, restructurings and other | — | | | (4,566) | | | (584) | | | (4,565) | |
| Goodwill impairment | — | | | (19,478) | | | — | | | (34,891) | |
| Flexible Packaging Films: | | | | | | | |
| Ongoing operations: | | | | | | | |
| EBITDA | 3,749 | | | 477 | | | 8,915 | | | 2,076 | |
| Depreciation & amortization | (708) | | | (704) | | | (2,191) | | | (2,115) | |
| EBIT | 3,041 | | | (227) | | | 6,724 | | | (39) | |
| Plant shutdowns, asset impairments, restructurings and other | (103) | | | — | | | (103) | | | (79) | |
| Total | 7,118 | | | (23,398) | | | 38,252 | | | (23,284) | |
| Interest income | 8 | | | 62 | | | 36 | | | 135 | |
| Interest expense | 3,480 | | | 3,106 | | | 10,314 | | | 7,791 | |
| Gain on investment in kaleo, Inc. | — | | | — | | | 144 | | | 262 | |
| Stock option-based compensation costs | — | | | — | | | — | | | 231 | |
| Pension settlement loss | — | | | 25,612 | | | — | | | 25,612 | |
| Corporate expenses, net | 6,644 | | | 11,633 | | | 16,411 | | | 30,100 | |
| Income (loss) before income taxes | (2,998) | | | (63,687) | | | 11,707 | | | (86,621) | |
| Income tax expense (benefit) | 948 | | | (13,307) | | | 3,573 | | | (16,307) | |
| Net income (loss) | $ | (3,946) | | | $ | (50,380) | | | $ | 8,134 | | | $ | (70,314) | |
The following table presents identifiable assets by segment at September 30, 2024 and December 31, 2023: | | | | | | | | | | | |
| (In thousands) | September 30, 2024 | | December 31, 2023 |
| Aluminum Extrusions | $ | 258,410 | | | $ | 255,756 | |
| PE Films | 57,989 | | | 56,536 | |
| Flexible Packaging Films | 85,297 | | | 84,062 | |
| Subtotal | 401,696 | | | 396,354 | |
| General corporate | 34,256 | | | 36,652 | |
| Cash, cash equivalents and restricted cash | 6,588 | | | 13,455 | |
| Total | $ | 442,540 | | | $ | 446,461 | |
The following tables disaggregate the Company’s revenue by geographic area and product group for the three and nine months ended September 30, 2024 and 2023: | | | | | | | | | | | | | | | | | | | | | | | |
| Net Sales by Geographic Area (a) |
| Three Months Ended September 30, | | Nine Months Ended September 30, |
| (In thousands) | 2024 | | 2023 | | 2024 | | 2023 |
| United States | $ | 133,157 | | | $ | 125,407 | | | $ | 407,465 | | | $ | 409,433 | |
| Exports from the United States to: | | | | | | | |
| Asia | 11,875 | | | 7,873 | | | 34,534 | | | 19,082 | |
| Latin America | 1,395 | | | 1,764 | | | 4,121 | | | 5,440 | |
| Canada | 3,437 | | | 3,640 | | | 10,459 | | | 12,879 | |
| Europe | 405 | | | 282 | | | 1,053 | | | 1,414 | |
| Operations outside the United States: | | | | | | | |
| Brazil | 24,408 | | | 20,351 | | | 69,002 | | | 66,954 | |
| Asia | 289 | | | 142 | | | 555 | | | 302 | |
| Total | $ | 174,966 | | | $ | 159,459 | | | $ | 527,189 | | | $ | 515,504 | |
(a) Export sales relate mostly to PE Films. Operations in Brazil relate to Flexible Packaging Films. |
The Company’s facilities in Pottsville, PA (“PV”) and Guangzhou, China (“GZ”) have a tolling arrangement whereby certain surface protection films are manufactured in GZ for a fee with raw materials supplied from PV that are then shipped by GZ directly to customers principally in the Asian market, but paid by customers directly to PV. Amounts associated with this intercompany tolling arrangement are reported in the table above as export sales from the U.S. to Asia, and include net sales of $6.5 million and $4.8 million in the third quarter of 2024 and 2023, respectively, and $19.1 million and $11.7 million in the first nine months of 2024 and 2023, respectively.
| | | | | | | | | | | | | | | | | | | | | | | |
| Net Sales by Product Group |
| Three Months Ended September 30, | | Nine Months Ended September 30, |
| (In thousands) | 2024 | | 2023 | | 2024 | | 2023 |
| Aluminum Extrusions: | | | | | | | |
| Nonresidential building & construction | $ | 61,988 | | | $ | 59,476 | | | $ | 195,603 | | | $ | 203,889 | |
| Consumer durables | 8,581 | | | 8,662 | | | 25,487 | | | 30,723 | |
| Automotive | 11,060 | | | 13,025 | | | 31,793 | | | 36,916 | |
| Residential building & construction | 9,790 | | | 7,999 | | | 27,575 | | | 29,658 | |
| Electrical | 8,926 | | | 2,016 | | | 21,983 | | | 16,223 | |
| Machinery & equipment | 13,131 | | | 14,202 | | | 37,995 | | | 36,008 | |
| Distribution | 2,241 | | | 4,030 | | | 8,917 | | | 11,190 | |
| Subtotal | 115,717 | | | 109,410 | | | 349,353 | | | 364,607 | |
| PE Films: | | | | | | | |
| Surface protection films | 17,516 | | | 12,755 | | | 56,241 | | | 34,251 | |
| Overwrap packaging | 7,363 | | | 7,183 | | | 22,570 | | | 21,785 | |
| Subtotal | 24,879 | | | 19,938 | | | 78,811 | | | 56,036 | |
| Flexible Packaging Films | 34,370 | | | 30,111 | | | 99,025 | | | 94,861 | |
| Total | $ | 174,966 | | | $ | 159,459 | | | $ | 527,189 | | | $ | 515,504 | |
10. DEBT
ABL Facility
On December 27, 2023, the Company entered into Amendment No. 3 to the Second Amended and Restated Credit Agreement (the "Credit Agreement"), which provides the Company with a $180 million senior secured asset-based revolving credit facility that will mature on June 30, 2026. On April 16, 2024, the Company entered into Amendment No. 4 to the Credit Agreement (as amended by Amendment No. 3 and Amendment No. 4, the “ABL Facility”) that, among other items: (i) moves the ABL Adjustment Date (defined below) from March 31, 2025 to September 30, 2025 and (ii) requires weekly reporting of the borrowing base financial covenant until the ABL Adjustment Date. The ABL Facility is secured by substantially all assets of the Company and its domestic subsidiaries, including equity in certain material first-tier foreign subsidiaries. Availability for borrowings under the ABL Facility is governed by a borrowing base, determined by the application of specified advance rates against eligible assets, including a portion of trade accounts receivable, inventory, cash and cash equivalents, owned real properties, and owned machinery and equipment. Upon the earlier of September 30, 2025 or the date the Company receives the proceeds from the sale of Terphane (the “ABL Adjustment Date”), the $180 million ABL Facility will be reduced to $125 million. As of September 30, 2024, Minimum Liquidity (as defined in the ABL Facility) of $45.1 million, after reducing the borrowing base by the aggregate outstanding borrowings of $122.0 million and standby letters of credit of $12.9 million, was in excess of the $10 million Minimum Liquidity financial covenant.
Outstanding borrowings accrue interest at the rates elected by the Company depending on the type of loan and denomination of such borrowing. With respect to revolving loans denominated in U.S. Dollars, the Company may elect interest rates at:
•Alternate Base Rate (“ABR”) plus 2.50% before the ABL Adjustment Date and the applicable ABR Spread (as defined in the ABL Facility) after the ABL Adjustment Date are determined in accordance with an excess availability-based pricing grid. ABR is defined, in part, as the greater of (a) the Prime Rate in effect on such day, (b) the Federal Reserve Bank of New York Rate in effect on such day plus ½ of 1% and (c) the Adjusted Term SOFR Rate (defined below) for a one-month period plus 1%; or
•The Adjusted Term Secured Overnight Financing Rate ("SOFR") Rate plus 3.50% before the ABL Adjustment Date and the applicable Term Benchmark Spread (as defined in the ABL Facility) are determined in accordance with an excess availability-based pricing grid after the ABL Adjustment Date. Adjusted Term SOFR Rate is defined as the Term SOFR Rate plus 0.10%, subject to an initial Floor (as defined in the ABL Facility) of 0%.
Interest rate indices for select non-U.S. dollar borrowings, including borrowings denominated in Euro, Pounds Sterling, Swiss Francs and Japanese Yen, remain consistent with the Second Amended and Restated Credit Agreement.
Based upon the quarterly average of daily availability under the ABL Facility, the interest rate pricing grid applicable after the ABL Adjustment Date will be as follows: | | | | | | | | | | | |
| Pricing under the ABL Facility (Basis Points) |
| Quarter Average of Daily Availability | Term Benchmark
Spread | ABR
Spread | Commitment
Fee* |
| > 66% of $125 million aggregate commitment | 225.0 | 125.0 | 40.0 |
| ≤ 66% but > 33% of $125 million aggregate commitment | 250.0 | 150.0 | 40.0 |
| ≤ 33% of $125 million aggregate commitment | 275.0 | 175.0 | 40.0 |
*The Commitment Fee before the ABL Adjustment Date and after the ABL Adjustment Date remain the same as reflected in this table. |
Under the terms of the ABL Facility, certain domestic bank accounts are subject to blocked account agreements, each of which contains a springing feature whereby the lenders may exercise control over those accounts during a cash dominion period (any such period, a “Cash Dominion Period”). A Cash Dominion Period was implemented on the date of the closing of the ABL Facility and will remain in effect at all times prior to the ABL Adjustment Date. After the ABL Adjustment Date, a Cash Dominion Period goes into effect if availability under the ABL Facility falls below 12.5% or an Event of Default (as defined in the ABL Facility) occurs. The Company would then be subject to the Cash Dominion Period until the Event of Default is waived or ABL Facility availability is above 12.5% of the $125 million aggregate commitment for 30 consecutive days. Receipts that have not yet been applied to the ABL Facility are classified as restricted cash in the Company’s consolidated balance sheets.
The financial covenants in the ABL Facility are as follows:
•Until the ABL Adjustment Date, the Company is required to maintain (i) a minimum Credit EBITDA (as defined in the ABL Facility), as of the end of each fiscal month for the 12-month period then ended (presented below) and (ii) a Minimum Liquidity of $10.0 million.
| | | | | |
| Minimum Credit EBITDA (In thousands) |
| September 2024 | $ | 25,370 | |
| October 2024 | 26,070 | |
| November 2024 | 27,640 | |
| December 2024 | 29,640 | |
| January 2025 | 29,740 | |
| February 2025 | 29,850 | |
| March 2025 | 29,980 | |
| April 2025 | 30,340 | |
| May 2025 | 30,700 | |
| June 2025 | 31,030 | |
| July 2025 | 31,370 | |
| August 2025 | 31,710 | |
| September 2025 | $ | 32,080 | |
•Following the ABL Adjustment Date, the foregoing financial covenants will cease to exist and will be replaced with a minimum fixed charge coverage ratio of 1.00:1.00 that will be triggered in the event that availability is less than 10% of $125 million commitment amount and continuing thereafter until availability is greater than 10% of the $125 million commitment amount for 30 consecutive days.
In addition to the financial covenants, the ABL Facility contains restrictive covenants, including covenants that restrict the Company’s ability to pay dividends and repurchase shares of its common stock. After the ABL Adjustment Date, the Company is no longer prohibited from making dividend payments and share repurchases. All decisions with respect to the declaration and payment of future dividends and share repurchases will be made by the Board in its sole discretion based upon earnings, financial condition, anticipated cash needs and other such considerations as the Board deems relevant.
If at any time the availability under the ABL facility after the ABL Adjustment Date is less than 20% of the maximum aggregate principal amount in effect at such time or an Event of Default occurs, the Company’s current weekly reporting requirements to lenders will continue until the Event of Default is waived, cured or the availability under the ABL facility is above 20% of the maximum aggregate principal amount for 30 consecutive days.
The ABL Facility has customary representations and warranties including, as a condition to each borrowing, that all such representations and warranties are true and correct in all material respects (including a representation that no Material Adverse Effect (as defined in the ABL Facility) has occurred since December 31, 2022). In the event that the Company cannot certify that all conditions to the borrowing have been met, the lenders can restrict the Company’s future borrowings under the ABL Facility. Because a Cash Dominion Period was in effect as of September 30, 2024 and December 31, 2023 and the Company was required to represent that no Material Adverse Effect has occurred as a condition to borrowing, the outstanding debt under the ABL Facility (all contractual payments due on June 30, 2026) was classified as a current liability in the condensed consolidated balance sheets as of the dates presented.
In accordance with the ABL Facility, the lenders have been provided with the Company’s financial statements, covenant compliance certificates and projections to facilitate their ongoing assessment of the Company. Accordingly, the Company believes the likelihood that lenders would exercise the subjective acceleration clause whereby prohibiting future borrowings is remote. As of September 30, 2024, the Company was in compliance with all debt covenants.
On November 1, 2024, with the closing of the Terphane Sale, the ABL Adjustment Date has occurred.
Terphane Brazil Loan
On October 26, 2023, Flexible Packaging Film's business unit (“Terphane Ltda.”), the Company’s wholly owned subsidiary in Brazil, borrowed $20 million secured by certain of its assets (“Terphane Brazil Loan”). This U.S. Dollar borrowing matures on October 30, 2028, with interest payable quarterly at an annual floating interest rate of the SOFR plus 5.99%. The SOFR rate was 5.35% as of September 30, 2024. Quarterly principal payments of $1.7 million begin starting in year 3 of the loan. There are no prepayment penalties. On October 26, 2023, the Company borrowed $20 million from Terphane Ltda. (the “Intercompany Loan”) at the same interest rate as the Terphane Brazil Loan, thereby transferring the funds to the U.S. In connection with the closing of the Terphane Sale, both the Terphane Brazil Loan and the Intercompany Loan were assumed by Oben.
PE Films Guangzhou Loan
On June 25, 2024, PE Films' business location in Guangzhou, China, Guangzhou Tredegar Film Products Co., Ltd. (“Guangzhou Tredegar”), entered into a 9.5 million Chinese Yuan, which is equivalent to $1.4 million as of September 30, 2024, revolving loan with the Industrial and Commercial Bank of China. The loan matures on July 3, 2025. The interest rate is the one year loan prime rate published by the National Interbank Funding Center for the working day immediately preceding the drawdown date, minus 0.45%. As of September 30, 2024, the National Interbank Funding Center rate was 3.35%. The revolving loan is secured by a mortgage contract listing the Guangzhou Tredegar factory building as collateral. The mortgage contract has a maximum value of 30 million Chinese Yuan and is effective from June 25, 2024 through May 31, 2027.
11. SUBSEQUENT EVENTS
On September 1, 2023, the Company entered into an agreement to sell Terphane, headquartered in Brazil, to Oben for net cash-free and debt-free base consideration of $116 million.
On November 1, 2024, Tredegar completed the sale of Terphane to Oben. At closing, Tredegar received $60 million in cash, which is net of Terphane debt assumed by Oben of $20 million and Terphane cash retained by Oben of $2 million. Accordingly, on a cash-free and debt-free basis, the enterprise value of the Terphane transaction at closing for Tredegar was $78 million. Tredegar anticipates receiving an additional $7 million in cash following the release of certain escrow funds within 120 days of closing. The cash proceeds received by Tredegar at closing are after deducting projected Brazil withholding taxes, net working capital adjustments, escrow funds, U.S. capital gains taxes and transaction expenses. The total estimated proceeds from the sale of Terphane are required to be used to pay down the outstanding ABL Facility debt.
An estimated pre-tax loss on the sale of $72.5 million ($65.5 million after-tax) is expected to be recognized in the fourth quarter of 2024. The estimated net loss on sale includes $100 million of estimated cumulative translation adjustment losses and gains on derivative financial instruments reclassified from other comprehensive income (loss). Expected amounts are based on Terphane’s estimated closing balance sheet, which are subject to change.
As of and for the nine months ended September 30, 2024, the Flexible Packaging Films business had net assets of approximately $36 million and EBITDA from ongoing operations of $8.9 million. See Note 9 where Flexible Packing Films is presented as a reportable segment. As a result of the completion of the sale, the Company will classify and report Terphane as discontinued operations in the fourth quarter of 2024.
Item 2. Management’s Discussion and Analysis of Financial Condition and Results of Operations.
Forward-looking and Cautionary Statements
Some of the information contained in this Quarterly Report on Form 10-Q ("Form 10-Q") may constitute “forward-looking statements” within the meaning of the “safe harbor” provisions of the Private Securities Litigation Reform Act of 1995. When the Company uses the words “believe,” “estimate,” “anticipate,” “appear to,” “expect,” “project,” “plan,” “likely,” “may” and similar expressions, it does so to identify forward-looking statements. Such statements are based on the Company's then current expectations and are subject to a number of risks and uncertainties that could cause actual results to differ materially from those addressed in the forward-looking statements. It is possible that the Company's actual results and financial condition may differ, possibly materially, from the anticipated results and financial condition indicated in or implied by these forward-looking statements. Accordingly, you should not place undue reliance on these forward-looking statements. Factors that could cause actual results to differ materially from expectations include, without limitation, the following:
•inability to successfully complete strategic dispositions, failure to realize the expected benefits of such dispositions and assumption of unanticipated risks in such dispositions;
•failure by governmental entities to prevent foreign companies from evading anti-dumping and countervailing duties;
•noncompliance with any of the financial and other restrictive covenants in the Company's asset-based credit facility;
•the impact of macroeconomic factors, such as inflation, interest rates, recession risks and other lagging effects of the COVID-19 pandemic;
•an increase in the operating costs incurred by the Company’s business units, including, for example, the cost of raw materials and energy;
•failure to continue to attract, develop and retain certain key officers or employees;
•disruptions to the Company’s manufacturing facilities, including those resulting from labor shortages;
•inability to develop, efficiently manufacture and deliver new products at competitive prices;
•the impact of the imposition of tariffs and sanctions on imported aluminum ingot used by Bonnell Aluminum;
•unanticipated problems or delays with the implementation of the enterprise resource planning and manufacturing executions systems, or security breaches and other disruptions to the Company's information technology infrastructure;
•loss of sales to significant customers on which the Company’s business is highly dependent;
•inability to achieve sales to new customers to replace lost business;
•failure of the Company’s customers to achieve success or maintain market share;
•failure to protect our intellectual property rights;
•risks of doing business in countries outside the U.S. that affect our international operations;
•political, economic and regulatory factors concerning the Company’s products;
•competition from other manufacturers, including manufacturers in lower-cost countries and manufacturers benefiting from government subsidies;
•impact of fluctuations in foreign exchange rates;
•an information technology system failure or breach;
•the impact of public health epidemics on employees, production and the global economy, such as the COVID-19 pandemic;
•inability to successfully identify, complete or integrate strategic acquisitions; failure to realize the expected benefits of such acquisitions and assumption of unanticipated risks in such acquisitions;
•impairment of the Surface Protection reporting unit's goodwill;
and the other factors discussed in the reports Tredegar files with or furnishes to the Securities and Exchange Commission (the “SEC”) from time to time, including the risks and important factors set forth in additional detail in Part I, Item 1A of Tredegar’s Annual Report on Form 10-K for the year ended December 31, 2023 (the “2023 Form 10-K”). Readers are urged to review and consider carefully the disclosures Tredegar makes in its filings with the SEC.
Tredegar does not undertake, and expressly disclaims any duty, to update any forward-looking statement to reflect any change in management’s expectations or any change in conditions, assumptions or circumstances on which such statements are based, except as required by applicable law.
References herein to “Tredegar,” “the Company,” “we,” “us” and “our” are to Tredegar Corporation and its subsidiaries, collectively, unless the context otherwise indicates or requires.
Unless otherwise stated or indicated, all comparisons are to the prior year period. References to "Notes" are to notes to our condensed consolidated financial statements found in Part I, Item 1 of this Form 10-Q.
Critical Accounting Policies and Estimates
In the ordinary course of business, the Company makes a number of estimates and assumptions relating to the reporting of results of operations and financial position in the preparation of financial statements in conformity with generally accepted accounting standards in the United States ("GAAP"). The Company believes the estimates, assumptions and judgments described in the section “Management’s Discussion and Analysis of Financial Condition and Results of Operations – Critical Accounting Policies and Estimates” in the 2023 Form 10-K have the greatest potential impact on our financial statements, so Tredegar considers these to be its critical accounting policies. Since December 31, 2023, there have been no changes in these policies or estimates that have had a material impact on our results of operations or financial position.
Business Overview
Tredegar Corporation is an industrial manufacturer. As of September 30, 2024, we had three primary businesses: custom aluminum extrusions for the North American building and construction ("B&C"), automotive and specialty end-use markets through its Aluminum Extrusions segment; surface protection films for high-technology applications in the global electronics industry through its PE Films segment; and specialized polyester films primarily for the Latin American flexible packaging market through its Flexible Packaging Films segment. On November 1, 2024, we completed the sale of our Flexible Packaging Film business ("Terphane") to Oben Group ("Oben"). For more information, see Note 11. Since the sale was completed after September 30, 2024, the historical financial results of Terphane are reported as continuing operations in this Form 10-Q. In all future public filings, the historical financial results of Terphane will be reflected as discontinued operations under GAAP for all periods.
Earnings before interest, taxes, depreciation and amortization ("EBITDA") from ongoing operations is the measure of segment profit and loss used by Tredegar’s chief operating decision maker ("CODM") for purposes of assessing financial performance. The Company uses sales less freight (“net sales”) as its measure of revenues from external customers at the segment level. This measure is separately included in the financial information regularly provided to the CODM.
Earnings before interest and taxes ("EBIT") from ongoing operations is a non-GAAP financial measure included in the reconciliation of segment financial information to consolidated results for the Company in Note 9. It is not intended to represent the stand-alone results for Tredegar's ongoing operations under GAAP and should not be considered as an alternative to net income as defined by GAAP. We believe that EBIT is a widely understood and utilized metric that is meaningful to certain investors and that including this financial metric in the reconciliation of management’s performance metric, EBITDA from ongoing operations, provides useful information to those investors that primarily utilize EBIT to analyze the Company’s core operations.
Third quarter 2024 net income (loss) was $(3.9) million ($(0.11) per diluted share) compared to $(50.4) million ($(1.47) per diluted share) in the third quarter of 2023.
Third Quarter Financial Results Highlights
•EBITDA from ongoing operations for Aluminum Extrusions (also referred to as "Bonnell Aluminum") was $6.2 million in the third quarter of 2024 versus $5.1 million in the third quarter of last year and $12.9 million in the second quarter of 2024.
◦Sales volume was 34.6 million pounds in the third quarter of 2024 versus 32.5 million pounds in the third quarter of last year and 34.9 million pounds in the second quarter of 2024.
◦Open orders at the end of the third quarter of 2024 were approximately 15.5 million pounds (versus 17 million pounds in the third quarter of 2023 and 14 million pounds at the end of the second quarter of 2024). Net new orders increased 27% in the third quarter of 2024 versus the third quarter of 2023 and increased 7% versus the second quarter of 2024.
•EBITDA from ongoing operations for PE Films was $5.9 million in the third quarter of 2024 versus $4.0 million in the third quarter of 2023 and $10.1 million in the second quarter of 2024. Sales volume was 9.6 million pounds in the third quarter of 2024 versus 7.2 million pounds in the third quarter of 2023 and 10.5 million pounds in the second quarter of 2024.
•EBITDA from ongoing operations for Terphane was $3.7 million during the third quarter of 2024 versus $0.5 million in the third quarter of 2023 and $3.2 million during the second quarter of 2024. Sales volume was 25.3 pounds in the third quarter of 2024 versus 22.2 million pounds in the third quarter 2023 and 25.1 million pounds in the second quarter of 2024.
Aluminum Extrusions experienced unfavorable costs, including manufacturing inefficiencies, a shift in mix and margin pressures from imports and excess industry capacity. PE Films EBITDA performance during the third quarter moderated as expected versus the first two quarters of 2024. Tredegar closed on the sale of Terphane on November 1, 2024.
Results of Operations
Third Quarter of 2024 Compared with the Third Quarter of 2023
The following table presents a bridge of consolidated net income (loss) from the third quarter of 2023 to the third quarter of 2024 with management's related discussion and analysis below the table.
| | | | | | | | |
| (In thousands) | | |
Net income (loss) for the three months ended September 30, 2023 | | $ | (50,380) | |
| Income tax expense (benefit) | | (13,307) | |
Income (loss) before income taxes for the three months ended September 30, 2023 | | (63,687) | |
| Change in income (loss) from increases (decreases) in the following items: | | |
| Sales | | 15,859 | |
| Other income (expense), net | | 29 | |
| Total | | 15,888 | |
| Change in income (loss) from (increases) decreases in the following items: | | |
| Cost of goods sold | | (7,137) | |
| Freight | | (352) | |
| Selling, general and administrative | | (445) | |
| Research and development | | 319 | |
| Pension and postretirement benefits | | 3,064 | |
| Asset impairments and costs associated with exit and disposal activities, net of adjustments | | 4,633 | |
| Pension settlement loss | | 25,612 | |
| Goodwill impairment | | 19,478 | |
| Other | | (371) | |
| Total | | 44,801 | |
Income (loss) before income taxes for the three months ended September 30, 2024 | | (2,998) | |
| Income tax expense (benefit) | | 948 | |
Net income (loss) for the three months ended September 30, 2024 | | $ | (3,946) | |
Sales in the third quarter of 2024 increased by $15.9 million compared with the third quarter of 2023. Net sales (sales less freight) in Aluminum Extrusions increased $6.3 million, primarily due to higher sales volume and the pass-through of higher metal costs, partially offset by lower pricing associated with a shift in mix. Net sales in PE Films increased $4.9 million, primarily due to volume increases in both Surface Protection and overwrap films. Net sales in Flexible Packaging Films increased $4.3 million, primarily due to higher sales volume. For more information on net sales and volume, see the Segment Operations Review below.
Consolidated gross profit (sales minus cost of goods sold and freight) as a percentage of sales (gross profit margin) was 12.8% in the third quarter of 2024 compared to 9.0% in the third quarter of 2023. The gross profit margin in Aluminum Extrusions increased compared to the prior year period primarily due to higher volume, favorable variable manufacturing costs, lower labor-related costs, and lower freight rates, partially offset by lower net pricing after the pass-through of metal cost changes associated with a shift in mix and manufacturing inefficiencies. Additionally, the timing of the flow-through under the first-in first-out ("FIFO") method of aluminum raw material costs, which were previously acquired at higher prices in a quickly changing commodity pricing environment and passed through to customers, resulted in a charge of $1.0 million in the third quarter of 2024 versus a charge of $1.2 million in the third quarter of 2023. The gross profit margin in PE Films increased due to a higher Surface Protection contribution margin associated with higher volume and manufacturing costs savings, partially offset by unfavorable pricing. The gross profit margin in Flexible Packaging Films increased primarily due to lower variable costs, lower raw material costs, higher volume, favorable product mix, and lower fixed costs, partially offset by lower selling prices from global excess capacity and margin pressures.
As a percentage of sales, selling, general and administrative (“SG&A”) and research and development ("R&D") expenses of 12.2% in the third quarter of 2024 remained consistent with the third quarter of 2023.
During the third quarter of 2023, the Company remeasured the pension plan, which resulted in a pre-tax pension settlement loss in the condensed consolidated results of operation of $25.6 million. The remeasurement of the pension benefit obligation and plan assets was triggered by $64.5 million of lump sum distributions from the pension plan assets which exceeded the pension plan's service and interest cost. See Note 4 for additional information.
The decrease in asset impairments and costs associated with exit and disposal activities, net of adjustments is primarily related to closure of the PE Films technical center in Richmond, VA. See Note 1 for more information.
In the third quarter of 2023, a non-cash partial goodwill impairment of $19.5 million was recognized. See Note 1 for more information.
The effective tax rate used to compute income taxes was (31.6)% in the third quarter of 2024 compared to 20.9% in the third quarter of 2023.
Pre-tax gains and losses associated with plant shutdowns, asset impairments, restructurings and other items for the third quarters of 2024 and 2023 detailed below are shown in the statements of net sales and EBITDA from ongoing operations by segment in Note 9 and are included in “Asset impairments and costs associated with exit and disposal activities, net of adjustments” in the condensed consolidated statements of income, unless otherwise noted. | | | | | | | | |
| Three Months Ended September 30, |
| (In millions) | 2024 | 2023 |
| Aluminum Extrusions: | | |
| (Gains) losses associated with plant shutdowns, asset impairments and restructurings: | | |
| Other restructuring costs - severance | $ | — | | $ | 0.1 | |
| (Gains) losses from sale of assets, investment writedowns and other items: | | |
Consulting expenses for ERP/MES project1 | 0.7 | | $ | 1.2 | |
Storm damage to the Newnan, Georgia plant1 | — | | 0.1 | |
Legal fees associated with the Aluminum Extruders Trade Case1 | 0.4 | | — | |
Resolution of customer quality complaint2 | 0.8 | | — | |
| Total for Aluminum Extrusions | $ | 1.9 | | $ | 1.4 | |
| PE Films: | | |
| (Gains) losses associated with plant shutdowns, asset impairments and restructurings: | | |
Write-down of Richmond, Virginia Technical Center assets4 | $ | — | | $ | 3.4 | |
Richmond, Virginia Technical Center closure expenses, including severance4 | — | | 1.1 | |
| | |
| | |
| | |
Goodwill impairment4 | — | | 19.5 | |
| Total for PE Films | $ | — | | $ | 24.0 | |
| Flexible Packaging Films: | | |
| (Gains) losses from sale of assets, investment writedowns and other items: | | |
Professional fees associated with business development activities1 | $ | 0.1 | | $ | — | |
| Total for Flexible Packaging Films | $ | 0.1 | | $ | — | |
| Corporate: | | |
| | |
| | |
| (Gains) losses from sale of assets, investment writedowns and other items: | | |
Professional fees associated with business development activities1 | $ | 0.7 | | $ | 2.9 | |
Professional fees associated with remediation activities related to internal control over financial reporting1 | 0.3 | | 0.2 | |
Professional fees associated with the transition to the ABL Facility1 | 0.1 | | — | |
| | |
| | |
| | |
Net periodic benefit cost for the frozen defined benefit pension plan in process of termination3 | — | | 3.1 | |
Pension settlement loss3 | — | | 25.6 | |
| Total for Corporate | $ | 1.1 | | $ | 31.8 | |
1. Included in “Selling, general and administrative expenses” in the condensed consolidated statements of income. 2. Included in “Sales” in the condensed consolidated statements of income. 3. See Note 4 for additional information. 4. See Note 1 for additional information. |
Average total debt outstanding and interest rates were as follows: | | | | | | | | | | | |
| Three Months Ended September 30, |
| (In millions, except percentages) | 2024 | | 2023 |
| Floating-rate debt with interest charged on a rollover basis plus a credit spread: | | | |
| Average total outstanding debt balance | $ | 145.5 | | | $ | 138.2 | |
| Average interest rate | 9.4 | % | | 7.4 | % |
First Nine Months of 2024 Compared with the First Nine Months of 2023
The following table presents a bridge of consolidated net income (loss) from the first nine months of 2023 to the first nine months of 2024 with management's related discussion and analysis below the table.
| | | | | | | | |
| (In thousands) | | |
Net income (loss) for the nine months ended September 30, 2023 | | $ | (70,314) | |
| Income tax expense (benefit) | | (16,307) | |
Income (loss) before income taxes for the nine months ended September 30, 2023 | | (86,621) | |
| Change in income (loss) from increases (decreases) in the following items: | | |
| Sales | | 12,541 | |
| Other income (expense), net | | 100 | |
| Total | | 12,641 | |
| Change in income (loss) from (increases) decreases in the following items: | | |
| Cost of goods sold | | 14,948 | |
| Freight | | (856) | |
| Selling, general and administrative | | (2,696) | |
| Research and development | | 2,381 | |
| Pension and postretirement benefits | | 9,792 | |
| Interest expense | | (2,523) | |
| Asset impairments and costs associated with exit and disposal activities, net of adjustments | | 4,115 | |
| Pension settlement loss | | 25,612 | |
| Goodwill impairment | | 34,891 | |
| Other | | 23 | |
| Total | | 85,687 | |
Income (loss) before income taxes for the nine months ended September 30, 2024 | | 11,707 | |
| Income tax expense (benefit) | | 3,573 | |
Net income (loss) for the nine months ended September 30, 2024 | | $ | 8,134 | |
Sales in the first nine months of 2024 increased by $12.5 million compared with the first nine months of 2023. Net sales in Aluminum Extrusions decreased $15.3 million, primarily due to lower sales volume and the pass-through of lower metal costs. Net sales in PE Films increased $22.8 million, primarily due to an increase in sales volume in Surface Protection. Net sales in Flexible Packaging Films increased $4.2 million primarily due to higher volume, partially offset by lower selling prices that the Company believes are driven by excess global capacity and strong competition in Brazil, Latin America and the U.S and unfavorable product mix. For more information on net sales and volume, see the Segment Operations Review below.
Consolidated gross profit (sales minus cost of goods sold and freight) as a percentage of sales (gross profit margin) was 15.5% in the first nine months of 2024 compared to 10.9% in the first nine months of 2023. The gross profit margin in Aluminum Extrusions increased compared to the prior year period primarily due to higher net pricing after the pass-through of metal cost changes and mix, favorable variable manufacturing costs, lower utilities and lower freight rates, partially offset by lower volume, manufacturing inefficiencies and higher labor and employee-related costs. Additionally, the timing of the flow-through under the FIFO method of aluminum raw material costs, which were previously acquired at higher prices in a quickly changing commodity pricing environment and passed through to customers, resulted in a charge of $1.0 million in the first nine months of 2024 versus a charge of $0.8 million in the first nine months of 2023. The gross profit margin in PE Films increased due to a higher Surface Protection contribution margin associated with substantially higher volume, operating efficiencies and manufacturing costs savings, favorable pricing, and lower fixed costs. The gross profit margin in Flexible Packaging Films increased primarily due to lower raw material costs, lower fixed costs, higher sales volume, and favorable product mix, partially offset by lower selling prices from global excess capacity and margin pressures and higher variable costs.
As a percentage of sales, SG&A and R&D expenses of 11.1% in the first nine months of 2024 remained consistent with the first nine months of 2023.
During the first nine months of 2023, the Company remeasured the pension plan, which resulted in a pre-tax pension settlement loss in the condensed consolidated results of operation of $25.6 million. The remeasurement of the pension benefit obligation and plan assets was triggered by $64.5 million of lump sum distributions from the pension plan assets which exceeded the pension plan's service and interest cost. See Note 4 for additional information.
Interest expense of $10.3 million in the first nine months of 2024 increased $2.5 million compared to the first nine months of 2023 due to higher average debt and higher interest rates. See Note 10 for additional information.
The decrease in asset impairments and costs associated with exit and disposal activities, net of adjustments is primarily related to closure of the PE Films technical center in Richmond, VA. See Note 1 for more information.
In the first nine months of 2023, a non-cash partial goodwill impairment of $34.9 million was recognized. See Note 1 for more information.
The effective tax rate used to compute income taxes was 30.5% in the first nine months of 2024 compared to 18.8% in the first nine months of 2023. See Note 8 for additional information.
Pre-tax gains and losses associated with plant shutdowns, asset impairments, restructurings and other items for the first nine months of 2024 and 2023 detailed below are shown in the statements of net sales and EBITDA from ongoing operations by segment in Note 9 and are included in “Asset impairments and costs associated with exit and disposal activities, net of adjustments” in the condensed consolidated statements of income, unless otherwise noted. | | | | | | | | |
| Nine Months Ended September 30, |
| (In millions) | 2024 | 2023 |
| Aluminum Extrusions: | | |
| (Gains) losses associated with plant shutdowns, asset impairments and restructurings: | | |
| Other restructuring costs - severance | $ | — | | $ | 0.1 | |
| (Gains) losses from sale of assets, investment writedowns and other items: | | |
Consulting expenses for ERP/MES project1 | 2.1 | | 1.2 | |
Storm damage to the Newnan, Georgia plant1 | 0.3 | | 0.5 | |
Legal fees associated with the Aluminum Extruders Trade Case1 | 0.9 | | — | |
Resolution of customer quality complaint5 | 0.8 | | — | |
| Total for Aluminum Extrusions | $ | 4.1 | | $ | 1.8 | |
| PE Films: | | |
| (Gains) losses associated with plant shutdowns, asset impairments and restructurings: | | |
Write-down of Richmond, Virginia Technical Center assets4 | $ | — | | $ | 3.4 | |
Richmond, Virginia Technical Center closure expenses, including severance4 | 0.3 | | 1.1 | |
Richmond, Virginia Technical Center lease abandonment4 | 0.3 | | — | |
| | |
| | |
Goodwill impairment4 | — | | 34.9 | |
| Total for PE Films | $ | 0.6 | | $ | 39.4 | |
| Flexible Packaging Films: | | |
| (Gains) losses associated with plant shutdowns, asset impairments and restructurings: | | |
| Other restructuring costs - severance | $ | — | | $ | 0.1 | |
| (Gains) losses from sale of assets, investment writedowns and other items: | | |
Professional fees associated with business development activities1 | 0.1 | | — | |
| Total for Flexible Packaging Films | $ | 0.1 | | $ | 0.1 | |
| Corporate: | | |
| | |
| | |
| (Gains) losses from sale of assets, investment writedowns and other items: | | |
Professional fees associated with business development activities1 | $ | 1.6 | | $ | 4.8 | |
Professional fees associated with remediation activities related to internal control over financial reporting1 | 1.6 | | 1.2 | |
Professional fees associated with the transition to the ABL Facility1 | 0.3 | | — | |
Group annuity contract premium expense adjustment2 | (0.2) | | — | |
Write-down of investment in Harbinger Capital Partners Special Situations Fund2 | — | | 0.2 | |
Stock-based compensation expense associated with the fair value remeasurement of awards granted at the time of the 2020 special dividend1 | — | | (0.2) | |
Net periodic benefit cost for the frozen defined benefit pension plan in process of termination3 | — | | 9.9 | |
Pension settlement loss3 | — | | 25.6 | |
| Total for Corporate | $ | 3.3 | | $ | 41.5 | |
1. Included in “Selling, general and administrative expenses” in the condensed consolidated statements of income. 2. Included in “Other income (expense), net” in the condensed consolidated statements of income. 3. See Note 4 for additional information. 4. See Note 1 for additional information. 5. Included in “Sales” in the condensed consolidated statements of income. |
Average total debt outstanding and interest rates were as follows: | | | | | | | | | | | |
| Nine Months Ended September 30, |
| (In millions, except percentages) | 2024 | | 2023 |
| Floating-rate debt with interest charged on a rollover basis plus a credit spread: | | | |
| Average total outstanding debt balance | $ | 148.6 | | | $ | 145.1 | |
| Average interest rate | 9.0 | % | | 6.8 | % |
Segment Operations Review
Aluminum Extrusions
A summary of results for Aluminum Extrusions is provided below: | | | | | | | | | | | | | | | | | | | | | | | | | | | | | | | | | | | |
| Three Months Ended | | Favorable/
(Unfavorable)
% Change | | Nine Months Ended | | Favorable/
(Unfavorable)
% Change |
| (In thousands, except percentages) | September 30, | | September 30, | |
| 2024 | | 2023 | | 2024 | | 2023 | |
| Sales volume (lbs) | 34,556 | | | 32,457 | | | 6.5% | | 103,303 | | | 105,511 | | | (2.1)% |
| Net sales | $ | 115,717 | | | $ | 109,410 | | | 5.8% | | $ | 349,353 | | | $ | 364,607 | | | (4.2)% |
| Ongoing operations: | | | | | | | | | | | |
| EBITDA | $ | 6,177 | | | $ | 5,113 | | | 20.8% | | $ | 31,624 | | | $ | 29,968 | | | 5.5% |
| Depreciation & amortization | (4,404) | | | (4,683) | | | 6.0% | | (13,392) | | | (13,252) | | | (1.1)% |
| EBIT* | $ | 1,773 | | | $ | 430 | | | NM** | | $ | 18,232 | | | $ | 16,716 | | | 9.1% |
| Capital expenditures | $ | 1,449 | | | $ | 4,489 | | | | | $ | 4,461 | | | $ | 17,862 | | | |
*See the table in Note 9 for a reconciliation of this non-GAAP measure to the most comparable measure calculated in accordance with GAAP. **Not meaningful ("NM") |
Third Quarter 2024 Results vs. Third Quarter 2023 Results
Net sales (sales less freight) in the third quarter of 2024 increased 5.8% versus the third quarter of 2023 primarily due to higher sales volume and the pass-through of higher metal costs, partially offset by lower pricing associated with a shift in mix. Sales volume in the third quarter of 2024 increased 6.5% versus the third quarter of 2023 but decreased 0.9% versus the second quarter 2024.
Net new orders, which remain low compared to pre-pandemic levels, increased 27.3% in the third quarter of 2024 versus the third quarter of 2023 and increased 7% versus the second quarter of 2024. Since January 2021, net new orders for the Company's aluminum extruded products have generally tracked the ISM® Manufacturing PMI®. In addition, the Architecture Billings Index (ABI), a key leading indicator for non-residential B&C, has demonstrated a decline in billings (i.e., an index below 50) for the last 20 months ended September 2024. The Company believes that net new orders continue to be below pre-pandemic levels due to higher interest rates, tighter lender requirements and the increase in remote working, which particularly impacts the non-residential B&C end-use market. In addition, data indicates that aluminum extrusion imports have increased significantly in recent years, especially during the pandemic, and some of Bonnell Aluminum’s customers have increased their sourcing of aluminum extrusions from producers outside of the U.S.
Open orders at the end of the third quarter of 2024 were 15.5 million pounds (versus 14 million pounds at the end of the second quarter of 2024 and 17 million pounds at the end of the third quarter of 2023). This level is below the quarterly range of 21 to 27 million pounds in 2019 before pandemic-related disruptions (particularly starting in early 2021 with the re-opening of markets following the rollout of vaccines) that resulted in long lead times, driving a peak in open orders of approximately 100 million pounds during the first quarter of 2022.
The Company is part of a coalition of members of the Aluminum Extruders Council that filed a trade case with the U.S. Department of Commerce (“USDOC”) and the U.S. International Trade Commission (“USITC”) against 15 countries in response to alleged large and increasing volumes of unfairly priced imports of aluminum extrusions since 2019. In November 2023, the USITC found that there is a reasonable indication that the American aluminum extrusions industry is materially injured or threatened with injury due to imports from 14 countries, including China. On September 27, 2024, the USDOC announced its final determinations that aluminum extrusion producers and exporters in 14 countries, including China, sold aluminum extrusions at less-than-fair value in the U.S. The final USITC vote on October 30, 2024, indicated that it believes that the industry was not materially injured by reason of the subject imports, despite the USDOC determinations of pricing below fair value and receiving unfair subsidies. The coalition is evaluating next steps for challenging the decision.
EBITDA from ongoing operations in the third quarter of 2024 increased $1.1 million versus the third quarter of 2023 primarily due to:
•Higher volume ($1.8 million), favorable variable manufacturing costs ($1.7 million), lower labor-related costs ($0.1 million) and lower freight rates ($0.2 million), partially offset by unfavorable net pricing after the pass-through of metal cost and changes associated with a shift in mix ($1.1 million), manufacturing inefficiencies ($0.8 million), higher maintenance expense ($0.4 million) and higher SG&A expenses, including other employee-related compensation ($0.8 million); and
•The timing of the flow-through under the FIFO method of aluminum raw material costs, which were previously acquired at higher prices in a quickly changing commodity pricing environment and passed through to customers, resulted in a charge of $1.0 million in the third quarter of 2024 versus a charge of $1.2 million in the third quarter of 2023.
First Nine Months of 2024 Results vs. First Nine Months of 2023 Results
Net sales in the first nine months of 2024 decreased 4.2% versus the first nine months of 2023 primarily due to lower sales volume and the pass-through of lower metal costs. Sales volume in the first nine months of 2024 decreased 2.1% versus the first nine months of 2023.
EBITDA from ongoing operations in the first nine months of 2024 increased $1.7 million in comparison to the first nine months of 2023 primarily due to:
•Higher net pricing after the pass-through of metal cost changes and mix ($2.0 million), favorable variable manufacturing costs ($3.7 million), lower utilities ($0.2 million) and lower freight rates ($0.9 million), partially offset by lower volume ($1.6 million), manufacturing inefficiencies ($0.8 million), higher labor and employee-related costs ($0.1 million), and higher SG&A, including other employee-related compensation ($2.4 million); and
•The timing of the flow-through under the FIFO method of aluminum raw material costs, which were previously acquired at higher prices in a quickly changing commodity pricing environment and passed through to customers, resulted in a charge of $1.0 million in the first nine months of 2024 versus a charge of $0.8 million in the first nine months of 2023.
Refer to Item 3. Quantitative and Qualitative Disclosures About Market Risk in this Form 10-Q for additional information on aluminum prices.
Projected Capital Expenditures and Depreciation & Amortization
Capital expenditures for Bonnell Aluminum are projected to be $8 million in 2024, including $4 million for productivity projects and $4 million for capital expenditures required to support continuity of operations. The projected spending reflects stringent spending measures that the Company has implemented to control its financial leverage (See "Liquidity and Capital Resources" section below for more information). The multi-year implementation of new enterprise resource planning and manufacturing execution systems ("ERP/MES") has been reorganized with the timing for the go-live date being uncertain. The ERP/MES project commenced in 2022, with spending to-date of approximately $21 million. Depreciation expense is projected to be $16 million in 2024. Amortization expense is projected to be $2 million in 2024.
PE Films
A summary of results for PE Films is provided below: | | | | | | | | | | | | | | | | | | | | | | | | | | | | | | | | | | | |
| Three Months Ended | | Favorable/
(Unfavorable)
% Change | | Nine Months Ended | | Favorable/
(Unfavorable)
% Change |
| (In thousands, except percentages) | September 30, | | September 30, | |
| 2024 | | 2023 | | 2024 | | 2023 | |
| Sales volume (lbs) | 9,640 | | | 7,224 | | | 33.4% | | 30,223 | | | 20,837 | | | 45.0% |
| Net sales | $ | 24,879 | | | $ | 19,938 | | | 24.8% | | $ | 78,811 | | | $ | 56,036 | | | 40.6% |
| Ongoing operations: | | | | | | | | | | | |
| EBITDA | $ | 5,876 | | | $ | 4,037 | | | 45.6% | | $ | 22,913 | | | $ | 6,700 | | | NM** |
| Depreciation & amortization | (1,299) | | | (2,111) | | | 38.5% | | (3,944) | | | (5,305) | | | 25.7% |
| EBIT* | $ | 4,577 | | | $ | 1,926 | | | NM** | | $ | 18,969 | | | $ | 1,395 | | | NM** |
| Capital expenditures | $ | 517 | | | $ | 431 | | | | | $ | 1,127 | | | $ | 1,506 | | | |
* See the table in Note 9 for a reconciliation of this non-GAAP measure to the most comparable measure calculated in accordance with GAAP. **Not meaningful ("NM") |
Third Quarter 2024 Results vs. Third Quarter 2023 Results
Net sales in the third quarter of 2024 were 24.8% higher compared to the third quarter of 2023, with volume increases in Surface Protection and overwrap films. Surface Protection sales volume in the third quarter of 2024 increased 37.5% versus the third quarter of 2023 and declined 16.5% versus the second quarter of 2024. Surface Protection sales volume began to moderate during the third quarter of 2024, following extremely high sales volume in the second quarter associated with the restocking of Surface Protection customer inventories.
EBITDA from ongoing operations in the third quarter of 2024 increased $1.8 million versus the third quarter of 2023, primarily due to:
•A $2.4 million increase in Surface Protection primarily due to higher contribution margin associated with higher volume ($2.0 million) and manufacturing costs savings ($1.1 million), partially offset by unfavorable pricing ($0.2 million) and higher SG&A ($0.1 million);
•A foreign currency transaction loss of $0.2 million in the third quarter of 2024 versus no gain or loss in the third quarter of 2023;
•The pass-through lag associated with resin costs (a charge of $0.2 million in the third quarter of 2024 versus a benefit of $0.1 million in the third quarter of 2023); and
•A $0.6 million decrease in overwrap films, primarily due to pricing and mix.
There have been significant cyclical swings in the sales volume and EBITDA from ongoing operations for PE Films in the past 2.5 years, largely due to the unprecedented downturn in the display industry during the second half of 2022 and first half of 2023. EBITDA from ongoing operations for the first half of 2024, the second and first halves of 2023 and the second and first halves of 2022 were $17.0 million, $8.6 million, $2.7 million, $(2.2) million and $14.1 million, respectively, which averages approximately $4 million per quarter.
First Nine Months of 2024 Results vs. First Nine Months of 2023 Results
Net sales in the first nine months of 2024 increased 40.6% compared to the first nine months of 2023 primarily due to an increase in sales volume in Surface Protection, as a result of factors noted above. Sales volume increased 62.3% in Surface Protection in the first nine months of 2024 versus the first nine months of 2023.
EBITDA from ongoing operations in the first nine months of 2024 increased $16.2 million versus the first nine months of 2023, primarily due to:
•A $16.0 million increase in Surface Protection primarily due to higher contribution margin associated with substantially higher volume ($9.4 million), operating efficiencies and manufacturing costs savings ($5.9 million), favorable pricing ($0.3 million), lower fixed costs ($0.2 million) and lower SG&A, including lower costs associated with the closure of the Richmond Technical Center in 2023 ($1.2 million);
•A foreign currency transaction loss of $0.1 million in the first nine months of 2024 versus a gain of $0.3 million in the first nine months of 2023;
•The pass-through lag associated with resin costs (a charge of $0.7 million in the first nine months of 2024 versus a charge of $0.1 million in the first nine months of 2023); and
•A $0.2 million increase from overwrap films, primarily due to cost improvements ($1.0 million), partially offset by a shift in mix ($0.8 million).
Refer to Item 3. Quantitative and Qualitative Disclosures About Market Risk in this Form 10-Q for additional information on resin prices.
Projected Capital Expenditures and Depreciation & Amortization
Capital expenditures for PE Films are projected to be $2 million in 2024, including $1 million for productivity projects and $1 million for capital expenditures required to support continuity of current operations. Depreciation expense is projected to be $5 million in 2024. There is no amortization expense for PE Films.
Flexible Packaging Films
A summary of results for Flexible Packaging Films is provided below: | | | | | | | | | | | | | | | | | | | | | | | | | | | | | | | | | | | |
| Three Months Ended | | Favorable/
(Unfavorable)
% Change | | Nine Months Ended | | Favorable/
(Unfavorable)
% Change |
| (In thousands, except percentages) | September 30, | | September 30, | |
| 2024 | | 2023 | | 2024 | | 2023 | |
| Sales volume (lbs) | 25,295 | | | 22,163 | | | 14.1% | | 72,342 | | | 65,732 | | | 10.1% |
| Net sales | $ | 34,370 | | | $ | 30,111 | | | 14.1% | | $ | 99,025 | | | $ | 94,861 | | | 4.4% |
| Ongoing operations: | | | | | | | | | | | |
| EBITDA | $ | 3,749 | | | $ | 477 | | | NM** | | $ | 8,915 | | | $ | 2,076 | | | NM** |
| Depreciation & amortization | (708) | | | (704) | | | (0.6)% | | (2,191) | | | (2,115) | | | (3.6)% |
| EBIT* | $ | 3,041 | | | $ | (227) | | | NM** | | $ | 6,724 | | | $ | (39) | | | NM** |
| Capital expenditures | $ | 948 | | | $ | 1,408 | | | | | $ | 2,108 | | | $ | 2,891 | | | |
* See the table in Note 9 for a reconciliation of this non-GAAP measure to the most comparable measure calculated in accordance with GAAP. **Not meaningful ("NM") |
Third Quarter 2024 Results vs. Third Quarter 2023 Results
Net sales in the third quarter of 2024 increased 14.1% compared to the third quarter of 2023 primarily due to higher sales volume.
EBITDA from ongoing operations in the third quarter of 2024 increased $3.3 million versus the third quarter of 2023, primarily due to:
•Lower variable costs ($1.5 million), lower raw material costs ($1.1 million), higher volume ($1.0 million), favorable product mix ($0.8 million), lower fixed costs ($0.2 million), and lower SG&A ($0.2 million), partially offset by lower selling prices from global excess capacity and margin pressures ($0.6 million);
•Foreign currency transaction gains ($0.1 million) in the third quarter of 2024 compared to foreign currency transaction gains ($0.2 million) in the third quarter of 2023; and
•Net unfavorable foreign currency translation of Real-denominated operating costs ($0.8 million).
First Nine Months of 2024 Results vs. First Nine Months of 2023 Results
Net sales in the first nine months of 2024 increased 4.4% compared to the first nine months of 2023 primarily due to higher volume partially offset by lower selling prices that the Company believes are driven by excess global capacity and strong competition in Brazil, Latin America and the U.S and unfavorable product mix.
EBITDA from ongoing operations in the first nine months of 2024 increased $6.8 million versus the first nine months of 2023 primarily due to:
•Lower raw material costs ($5.1 million), lower fixed costs ($3.1 million), higher sales volume ($2.5 million), favorable product mix ($1.4 million), and lower SG&A ($0.6 million), partially offset by lower selling prices from global excess capacity and margin pressures ($4.0 million) and higher variable costs ($0.4 million);
•Foreign currency transaction gains ($0.1 million) in the first nine months of 2024 compared to foreign currency transaction losses ($0.1 million) in the first nine months of 2023; and
•Net unfavorable foreign currency translation of Real-denominated operating costs ($1.6 million).
Refer to Item 3. Quantitative and Qualitative Disclosures About Market Risk in this Form 10-Q for additional information on polyester fiber and component price trends.
Projected Capital Expenditures and Depreciation & Amortization
Capital expenditures for Flexible Packaging Films are projected to be $4 million in 2024 for capital expenditures required to support continuity of current operations. Depreciation expense is projected to be $3 million in 2024. Amortization expense is projected to be $0.1 million in 2024.
Corporate Expenses, Interest & Other
Corporate expenses, net in the first nine months of 2024 decreased $13.7 million compared to the first nine months of 2023 primarily due to lower pension expense as a result of the pension plan termination completed in 2023 ($10.1 million) and lower business development activities ($3.4 million).
Interest expense of $10.3 million in the first nine months of 2024 increased $2.5 million compared to the first nine months of 2023 due to higher average debt and higher interest rates.
Net capitalization and other credit measures are provided in Liquidity and Capital Resources below.
Liquidity and Capital Resources
The Company continues to focus on improving working capital management. Measures such as days sales outstanding (“DSO”), days inventory outstanding (“DIO”) and days payables outstanding (“DPO”) are used to evaluate changes in working capital. Changes in operating assets and liabilities from December 31, 2023 to September 30, 2024 are summarized below.
•Accounts and other receivables increased $13.7 million (20.2%).
◦Accounts and other receivables in Aluminum Extrusions increased $7.3 million primarily due to higher sales volume in the third quarter of 2024, partially offset by lower pricing associated with a shift in mix. DSO (represents trailing 12 months net sales divided by a rolling 12-month average of accounts and other receivables balances) was approximately 44.1 days for the 12 months ended September 30, 2024 and 45.1 days for the 12 months ended December 31, 2023.
◦Accounts and other receivables in PE Films increased $2.8 million primarily due to increased sales volume. DSO was approximately 24.2 days for the 12 months ended September 30, 2024 and 26.3 days for the 12 months ended December 31, 2023.
◦Accounts and other receivables in Flexible Packaging Films increased $3.7 million primarily due to increased sales volume. DSO was approximately 36.0 days for the 12 months ended September 30, 2024 and 38.1 days for the 12 months ended December 31, 2023.
•Inventories increased $6.0 million (7.3%).
◦Inventories in Aluminum Extrusions increased $1.3 million primarily due to higher average aluminum prices. DIO (represents trailing 12 months costs of goods sold calculated on a FIFO basis divided by a rolling 12-month average of inventory balances calculated on the FIFO basis) was approximately 47.3 days for the 12 months ended September 30, 2024 and 51.6 days for the 12 months ended December 31, 2023.
◦Inventories in PE Films increased $1.8 million primarily due to higher raw materials and finished goods levels to support increased sales volume during the first nine months of 2024. DIO was approximately 50.1 days for the 12 months ended September 30, 2024 and 57.2 days for the 12 months ended December 31, 2023.
◦Inventories in Flexible Packaging Films increased $2.8 million primarily due to higher raw materials and finished goods levels to support increased sales volume during the first nine months of 2024. DIO was approximately 104.0 days for the 12 months ended September 30, 2024 and 117.7 days for the 12 months ended December 31, 2023.
•Net property, plant and equipment decreased $14.8 million primarily due to depreciation expense of $18.4 million and a $3.0 million unfavorable change in the value of the U.S. dollar relative to foreign currencies, partially offset by capital expenditures of $7.1 million.
•Identifiable intangible assets, net decreased $1.5 million (15.1%) due to amortization expense.
•Deferred income tax assets decreased $2.3 million (9.1%). See Note 8 for more information.
•Accounts payable decreased $6.0 million (6.3%).
◦Accounts payable in Aluminum Extrusions decreased $10.3 million primarily due to the timing of payments. DPO (represents trailing 12 months costs of goods sold calculated on a FIFO basis divided by a rolling 12-month average of accounts payable balances) was approximately 45.7 days for the 12 months ended September 30, 2024 and 49.8 days for the 12 months ended December 31, 2023.
◦Accounts payable in PE Films increased $1.3 million primarily due to higher raw material purchases. DPO was approximately 42.9 days for the 12 months ended September 30, 2024 and 43.4 days for the 12 months ended December 31, 2023.
◦Accounts payable in Flexible Packaging Films increased $3.4 million primarily due to higher raw material purchases and favorable payment terms. DPO was approximately 75.4 days for the 12 months ended September 30, 2024 and 61.7 days for the 12 months ended December 31, 2023.
Net cash provided by operating activities was $6.1 million in the first nine months of 2024 compared to net cash provided by operating activities of $44.2 million in the first nine months of 2023. The decrease was primarily due to lower working capital, partially offset by higher EBITDA from ongoing operations for all reportable segments in the first nine months of 2024 versus prior year.
Net cash used in investing activities was $7.5 million in the first nine months of 2024 compared to $22.0 million the first nine months of 2023. The decrease was primarily due to lower capital expenditures ($14.6 million).
Net cash used in financing activities of $3.6 million in the first nine months of 2024 compared to net cash provided by financing activities of $7.7 million in the first nine months of 2023. The change was primarily due to higher net debt principal payments ($21.0 million) under the ABL Facility (as defined below) during the first nine months of 2024 as compared to the first nine months of 2023 and dividends paid ($8.9 million) during the first nine months of 2023.
At September 30, 2024, the Company had cash, cash equivalents and restricted cash of $6.6 million, including cash and cash equivalents held in locations outside the U.S. of $2.7 million.
Debt and Credit Agreements
ABL Facility
On December 27, 2023, the Company entered into Amendment No. 3 to the Second Amended and Restated Credit Agreement (the "Credit Agreement"), which provides the Company with a $180 million senior secured asset-based revolving credit facility that will mature on June 30, 2026. On April 16, 2024, the Company entered into Amendment No. 4 to the Credit Agreement (as amended by Amendment No. 3 and Amendment No. 4, the “ABL Facility”) that, among other items: (i) moves the ABL Adjustment Date (defined below) from March 31, 2025 to September 30, 2025 and (ii) requires weekly reporting of the borrowing base financial covenant until the ABL Adjustment Date. The ABL Facility is secured by substantially all assets of the Company and its domestic subsidiaries, including equity in certain material first-tier foreign subsidiaries. Availability for borrowings under the ABL Facility is governed by a borrowing base, determined by the application of specified advance rates against eligible assets, including a portion of trade accounts receivable, inventory, cash and cash equivalents, owned real properties, and owned machinery and equipment. Upon the earlier of September 30, 2025 or the date the Company receives the proceeds from the sale of Terphane (the “ABL Adjustment Date”), the $180 million ABL Facility will be reduced to $125 million. As of September 30, 2024, Minimum Liquidity (as defined in the ABL Facility) of $45.1 million, after reducing the borrowing base by the aggregate outstanding borrowings of $122.0 million and standby letters of credit of $12.9 million was in excess of the $10 million Minimum Liquidity financial covenant.
Under the terms of the ABL Facility, certain domestic bank accounts are subject to blocked account agreements, each of which contains a springing feature whereby the lenders may exercise control over those accounts during a cash dominion period (any such period, a “Cash Dominion Period”). A Cash Dominion Period was implemented on the date of the closing of the ABL Facility and will remain in effect at all times prior to the ABL Adjustment Date. After the ABL Adjustment Date, a Cash Dominion Period goes into effect if availability under the ABL Facility falls below 12.5% or an Event of Default (as defined in the ABL Facility) occurs. The Company would then be subject to the Cash Dominion Period until the Event of Default is waived or ABL Facility availability is above 12.5% of the $125 million aggregate commitment for 30 consecutive days. Receipts that have not yet been applied to the ABL Facility are classified as restricted cash in the Company’s consolidated balance sheets.
The financial covenants in the ABL Facility are as follows:
•Until the ABL Adjustment Date, the Company is required to maintain (i) a minimum Credit EBITDA (as defined in the ABL Facility), as of the end of each fiscal month for the 12-month period then ended (presented below) and (ii) a Minimum Liquidity (as defined in the ABL Facility) of $10.0 million.
| | | | | |
| Minimum Credit EBITDA (In thousands) |
| |
| |
| |
| September 2024 | $ | 25,370 | |
| October 2024 | 26,070 | |
| November 2024 | 27,640 | |
| December 2024 | 29,640 | |
| January 2025 | 29,740 | |
| February 2025 | 29,850 | |
| March 2025 | 29,980 | |
| April 2025 | 30,340 | |
| May 2025 | 30,700 | |
| June 2025 | 31,030 | |
| July 2025 | 31,370 | |
| August 2025 | 31,710 | |
| September 2025 | $ | 32,080 | |
•Following the ABL Adjustment Date, the foregoing financial covenants will cease to exist and will be replaced with a minimum fixed charge coverage ratio of 1.00:1.00 that will be triggered in the event that availability is less than 10% of $125 million commitment amount and continuing thereafter until availability is greater than 10% of the $125 million commitment amount for 30 consecutive days.
The computation of Credit EBITDA, as defined in the ABL Facility, is presented below. | | | | | |
Computations of Credit EBITDA (as defined in the ABL Facility) as of and for the Twelve Months Ended September 30, 2024 * |
Computations of Credit EBITDA for the twelve months ended September 30, 2024 (in thousands): |
| Net income (loss) | $ | (27,456) | |
| Plus: | |
| After-tax losses related to discontinued operations | — | |
| Total income tax expense for continuing operations | — | |
| Interest expense | 14,130 | |
| Depreciation and amortization expense for continuing operations | 26,515 | |
| All non-cash losses and expenses, plus cash losses and expenses not to exceed $10,000, for continuing operations that are classified as unusual, extraordinary or which are related to plant shutdowns, asset impairments and/or restructurings (cash-related of $8,722) | 76,005 | |
| Charges related to stock option grants and awards accounted for under the fair value-based method | — | |
| Losses related to the application of the equity method of accounting | — | |
| Losses related to adjustments in the estimated fair value of assets accounted for under the fair value method of accounting | — | |
| Fees, costs and expenses incurred in connection with the amendment process | 373 | |
| Terphane sale transaction costs in an amount not to exceed $10,000 | 1,716 | |
| Minus: | |
| After-tax income related to discontinued operations | — | |
| Total income tax benefits for continuing operations | (34,245) | |
| Interest income | (423) | |
| All non-cash gains and income, plus cash gains and income in excess of $10,000, for continuing operations that are classified as unusual, extraordinary or which are related to plant shutdowns, asset impairments and/or restructurings | — | |
| Income related to changes in estimates for stock option grants and awards accounted for under the fair value-based method | — | |
| Income related to the application of the equity method of accounting | — | |
| Income related to adjustments in the estimated fair value of assets accounted for under the fair value method of accounting | (144) | |
| Plus cash dividends declared on investments in an amount not to exceed $10,000 for such period | — | |
| Plus or minus, as applicable, pro forma EBITDA adjustments associated with acquisitions and asset dispositions | — | |
| Plus or minus, as applicable, pro forma EBITDA adjustments to pension expense associated with the early payment of pension obligations | 2,627 | |
| Credit EBITDA | 59,098 | |
*Credit EBITDA is not intended to represent net income (loss) or cash flow from operations as defined by GAAP and should not be considered as an alternative to either net income (loss) or to cash flow. |
The computation of the ABL Facility Minimum Liquidity financial covenant, as defined in the ABL Facility, is presented below. | | | | | | | | | | | |
| (In thousands, except percentages) | September 30, 2024 | | December 31, 2023 |
| | | |
| Maximum aggregate principal | $ | 180,000 | | | $ | 180,000 | |
| | | |
Maximum borrowing limit per the Borrowing base as defined in the ABL Facility (includes eligible domestic cash and cash equivalents of $4,282 as of September 30, 2024 and $3,846 as of December 31, 2023) | $ | 180,000 | | | $ | 172,286 | |
| ABL Facility outstanding debt (matures on June 30, 2026) | 122,000 | | | 126,322 | |
| Outstanding standby letters of credit | 12,937 | | | 13,080 | |
| ABL Facility Minimum Liquidity | $ | 45,063 | | | $ | 32,884 | |
| Minimum Liquidity financial covenant | $ | 10,000 | | | $ | 10,000 | |
In addition to the financial covenants, the ABL Facility contains restrictive covenants, including covenants that restrict the Company’s ability to pay dividends and repurchase shares of its common stock. After the ABL Adjustment Date, the Company is no longer prohibited from making dividend payments and share repurchases. All decisions with respect to the declaration and payment of future dividends and share repurchases will be made by the Board in its sole discretion based upon earnings, financial condition, anticipated cash needs and other such considerations as the Board deems relevant.
As of September 30, 2024, the Company was in compliance with all debt covenants. On November 1, 2024, with the closing of the Terphane Sale, the ABL Adjustment Date has occurred.
Terphane Brazil Loan
On October 26, 2023, Terphane Ltda., the Company’s wholly owned subsidiary in Brazil, borrowed $20 million secured by certain of its assets (“Terphane Brazil Loan”). This U.S. Dollar borrowing matures on October 30, 2028. On October 26, 2023, the Company borrowed $20 million from Terphane Ltda. (the “Intercompany Loan”) at the same interest rate as the Terphane Brazil Loan, thereby transferring the funds to the U.S. In connection with the closing of the Terphane Sale, both the Terphane Brazil Loan and the Intercompany Loan were assumed by Oben.
PE Films Guangzhou Loan
On June 25, 2024, PE Films' business location in Guangzhou, China, Guangzhou Tredegar Film Products Co., Ltd. (“Guangzhou Tredegar”), entered into a 9.5 million Chinese Yuan, which is equivalent to $1.4 million as of September 30, 2024, revolving loan with the Industrial and Commercial Bank of China. The loan matures on July 3, 2025. The interest rate is the one year loan prime rate published by the National Interbank Funding Center for the working day immediately preceding the drawdown date, minus 0.45%. As of September 30, 2024, the National Interbank Funding Center rate was 3.35%. The revolving loan is secured by a mortgage contract listing the Guangzhou Tredegar factory building as collateral. The mortgage contract has a maximum value of 30 million Chinese Yuan and is effective from June 25, 2024 through May 31, 2027.
For more information on the ABL Facility, the Terphane Brazil Loan and the PE Films Guangzhou Loan, see Note 10 for additional information.
The Company believes that existing borrowing availability, current cash balances and cash flow from operations will be sufficient to satisfy short term material cash requirements related to working capital, capital expenditure, and debt repayments for at least the next 12 months. In the longer term, liquidity will depend on many factors, including the results of operations, the timing and extent of capital expenditures, changes in operating plans, or other events that would cause the Company to seek additional financing in future periods. In addition, the completion of the Terphane Sale has provided additional liquidity.
Item 3. Quantitative and Qualitative Disclosures About Market Risk.
Tredegar has exposure to the volatility of interest rates, polyethylene and polypropylene resin prices, Terephthalic Acid (“PTA”) and Monoethylene Glycol (“MEG”) prices, aluminum ingot and scrap prices, energy prices, foreign currencies and emerging markets. See Liquidity and Capital Resources above regarding interest rate exposures related to borrowings under the Credit Agreement.
Profit margins in Aluminum Extrusions are sensitive to fluctuations in aluminum ingot and scrap prices as well as natural gas prices (natural gas is the principal energy source used to operate its casting furnaces). Changes in polyethylene resin prices and the timing of those changes could have a significant impact on profit margins in PE Films. Changes in polyester resin, PTA and MEG prices, and the timing of those changes, could have a significant impact on profit margins in Flexible Packaging Films. There is no assurance of the Company’s ability to pass through higher raw material and energy costs to its customers.
The purchase price of raw materials fluctuates on a monthly basis; therefore, Aluminum Extrusions pricing policies generally allow the Company to pass the underlying index cost of aluminum and certain alloys through to the vast majority of our customers so that we remain substantially neutral to metal pricing. In the normal course of business, Aluminum Extrusions enters into fixed-price forward sales contracts with certain customers for the sale of fixed quantities of aluminum extrusions at scheduled intervals. In order to hedge its exposure to aluminum price volatility (see the chart below) under these fixed-price arrangements, which generally have a duration of not more than 12 months, the Company enters into a combination of forward purchase commitments and futures contracts to acquire or hedge aluminum, based on the scheduled deliveries. See Note 7 for additional information.
The volatility of quarterly average aluminum prices is shown in the chart below.
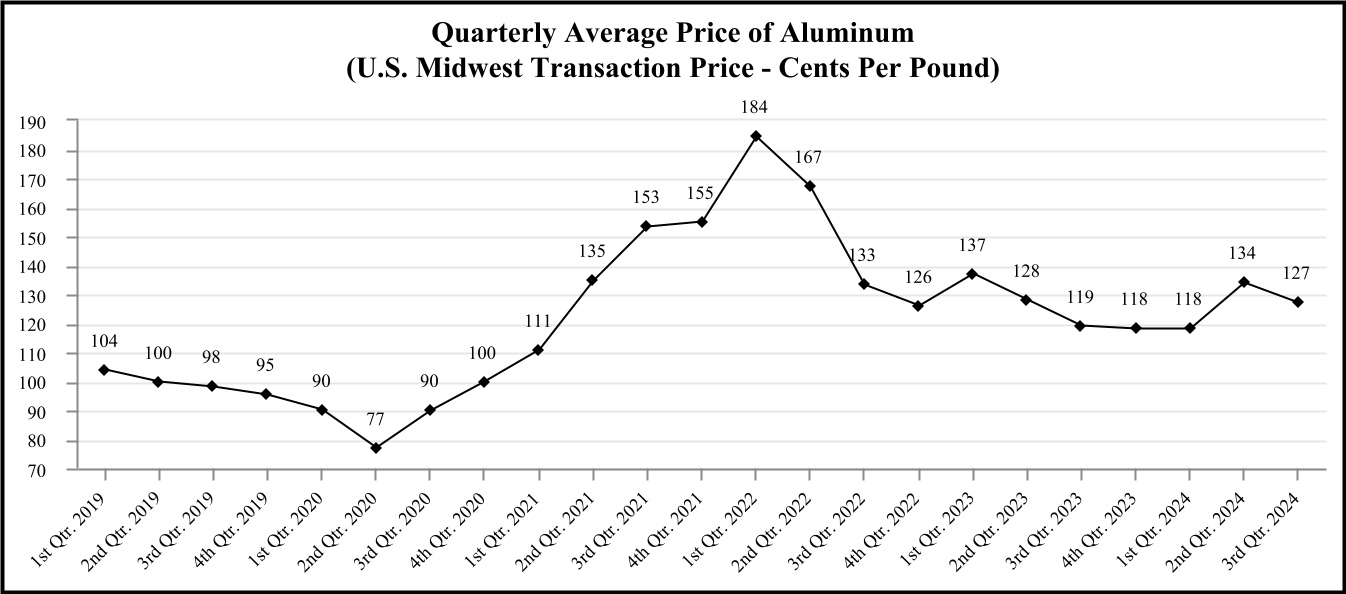
| | |
| Source: Quarterly averages computed by the Company using London Metal Exchange daily aluminum cash prices plus the Midwest premium. |
The volatility of quarterly average natural gas prices is shown in the chart below.
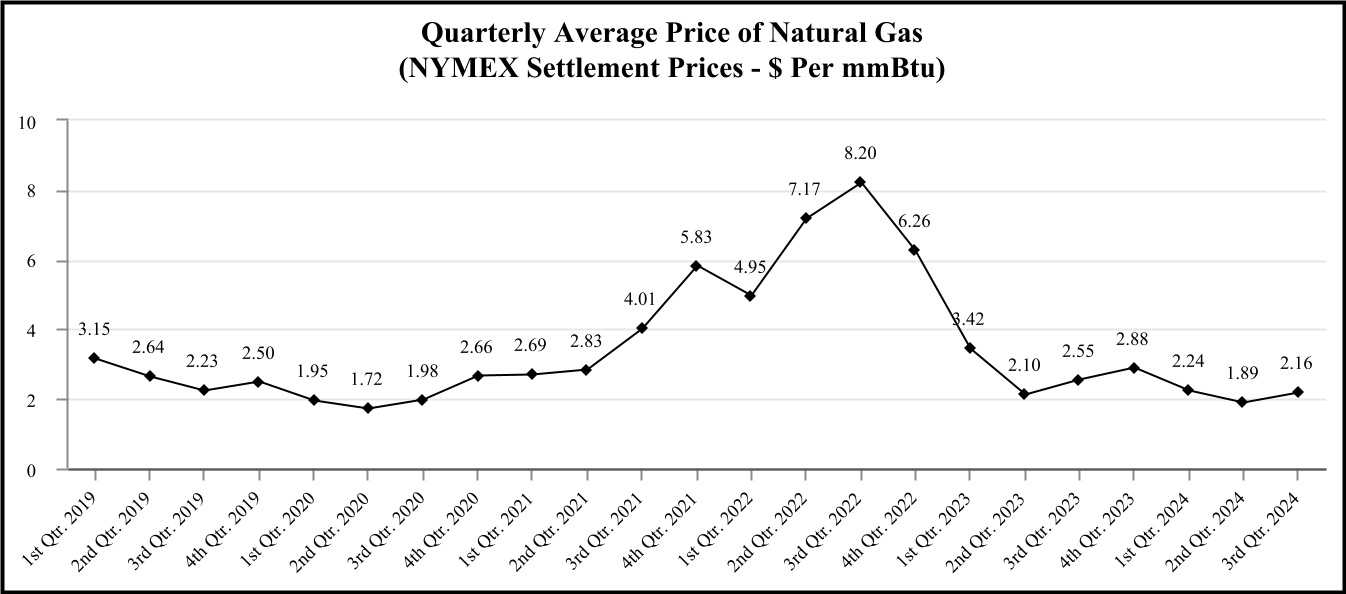
| | |
| Source: Quarterly averages computed by Tredegar using monthly NYMEX settlement prices. |
The volatility of average quarterly prices of polyethylene resin in the U.S. (a primary raw material for PE Films) is shown in the chart below.
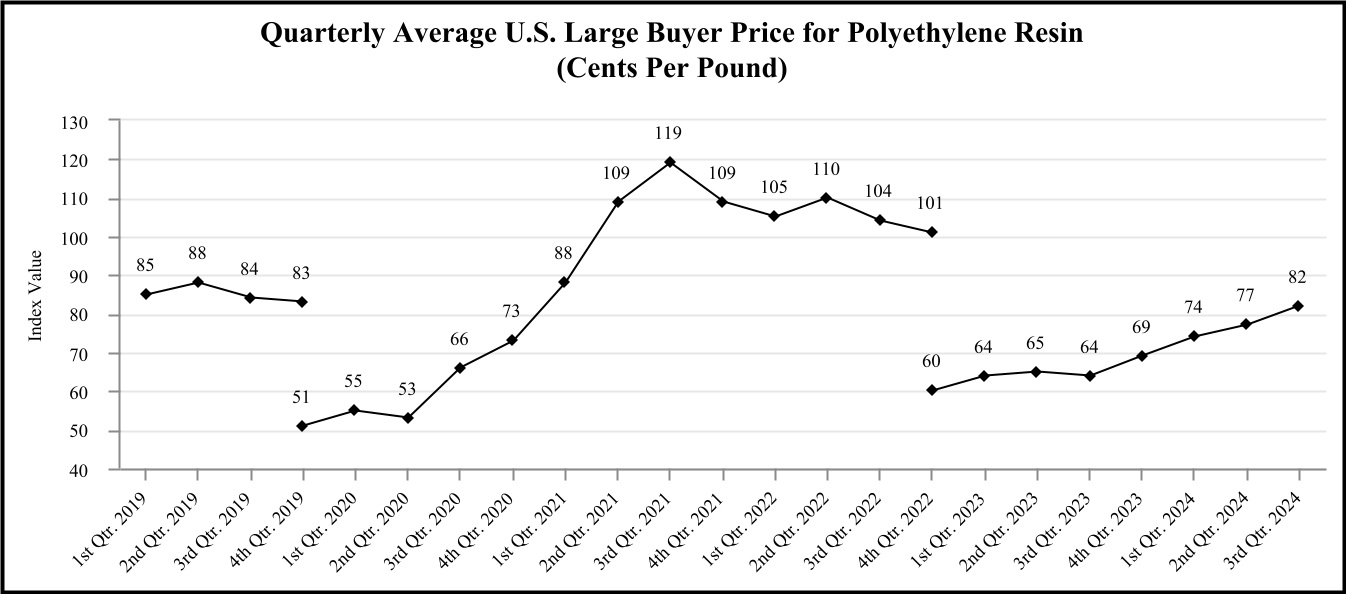
| | |
Source: Quarterly averages computed by Tredegar using monthly data provided by IHS, Inc. In February 2020, IHS reflected a 32 cents per pound non-market adjustment based on their estimate of the growth of discounts in prior periods. The fourth quarter 2019 average rate of $0.51 per pound is shown on a pro forma basis as if the non-market adjustment was made in the fourth quarter of 2019. In January 2023, IHS reflected a 41 cents per pound non-market adjustment based on their estimate of the growth of discounts in the prior periods. The fourth quarter 2022 average rate of $0.60 per pound is shown on a pro forma basis as if the non-market adjustment was made in the fourth quarter of 2022. |
The price of resin is driven by several factors, including supply and demand and the price of oil, ethylene and natural gas. Selling prices to customers are set considering numerous factors, including the expected volatility of resin prices. PE Films has index-based pass-through raw material cost arrangements with customers. However, under certain agreements, changes in resin prices are not passed through for a period of 90 days. In response to unprecedented cost increases and supply issues for polyethylene and polypropylene resin, Tredegar Surface Protection implemented a quarterly resin cost pass-through mechanism, effective July 1, 2021, for all products and customers not previously covered by such arrangements. Pricing on the remainder of the business is based upon raw material costs and supply/demand dynamics within the markets that the Company competes.
Polyester resins, MEG and PTA used in flexible packaging films produced in Brazil are primarily purchased domestically, with other sources available mostly from Asia and the U.S. Given the nature of these products as commodities, pricing is derived from Asian pricing indexes. The volatility of the average quarterly prices for polyester fibers in Asia, which is representative of polyester resin (a primary raw material for Flexible Packaging Films) pricing trends, is shown in the chart below:
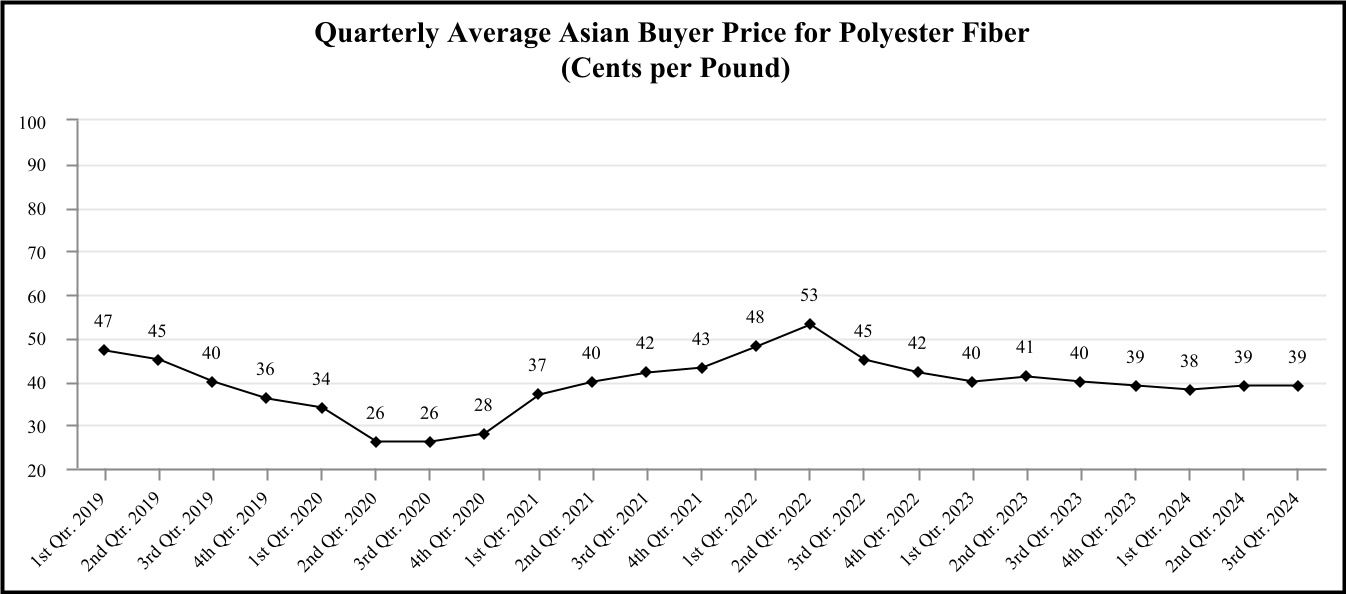
| | |
Source: Quarterly averages computed by Tredegar using monthly data from CMAI Global Index data.
|
The volatility of average quarterly prices of PTA and MEG in Asia (raw materials used in the production of polyester resins produced by Flexible Packaging Films) is shown in the chart below:
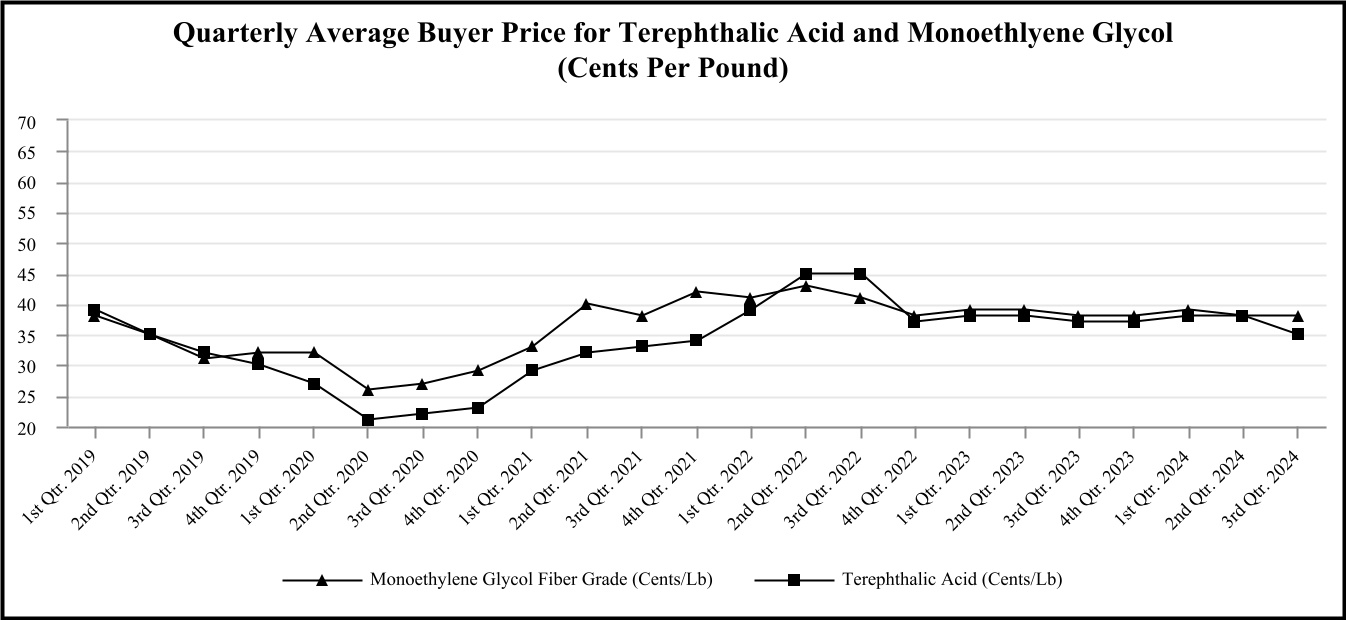
| | |
| Source: Quarterly averages computed by Tredegar using monthly data from CMAI Global Index data. |
Tredegar attempts to match the pricing and cost of its products in the same currency and generally views the volatility of foreign currencies and the corresponding impact on earnings and cash flow as part of the overall risk of operating in a global environment (for additional information, see trends for the Brazilian Real and Chinese Yuan in the charts on the following page). Exports from the U.S. are generally denominated in U.S. Dollars. The Company’s foreign currency exposure on income from foreign operations relates to the Chinese Yuan and the Brazilian Real.
PE Films is generally able to match the currency of its sales and costs for its product lines. For flexible packaging films produced in Brazil, selling prices and key raw material costs are principally determined in U.S. Dollars and are impacted by local economic conditions and local and global competitive dynamics. Flexible Packaging Films is exposed to foreign
exchange translation risk (its functional currency is the Brazilian Real) because almost 90% of the sales of Flexible Packaging Films business unit in Brazil (“Terphane Ltda.”) and substantially all of its related raw material costs are quoted or priced in U.S. Dollars while its variable conversion, fixed conversion and sales, general and administrative costs before depreciation & amortization (collectively “Terphane Ltda. Operating Costs”) are quoted or priced in Brazilian Real. This mismatch, together with a variety of economic variables impacting currency exchange rates, causes volatility that could negatively or positively impact EBITDA from ongoing operations for Flexible Packaging Films.
The Company estimates annual net costs of R$139.0 million for the net mismatch translation exposure between Terphane Ltda.’s U.S. Dollar quoted or priced sales and raw material costs and underlying Brazilian Real quoted or priced Terphane Ltda. Operating Costs. Terphane Ltda. has outstanding foreign exchange average forward rate contracts to purchase Brazilian Real and sell U.S. Dollars to hedge its exposure. See Note 7 for more information on outstanding hedging contracts and this hedging program.
Tredegar estimates that the change in the value of foreign currencies relative to the U.S. Dollar for PE Films had an unfavorable impact on EBITDA from ongoing operations of $0.2 million for the third quarter of 2024 and an unfavorable impact on EBITDA from ongoing operations of $0.4 million in the first nine months of 2024 compared with the same periods of 2023.
Trends for the Brazilian Real and Chinese Yuan exchange rates relative to the U.S. Dollar are shown in the chart below.
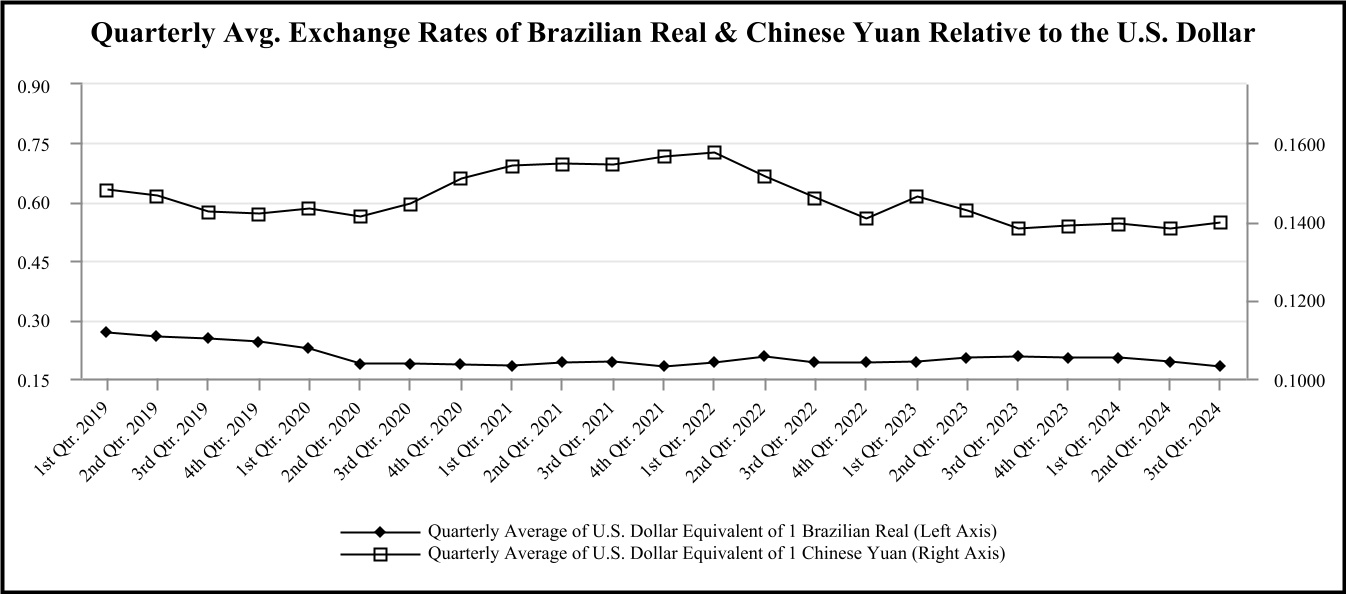
| | |
Source: Quarterly averages computed by Tredegar using daily closing data provided by Bloomberg.
|
Item 4. Controls and Procedures.
Evaluation of Disclosure Controls and Procedures
In connection with the preparation of this Form 10-Q, pursuant to Rule 13a-15(b) under the Securities Exchange Act of 1934, as amended (the “Exchange Act”), the Company carried out an evaluation with the participation of its management, including its Chief Executive Officer (principal executive officer) and Chief Financial Officer (principal financial officer), of the effectiveness of the design and operation of the Company’s disclosure controls and procedures (as defined under Rule 13a-15(e) and 15d-15(e) under the Exchange Act) as of September 30, 2024.
Based on this evaluation of our disclosure controls and procedures as of September 30, 2024, the Company's Chief Executive Officer and Chief Financial Officer concluded that, as of such date, our disclosure controls and procedures were effective.
Changes in Internal Control Over Financial Reporting
There has been no change in the Company’s internal control over financial reporting during the quarter ended September 30, 2024, that has materially affected, or is reasonably likely to materially affect, its internal control over financial reporting (as defined in Rules 13a-15(f) and 15d-15(f) under the Exchange Act).
PART II - OTHER INFORMATION
Item 1A. Risk Factors.
As disclosed in “Item 1A. Risk Factors” in the 2023 Form 10-K, there are a number of risks and uncertainties that can have a material effect on the operating results of our businesses and our financial condition. There are no material updates or changes to our risk factors previously disclosed in the 2023 Form 10-K.
Item 2. Unregistered Sales of Equity Securities and Use of Proceeds.
The Company’s Credit Agreement contains financial and other restrictive covenants, including a restriction on the Company’s ability to pay dividends to shareholders prior to the ABL Adjustment Date. For more information on the Credit Agreement, see “Item 2. Management’s Discussion and Analysis of Financial Condition and Results of Operations - Liquidity and Capital Resources.”
Item 5. Other Information.
Director and Officer Trading Arrangements
During the three months ended September 30, 2024, no director or officer of the Company adopted or terminated a "Rule 10b5-1 trading arrangement" or "non-Rule 10b5-1 trading arrangement," as each term is defined in Item 408(a) of Regulation S-K.
Item 6. Exhibits. | | | | | | | | |
| 31.1 | | |
| 31.2 | | |
| 32.1 | | |
| 32.2 | | |
| 101 | | XBRL Instance Document and Related Items. |
| 104 | | Cover Page Interactive Data File (formatted in iXBRL and contained in Exhibit 101). |
| * | | Denotes compensatory plans or arrangements or management contracts. |
SIGNATURES
Pursuant to the requirements of the Securities Exchange Act of 1934, the Registrant has duly caused this report to be signed on its behalf by the undersigned thereunto duly authorized. | | | | | | | | | | | | | | |
| | | | Tredegar Corporation |
| | | | (Registrant) |
| | |
| Date: | | November 8, 2024 | | /s/ John M. Steitz |
| | | | John M. Steitz |
| | | | President and Chief Executive Officer |
| | | | (Principal Executive Officer) |
| | | | |
| Date: | | November 8, 2024 | | /s/ D. Andrew Edwards |
| | | | D. Andrew Edwards |
| | | | Executive Vice President and Chief Financial Officer |
| | | | (Principal Financial Officer) |
| | | | |
| Date: | | November 8, 2024 | | /s/ Frasier W. Brickhouse, II |
| | | | Frasier W. Brickhouse, II |
| | | | Corporate Treasurer and Controller |
| | | | (Principal Accounting Officer) |
EXHIBIT 31.1
Section 302 Certification
I, John M. Steitz, certify that:
(1)I have reviewed this Quarterly Report on Form 10-Q for the quarter ended September 30, 2024, of Tredegar Corporation;
(2)Based on my knowledge, this report does not contain any untrue statement of a material fact or omit to state a material fact necessary to make the statements made, in light of the circumstances under which such statements were made, not misleading with respect to the period covered by this report;
(3)Based on my knowledge, the financial statements, and other financial information included in this report, fairly present in all material respects the financial condition, results of operations and cash flows of the registrant as of, and for, the periods presented in this report;
(4)The registrant’s other certifying officer and I are responsible for establishing and maintaining disclosure controls and procedures (as defined in Exchange Act Rules 13a-15(e) and 15d-15(e)) and internal control over financial reporting (as defined in Exchange Act Rules 13a-15(f) and 15d-15(f)) for the registrant and have:
(a)Designed such disclosure controls and procedures, or caused such disclosure controls and procedures to be designed under our supervision, to ensure that material information relating to the registrant, including its consolidated subsidiaries, is made known to us by others within those entities, particularly during the period in which this report is being prepared;
(b)Designed such internal control over financial reporting, or caused such internal control over financial reporting to be designed under our supervision, to provide reasonable assurance regarding the reliability of financial reporting and the preparation of financial statements for external purposes in accordance with generally accepted accounting principles;
(c)Evaluated the effectiveness of the registrant’s disclosure controls and procedures and presented in this report our conclusions about the effectiveness of the disclosure controls and procedures as of the end of the period covered by this report based on such evaluation; and
(d)Disclosed in this report any change in the registrant’s internal control over financial reporting that occurred during the registrant’s most recent fiscal quarter (the registrant’s fourth fiscal quarter in the case of an annual report) that has materially affected, or is reasonably likely to materially affect, the registrant’s internal control over financial reporting; and
(5)The registrant’s other certifying officer and I have disclosed, based on our most recent evaluation of internal control over financial reporting, to the registrant’s auditors and the audit committee of the registrant’s board of directors (or persons performing the equivalent functions):
(a)All significant deficiencies and material weaknesses in the design or operation of internal control over financial reporting which are reasonably likely to adversely affect the registrant’s ability to record, process, summarize and report financial information; and
(b)Any fraud, whether or not material, that involves management or other employees who have a significant role in the registrant’s internal control over financial reporting.
Date: November 8, 2024 | | | | | | | | | | | |
| /s/ John M. Steitz | | |
| John M. Steitz | | |
| President and Chief Executive Officer | | |
| (Principal Executive Officer) | | |
EXHIBIT 31.2
Section 302 Certification
I, D. Andrew Edwards, certify that:
(1)I have reviewed this Quarterly Report on Form 10-Q for the quarter ended September 30, 2024, of Tredegar Corporation;
(2)Based on my knowledge, this report does not contain any untrue statement of a material fact or omit to state a material fact necessary to make the statements made, in light of the circumstances under which such statements were made, not misleading with respect to the period covered by this report;
(3)Based on my knowledge, the financial statements, and other financial information included in this report, fairly present in all material respects the financial condition, results of operations and cash flows of the registrant as of, and for, the periods presented in this report;
(4)The registrant’s other certifying officer and I are responsible for establishing and maintaining disclosure controls and procedures (as defined in Exchange Act Rules 13a-15(e) and 15d-15(e)) and internal control over financial reporting (as defined in Exchange Act Rules 13a-15(f) and 15d-15(f)) for the registrant and have:
(a)Designed such disclosure controls and procedures, or caused such disclosure controls and procedures to be designed under our supervision, to ensure that material information relating to the registrant, including its consolidated subsidiaries, is made known to us by others within those entities, particularly during the period in which this report is being prepared;
(b)Designed such internal control over financial reporting, or caused such internal control over financial reporting to be designed under our supervision, to provide reasonable assurance regarding the reliability of financial reporting and the preparation of financial statements for external purposes in accordance with generally accepted accounting principles;
(c)Evaluated the effectiveness of the registrant’s disclosure controls and procedures and presented in this report our conclusions about the effectiveness of the disclosure controls and procedures as of the end of the period covered by this report based on such evaluation; and
(d)Disclosed in this report any change in the registrant’s internal control over financial reporting that occurred during the registrant’s most recent fiscal quarter (the registrant’s fourth fiscal quarter in the case of an annual report) that has materially affected, or is reasonably likely to materially affect, the registrant’s internal control over financial reporting; and
(5)The registrant’s other certifying officer and I have disclosed, based on our most recent evaluation of internal control over financial reporting, to the registrant’s auditors and the audit committee of the registrant’s board of directors (or persons performing the equivalent functions):
(a)All significant deficiencies and material weaknesses in the design or operation of internal control over financial reporting which are reasonably likely to adversely affect the registrant’s ability to record, process, summarize and report financial information; and
(b)Any fraud, whether or not material, that involves management or other employees who have a significant role in the registrant’s internal control over financial reporting.
Date: November 8, 2024 | | | | | | | | | | | |
| /s/ D. Andrew Edwards | | |
| D. Andrew Edwards | | |
| Executive Vice President and Chief Financial Officer | | |
| (Principal Financial Officer) | | |
EXHIBIT 32.1
CERTIFICATION PURSUANT TO
18 U.S.C. SECTION 1350,
AS ADOPTED PURSUANT TO
SECTION 906 OF THE SARBANES-OXLEY ACT OF 2002
In connection with the Quarterly Report on Form 10-Q of Tredegar Corporation (the “Company”) for the quarter ended September 30, 2024 as filed with the Securities and Exchange Commission on the date hereof (the “Report”), I, John M. Steitz, President and Chief Executive Officer of the Company, certify, pursuant to 18 U.S.C. § 1350, as adopted pursuant to § 906 of the Sarbanes-Oxley Act of 2002, that:
(1) the Report fully complies with the requirements of Section 13(a) or 15(d) of the Securities Exchange Act of 1934, as amended; and
(2) the information contained in the Report fairly presents, in all material respects, the financial condition and results of operations of the Company. | | | | | | | | |
| /s/ John M. Steitz | | |
| John M. Steitz | | |
| President and Chief Executive Officer | | |
| (Principal Executive Officer) | | |
| November 8, 2024 | | |
EXHIBIT 32.2
CERTIFICATION PURSUANT TO
18 U.S.C. SECTION 1350,
AS ADOPTED PURSUANT TO
SECTION 906 OF THE SARBANES-OXLEY ACT OF 2002
In connection with the Quarterly Report on Form 10-Q of Tredegar Corporation (the “Company”) for the quarter ended September 30, 2024 as filed with the Securities and Exchange Commission on the date hereof (the “Report”), I, D. Andrew Edwards, Executive Vice President and Chief Financial Officer of the Company, certify, pursuant to 18 U.S.C. § 1350, as adopted pursuant to § 906 of the Sarbanes-Oxley Act of 2002, that:
(1) the Report fully complies with the requirements of Section 13(a) or 15(d) of the Securities Exchange Act of 1934, as amended; and
(2) the information contained in the Report fairly presents, in all material respects, the financial condition and results of operations of the Company. | | | | | | | | |
| /s/ D. Andrew Edwards | | |
| D. Andrew Edwards | | |
| Executive Vice President and Chief Financial Officer | | |
| (Principal Financial Officer) | | |
| November 8, 2024 | | |
v3.24.3
Cover - shares
|
9 Months Ended |
|
Sep. 30, 2024 |
Nov. 01, 2024 |
| Cover [Abstract] |
|
|
| Document Type |
10-Q
|
|
| Document Quarterly Report |
true
|
|
| Document Transition Report |
false
|
|
| Entity File Number |
1-10258
|
|
| Entity Registrant Name |
Tredegar Corporation
|
|
| Entity Incorporation, State or Country Code |
VA
|
|
| Entity Tax Identification Number |
54-1497771
|
|
| Entity Address, Address Line One |
1100 Boulders Parkway
|
|
| Entity Address, City or Town |
Richmond,
|
|
| Entity Address, State or Province |
VA
|
|
| Entity Address, Postal Zip Code |
23225
|
|
| City Area Code |
(804)
|
|
| Local Phone Number |
330-1000
|
|
| Title of 12(b) Security |
Common stock, no par value
|
|
| Trading Symbol |
TG
|
|
| Security Exchange Name |
NYSE
|
|
| Entity Current Reporting Status |
Yes
|
|
| Entity Interactive Data Current |
Yes
|
|
| Entity Filer Category |
Accelerated Filer
|
|
| Entity Small Business |
true
|
|
| Entity Emerging Growth Company |
false
|
|
| Entity Shell Company |
false
|
|
| Entity Central Index Key |
0000850429
|
|
| Current Fiscal Year End Date |
--12-31
|
|
| Document Fiscal Year Focus |
2024
|
|
| Document Fiscal Period Focus |
Q3
|
|
| Document Period End Date |
Sep. 30, 2024
|
|
| Amendment Flag |
false
|
|
| Entity Common Stock, Shares Outstanding |
|
34,360,952
|
| X |
- DefinitionBoolean flag that is true when the XBRL content amends previously-filed or accepted submission.
| Name: |
dei_AmendmentFlag |
| Namespace Prefix: |
dei_ |
| Data Type: |
xbrli:booleanItemType |
| Balance Type: |
na |
| Period Type: |
duration |
|
| X |
- DefinitionEnd date of current fiscal year in the format --MM-DD.
| Name: |
dei_CurrentFiscalYearEndDate |
| Namespace Prefix: |
dei_ |
| Data Type: |
xbrli:gMonthDayItemType |
| Balance Type: |
na |
| Period Type: |
duration |
|
| X |
- DefinitionFiscal period values are FY, Q1, Q2, and Q3. 1st, 2nd and 3rd quarter 10-Q or 10-QT statements have value Q1, Q2, and Q3 respectively, with 10-K, 10-KT or other fiscal year statements having FY.
| Name: |
dei_DocumentFiscalPeriodFocus |
| Namespace Prefix: |
dei_ |
| Data Type: |
dei:fiscalPeriodItemType |
| Balance Type: |
na |
| Period Type: |
duration |
|
| X |
- DefinitionThis is focus fiscal year of the document report in YYYY format. For a 2006 annual report, which may also provide financial information from prior periods, fiscal 2006 should be given as the fiscal year focus. Example: 2006.
| Name: |
dei_DocumentFiscalYearFocus |
| Namespace Prefix: |
dei_ |
| Data Type: |
xbrli:gYearItemType |
| Balance Type: |
na |
| Period Type: |
duration |
|
| X |
- DefinitionFor the EDGAR submission types of Form 8-K: the date of the report, the date of the earliest event reported; for the EDGAR submission types of Form N-1A: the filing date; for all other submission types: the end of the reporting or transition period. The format of the date is YYYY-MM-DD.
| Name: |
dei_DocumentPeriodEndDate |
| Namespace Prefix: |
dei_ |
| Data Type: |
xbrli:dateItemType |
| Balance Type: |
na |
| Period Type: |
duration |
|
| X |
- DefinitionBoolean flag that is true only for a form used as an quarterly report. Reference 1: http://www.xbrl.org/2003/role/presentationRef
-Publisher SEC
-Name Form 10-Q
-Number 240
-Section 308
-Subsection a
| Name: |
dei_DocumentQuarterlyReport |
| Namespace Prefix: |
dei_ |
| Data Type: |
xbrli:booleanItemType |
| Balance Type: |
na |
| Period Type: |
duration |
|
| X |
- DefinitionBoolean flag that is true only for a form used as a transition report. Reference 1: http://www.xbrl.org/2003/role/presentationRef
-Publisher SEC
-Name Forms 10-K, 10-Q, 20-F
-Number 240
-Section 13
-Subsection a-1
| Name: |
dei_DocumentTransitionReport |
| Namespace Prefix: |
dei_ |
| Data Type: |
xbrli:booleanItemType |
| Balance Type: |
na |
| Period Type: |
duration |
|
| X |
- DefinitionThe type of document being provided (such as 10-K, 10-Q, 485BPOS, etc). The document type is limited to the same value as the supporting SEC submission type, or the word 'Other'.
| Name: |
dei_DocumentType |
| Namespace Prefix: |
dei_ |
| Data Type: |
dei:submissionTypeItemType |
| Balance Type: |
na |
| Period Type: |
duration |
|
| X |
- DefinitionAddress Line 1 such as Attn, Building Name, Street Name
| Name: |
dei_EntityAddressAddressLine1 |
| Namespace Prefix: |
dei_ |
| Data Type: |
xbrli:normalizedStringItemType |
| Balance Type: |
na |
| Period Type: |
duration |
|
| X |
- Definition
+ References
+ Details
| Name: |
dei_EntityAddressCityOrTown |
| Namespace Prefix: |
dei_ |
| Data Type: |
xbrli:normalizedStringItemType |
| Balance Type: |
na |
| Period Type: |
duration |
|
| X |
- DefinitionCode for the postal or zip code
| Name: |
dei_EntityAddressPostalZipCode |
| Namespace Prefix: |
dei_ |
| Data Type: |
xbrli:normalizedStringItemType |
| Balance Type: |
na |
| Period Type: |
duration |
|
| X |
- DefinitionName of the state or province.
| Name: |
dei_EntityAddressStateOrProvince |
| Namespace Prefix: |
dei_ |
| Data Type: |
dei:stateOrProvinceItemType |
| Balance Type: |
na |
| Period Type: |
duration |
|
| X |
- DefinitionA unique 10-digit SEC-issued value to identify entities that have filed disclosures with the SEC. It is commonly abbreviated as CIK. Reference 1: http://www.xbrl.org/2003/role/presentationRef
-Publisher SEC
-Name Exchange Act
-Number 240
-Section 12
-Subsection b-2
| Name: |
dei_EntityCentralIndexKey |
| Namespace Prefix: |
dei_ |
| Data Type: |
dei:centralIndexKeyItemType |
| Balance Type: |
na |
| Period Type: |
duration |
|
| X |
- DefinitionIndicate number of shares or other units outstanding of each of registrant's classes of capital or common stock or other ownership interests, if and as stated on cover of related periodic report. Where multiple classes or units exist define each class/interest by adding class of stock items such as Common Class A [Member], Common Class B [Member] or Partnership Interest [Member] onto the Instrument [Domain] of the Entity Listings, Instrument.
| Name: |
dei_EntityCommonStockSharesOutstanding |
| Namespace Prefix: |
dei_ |
| Data Type: |
xbrli:sharesItemType |
| Balance Type: |
na |
| Period Type: |
instant |
|
| X |
- DefinitionIndicate 'Yes' or 'No' whether registrants (1) have filed all reports required to be filed by Section 13 or 15(d) of the Securities Exchange Act of 1934 during the preceding 12 months (or for such shorter period that registrants were required to file such reports), and (2) have been subject to such filing requirements for the past 90 days. This information should be based on the registrant's current or most recent filing containing the related disclosure.
| Name: |
dei_EntityCurrentReportingStatus |
| Namespace Prefix: |
dei_ |
| Data Type: |
dei:yesNoItemType |
| Balance Type: |
na |
| Period Type: |
duration |
|
| X |
- DefinitionIndicate if registrant meets the emerging growth company criteria. Reference 1: http://www.xbrl.org/2003/role/presentationRef
-Publisher SEC
-Name Exchange Act
-Number 240
-Section 12
-Subsection b-2
| Name: |
dei_EntityEmergingGrowthCompany |
| Namespace Prefix: |
dei_ |
| Data Type: |
xbrli:booleanItemType |
| Balance Type: |
na |
| Period Type: |
duration |
|
| X |
- DefinitionCommission file number. The field allows up to 17 characters. The prefix may contain 1-3 digits, the sequence number may contain 1-8 digits, the optional suffix may contain 1-4 characters, and the fields are separated with a hyphen.
| Name: |
dei_EntityFileNumber |
| Namespace Prefix: |
dei_ |
| Data Type: |
dei:fileNumberItemType |
| Balance Type: |
na |
| Period Type: |
duration |
|
| X |
- DefinitionIndicate whether the registrant is one of the following: Large Accelerated Filer, Accelerated Filer, Non-accelerated Filer. Definitions of these categories are stated in Rule 12b-2 of the Exchange Act. This information should be based on the registrant's current or most recent filing containing the related disclosure. Reference 1: http://www.xbrl.org/2003/role/presentationRef
-Publisher SEC
-Name Exchange Act
-Number 240
-Section 12
-Subsection b-2
| Name: |
dei_EntityFilerCategory |
| Namespace Prefix: |
dei_ |
| Data Type: |
dei:filerCategoryItemType |
| Balance Type: |
na |
| Period Type: |
duration |
|
| X |
- DefinitionTwo-character EDGAR code representing the state or country of incorporation.
| Name: |
dei_EntityIncorporationStateCountryCode |
| Namespace Prefix: |
dei_ |
| Data Type: |
dei:edgarStateCountryItemType |
| Balance Type: |
na |
| Period Type: |
duration |
|
| X |
- DefinitionBoolean flag that is true when the registrant has submitted electronically every Interactive Data File required to be submitted pursuant to Rule 405 of Regulation S-T during the preceding 12 months (or for such shorter period that the registrant was required to submit such files). Reference 1: http://www.xbrl.org/2003/role/presentationRef
-Publisher SEC
-Name Regulation S-T
-Number 232
-Section 405
| Name: |
dei_EntityInteractiveDataCurrent |
| Namespace Prefix: |
dei_ |
| Data Type: |
dei:yesNoItemType |
| Balance Type: |
na |
| Period Type: |
duration |
|
| X |
- DefinitionThe exact name of the entity filing the report as specified in its charter, which is required by forms filed with the SEC. Reference 1: http://www.xbrl.org/2003/role/presentationRef
-Publisher SEC
-Name Exchange Act
-Number 240
-Section 12
-Subsection b-2
| Name: |
dei_EntityRegistrantName |
| Namespace Prefix: |
dei_ |
| Data Type: |
xbrli:normalizedStringItemType |
| Balance Type: |
na |
| Period Type: |
duration |
|
| X |
- DefinitionBoolean flag that is true when the registrant is a shell company as defined in Rule 12b-2 of the Exchange Act. Reference 1: http://www.xbrl.org/2003/role/presentationRef
-Publisher SEC
-Name Exchange Act
-Number 240
-Section 12
-Subsection b-2
| Name: |
dei_EntityShellCompany |
| Namespace Prefix: |
dei_ |
| Data Type: |
xbrli:booleanItemType |
| Balance Type: |
na |
| Period Type: |
duration |
|
| X |
- DefinitionIndicates that the company is a Smaller Reporting Company (SRC). Reference 1: http://www.xbrl.org/2003/role/presentationRef
-Publisher SEC
-Name Exchange Act
-Number 240
-Section 12
-Subsection b-2
| Name: |
dei_EntitySmallBusiness |
| Namespace Prefix: |
dei_ |
| Data Type: |
xbrli:booleanItemType |
| Balance Type: |
na |
| Period Type: |
duration |
|
| X |
- DefinitionThe Tax Identification Number (TIN), also known as an Employer Identification Number (EIN), is a unique 9-digit value assigned by the IRS. Reference 1: http://www.xbrl.org/2003/role/presentationRef
-Publisher SEC
-Name Exchange Act
-Number 240
-Section 12
-Subsection b-2
| Name: |
dei_EntityTaxIdentificationNumber |
| Namespace Prefix: |
dei_ |
| Data Type: |
dei:employerIdItemType |
| Balance Type: |
na |
| Period Type: |
duration |
|
| X |
- DefinitionLocal phone number for entity.
| Name: |
dei_LocalPhoneNumber |
| Namespace Prefix: |
dei_ |
| Data Type: |
xbrli:normalizedStringItemType |
| Balance Type: |
na |
| Period Type: |
duration |
|
| X |
- DefinitionTitle of a 12(b) registered security. Reference 1: http://www.xbrl.org/2003/role/presentationRef
-Publisher SEC
-Name Exchange Act
-Number 240
-Section 12
-Subsection b
| Name: |
dei_Security12bTitle |
| Namespace Prefix: |
dei_ |
| Data Type: |
dei:securityTitleItemType |
| Balance Type: |
na |
| Period Type: |
duration |
|
| X |
- DefinitionName of the Exchange on which a security is registered. Reference 1: http://www.xbrl.org/2003/role/presentationRef
-Publisher SEC
-Name Exchange Act
-Number 240
-Section 12
-Subsection d1-1
| Name: |
dei_SecurityExchangeName |
| Namespace Prefix: |
dei_ |
| Data Type: |
dei:edgarExchangeCodeItemType |
| Balance Type: |
na |
| Period Type: |
duration |
|
| X |
- DefinitionTrading symbol of an instrument as listed on an exchange.
| Name: |
dei_TradingSymbol |
| Namespace Prefix: |
dei_ |
| Data Type: |
dei:tradingSymbolItemType |
| Balance Type: |
na |
| Period Type: |
duration |
|
v3.24.3
Consolidated Balance Sheets - USD ($)
$ in Thousands |
Sep. 30, 2024 |
Dec. 31, 2023 |
| Current assets: |
|
|
| Cash and cash equivalents |
$ 2,724
|
$ 9,660
|
| Restricted Cash |
3,864
|
3,795
|
| Accounts and other receivables, net |
81,636
|
67,938
|
| Income taxes recoverable |
954
|
1,182
|
| Inventories |
88,058
|
82,037
|
| Prepaid expenses and other |
11,026
|
12,065
|
| Total current assets |
188,262
|
176,677
|
| Property, plant and equipment, at cost |
541,608
|
541,046
|
| Less: accumulated depreciation |
(372,920)
|
(357,591)
|
| Net property, plant and equipment |
168,688
|
183,455
|
| Right-of-use leased assets |
15,663
|
11,848
|
| Identifiable intangible assets, net |
8,361
|
9,851
|
| Goodwill |
35,717
|
35,717
|
| Deferred Income Tax Assets, Net |
22,765
|
25,034
|
| Other assets |
3,085
|
3,879
|
| Total assets |
442,541
|
446,461
|
| Current liabilities: |
|
|
| Accounts payable |
89,070
|
95,023
|
| Accrued expenses |
24,000
|
24,442
|
| Lease liability, short-term |
2,824
|
2,107
|
| Short-Term Debt |
1,356
|
0
|
| ABL revolving facility (matures June 30, 2026) |
122,000
|
126,322
|
| Income taxes payable |
8
|
1,210
|
| Total current liabilities |
239,258
|
249,104
|
| Lease liability, long-term |
13,963
|
10,942
|
| Long-term debt |
20,000
|
20,000
|
| Pension and other postretirement benefit obligations, net |
6,464
|
6,643
|
| Other non-current liabilities |
4,408
|
4,119
|
| Total liabilities |
284,093
|
290,808
|
| Shareholders’ equity: |
|
|
| Common stock, no par value (authorized shares 150,000,000, issued and outstanding 34,510,556 shares at September 30, 2024 and 34,408,638 shares at December 31, 2023) |
63,031
|
61,606
|
| Common stock held in trust for savings restoration plan (118,543 shares at September 30, 2024 and December 31, 2023) |
(2,233)
|
(2,233)
|
| Foreign currency translation adjustment |
(88,777)
|
(83,037)
|
| Gain (loss) on derivative financial instruments |
(141)
|
801
|
| Pension and other postretirement benefit adjustments |
457
|
539
|
| Retained earnings |
186,111
|
177,977
|
| Total shareholders’ equity |
158,448
|
155,653
|
| Total liabilities and shareholders’ equity |
$ 442,541
|
$ 446,461
|
| X |
- DefinitionCarrying value as of the balance sheet date of liabilities incurred (and for which invoices have typically been received) and payable to vendors for goods and services received that are used in an entity's business. Used to reflect the current portion of the liabilities (due within one year or within the normal operating cycle if longer). Reference 1: http://fasb.org/us-gaap/role/ref/legacyRef
-Topic 210
-SubTopic 10
-Name Accounting Standards Codification
-Section S99
-Paragraph 1
-Subparagraph (SX 210.5-02(19)(a))
-Publisher FASB
-URI https://asc.fasb.org/1943274/2147480566/210-10-S99-1
Reference 2: http://www.xbrl.org/2003/role/exampleRef
-Topic 852
-SubTopic 10
-Name Accounting Standards Codification
-Section 55
-Paragraph 10
-Publisher FASB
-URI https://asc.fasb.org/1943274/2147481372/852-10-55-10
| Name: |
us-gaap_AccountsPayableCurrent |
| Namespace Prefix: |
us-gaap_ |
| Data Type: |
xbrli:monetaryItemType |
| Balance Type: |
credit |
| Period Type: |
instant |
|
| X |
- DefinitionAmount, after allowance for credit loss, of right to consideration from customer for product sold and service rendered in normal course of business. Reference 1: http://www.xbrl.org/2003/role/exampleRef
-Topic 946
-SubTopic 310
-Name Accounting Standards Codification
-Section 45
-Paragraph 1
-Subparagraph (d)
-Publisher FASB
-URI https://asc.fasb.org/1943274/2147477802/946-310-45-1
Reference 2: http://www.xbrl.org/2009/role/commonPracticeRef
-Topic 944
-SubTopic 210
-Name Accounting Standards Codification
-Section S99
-Paragraph 1
-Subparagraph (SX 210.7-03(a)(5))
-Publisher FASB
-URI https://asc.fasb.org/1943274/2147478777/944-210-S99-1
Reference 3: http://www.xbrl.org/2003/role/disclosureRef
-Topic 946
-SubTopic 210
-Name Accounting Standards Codification
-Section S99
-Paragraph 1
-Subparagraph (SX 210.6-04(5)(b))
-Publisher FASB
-URI https://asc.fasb.org/1943274/2147479170/946-210-S99-1
Reference 4: http://www.xbrl.org/2003/role/disclosureRef
-Topic 954
-SubTopic 310
-Name Accounting Standards Codification
-Section 45
-Paragraph 1
-Publisher FASB
-URI https://asc.fasb.org/1943274/2147479196/954-310-45-1
Reference 5: http://www.xbrl.org/2009/role/commonPracticeRef
-Topic 944
-SubTopic 210
-Name Accounting Standards Codification
-Section S99
-Paragraph 1
-Subparagraph (SX 210.7-03(a)(3))
-Publisher FASB
-URI https://asc.fasb.org/1943274/2147478777/944-210-S99-1
| Name: |
us-gaap_AccountsReceivableNet |
| Namespace Prefix: |
us-gaap_ |
| Data Type: |
xbrli:monetaryItemType |
| Balance Type: |
debit |
| Period Type: |
instant |
|
| X |
- DefinitionCarrying value as of the balance sheet date of obligations incurred and payable, pertaining to costs that are statutory in nature, are incurred on contractual obligations, or accumulate over time and for which invoices have not yet been received or will not be rendered. Examples include taxes, interest, rent and utilities. Used to reflect the current portion of the liabilities (due within one year or within the normal operating cycle if longer). Reference 1: http://fasb.org/us-gaap/role/ref/legacyRef
-Topic 210
-SubTopic 10
-Name Accounting Standards Codification
-Section S99
-Paragraph 1
-Subparagraph (SX 210.5-02(20))
-Publisher FASB
-URI https://asc.fasb.org/1943274/2147480566/210-10-S99-1
| Name: |
us-gaap_AccruedLiabilitiesCurrent |
| Namespace Prefix: |
us-gaap_ |
| Data Type: |
xbrli:monetaryItemType |
| Balance Type: |
credit |
| Period Type: |
instant |
|
| X |
- DefinitionAmount of accumulated depreciation, depletion and amortization for physical assets used in the normal conduct of business to produce goods and services. Reference 1: http://www.xbrl.org/2003/role/disclosureRef
-Topic 944
-SubTopic 210
-Name Accounting Standards Codification
-Section S99
-Paragraph 1
-Subparagraph (SX 210.7-03(a)(8)(b))
-Publisher FASB
-URI https://asc.fasb.org/1943274/2147478777/944-210-S99-1
Reference 2: http://www.xbrl.org/2003/role/disclosureRef
-Topic 210
-SubTopic 10
-Name Accounting Standards Codification
-Section S99
-Paragraph 1
-Subparagraph (SX 210.5-02(14))
-Publisher FASB
-URI https://asc.fasb.org/1943274/2147480566/210-10-S99-1
Reference 3: http://fasb.org/us-gaap/role/ref/legacyRef
-Name Accounting Standards Codification
-Topic 360
-SubTopic 10
-Section 50
-Paragraph 1
-Subparagraph (c)
-Publisher FASB
-URI https://asc.fasb.org/1943274/2147482099/360-10-50-1
| Name: |
us-gaap_AccumulatedDepreciationDepletionAndAmortizationPropertyPlantAndEquipment |
| Namespace Prefix: |
us-gaap_ |
| Data Type: |
xbrli:monetaryItemType |
| Balance Type: |
credit |
| Period Type: |
instant |
|
| X |
- DefinitionAmount, after tax, of accumulated other comprehensive (income) loss for defined benefit plan, that has not been recognized in net periodic benefit cost (credit). Reference 1: http://fasb.org/us-gaap/role/ref/legacyRef
-Name Accounting Standards Codification
-Topic 220
-SubTopic 10
-Section 45
-Paragraph 14A
-Publisher FASB
-URI https://asc.fasb.org/1943274/2147482790/220-10-45-14A
Reference 2: http://fasb.org/us-gaap/role/ref/legacyRef
-Name Accounting Standards Codification
-Section 45
-Paragraph 10A
-Subparagraph (j)
-SubTopic 10
-Topic 220
-Publisher FASB
-URI https://asc.fasb.org/1943274/2147482790/220-10-45-10A
Reference 3: http://fasb.org/us-gaap/role/ref/legacyRef
-Name Accounting Standards Codification
-Section 45
-Paragraph 10A
-Subparagraph (k)
-SubTopic 10
-Topic 220
-Publisher FASB
-URI https://asc.fasb.org/1943274/2147482790/220-10-45-10A
Reference 4: http://fasb.org/us-gaap/role/ref/legacyRef
-Topic 220
-SubTopic 10
-Name Accounting Standards Codification
-Section 45
-Paragraph 10A
-Subparagraph (i)
-Publisher FASB
-URI https://asc.fasb.org/1943274/2147482790/220-10-45-10A
Reference 5: http://www.xbrl.org/2009/role/commonPracticeRef
-Topic 715
-SubTopic 20
-Name Accounting Standards Codification
-Section 50
-Paragraph 1
-Subparagraph (j)
-Publisher FASB
-URI https://asc.fasb.org/1943274/2147480506/715-20-50-1
| Name: |
us-gaap_AccumulatedOtherComprehensiveIncomeLossDefinedBenefitPensionAndOtherPostretirementPlansNetOfTax |
| Namespace Prefix: |
us-gaap_ |
| Data Type: |
xbrli:monetaryItemType |
| Balance Type: |
debit |
| Period Type: |
instant |
|
| X |
- DefinitionAccumulated adjustment, net of tax, that results from the process of translating subsidiary financial statements and foreign equity investments into the reporting currency from the functional currency of the reporting entity, net of reclassification of realized foreign currency translation gains or losses. Reference 1: http://www.xbrl.org/2003/role/disclosureRef
-Topic 220
-SubTopic 10
-Name Accounting Standards Codification
-Section 45
-Paragraph 11
-Publisher FASB
-URI https://asc.fasb.org/1943274/2147482790/220-10-45-11
Reference 2: http://www.xbrl.org/2003/role/disclosureRef
-Topic 220
-SubTopic 10
-Name Accounting Standards Codification
-Section 45
-Paragraph 14A
-Publisher FASB
-URI https://asc.fasb.org/1943274/2147482790/220-10-45-14A
Reference 3: http://www.xbrl.org/2003/role/disclosureRef
-Topic 825
-SubTopic 10
-Name Accounting Standards Codification
-Section 45
-Paragraph 5A
-Publisher FASB
-URI https://asc.fasb.org/1943274/2147482736/825-10-45-5A
Reference 4: http://www.xbrl.org/2003/role/disclosureRef
-Topic 220
-SubTopic 10
-Name Accounting Standards Codification
-Section 45
-Paragraph 10A
-Subparagraph (a)
-Publisher FASB
-URI https://asc.fasb.org/1943274/2147482790/220-10-45-10A
Reference 5: http://www.xbrl.org/2003/role/disclosureRef
-Topic 220
-SubTopic 10
-Name Accounting Standards Codification
-Section 45
-Paragraph 14
-Publisher FASB
-URI https://asc.fasb.org/1943274/2147482790/220-10-45-14
| Name: |
us-gaap_AccumulatedOtherComprehensiveIncomeLossForeignCurrencyTranslationAdjustmentNetOfTax |
| Namespace Prefix: |
us-gaap_ |
| Data Type: |
xbrli:monetaryItemType |
| Balance Type: |
credit |
| Period Type: |
instant |
|
| X |
- DefinitionAmount, after tax, of accumulated gain (loss) on derivative instrument designated and qualifying as cash flow hedge included in assessment of hedge effectiveness. Reference 1: http://www.xbrl.org/2003/role/disclosureRef
-Topic 220
-SubTopic 10
-Name Accounting Standards Codification
-Section 45
-Paragraph 11
-Publisher FASB
-URI https://asc.fasb.org/1943274/2147482790/220-10-45-11
| Name: |
us-gaap_AociLossCashFlowHedgeCumulativeGainLossAfterTax |
| Namespace Prefix: |
us-gaap_ |
| Data Type: |
xbrli:monetaryItemType |
| Balance Type: |
credit |
| Period Type: |
instant |
|
| X |
- DefinitionAmount of asset recognized for present right to economic benefit. Reference 1: http://www.xbrl.org/2003/role/exampleRef
-Topic 280
-SubTopic 10
-Name Accounting Standards Codification
-Section 55
-Paragraph 48
-Publisher FASB
-URI https://asc.fasb.org/1943274/2147482785/280-10-55-48
Reference 2: http://www.xbrl.org/2003/role/exampleRef
-Topic 280
-SubTopic 10
-Name Accounting Standards Codification
-Section 55
-Paragraph 49
-Publisher FASB
-URI https://asc.fasb.org/1943274/2147482785/280-10-55-49
Reference 3: http://www.xbrl.org/2003/role/disclosureRef
-Topic 270
-SubTopic 10
-Name Accounting Standards Codification
-Section 50
-Paragraph 1
-Subparagraph (i)
-Publisher FASB
-URI https://asc.fasb.org/1943274/2147482964/270-10-50-1
Reference 4: http://www.xbrl.org/2003/role/disclosureRef
-Topic 280
-SubTopic 10
-Name Accounting Standards Codification
-Section 50
-Paragraph 32
-Subparagraph (ee)
-Publisher FASB
-URI https://asc.fasb.org/1943274/2147482810/280-10-50-32
Reference 5: http://fasb.org/us-gaap/role/ref/otherTransitionRef
-Topic 280
-SubTopic 10
-Name Accounting Standards Codification
-Section 50
-Paragraph 32
-Subparagraph (d)
-Publisher FASB
-URI https://asc.fasb.org/1943274/2147482810/280-10-50-32
Reference 6: http://www.xbrl.org/2003/role/disclosureRef
-Topic 280
-SubTopic 10
-Name Accounting Standards Codification
-Section 50
-Paragraph 22
-Publisher FASB
-URI https://asc.fasb.org/1943274/2147482810/280-10-50-22
Reference 7: http://www.xbrl.org/2003/role/disclosureRef
-Topic 810
-SubTopic 10
-Name Accounting Standards Codification
-Section 50
-Paragraph 3
-Subparagraph (bb)
-Publisher FASB
-URI https://asc.fasb.org/1943274/2147481203/810-10-50-3
Reference 8: http://www.xbrl.org/2003/role/disclosureRef
-Topic 810
-SubTopic 10
-Name Accounting Standards Codification
-Section 45
-Paragraph 25
-Subparagraph (a)
-Publisher FASB
-URI https://asc.fasb.org/1943274/2147481231/810-10-45-25
Reference 9: http://www.xbrl.org/2003/role/disclosureRef
-Topic 235
-SubTopic 10
-Name Accounting Standards Codification
-Section S99
-Paragraph 1
-Subparagraph (SX 210.4-08(g)(1)(ii))
-Publisher FASB
-URI https://asc.fasb.org/1943274/2147480678/235-10-S99-1
Reference 10: http://www.xbrl.org/2003/role/disclosureRef
-Topic 323
-SubTopic 10
-Name Accounting Standards Codification
-Section 50
-Paragraph 3
-Subparagraph (c)
-Publisher FASB
-URI https://asc.fasb.org/1943274/2147481687/323-10-50-3
Reference 11: http://www.xbrl.org/2003/role/disclosureRef
-Topic 825
-SubTopic 10
-Name Accounting Standards Codification
-Section 50
-Paragraph 28
-Subparagraph (f)
-Publisher FASB
-URI https://asc.fasb.org/1943274/2147482907/825-10-50-28
Reference 12: http://www.xbrl.org/2003/role/exampleRef
-Topic 852
-SubTopic 10
-Name Accounting Standards Codification
-Section 55
-Paragraph 10
-Publisher FASB
-URI https://asc.fasb.org/1943274/2147481372/852-10-55-10
Reference 13: http://www.xbrl.org/2003/role/exampleRef
-Topic 946
-SubTopic 830
-Name Accounting Standards Codification
-Section 55
-Paragraph 12
-Publisher FASB
-URI https://asc.fasb.org/1943274/2147479168/946-830-55-12
Reference 14: http://www.xbrl.org/2003/role/disclosureRef
-Topic 944
-SubTopic 210
-Name Accounting Standards Codification
-Section S99
-Paragraph 1
-Subparagraph (SX 210.7-03(a)(12))
-Publisher FASB
-URI https://asc.fasb.org/1943274/2147478777/944-210-S99-1
Reference 15: http://www.xbrl.org/2003/role/disclosureRef
-Topic 946
-SubTopic 210
-Name Accounting Standards Codification
-Section S99
-Paragraph 1
-Subparagraph (SX 210.6-04(8))
-Publisher FASB
-URI https://asc.fasb.org/1943274/2147479170/946-210-S99-1
Reference 16: http://www.xbrl.org/2003/role/disclosureRef
-Topic 210
-SubTopic 10
-Name Accounting Standards Codification
-Section S99
-Paragraph 1
-Subparagraph (SX 210.5-02(18))
-Publisher FASB
-URI https://asc.fasb.org/1943274/2147480566/210-10-S99-1
Reference 17: http://www.xbrl.org/2003/role/disclosureRef
-Topic 470
-SubTopic 10
-Name Accounting Standards Codification
-Section S99
-Paragraph 1A
-Subparagraph (SX 210.13-01(a)(4)(i))
-Publisher FASB
-URI https://asc.fasb.org/1943274/2147480097/470-10-S99-1A
Reference 18: http://www.xbrl.org/2009/role/commonPracticeRef
-Topic 470
-SubTopic 10
-Name Accounting Standards Codification
-Section S99
-Paragraph 1A
-Subparagraph (SX 210.13-01(a)(4)(ii))
-Publisher FASB
-URI https://asc.fasb.org/1943274/2147480097/470-10-S99-1A
Reference 19: http://www.xbrl.org/2009/role/commonPracticeRef
-Topic 470
-SubTopic 10
-Name Accounting Standards Codification
-Section S99
-Paragraph 1A
-Subparagraph (SX 210.13-01(a)(4)(iii))
-Publisher FASB
-URI https://asc.fasb.org/1943274/2147480097/470-10-S99-1A
Reference 20: http://www.xbrl.org/2003/role/disclosureRef
-Topic 470
-SubTopic 10
-Name Accounting Standards Codification
-Section S99
-Paragraph 1A
-Subparagraph (SX 210.13-01(a)(4)(iii)(A))
-Publisher FASB
-URI https://asc.fasb.org/1943274/2147480097/470-10-S99-1A
Reference 21: http://www.xbrl.org/2003/role/disclosureRef
-Topic 470
-SubTopic 10
-Name Accounting Standards Codification
-Section S99
-Paragraph 1A
-Subparagraph (SX 210.13-01(a)(4)(iv))
-Publisher FASB
-URI https://asc.fasb.org/1943274/2147480097/470-10-S99-1A
Reference 22: http://www.xbrl.org/2003/role/disclosureRef
-Topic 470
-SubTopic 10
-Name Accounting Standards Codification
-Section S99
-Paragraph 1A
-Subparagraph (SX 210.13-01(a)(5))
-Publisher FASB
-URI https://asc.fasb.org/1943274/2147480097/470-10-S99-1A
Reference 23: http://www.xbrl.org/2003/role/disclosureRef
-Topic 470
-SubTopic 10
-Name Accounting Standards Codification
-Section S99
-Paragraph 1B
-Subparagraph (SX 210.13-02(a)(4)(i))
-Publisher FASB
-URI https://asc.fasb.org/1943274/2147480097/470-10-S99-1B
Reference 24: http://www.xbrl.org/2003/role/disclosureRef
-Topic 470
-SubTopic 10
-Name Accounting Standards Codification
-Section S99
-Paragraph 1B
-Subparagraph (SX 210.13-02(a)(4)(iii)(A))
-Publisher FASB
-URI https://asc.fasb.org/1943274/2147480097/470-10-S99-1B
Reference 25: http://www.xbrl.org/2003/role/disclosureRef
-Topic 470
-SubTopic 10
-Name Accounting Standards Codification
-Section S99
-Paragraph 1B
-Subparagraph (SX 210.13-02(a)(4)(iii)(B))
-Publisher FASB
-URI https://asc.fasb.org/1943274/2147480097/470-10-S99-1B
Reference 26: http://www.xbrl.org/2003/role/disclosureRef
-Topic 470
-SubTopic 10
-Name Accounting Standards Codification
-Section S99
-Paragraph 1B
-Subparagraph (SX 210.13-02(a)(4)(iv))
-Publisher FASB
-URI https://asc.fasb.org/1943274/2147480097/470-10-S99-1B
Reference 27: http://www.xbrl.org/2003/role/disclosureRef
-Topic 470
-SubTopic 10
-Name Accounting Standards Codification
-Section S99
-Paragraph 1B
-Subparagraph (SX 210.13-02(a)(5))
-Publisher FASB
-URI https://asc.fasb.org/1943274/2147480097/470-10-S99-1B
Reference 28: http://www.xbrl.org/2009/role/commonPracticeRef
-Topic 852
-SubTopic 10
-Name Accounting Standards Codification
-Section 50
-Paragraph 7
-Subparagraph (a)
-Publisher FASB
-URI https://asc.fasb.org/1943274/2147481404/852-10-50-7
Reference 29: http://www.xbrl.org/2003/role/disclosureRef
-Topic 280
-SubTopic 10
-Name Accounting Standards Codification
-Section 50
-Paragraph 30
-Subparagraph (c)
-Publisher FASB
-URI https://asc.fasb.org/1943274/2147482810/280-10-50-30
Reference 30: http://fasb.org/us-gaap/role/ref/legacyRef
-Topic 942
-SubTopic 210
-Name Accounting Standards Codification
-Section S99
-Paragraph 1
-Subparagraph (SX 210.9-03(11))
-Publisher FASB
-URI https://asc.fasb.org/1943274/2147478546/942-210-S99-1
| Name: |
us-gaap_Assets |
| Namespace Prefix: |
us-gaap_ |
| Data Type: |
xbrli:monetaryItemType |
| Balance Type: |
debit |
| Period Type: |
instant |
|
| X |
- DefinitionAmount of asset recognized for present right to economic benefit, classified as current. Reference 1: http://www.xbrl.org/2003/role/disclosureRef
-Topic 810
-SubTopic 10
-Name Accounting Standards Codification
-Section 50
-Paragraph 3
-Subparagraph (bb)
-Publisher FASB
-URI https://asc.fasb.org/1943274/2147481203/810-10-50-3
Reference 2: http://www.xbrl.org/2003/role/disclosureRef
-Topic 810
-SubTopic 10
-Name Accounting Standards Codification
-Section 45
-Paragraph 25
-Subparagraph (a)
-Publisher FASB
-URI https://asc.fasb.org/1943274/2147481231/810-10-45-25
Reference 3: http://www.xbrl.org/2003/role/disclosureRef
-Topic 235
-SubTopic 10
-Name Accounting Standards Codification
-Section S99
-Paragraph 1
-Subparagraph (SX 210.4-08(g)(1)(ii))
-Publisher FASB
-URI https://asc.fasb.org/1943274/2147480678/235-10-S99-1
Reference 4: http://www.xbrl.org/2003/role/disclosureRef
-Topic 323
-SubTopic 10
-Name Accounting Standards Codification
-Section 50
-Paragraph 3
-Subparagraph (c)
-Publisher FASB
-URI https://asc.fasb.org/1943274/2147481687/323-10-50-3
Reference 5: http://www.xbrl.org/2003/role/disclosureRef
-Topic 825
-SubTopic 10
-Name Accounting Standards Codification
-Section 50
-Paragraph 28
-Subparagraph (f)
-Publisher FASB
-URI https://asc.fasb.org/1943274/2147482907/825-10-50-28
Reference 6: http://www.xbrl.org/2003/role/exampleRef
-Topic 852
-SubTopic 10
-Name Accounting Standards Codification
-Section 55
-Paragraph 10
-Publisher FASB
-URI https://asc.fasb.org/1943274/2147481372/852-10-55-10
Reference 7: http://www.xbrl.org/2003/role/disclosureRef
-Topic 210
-SubTopic 10
-Name Accounting Standards Codification
-Section 45
-Paragraph 1
-Publisher FASB
-URI https://asc.fasb.org/1943274/2147483467/210-10-45-1
Reference 8: http://www.xbrl.org/2003/role/disclosureRef
-Topic 210
-SubTopic 10
-Name Accounting Standards Codification
-Section S99
-Paragraph 1
-Subparagraph (SX 210.5-02(9))
-Publisher FASB
-URI https://asc.fasb.org/1943274/2147480566/210-10-S99-1
Reference 9: http://www.xbrl.org/2003/role/disclosureRef
-Topic 470
-SubTopic 10
-Name Accounting Standards Codification
-Section S99
-Paragraph 1A
-Subparagraph (SX 210.13-01(a)(4)(i))
-Publisher FASB
-URI https://asc.fasb.org/1943274/2147480097/470-10-S99-1A
Reference 10: http://www.xbrl.org/2009/role/commonPracticeRef
-Topic 470
-SubTopic 10
-Name Accounting Standards Codification
-Section S99
-Paragraph 1A
-Subparagraph (SX 210.13-01(a)(4)(ii))
-Publisher FASB
-URI https://asc.fasb.org/1943274/2147480097/470-10-S99-1A
Reference 11: http://www.xbrl.org/2009/role/commonPracticeRef
-Topic 470
-SubTopic 10
-Name Accounting Standards Codification
-Section S99
-Paragraph 1A
-Subparagraph (SX 210.13-01(a)(4)(iii))
-Publisher FASB
-URI https://asc.fasb.org/1943274/2147480097/470-10-S99-1A
Reference 12: http://www.xbrl.org/2003/role/disclosureRef
-Topic 470
-SubTopic 10
-Name Accounting Standards Codification
-Section S99
-Paragraph 1A
-Subparagraph (SX 210.13-01(a)(4)(iii)(A))
-Publisher FASB
-URI https://asc.fasb.org/1943274/2147480097/470-10-S99-1A
Reference 13: http://www.xbrl.org/2003/role/disclosureRef
-Topic 470
-SubTopic 10
-Name Accounting Standards Codification
-Section S99
-Paragraph 1A
-Subparagraph (SX 210.13-01(a)(4)(iv))
-Publisher FASB
-URI https://asc.fasb.org/1943274/2147480097/470-10-S99-1A
Reference 14: http://www.xbrl.org/2003/role/disclosureRef
-Topic 470
-SubTopic 10
-Name Accounting Standards Codification
-Section S99
-Paragraph 1A
-Subparagraph (SX 210.13-01(a)(5))
-Publisher FASB
-URI https://asc.fasb.org/1943274/2147480097/470-10-S99-1A
Reference 15: http://www.xbrl.org/2003/role/disclosureRef
-Topic 470
-SubTopic 10
-Name Accounting Standards Codification
-Section S99
-Paragraph 1B
-Subparagraph (SX 210.13-02(a)(4)(i))
-Publisher FASB
-URI https://asc.fasb.org/1943274/2147480097/470-10-S99-1B
Reference 16: http://www.xbrl.org/2003/role/disclosureRef
-Topic 470
-SubTopic 10
-Name Accounting Standards Codification
-Section S99
-Paragraph 1B
-Subparagraph (SX 210.13-02(a)(4)(iii)(A))
-Publisher FASB
-URI https://asc.fasb.org/1943274/2147480097/470-10-S99-1B
Reference 17: http://www.xbrl.org/2003/role/disclosureRef
-Topic 470
-SubTopic 10
-Name Accounting Standards Codification
-Section S99
-Paragraph 1B
-Subparagraph (SX 210.13-02(a)(4)(iii)(B))
-Publisher FASB
-URI https://asc.fasb.org/1943274/2147480097/470-10-S99-1B
Reference 18: http://www.xbrl.org/2003/role/disclosureRef
-Topic 470
-SubTopic 10
-Name Accounting Standards Codification
-Section S99
-Paragraph 1B
-Subparagraph (SX 210.13-02(a)(4)(iv))
-Publisher FASB
-URI https://asc.fasb.org/1943274/2147480097/470-10-S99-1B
Reference 19: http://www.xbrl.org/2003/role/disclosureRef
-Topic 470
-SubTopic 10
-Name Accounting Standards Codification
-Section S99
-Paragraph 1B
-Subparagraph (SX 210.13-02(a)(5))
-Publisher FASB
-URI https://asc.fasb.org/1943274/2147480097/470-10-S99-1B
Reference 20: http://www.xbrl.org/2009/role/commonPracticeRef
-Topic 852
-SubTopic 10
-Name Accounting Standards Codification
-Section 50
-Paragraph 7
-Subparagraph (a)
-Publisher FASB
-URI https://asc.fasb.org/1943274/2147481404/852-10-50-7
| Name: |
us-gaap_AssetsCurrent |
| Namespace Prefix: |
us-gaap_ |
| Data Type: |
xbrli:monetaryItemType |
| Balance Type: |
debit |
| Period Type: |
instant |
|
| X |
- References
+ Details
| Name: |
us-gaap_AssetsCurrentAbstract |
| Namespace Prefix: |
us-gaap_ |
| Data Type: |
xbrli:stringItemType |
| Balance Type: |
na |
| Period Type: |
duration |
|
| X |
- DefinitionAmount of currency on hand as well as demand deposits with banks or financial institutions. Includes other kinds of accounts that have the general characteristics of demand deposits. Also includes short-term, highly liquid investments that are both readily convertible to known amounts of cash and so near their maturity that they present insignificant risk of changes in value because of changes in interest rates. Excludes cash and cash equivalents within disposal group and discontinued operation. Reference 1: http://www.xbrl.org/2003/role/disclosureRef
-Topic 210
-SubTopic 10
-Name Accounting Standards Codification
-Section S99
-Paragraph 1
-Subparagraph (SX 210.5-02(1))
-Publisher FASB
-URI https://asc.fasb.org/1943274/2147480566/210-10-S99-1
Reference 2: http://www.xbrl.org/2003/role/exampleRef
-Topic 210
-SubTopic 10
-Name Accounting Standards Codification
-Section 45
-Paragraph 1
-Subparagraph (a)
-Publisher FASB
-URI https://asc.fasb.org/1943274/2147483467/210-10-45-1
Reference 3: http://fasb.org/us-gaap/role/ref/legacyRef
-Name Accounting Standards Codification
-Topic 230
-SubTopic 10
-Section 45
-Paragraph 4
-Publisher FASB
-URI https://asc.fasb.org/1943274/2147482740/230-10-45-4
| Name: |
us-gaap_CashAndCashEquivalentsAtCarryingValue |
| Namespace Prefix: |
us-gaap_ |
| Data Type: |
xbrli:monetaryItemType |
| Balance Type: |
debit |
| Period Type: |
instant |
|
| X |
- DefinitionValue of common stock held in trust.
| Name: |
us-gaap_CommonStockHeldInTrust |
| Namespace Prefix: |
us-gaap_ |
| Data Type: |
xbrli:monetaryItemType |
| Balance Type: |
debit |
| Period Type: |
instant |
|
| X |
- DefinitionAggregate par or stated value of issued nonredeemable common stock (or common stock redeemable solely at the option of the issuer). This item includes treasury stock repurchased by the entity. Note: elements for number of nonredeemable common shares, par value and other disclosure concepts are in another section within stockholders' equity. Reference 1: http://fasb.org/us-gaap/role/ref/legacyRef
-Topic 210
-SubTopic 10
-Name Accounting Standards Codification
-Section S99
-Paragraph 1
-Subparagraph (SX 210.5-02(29))
-Publisher FASB
-URI https://asc.fasb.org/1943274/2147480566/210-10-S99-1
Reference 2: http://www.xbrl.org/2003/role/exampleRef
-Topic 852
-SubTopic 10
-Name Accounting Standards Codification
-Section 55
-Paragraph 10
-Publisher FASB
-URI https://asc.fasb.org/1943274/2147481372/852-10-55-10
Reference 3: http://www.xbrl.org/2003/role/disclosureRef
-Topic 944
-SubTopic 210
-Name Accounting Standards Codification
-Section S99
-Paragraph 1
-Subparagraph (SX 210.7-03(a)(22))
-Publisher FASB
-URI https://asc.fasb.org/1943274/2147478777/944-210-S99-1
| Name: |
us-gaap_CommonStockValue |
| Namespace Prefix: |
us-gaap_ |
| Data Type: |
xbrli:monetaryItemType |
| Balance Type: |
credit |
| Period Type: |
instant |
|
| X |
- DefinitionAmount, after accumulated impairment loss, of asset representing future economic benefit arising from other asset acquired in business combination or from joint venture formation or both, that is not individually identified and separately recognized. Reference 1: http://www.xbrl.org/2003/role/exampleRef
-Topic 280
-SubTopic 10
-Name Accounting Standards Codification
-Section 55
-Paragraph 49
-Publisher FASB
-URI https://asc.fasb.org/1943274/2147482785/280-10-55-49
Reference 2: http://www.xbrl.org/2003/role/exampleRef
-Topic 350
-SubTopic 20
-Name Accounting Standards Codification
-Section 55
-Paragraph 24
-Publisher FASB
-URI https://asc.fasb.org/1943274/2147482548/350-20-55-24
Reference 3: http://www.xbrl.org/2003/role/exampleRef
-Topic 820
-SubTopic 10
-Name Accounting Standards Codification
-Section 55
-Paragraph 100
-Subparagraph (d)
-Publisher FASB
-URI https://asc.fasb.org/1943274/2147482078/820-10-55-100
Reference 4: http://www.xbrl.org/2003/role/exampleRef
-Topic 852
-SubTopic 10
-Name Accounting Standards Codification
-Section 55
-Paragraph 10
-Publisher FASB
-URI https://asc.fasb.org/1943274/2147481372/852-10-55-10
Reference 5: http://www.xbrl.org/2003/role/disclosureRef
-Topic 210
-SubTopic 10
-Name Accounting Standards Codification
-Section S99
-Paragraph 1
-Subparagraph (SX 210.5-02(15))
-Publisher FASB
-URI https://asc.fasb.org/1943274/2147480566/210-10-S99-1
Reference 6: http://www.xbrl.org/2003/role/disclosureRef
-Topic 350
-SubTopic 20
-Name Accounting Standards Codification
-Section 45
-Paragraph 1
-Publisher FASB
-URI https://asc.fasb.org/1943274/2147482598/350-20-45-1
Reference 7: http://www.xbrl.org/2009/role/commonPracticeRef
-Topic 350
-SubTopic 20
-Name Accounting Standards Codification
-Section 50
-Paragraph 1
-Subparagraph (a)
-Publisher FASB
-URI https://asc.fasb.org/1943274/2147482573/350-20-50-1
Reference 8: http://www.xbrl.org/2009/role/commonPracticeRef
-Topic 350
-SubTopic 20
-Name Accounting Standards Codification
-Section 50
-Paragraph 1
-Subparagraph (h)
-Publisher FASB
-URI https://asc.fasb.org/1943274/2147482573/350-20-50-1
Reference 9: http://www.xbrl.org/2003/role/disclosureRef
-Topic 942
-SubTopic 210
-Name Accounting Standards Codification
-Section S99
-Paragraph 1
-Subparagraph (SX 210.9-03(10)(1))
-Publisher FASB
-URI https://asc.fasb.org/1943274/2147478546/942-210-S99-1
| Name: |
us-gaap_Goodwill |
| Namespace Prefix: |
us-gaap_ |
| Data Type: |
xbrli:monetaryItemType |
| Balance Type: |
debit |
| Period Type: |
instant |
|
| X |
- DefinitionSum of the carrying amounts of all intangible assets, excluding goodwill, as of the balance sheet date, net of accumulated amortization and impairment charges. Reference 1: http://www.xbrl.org/2009/role/commonPracticeRef
-Topic 350
-SubTopic 30
-Name Accounting Standards Codification
-Section 50
-Paragraph 2
-Subparagraph (a)(1)
-Publisher FASB
-URI https://asc.fasb.org/1943274/2147482665/350-30-50-2
Reference 2: http://www.xbrl.org/2009/role/commonPracticeRef
-Topic 350
-SubTopic 30
-Name Accounting Standards Codification
-Section 50
-Paragraph 2
-Subparagraph (b)
-Publisher FASB
-URI https://asc.fasb.org/1943274/2147482665/350-30-50-2
Reference 3: http://www.xbrl.org/2003/role/disclosureRef
-Topic 350
-SubTopic 30
-Name Accounting Standards Codification
-Section 45
-Paragraph 1
-Publisher FASB
-URI https://asc.fasb.org/1943274/2147482686/350-30-45-1
| Name: |
us-gaap_IntangibleAssetsNetExcludingGoodwill |
| Namespace Prefix: |
us-gaap_ |
| Data Type: |
xbrli:monetaryItemType |
| Balance Type: |
debit |
| Period Type: |
instant |
|
| X |
- DefinitionAmount after valuation and LIFO reserves of inventory expected to be sold, or consumed within one year or operating cycle, if longer. Reference 1: http://www.xbrl.org/2003/role/exampleRef
-Topic 852
-SubTopic 10
-Name Accounting Standards Codification
-Section 55
-Paragraph 10
-Publisher FASB
-URI https://asc.fasb.org/1943274/2147481372/852-10-55-10
Reference 2: http://www.xbrl.org/2003/role/exampleRef
-Topic 210
-SubTopic 10
-Name Accounting Standards Codification
-Section 45
-Paragraph 1
-Subparagraph (b)
-Publisher FASB
-URI https://asc.fasb.org/1943274/2147483467/210-10-45-1
Reference 3: http://www.xbrl.org/2003/role/disclosureRef
-Topic 210
-SubTopic 10
-Name Accounting Standards Codification
-Section S99
-Paragraph 1
-Subparagraph (SX 210.5-02(6))
-Publisher FASB
-URI https://asc.fasb.org/1943274/2147480566/210-10-S99-1
| Name: |
us-gaap_InventoryNet |
| Namespace Prefix: |
us-gaap_ |
| Data Type: |
xbrli:monetaryItemType |
| Balance Type: |
debit |
| Period Type: |
instant |
|
| X |
- DefinitionAmount of liability recognized for present obligation requiring transfer or otherwise providing economic benefit to others. Reference 1: http://fasb.org/us-gaap/role/ref/legacyRef
-Name Accounting Standards Codification
-Section S99
-Paragraph 1
-Subparagraph (SX 210.5-02(22))
-SubTopic 10
-Topic 210
-Publisher FASB
-URI https://asc.fasb.org/1943274/2147480566/210-10-S99-1
Reference 2: http://fasb.org/us-gaap/role/ref/legacyRef
-Topic 210
-SubTopic 10
-Name Accounting Standards Codification
-Section S99
-Paragraph 1
-Subparagraph (SX 210.5-02(20))
-Publisher FASB
-URI https://asc.fasb.org/1943274/2147480566/210-10-S99-1
Reference 3: http://fasb.org/us-gaap/role/ref/legacyRef
-Topic 210
-SubTopic 10
-Name Accounting Standards Codification
-Section S99
-Paragraph 1
-Subparagraph (SX 210.5-02(24))
-Publisher FASB
-URI https://asc.fasb.org/1943274/2147480566/210-10-S99-1
Reference 4: http://fasb.org/us-gaap/role/ref/legacyRef
-Topic 210
-SubTopic 10
-Name Accounting Standards Codification
-Section S99
-Paragraph 1
-Subparagraph (SX 210.5-02(19))
-Publisher FASB
-URI https://asc.fasb.org/1943274/2147480566/210-10-S99-1
Reference 5: http://fasb.org/us-gaap/role/ref/legacyRef
-Topic 210
-SubTopic 10
-Name Accounting Standards Codification
-Section S99
-Paragraph 1
-Subparagraph (SX 210.5-02(25))
-Publisher FASB
-URI https://asc.fasb.org/1943274/2147480566/210-10-S99-1
Reference 6: http://fasb.org/us-gaap/role/ref/legacyRef
-Topic 210
-SubTopic 10
-Name Accounting Standards Codification
-Section S99
-Paragraph 1
-Subparagraph (SX 210.5-02(26))
-Publisher FASB
-URI https://asc.fasb.org/1943274/2147480566/210-10-S99-1
Reference 7: http://fasb.org/us-gaap/role/ref/legacyRef
-Topic 210
-SubTopic 10
-Name Accounting Standards Codification
-Section S99
-Paragraph 1
-Subparagraph (SX 210.5-02(23))
-Publisher FASB
-URI https://asc.fasb.org/1943274/2147480566/210-10-S99-1
Reference 8: http://fasb.org/us-gaap/role/ref/legacyRef
-Topic 210
-SubTopic 10
-Name Accounting Standards Codification
-Section S99
-Paragraph 1
-Subparagraph (SX 210.5-02(21))
-Publisher FASB
-URI https://asc.fasb.org/1943274/2147480566/210-10-S99-1
Reference 9: http://www.xbrl.org/2003/role/disclosureRef
-Topic 810
-SubTopic 10
-Name Accounting Standards Codification
-Section 50
-Paragraph 3
-Subparagraph (c)
-Publisher FASB
-URI https://asc.fasb.org/1943274/2147481203/810-10-50-3
Reference 10: http://www.xbrl.org/2003/role/disclosureRef
-Topic 810
-SubTopic 10
-Name Accounting Standards Codification
-Section 45
-Paragraph 25
-Subparagraph (b)
-Publisher FASB
-URI https://asc.fasb.org/1943274/2147481231/810-10-45-25
Reference 11: http://www.xbrl.org/2003/role/disclosureRef
-Topic 810
-SubTopic 10
-Name Accounting Standards Codification
-Section 50
-Paragraph 3
-Subparagraph (bb)
-Publisher FASB
-URI https://asc.fasb.org/1943274/2147481203/810-10-50-3
Reference 12: http://www.xbrl.org/2003/role/disclosureRef
-Topic 235
-SubTopic 10
-Name Accounting Standards Codification
-Section S99
-Paragraph 1
-Subparagraph (SX 210.4-08(g)(1)(ii))
-Publisher FASB
-URI https://asc.fasb.org/1943274/2147480678/235-10-S99-1
Reference 13: http://www.xbrl.org/2003/role/disclosureRef
-Topic 323
-SubTopic 10
-Name Accounting Standards Codification
-Section 50
-Paragraph 3
-Subparagraph (c)
-Publisher FASB
-URI https://asc.fasb.org/1943274/2147481687/323-10-50-3
Reference 14: http://www.xbrl.org/2003/role/disclosureRef
-Topic 825
-SubTopic 10
-Name Accounting Standards Codification
-Section 50
-Paragraph 28
-Subparagraph (f)
-Publisher FASB
-URI https://asc.fasb.org/1943274/2147482907/825-10-50-28
Reference 15: http://www.xbrl.org/2003/role/exampleRef
-Topic 946
-SubTopic 830
-Name Accounting Standards Codification
-Section 55
-Paragraph 12
-Publisher FASB
-URI https://asc.fasb.org/1943274/2147479168/946-830-55-12
Reference 16: http://www.xbrl.org/2003/role/disclosureRef
-Topic 946
-SubTopic 210
-Name Accounting Standards Codification
-Section S99
-Paragraph 1
-Subparagraph (SX 210.6-04(14))
-Publisher FASB
-URI https://asc.fasb.org/1943274/2147479170/946-210-S99-1
Reference 17: http://www.xbrl.org/2003/role/disclosureRef
-Topic 470
-SubTopic 10
-Name Accounting Standards Codification
-Section S99
-Paragraph 1A
-Subparagraph (SX 210.13-01(a)(4)(i))
-Publisher FASB
-URI https://asc.fasb.org/1943274/2147480097/470-10-S99-1A
Reference 18: http://www.xbrl.org/2009/role/commonPracticeRef
-Topic 470
-SubTopic 10
-Name Accounting Standards Codification
-Section S99
-Paragraph 1A
-Subparagraph (SX 210.13-01(a)(4)(ii))
-Publisher FASB
-URI https://asc.fasb.org/1943274/2147480097/470-10-S99-1A
Reference 19: http://www.xbrl.org/2003/role/disclosureRef
-Topic 470
-SubTopic 10
-Name Accounting Standards Codification
-Section S99
-Paragraph 1A
-Subparagraph (SX 210.13-01(a)(4)(iii)(A))
-Publisher FASB
-URI https://asc.fasb.org/1943274/2147480097/470-10-S99-1A
Reference 20: http://www.xbrl.org/2003/role/disclosureRef
-Topic 470
-SubTopic 10
-Name Accounting Standards Codification
-Section S99
-Paragraph 1A
-Subparagraph (SX 210.13-01(a)(4)(iv))
-Publisher FASB
-URI https://asc.fasb.org/1943274/2147480097/470-10-S99-1A
Reference 21: http://www.xbrl.org/2003/role/disclosureRef
-Topic 470
-SubTopic 10
-Name Accounting Standards Codification
-Section S99
-Paragraph 1A
-Subparagraph (SX 210.13-01(a)(5))
-Publisher FASB
-URI https://asc.fasb.org/1943274/2147480097/470-10-S99-1A
Reference 22: http://www.xbrl.org/2003/role/disclosureRef
-Topic 470
-SubTopic 10
-Name Accounting Standards Codification
-Section S99
-Paragraph 1B
-Subparagraph (SX 210.13-02(a)(4)(i))
-Publisher FASB
-URI https://asc.fasb.org/1943274/2147480097/470-10-S99-1B
Reference 23: http://www.xbrl.org/2003/role/disclosureRef
-Topic 470
-SubTopic 10
-Name Accounting Standards Codification
-Section S99
-Paragraph 1B
-Subparagraph (SX 210.13-02(a)(4)(iii)(A))
-Publisher FASB
-URI https://asc.fasb.org/1943274/2147480097/470-10-S99-1B
Reference 24: http://www.xbrl.org/2003/role/disclosureRef
-Topic 470
-SubTopic 10
-Name Accounting Standards Codification
-Section S99
-Paragraph 1B
-Subparagraph (SX 210.13-02(a)(4)(iii)(B))
-Publisher FASB
-URI https://asc.fasb.org/1943274/2147480097/470-10-S99-1B
Reference 25: http://www.xbrl.org/2003/role/disclosureRef
-Topic 470
-SubTopic 10
-Name Accounting Standards Codification
-Section S99
-Paragraph 1B
-Subparagraph (SX 210.13-02(a)(4)(iv))
-Publisher FASB
-URI https://asc.fasb.org/1943274/2147480097/470-10-S99-1B
Reference 26: http://www.xbrl.org/2003/role/disclosureRef
-Topic 470
-SubTopic 10
-Name Accounting Standards Codification
-Section S99
-Paragraph 1B
-Subparagraph (SX 210.13-02(a)(5))
-Publisher FASB
-URI https://asc.fasb.org/1943274/2147480097/470-10-S99-1B
Reference 27: http://www.xbrl.org/2009/role/commonPracticeRef
-Topic 852
-SubTopic 10
-Name Accounting Standards Codification
-Section 50
-Paragraph 7
-Subparagraph (a)
-Publisher FASB
-URI https://asc.fasb.org/1943274/2147481404/852-10-50-7
Reference 28: http://www.xbrl.org/2009/role/commonPracticeRef
-Topic 852
-SubTopic 10
-Name Accounting Standards Codification
-Section 50
-Paragraph 7
-Subparagraph (b)
-Publisher FASB
-URI https://asc.fasb.org/1943274/2147481404/852-10-50-7
Reference 29: http://www.xbrl.org/2003/role/exampleRef
-Topic 280
-SubTopic 10
-Name Accounting Standards Codification
-Section 50
-Paragraph 30
-Subparagraph (d)
-Publisher FASB
-URI https://asc.fasb.org/1943274/2147482810/280-10-50-30
| Name: |
us-gaap_Liabilities |
| Namespace Prefix: |
us-gaap_ |
| Data Type: |
xbrli:monetaryItemType |
| Balance Type: |
credit |
| Period Type: |
instant |
|
| X |
- DefinitionAmount of liabilities and equity items, including the portion of equity attributable to noncontrolling interests, if any. Reference 1: http://www.xbrl.org/2003/role/exampleRef
-Topic 852
-SubTopic 10
-Name Accounting Standards Codification
-Section 55
-Paragraph 10
-Publisher FASB
-URI https://asc.fasb.org/1943274/2147481372/852-10-55-10
Reference 2: http://www.xbrl.org/2003/role/disclosureRef
-Topic 944
-SubTopic 210
-Name Accounting Standards Codification
-Section S99
-Paragraph 1
-Subparagraph (SX 210.7-03(a)(25))
-Publisher FASB
-URI https://asc.fasb.org/1943274/2147478777/944-210-S99-1
Reference 3: http://www.xbrl.org/2009/role/commonPracticeRef
-Topic 235
-SubTopic 10
-Name Accounting Standards Codification
-Section S99
-Paragraph 1
-Subparagraph (SX 210.4-08(g)(1)(ii))
-Publisher FASB
-URI https://asc.fasb.org/1943274/2147480678/235-10-S99-1
Reference 4: http://www.xbrl.org/2009/role/commonPracticeRef
-Topic 323
-SubTopic 10
-Name Accounting Standards Codification
-Section 50
-Paragraph 3
-Subparagraph (c)
-Publisher FASB
-URI https://asc.fasb.org/1943274/2147481687/323-10-50-3
Reference 5: http://www.xbrl.org/2009/role/commonPracticeRef
-Topic 825
-SubTopic 10
-Name Accounting Standards Codification
-Section 50
-Paragraph 28
-Subparagraph (f)
-Publisher FASB
-URI https://asc.fasb.org/1943274/2147482907/825-10-50-28
Reference 6: http://fasb.org/us-gaap/role/ref/legacyRef
-Topic 942
-SubTopic 210
-Name Accounting Standards Codification
-Section S99
-Paragraph 1
-Subparagraph (SX 210.9-03(23))
-Publisher FASB
-URI https://asc.fasb.org/1943274/2147478546/942-210-S99-1
Reference 7: http://fasb.org/us-gaap/role/ref/legacyRef
-Topic 210
-SubTopic 10
-Name Accounting Standards Codification
-Section S99
-Paragraph 1
-Subparagraph (SX 210.5-02(32))
-Publisher FASB
-URI https://asc.fasb.org/1943274/2147480566/210-10-S99-1
| Name: |
us-gaap_LiabilitiesAndStockholdersEquity |
| Namespace Prefix: |
us-gaap_ |
| Data Type: |
xbrli:monetaryItemType |
| Balance Type: |
credit |
| Period Type: |
instant |
|
| X |
- DefinitionTotal obligations incurred as part of normal operations that are expected to be paid during the following twelve months or within one business cycle, if longer. Reference 1: http://fasb.org/us-gaap/role/ref/legacyRef
-Topic 210
-SubTopic 10
-Name Accounting Standards Codification
-Section S99
-Paragraph 1
-Subparagraph (SX 210.5-02(21))
-Publisher FASB
-URI https://asc.fasb.org/1943274/2147480566/210-10-S99-1
Reference 2: http://www.xbrl.org/2003/role/disclosureRef
-Topic 810
-SubTopic 10
-Name Accounting Standards Codification
-Section 50
-Paragraph 3
-Subparagraph (c)
-Publisher FASB
-URI https://asc.fasb.org/1943274/2147481203/810-10-50-3
Reference 3: http://www.xbrl.org/2003/role/disclosureRef
-Topic 810
-SubTopic 10
-Name Accounting Standards Codification
-Section 45
-Paragraph 25
-Subparagraph (b)
-Publisher FASB
-URI https://asc.fasb.org/1943274/2147481231/810-10-45-25
Reference 4: http://www.xbrl.org/2003/role/disclosureRef
-Topic 810
-SubTopic 10
-Name Accounting Standards Codification
-Section 50
-Paragraph 3
-Subparagraph (bb)
-Publisher FASB
-URI https://asc.fasb.org/1943274/2147481203/810-10-50-3
Reference 5: http://www.xbrl.org/2003/role/disclosureRef
-Topic 235
-SubTopic 10
-Name Accounting Standards Codification
-Section S99
-Paragraph 1
-Subparagraph (SX 210.4-08(g)(1)(ii))
-Publisher FASB
-URI https://asc.fasb.org/1943274/2147480678/235-10-S99-1
Reference 6: http://www.xbrl.org/2003/role/disclosureRef
-Topic 323
-SubTopic 10
-Name Accounting Standards Codification
-Section 50
-Paragraph 3
-Subparagraph (c)
-Publisher FASB
-URI https://asc.fasb.org/1943274/2147481687/323-10-50-3
Reference 7: http://www.xbrl.org/2003/role/disclosureRef
-Topic 825
-SubTopic 10
-Name Accounting Standards Codification
-Section 50
-Paragraph 28
-Subparagraph (f)
-Publisher FASB
-URI https://asc.fasb.org/1943274/2147482907/825-10-50-28
Reference 8: http://www.xbrl.org/2003/role/exampleRef
-Topic 852
-SubTopic 10
-Name Accounting Standards Codification
-Section 55
-Paragraph 10
-Publisher FASB
-URI https://asc.fasb.org/1943274/2147481372/852-10-55-10
Reference 9: http://www.xbrl.org/2003/role/disclosureRef
-Topic 210
-SubTopic 10
-Name Accounting Standards Codification
-Section 45
-Paragraph 5
-Publisher FASB
-URI https://asc.fasb.org/1943274/2147483467/210-10-45-5
Reference 10: http://www.xbrl.org/2003/role/disclosureRef
-Topic 470
-SubTopic 10
-Name Accounting Standards Codification
-Section S99
-Paragraph 1A
-Subparagraph (SX 210.13-01(a)(4)(i))
-Publisher FASB
-URI https://asc.fasb.org/1943274/2147480097/470-10-S99-1A
Reference 11: http://www.xbrl.org/2009/role/commonPracticeRef
-Topic 470
-SubTopic 10
-Name Accounting Standards Codification
-Section S99
-Paragraph 1A
-Subparagraph (SX 210.13-01(a)(4)(ii))
-Publisher FASB
-URI https://asc.fasb.org/1943274/2147480097/470-10-S99-1A
Reference 12: http://www.xbrl.org/2003/role/disclosureRef
-Topic 470
-SubTopic 10
-Name Accounting Standards Codification
-Section S99
-Paragraph 1A
-Subparagraph (SX 210.13-01(a)(4)(iii)(A))
-Publisher FASB
-URI https://asc.fasb.org/1943274/2147480097/470-10-S99-1A
Reference 13: http://www.xbrl.org/2003/role/disclosureRef
-Topic 470
-SubTopic 10
-Name Accounting Standards Codification
-Section S99
-Paragraph 1A
-Subparagraph (SX 210.13-01(a)(4)(iv))
-Publisher FASB
-URI https://asc.fasb.org/1943274/2147480097/470-10-S99-1A
Reference 14: http://www.xbrl.org/2003/role/disclosureRef
-Topic 470
-SubTopic 10
-Name Accounting Standards Codification
-Section S99
-Paragraph 1A
-Subparagraph (SX 210.13-01(a)(5))
-Publisher FASB
-URI https://asc.fasb.org/1943274/2147480097/470-10-S99-1A
Reference 15: http://www.xbrl.org/2003/role/disclosureRef
-Topic 470
-SubTopic 10
-Name Accounting Standards Codification
-Section S99
-Paragraph 1B
-Subparagraph (SX 210.13-02(a)(4)(i))
-Publisher FASB
-URI https://asc.fasb.org/1943274/2147480097/470-10-S99-1B
Reference 16: http://www.xbrl.org/2003/role/disclosureRef
-Topic 470
-SubTopic 10
-Name Accounting Standards Codification
-Section S99
-Paragraph 1B
-Subparagraph (SX 210.13-02(a)(4)(iii)(A))
-Publisher FASB
-URI https://asc.fasb.org/1943274/2147480097/470-10-S99-1B
Reference 17: http://www.xbrl.org/2003/role/disclosureRef
-Topic 470
-SubTopic 10
-Name Accounting Standards Codification
-Section S99
-Paragraph 1B
-Subparagraph (SX 210.13-02(a)(4)(iii)(B))
-Publisher FASB
-URI https://asc.fasb.org/1943274/2147480097/470-10-S99-1B
Reference 18: http://www.xbrl.org/2003/role/disclosureRef
-Topic 470
-SubTopic 10
-Name Accounting Standards Codification
-Section S99
-Paragraph 1B
-Subparagraph (SX 210.13-02(a)(4)(iv))
-Publisher FASB
-URI https://asc.fasb.org/1943274/2147480097/470-10-S99-1B
Reference 19: http://www.xbrl.org/2003/role/disclosureRef
-Topic 470
-SubTopic 10
-Name Accounting Standards Codification
-Section S99
-Paragraph 1B
-Subparagraph (SX 210.13-02(a)(5))
-Publisher FASB
-URI https://asc.fasb.org/1943274/2147480097/470-10-S99-1B
Reference 20: http://www.xbrl.org/2009/role/commonPracticeRef
-Topic 852
-SubTopic 10
-Name Accounting Standards Codification
-Section 50
-Paragraph 7
-Subparagraph (a)
-Publisher FASB
-URI https://asc.fasb.org/1943274/2147481404/852-10-50-7
Reference 21: http://www.xbrl.org/2009/role/commonPracticeRef
-Topic 852
-SubTopic 10
-Name Accounting Standards Codification
-Section 50
-Paragraph 7
-Subparagraph (b)
-Publisher FASB
-URI https://asc.fasb.org/1943274/2147481404/852-10-50-7
| Name: |
us-gaap_LiabilitiesCurrent |
| Namespace Prefix: |
us-gaap_ |
| Data Type: |
xbrli:monetaryItemType |
| Balance Type: |
credit |
| Period Type: |
instant |
|
| X |
- References
+ Details
| Name: |
us-gaap_LiabilitiesCurrentAbstract |
| Namespace Prefix: |
us-gaap_ |
| Data Type: |
xbrli:stringItemType |
| Balance Type: |
na |
| Period Type: |
duration |
|
| X |
- DefinitionThe carrying value as of the balance sheet date of the current portion of long-term obligations drawn from a line of credit, which is a bank's commitment to make loans up to a specific amount. Examples of items that might be included in the application of this element may consist of letters of credit, standby letters of credit, and revolving credit arrangements, under which borrowings can be made up to a maximum amount as of any point in time conditional on satisfaction of specified terms before, as of and after the date of drawdowns on the line. Includes short-term obligations that would normally be classified as current liabilities but for which (a) postbalance sheet date issuance of a long term obligation to refinance the short term obligation on a long term basis, or (b) the enterprise has entered into a financing agreement that clearly permits the enterprise to refinance the short-term obligation on a long term basis and the following conditions are met (1) the agreement does not expire within 1 year and is not cancelable by the lender except for violation of an objectively determinable provision, (2) no violation exists at the BS date, and (3) the lender has entered into the financing agreement is expected to be financially capable of honoring the agreement. Reference 1: http://fasb.org/us-gaap/role/ref/legacyRef
-Topic 210
-SubTopic 10
-Name Accounting Standards Codification
-Section S99
-Paragraph 1
-Subparagraph (SX 210.5-02(19))
-Publisher FASB
-URI https://asc.fasb.org/1943274/2147480566/210-10-S99-1
Reference 2: http://fasb.org/us-gaap/role/ref/legacyRef
-Topic 942
-SubTopic 210
-Name Accounting Standards Codification
-Section S99
-Paragraph 1
-Subparagraph (SX 210.9-03(13))
-Publisher FASB
-URI https://asc.fasb.org/1943274/2147478546/942-210-S99-1
| Name: |
us-gaap_LinesOfCreditCurrent |
| Namespace Prefix: |
us-gaap_ |
| Data Type: |
xbrli:monetaryItemType |
| Balance Type: |
credit |
| Period Type: |
instant |
|
| X |
- DefinitionAmount, after deduction of unamortized premium (discount) and debt issuance cost, of long-term debt classified as noncurrent. Excludes lease obligation. Reference 1: http://www.xbrl.org/2003/role/disclosureRef
-Topic 210
-SubTopic 10
-Name Accounting Standards Codification
-Section S99
-Paragraph 1
-Subparagraph (SX 210.5-02(22))
-Publisher FASB
-URI https://asc.fasb.org/1943274/2147480566/210-10-S99-1
| Name: |
us-gaap_LongTermDebtNoncurrent |
| Namespace Prefix: |
us-gaap_ |
| Data Type: |
xbrli:monetaryItemType |
| Balance Type: |
credit |
| Period Type: |
instant |
|
| X |
- DefinitionPresent value of lessee's discounted obligation for lease payments from operating lease, classified as current. Reference 1: http://www.xbrl.org/2003/role/disclosureRef
-Topic 842
-SubTopic 20
-Name Accounting Standards Codification
-Section 45
-Paragraph 1
-Subparagraph (b)
-Publisher FASB
-URI https://asc.fasb.org/1943274/2147479041/842-20-45-1
| Name: |
us-gaap_OperatingLeaseLiabilityCurrent |
| Namespace Prefix: |
us-gaap_ |
| Data Type: |
xbrli:monetaryItemType |
| Balance Type: |
credit |
| Period Type: |
instant |
|
| X |
- DefinitionPresent value of lessee's discounted obligation for lease payments from operating lease, classified as noncurrent. Reference 1: http://www.xbrl.org/2003/role/disclosureRef
-Topic 842
-SubTopic 20
-Name Accounting Standards Codification
-Section 45
-Paragraph 1
-Subparagraph (b)
-Publisher FASB
-URI https://asc.fasb.org/1943274/2147479041/842-20-45-1
| Name: |
us-gaap_OperatingLeaseLiabilityNoncurrent |
| Namespace Prefix: |
us-gaap_ |
| Data Type: |
xbrli:monetaryItemType |
| Balance Type: |
credit |
| Period Type: |
instant |
|
| X |
- DefinitionAmount of lessee's right to use underlying asset under operating lease. Reference 1: http://www.xbrl.org/2003/role/disclosureRef
-Topic 842
-SubTopic 20
-Name Accounting Standards Codification
-Section 45
-Paragraph 1
-Subparagraph (a)
-Publisher FASB
-URI https://asc.fasb.org/1943274/2147479041/842-20-45-1
| Name: |
us-gaap_OperatingLeaseRightOfUseAsset |
| Namespace Prefix: |
us-gaap_ |
| Data Type: |
xbrli:monetaryItemType |
| Balance Type: |
debit |
| Period Type: |
instant |
|
| X |
- DefinitionAmount of noncurrent assets classified as other. Reference 1: http://www.xbrl.org/2003/role/disclosureRef
-Topic 210
-SubTopic 10
-Name Accounting Standards Codification
-Section S99
-Paragraph 1
-Subparagraph (SX 210.5-02(17))
-Publisher FASB
-URI https://asc.fasb.org/1943274/2147480566/210-10-S99-1
| Name: |
us-gaap_OtherAssetsNoncurrent |
| Namespace Prefix: |
us-gaap_ |
| Data Type: |
xbrli:monetaryItemType |
| Balance Type: |
debit |
| Period Type: |
instant |
|
| X |
- DefinitionAmount of liabilities classified as other, due after one year or the normal operating cycle, if longer. Reference 1: http://fasb.org/us-gaap/role/ref/legacyRef
-Topic 210
-SubTopic 10
-Name Accounting Standards Codification
-Section S99
-Paragraph 1
-Subparagraph (SX 210.5-02(24))
-Publisher FASB
-URI https://asc.fasb.org/1943274/2147480566/210-10-S99-1
| Name: |
us-gaap_OtherLiabilitiesNoncurrent |
| Namespace Prefix: |
us-gaap_ |
| Data Type: |
xbrli:monetaryItemType |
| Balance Type: |
credit |
| Period Type: |
instant |
|
| X |
- DefinitionAmount of liability, recognized in statement of financial position, for pension, other postretirement and postemployment benefits, classified as noncurrent. Reference 1: http://fasb.org/us-gaap/role/ref/legacyRef
-Topic 715
-SubTopic 20
-Name Accounting Standards Codification
-Section 45
-Paragraph 3
-Publisher FASB
-URI https://asc.fasb.org/1943274/2147480535/715-20-45-3
Reference 2: http://fasb.org/us-gaap/role/ref/legacyRef
-Topic 210
-SubTopic 10
-Name Accounting Standards Codification
-Section S99
-Paragraph 1
-Subparagraph (SX 210.5-02(24))
-Publisher FASB
-URI https://asc.fasb.org/1943274/2147480566/210-10-S99-1
Reference 3: http://fasb.org/us-gaap/role/ref/legacyRef
-Name Accounting Standards Codification
-Topic 715
-SubTopic 20
-Section 45
-Paragraph 2
-Publisher FASB
-URI https://asc.fasb.org/1943274/2147480535/715-20-45-2
Reference 4: http://fasb.org/us-gaap/role/ref/legacyRef
-Name Accounting Standards Codification
-Topic 715
-SubTopic 20
-Section 50
-Paragraph 1
-Subparagraph (c)
-Publisher FASB
-URI https://asc.fasb.org/1943274/2147480506/715-20-50-1
| Name: |
us-gaap_PensionAndOtherPostretirementAndPostemploymentBenefitPlansLiabilitiesNoncurrent |
| Namespace Prefix: |
us-gaap_ |
| Data Type: |
xbrli:monetaryItemType |
| Balance Type: |
credit |
| Period Type: |
instant |
|
| X |
- DefinitionAmount of asset related to consideration paid in advance for costs that provide economic benefits in future periods, and amount of other assets that are expected to be realized or consumed within one year or the normal operating cycle, if longer. Reference 1: http://www.xbrl.org/2009/role/commonPracticeRef
-Topic 210
-SubTopic 10
-Name Accounting Standards Codification
-Section S99
-Paragraph 1
-Subparagraph (SX 210.5-02(9))
-Publisher FASB
-URI https://asc.fasb.org/1943274/2147480566/210-10-S99-1
| Name: |
us-gaap_PrepaidExpenseAndOtherAssetsCurrent |
| Namespace Prefix: |
us-gaap_ |
| Data Type: |
xbrli:monetaryItemType |
| Balance Type: |
debit |
| Period Type: |
instant |
|
| X |
- DefinitionAmount before accumulated depreciation, depletion and amortization of physical assets used in the normal conduct of business and not intended for resale. Examples include, but are not limited to, land, buildings, machinery and equipment, office equipment, and furniture and fixtures. Reference 1: http://www.xbrl.org/2003/role/disclosureRef
-Topic 944
-SubTopic 210
-Name Accounting Standards Codification
-Section S99
-Paragraph 1
-Subparagraph (SX 210.7-03(a)(8))
-Publisher FASB
-URI https://asc.fasb.org/1943274/2147478777/944-210-S99-1
Reference 2: http://www.xbrl.org/2003/role/disclosureRef
-Topic 210
-SubTopic 10
-Name Accounting Standards Codification
-Section S99
-Paragraph 1
-Subparagraph (SX 210.5-02(13))
-Publisher FASB
-URI https://asc.fasb.org/1943274/2147480566/210-10-S99-1
Reference 3: http://fasb.org/us-gaap/role/ref/legacyRef
-Topic 360
-SubTopic 10
-Name Accounting Standards Codification
-Section 50
-Paragraph 1
-Subparagraph (b)
-Publisher FASB
-URI https://asc.fasb.org/1943274/2147482099/360-10-50-1
| Name: |
us-gaap_PropertyPlantAndEquipmentGross |
| Namespace Prefix: |
us-gaap_ |
| Data Type: |
xbrli:monetaryItemType |
| Balance Type: |
debit |
| Period Type: |
instant |
|
| X |
- DefinitionAmount after accumulated depreciation, depletion and amortization of physical assets used in the normal conduct of business to produce goods and services and not intended for resale. Examples include, but are not limited to, land, buildings, machinery and equipment, office equipment, and furniture and fixtures. Reference 1: http://fasb.org/us-gaap/role/ref/legacyRef
-Name Accounting Standards Codification
-Section 50
-Paragraph 1
-SubTopic 10
-Topic 360
-Publisher FASB
-URI https://asc.fasb.org/1943274/2147482099/360-10-50-1
Reference 2: http://www.xbrl.org/2003/role/disclosureRef
-Topic 842
-SubTopic 20
-Name Accounting Standards Codification
-Section 50
-Paragraph 7A
-Subparagraph (a)
-Publisher FASB
-URI https://asc.fasb.org/1943274/2147478964/842-20-50-7A
Reference 3: http://www.xbrl.org/2003/role/exampleRef
-Topic 852
-SubTopic 10
-Name Accounting Standards Codification
-Section 55
-Paragraph 10
-Publisher FASB
-URI https://asc.fasb.org/1943274/2147481372/852-10-55-10
Reference 4: http://www.xbrl.org/2003/role/disclosureRef
-Topic 944
-SubTopic 210
-Name Accounting Standards Codification
-Section S99
-Paragraph 1
-Subparagraph (SX 210.7-03(a)(8))
-Publisher FASB
-URI https://asc.fasb.org/1943274/2147478777/944-210-S99-1
Reference 5: http://www.xbrl.org/2003/role/disclosureRef
-Topic 942
-SubTopic 360
-Name Accounting Standards Codification
-Section 50
-Paragraph 1
-Publisher FASB
-URI https://asc.fasb.org/1943274/2147478451/942-360-50-1
| Name: |
us-gaap_PropertyPlantAndEquipmentNet |
| Namespace Prefix: |
us-gaap_ |
| Data Type: |
xbrli:monetaryItemType |
| Balance Type: |
debit |
| Period Type: |
instant |
|
| X |
- DefinitionAmount of cash restricted as to withdrawal or usage. Cash includes, but is not limited to, currency on hand, demand deposits with banks or financial institutions, and other accounts with general characteristics of demand deposits. Reference 1: http://www.xbrl.org/2009/role/commonPracticeRef
-Topic 944
-SubTopic 210
-Name Accounting Standards Codification
-Section S99
-Paragraph 1
-Subparagraph (SX 210.7-03(a)(2))
-Publisher FASB
-URI https://asc.fasb.org/1943274/2147478777/944-210-S99-1
Reference 2: http://www.xbrl.org/2009/role/commonPracticeRef
-Topic 210
-SubTopic 10
-Name Accounting Standards Codification
-Section S99
-Paragraph 1
-Subparagraph (SX 210.5-02(1))
-Publisher FASB
-URI https://asc.fasb.org/1943274/2147480566/210-10-S99-1
Reference 3: http://www.xbrl.org/2009/role/commonPracticeRef
-Topic 230
-SubTopic 10
-Name Accounting Standards Codification
-Section 50
-Paragraph 8
-Publisher FASB
-URI https://asc.fasb.org/1943274/2147482913/230-10-50-8
Reference 4: http://www.xbrl.org/2009/role/commonPracticeRef
-Topic 942
-SubTopic 210
-Name Accounting Standards Codification
-Section S99
-Paragraph 1
-Subparagraph (SX 210.9-03(1)(a))
-Publisher FASB
-URI https://asc.fasb.org/1943274/2147478546/942-210-S99-1
| Name: |
us-gaap_RestrictedCash |
| Namespace Prefix: |
us-gaap_ |
| Data Type: |
xbrli:monetaryItemType |
| Balance Type: |
debit |
| Period Type: |
instant |
|
| X |
- DefinitionAmount of accumulated undistributed earnings (deficit). Reference 1: http://fasb.org/us-gaap/role/ref/legacyRef
-Topic 210
-SubTopic 10
-Name Accounting Standards Codification
-Section S99
-Paragraph 1
-Subparagraph (SX 210.5-02(30)(a)(3))
-Publisher FASB
-URI https://asc.fasb.org/1943274/2147480566/210-10-S99-1
Reference 2: http://www.xbrl.org/2003/role/exampleRef
-Topic 852
-SubTopic 10
-Name Accounting Standards Codification
-Section 55
-Paragraph 10
-Publisher FASB
-URI https://asc.fasb.org/1943274/2147481372/852-10-55-10
Reference 3: http://www.xbrl.org/2003/role/disclosureRef
-Topic 944
-SubTopic 40
-Name Accounting Standards Codification
-Section 65
-Paragraph 2
-Subparagraph (g)(2)(i)
-Publisher FASB
-URI https://asc.fasb.org/1943274/2147480016/944-40-65-2
Reference 4: http://www.xbrl.org/2003/role/disclosureRef
-Topic 944
-SubTopic 40
-Name Accounting Standards Codification
-Section 65
-Paragraph 2
-Subparagraph (h)(2)
-Publisher FASB
-URI https://asc.fasb.org/1943274/2147480016/944-40-65-2
Reference 5: http://www.xbrl.org/2003/role/disclosureRef
-Topic 946
-SubTopic 20
-Name Accounting Standards Codification
-Section 50
-Paragraph 11
-Publisher FASB
-URI https://asc.fasb.org/1943274/2147480990/946-20-50-11
Reference 6: http://www.xbrl.org/2003/role/disclosureRef
-Topic 944
-SubTopic 210
-Name Accounting Standards Codification
-Section S99
-Paragraph 1
-Subparagraph (SX 210.7-03(a)(23)(a)(4))
-Publisher FASB
-URI https://asc.fasb.org/1943274/2147478777/944-210-S99-1
Reference 7: http://www.xbrl.org/2003/role/disclosureRef
-Topic 946
-SubTopic 210
-Name Accounting Standards Codification
-Section S99
-Paragraph 1
-Subparagraph (SX 210.6-04(17))
-Publisher FASB
-URI https://asc.fasb.org/1943274/2147479170/946-210-S99-1
Reference 8: http://fasb.org/us-gaap/role/ref/legacyRef
-Topic 505
-SubTopic 10
-Name Accounting Standards Codification
-Section S99
-Paragraph 1
-Subparagraph (SX 210.3-04)
-Publisher FASB
-URI https://asc.fasb.org/1943274/2147480008/505-10-S99-1
| Name: |
us-gaap_RetainedEarningsAccumulatedDeficit |
| Namespace Prefix: |
us-gaap_ |
| Data Type: |
xbrli:monetaryItemType |
| Balance Type: |
credit |
| Period Type: |
instant |
|
| X |
- DefinitionReflects the total carrying amount as of the balance sheet date of debt having initial terms less than one year or the normal operating cycle, if longer. Reference 1: http://fasb.org/us-gaap/role/ref/legacyRef
-Topic 210
-SubTopic 10
-Name Accounting Standards Codification
-Section S99
-Paragraph 1
-Subparagraph (SX 210.5-02(19)(a))
-Publisher FASB
-URI https://asc.fasb.org/1943274/2147480566/210-10-S99-1
Reference 2: http://fasb.org/us-gaap/role/ref/legacyRef
-Topic 942
-SubTopic 210
-Name Accounting Standards Codification
-Section S99
-Paragraph 1
-Subparagraph (SX 210.9-03(13))
-Publisher FASB
-URI https://asc.fasb.org/1943274/2147478546/942-210-S99-1
Reference 3: http://www.xbrl.org/2003/role/exampleRef
-Topic 852
-SubTopic 10
-Name Accounting Standards Codification
-Section 55
-Paragraph 10
-Publisher FASB
-URI https://asc.fasb.org/1943274/2147481372/852-10-55-10
Reference 4: http://www.xbrl.org/2009/role/commonPracticeRef
-Topic 944
-SubTopic 210
-Name Accounting Standards Codification
-Section S99
-Paragraph 1
-Subparagraph (SX 210.7-03(a)(16)(a)(1))
-Publisher FASB
-URI https://asc.fasb.org/1943274/2147478777/944-210-S99-1
| Name: |
us-gaap_ShortTermBorrowings |
| Namespace Prefix: |
us-gaap_ |
| Data Type: |
xbrli:monetaryItemType |
| Balance Type: |
credit |
| Period Type: |
instant |
|
| X |
- DefinitionAmount of equity (deficit) attributable to parent. Excludes temporary equity and equity attributable to noncontrolling interest. Reference 1: http://fasb.org/us-gaap/role/ref/legacyRef
-Topic 210
-SubTopic 10
-Name Accounting Standards Codification
-Section S99
-Paragraph 1
-Subparagraph (SX 210.5-02(29))
-Publisher FASB
-URI https://asc.fasb.org/1943274/2147480566/210-10-S99-1
Reference 2: http://fasb.org/us-gaap/role/ref/legacyRef
-Topic 210
-SubTopic 10
-Name Accounting Standards Codification
-Section S99
-Paragraph 1
-Subparagraph (SX 210.5-02(30))
-Publisher FASB
-URI https://asc.fasb.org/1943274/2147480566/210-10-S99-1
Reference 3: http://fasb.org/us-gaap/role/ref/legacyRef
-Topic 210
-SubTopic 10
-Name Accounting Standards Codification
-Section S99
-Paragraph 1
-Subparagraph (SX 210.5-02(31))
-Publisher FASB
-URI https://asc.fasb.org/1943274/2147480566/210-10-S99-1
Reference 4: http://www.xbrl.org/2003/role/exampleRef
-Topic 852
-SubTopic 10
-Name Accounting Standards Codification
-Section 55
-Paragraph 10
-Publisher FASB
-URI https://asc.fasb.org/1943274/2147481372/852-10-55-10
Reference 5: http://www.xbrl.org/2003/role/exampleRef
-Topic 946
-SubTopic 830
-Name Accounting Standards Codification
-Section 55
-Paragraph 12
-Publisher FASB
-URI https://asc.fasb.org/1943274/2147479168/946-830-55-12
Reference 6: http://www.xbrl.org/2003/role/disclosureRef
-Topic 946
-SubTopic 210
-Name Accounting Standards Codification
-Section S99
-Paragraph 1
-Subparagraph (SX 210.6-04(19))
-Publisher FASB
-URI https://asc.fasb.org/1943274/2147479170/946-210-S99-1
Reference 7: http://www.xbrl.org/2003/role/disclosureRef
-Topic 946
-SubTopic 210
-Name Accounting Standards Codification
-Section S99
-Paragraph 2
-Subparagraph (SX 210.6-05(4))
-Publisher FASB
-URI https://asc.fasb.org/1943274/2147479170/946-210-S99-2
Reference 8: http://www.xbrl.org/2009/role/commonPracticeRef
-Topic 946
-SubTopic 220
-Name Accounting Standards Codification
-Section S99
-Paragraph 3
-Subparagraph (SX 210.6-09(4)(b))
-Publisher FASB
-URI https://asc.fasb.org/1943274/2147479134/946-220-S99-3
Reference 9: http://www.xbrl.org/2003/role/disclosureRef
-Topic 946
-SubTopic 220
-Name Accounting Standards Codification
-Section S99
-Paragraph 3
-Subparagraph (SX 210.6-09(6))
-Publisher FASB
-URI https://asc.fasb.org/1943274/2147479134/946-220-S99-3
Reference 10: http://www.xbrl.org/2003/role/disclosureRef
-Topic 946
-SubTopic 220
-Name Accounting Standards Codification
-Section S99
-Paragraph 3
-Subparagraph (SX 210.6-09(7))
-Publisher FASB
-URI https://asc.fasb.org/1943274/2147479134/946-220-S99-3
Reference 11: http://www.xbrl.org/2009/role/commonPracticeRef
-Topic 235
-SubTopic 10
-Name Accounting Standards Codification
-Section S99
-Paragraph 1
-Subparagraph (SX 210.4-08(g)(1)(ii))
-Publisher FASB
-URI https://asc.fasb.org/1943274/2147480678/235-10-S99-1
Reference 12: http://www.xbrl.org/2009/role/commonPracticeRef
-Topic 323
-SubTopic 10
-Name Accounting Standards Codification
-Section 50
-Paragraph 3
-Subparagraph (c)
-Publisher FASB
-URI https://asc.fasb.org/1943274/2147481687/323-10-50-3
Reference 13: http://www.xbrl.org/2009/role/commonPracticeRef
-Topic 825
-SubTopic 10
-Name Accounting Standards Codification
-Section 50
-Paragraph 28
-Subparagraph (f)
-Publisher FASB
-URI https://asc.fasb.org/1943274/2147482907/825-10-50-28
Reference 14: http://fasb.org/us-gaap/role/ref/legacyRef
-Topic 310
-SubTopic 10
-Name Accounting Standards Codification
-Section S99
-Paragraph 2
-Subparagraph (SAB Topic 4.E)
-Publisher FASB
-URI https://asc.fasb.org/1943274/2147480418/310-10-S99-2
| Name: |
us-gaap_StockholdersEquity |
| Namespace Prefix: |
us-gaap_ |
| Data Type: |
xbrli:monetaryItemType |
| Balance Type: |
credit |
| Period Type: |
instant |
|
| X |
- References
+ Details
| Name: |
us-gaap_StockholdersEquityAbstract |
| Namespace Prefix: |
us-gaap_ |
| Data Type: |
xbrli:stringItemType |
| Balance Type: |
na |
| Period Type: |
duration |
|
| X |
- DefinitionCarrying value as of the balance sheet date of obligations incurred and payable for statutory income, sales, use, payroll, excise, real, property and other taxes. Used to reflect the current portion of the liabilities (due within one year or within the normal operating cycle if longer). Reference 1: http://fasb.org/us-gaap/role/ref/legacyRef
-Topic 210
-SubTopic 10
-Name Accounting Standards Codification
-Section S99
-Paragraph 1
-Subparagraph (SX 210.5-02(20))
-Publisher FASB
-URI https://asc.fasb.org/1943274/2147480566/210-10-S99-1
Reference 2: http://fasb.org/us-gaap/role/ref/legacyRef
-Topic 210
-SubTopic 10
-Name Accounting Standards Codification
-Section S99
-Paragraph 1
-Subparagraph (SX 210.5-02(19))
-Publisher FASB
-URI https://asc.fasb.org/1943274/2147480566/210-10-S99-1
| Name: |
us-gaap_TaxesPayableCurrent |
| Namespace Prefix: |
us-gaap_ |
| Data Type: |
xbrli:monetaryItemType |
| Balance Type: |
credit |
| Period Type: |
instant |
|
v3.24.3
Consolidated Balance Sheets (Parenthetical) - shares
|
Sep. 30, 2024 |
Dec. 31, 2023 |
| Statement of Financial Position [Abstract] |
|
|
| Common Stock, Shares Authorized |
150,000,000
|
|
| Common Stock, Shares, Issued |
34,510,556
|
34,408,638
|
| Common Stock, Shares, Outstanding |
34,510,556
|
34,408,638
|
| Common Stock, Shares Held in Employee Trust, Shares |
118,543
|
|
| X |
- DefinitionThe maximum number of common shares permitted to be issued by an entity's charter and bylaws. Reference 1: http://fasb.org/us-gaap/role/ref/legacyRef
-Topic 210
-SubTopic 10
-Name Accounting Standards Codification
-Section S99
-Paragraph 1
-Subparagraph (SX 210.5-02(29))
-Publisher FASB
-URI https://asc.fasb.org/1943274/2147480566/210-10-S99-1
Reference 2: http://www.xbrl.org/2003/role/disclosureRef
-Topic 946
-SubTopic 210
-Name Accounting Standards Codification
-Section S99
-Paragraph 1
-Subparagraph (SX 210.6-04(16)(a))
-Publisher FASB
-URI https://asc.fasb.org/1943274/2147479170/946-210-S99-1
| Name: |
us-gaap_CommonStockSharesAuthorized |
| Namespace Prefix: |
us-gaap_ |
| Data Type: |
xbrli:sharesItemType |
| Balance Type: |
na |
| Period Type: |
instant |
|
| X |
- DefinitionNumber of common stock held in a trust that has been set up specifically to accumulate stock for the sole purpose of distribution to participating employees but not yet earned. Reference 1: http://fasb.org/us-gaap/role/ref/legacyRef
-Name Accounting Standards Codification
-Topic 718
-SubTopic 40
-Section 25
-Paragraph 12
-Publisher FASB
-URI https://asc.fasb.org/1943274/2147480637/718-40-25-12
| Name: |
us-gaap_CommonStockSharesHeldInEmployeeTrustShares |
| Namespace Prefix: |
us-gaap_ |
| Data Type: |
xbrli:sharesItemType |
| Balance Type: |
na |
| Period Type: |
instant |
|
| X |
- DefinitionTotal number of common shares of an entity that have been sold or granted to shareholders (includes common shares that were issued, repurchased and remain in the treasury). These shares represent capital invested by the firm's shareholders and owners, and may be all or only a portion of the number of shares authorized. Shares issued include shares outstanding and shares held in the treasury. Reference 1: http://fasb.org/us-gaap/role/ref/legacyRef
-Topic 210
-SubTopic 10
-Name Accounting Standards Codification
-Section S99
-Paragraph 1
-Subparagraph (SX 210.5-02(29))
-Publisher FASB
-URI https://asc.fasb.org/1943274/2147480566/210-10-S99-1
| Name: |
us-gaap_CommonStockSharesIssued |
| Namespace Prefix: |
us-gaap_ |
| Data Type: |
xbrli:sharesItemType |
| Balance Type: |
na |
| Period Type: |
instant |
|
| X |
- DefinitionNumber of shares of common stock outstanding. Common stock represent the ownership interest in a corporation. Reference 1: http://fasb.org/us-gaap/role/ref/legacyRef
-Name Accounting Standards Codification
-Section 50
-Paragraph 2
-SubTopic 10
-Topic 505
-Publisher FASB
-URI https://asc.fasb.org/1943274/2147481112/505-10-50-2
Reference 2: http://fasb.org/us-gaap/role/ref/legacyRef
-Topic 210
-SubTopic 10
-Name Accounting Standards Codification
-Section S99
-Paragraph 1
-Subparagraph (SX 210.5-02(29))
-Publisher FASB
-URI https://asc.fasb.org/1943274/2147480566/210-10-S99-1
Reference 3: http://www.xbrl.org/2003/role/disclosureRef
-Topic 946
-SubTopic 210
-Name Accounting Standards Codification
-Section S99
-Paragraph 2
-Subparagraph (SX 210.6-05(4))
-Publisher FASB
-URI https://asc.fasb.org/1943274/2147479170/946-210-S99-2
Reference 4: http://www.xbrl.org/2009/role/commonPracticeRef
-Topic 946
-SubTopic 220
-Name Accounting Standards Codification
-Section S99
-Paragraph 3
-Subparagraph (SX 210.6-09(4)(b))
-Publisher FASB
-URI https://asc.fasb.org/1943274/2147479134/946-220-S99-3
Reference 5: http://www.xbrl.org/2003/role/disclosureRef
-Topic 946
-SubTopic 210
-Name Accounting Standards Codification
-Section S99
-Paragraph 1
-Subparagraph (SX 210.6-04(16)(a))
-Publisher FASB
-URI https://asc.fasb.org/1943274/2147479170/946-210-S99-1
Reference 6: http://www.xbrl.org/2009/role/commonPracticeRef
-Topic 946
-SubTopic 220
-Name Accounting Standards Codification
-Section S99
-Paragraph 3
-Subparagraph (SX 210.6-09(7))
-Publisher FASB
-URI https://asc.fasb.org/1943274/2147479134/946-220-S99-3
| Name: |
us-gaap_CommonStockSharesOutstanding |
| Namespace Prefix: |
us-gaap_ |
| Data Type: |
xbrli:sharesItemType |
| Balance Type: |
na |
| Period Type: |
instant |
|
| X |
- References
+ Details
| Name: |
us-gaap_StatementOfFinancialPositionAbstract |
| Namespace Prefix: |
us-gaap_ |
| Data Type: |
xbrli:stringItemType |
| Balance Type: |
na |
| Period Type: |
duration |
|
v3.24.3
Consolidated Statements Of Income - USD ($)
shares in Thousands, $ in Thousands |
3 Months Ended |
9 Months Ended |
Sep. 30, 2024 |
Sep. 30, 2023 |
Sep. 30, 2024 |
Sep. 30, 2023 |
| Revenues and other items: |
|
|
|
|
| Sales |
$ 182,051
|
$ 166,192
|
$ 548,022
|
$ 535,481
|
| Other income (expense), net |
(22)
|
(51)
|
310
|
210
|
| Total revenues, net of other expenses |
182,029
|
166,141
|
548,332
|
535,691
|
| Costs and expenses: |
|
|
|
|
| Selling, general and administrative |
21,795
|
21,350
|
59,940
|
57,244
|
| Research and development |
475
|
794
|
994
|
3,375
|
| Amortization of identifiable intangibles |
462
|
465
|
1,410
|
1,433
|
| Accrued pension and post-retirement benefits |
54
|
3,118
|
163
|
9,955
|
| Interest expense |
3,480
|
3,106
|
10,314
|
7,791
|
| Asset impairments and costs associated with exit and disposal activities, net of adjustments |
0
|
4,633
|
587
|
4,702
|
| Goodwill, Impairment Loss |
0
|
19,478
|
0
|
34,891
|
| Total |
185,027
|
229,828
|
536,625
|
622,312
|
| Income (loss) before income taxes |
(2,998)
|
(63,687)
|
11,707
|
(86,621)
|
| Income tax expense (benefit) |
948
|
(13,307)
|
3,573
|
(16,307)
|
| Net Income (Loss) Attributable to Parent, Total |
$ (3,946)
|
$ (50,380)
|
$ 8,134
|
$ (70,314)
|
| Earnings (loss) per share: |
|
|
|
|
| Basic (in dollars per share) |
$ (0.11)
|
$ (1.47)
|
$ 0.24
|
$ (2.06)
|
| Diluted (in dollars per share) |
$ (0.11)
|
$ (1.47)
|
$ 0.24
|
$ (2.06)
|
| Shares used to compute earnings (loss) per share: |
|
|
|
|
| Basic (in shares) |
34,391
|
34,264
|
34,364
|
34,081
|
| Diluted (in shares) |
34,391
|
34,264
|
34,364
|
34,081
|
| Cost of goods sold |
|
|
|
|
| Costs and expenses: |
|
|
|
|
| Cost of Goods and Services Sold |
$ 151,676
|
$ 144,539
|
$ 442,384
|
$ 457,332
|
| Freight |
|
|
|
|
| Costs and expenses: |
|
|
|
|
| Cost of Goods and Services Sold |
$ 7,085
|
$ 6,733
|
$ 20,833
|
$ 19,977
|
| X |
- DefinitionAmounts charged against earnings for incurred and estimated one-time, nonrecurring costs assoicated with asset impariments and exit and disposal activities.
| Name: |
tg_AssetImpairmentAndCostsAssociatedWithExitAndDisposalActivitiesimpairmentLine |
| Namespace Prefix: |
tg_ |
| Data Type: |
xbrli:monetaryItemType |
| Balance Type: |
debit |
| Period Type: |
duration |
|
| X |
- DefinitionShares Used To Compute Earnings Loss Per Share.
| Name: |
tg_SharesUsedToComputeEarningsLossPerShareAbstract |
| Namespace Prefix: |
tg_ |
| Data Type: |
xbrli:stringItemType |
| Balance Type: |
na |
| Period Type: |
duration |
|
| X |
- DefinitionTotal sales, net of returns, allowances and discounts, plus other non-operating income and expenses.
| Name: |
tg_TotalRevenuesNetOfOtherExpenses |
| Namespace Prefix: |
tg_ |
| Data Type: |
xbrli:monetaryItemType |
| Balance Type: |
credit |
| Period Type: |
duration |
|
| X |
- DefinitionThe aggregate expense charged against earnings to allocate the cost of intangible assets (nonphysical assets not used in production) in a systematic and rational manner to the periods expected to benefit from such assets. As a noncash expense, this element is added back to net income when calculating cash provided by or used in operations using the indirect method. Reference 1: http://fasb.org/us-gaap/role/ref/legacyRef
-Name Accounting Standards Codification
-Section 45
-Paragraph 28
-Subparagraph (b)
-SubTopic 10
-Topic 230
-Publisher FASB
-URI https://asc.fasb.org/1943274/2147482740/230-10-45-28
Reference 2: http://www.xbrl.org/2003/role/exampleRef
-Topic 350
-SubTopic 30
-Name Accounting Standards Codification
-Section 55
-Paragraph 40
-Publisher FASB
-URI https://asc.fasb.org/1943274/2147482640/350-30-55-40
Reference 3: http://www.xbrl.org/2003/role/disclosureRef
-Topic 350
-SubTopic 30
-Name Accounting Standards Codification
-Section 50
-Paragraph 2
-Subparagraph (a)(2)
-Publisher FASB
-URI https://asc.fasb.org/1943274/2147482665/350-30-50-2
Reference 4: http://www.xbrl.org/2003/role/disclosureRef
-Topic 350
-SubTopic 30
-Name Accounting Standards Codification
-Section 45
-Paragraph 2
-Publisher FASB
-URI https://asc.fasb.org/1943274/2147482686/350-30-45-2
| Name: |
us-gaap_AmortizationOfIntangibleAssets |
| Namespace Prefix: |
us-gaap_ |
| Data Type: |
xbrli:monetaryItemType |
| Balance Type: |
debit |
| Period Type: |
duration |
|
| X |
- DefinitionThe aggregate costs related to goods produced and sold and services rendered by an entity during the reporting period. This excludes costs incurred during the reporting period related to financial services rendered and other revenue generating activities. Reference 1: http://fasb.org/us-gaap/role/ref/legacyRef
-Topic 220
-SubTopic 10
-Name Accounting Standards Codification
-Section S99
-Paragraph 2
-Subparagraph (SX 210.5-03(2)(d))
-Publisher FASB
-URI https://asc.fasb.org/1943274/2147483621/220-10-S99-2
Reference 2: http://fasb.org/us-gaap/role/ref/legacyRef
-Topic 220
-SubTopic 10
-Name Accounting Standards Codification
-Section S99
-Paragraph 2
-Subparagraph (SX 210.5-03(2)(a))
-Publisher FASB
-URI https://asc.fasb.org/1943274/2147483621/220-10-S99-2
Reference 3: http://www.xbrl.org/2003/role/disclosureRef
-Topic 924
-SubTopic 10
-Name Accounting Standards Codification
-Section S99
-Paragraph 1
-Subparagraph (SAB Topic 11.L)
-Publisher FASB
-URI https://asc.fasb.org/1943274/2147479941/924-10-S99-1
| Name: |
us-gaap_CostOfGoodsAndServicesSold |
| Namespace Prefix: |
us-gaap_ |
| Data Type: |
xbrli:monetaryItemType |
| Balance Type: |
debit |
| Period Type: |
duration |
|
| X |
- References
+ Details
| Name: |
us-gaap_CostOfRevenueAbstract |
| Namespace Prefix: |
us-gaap_ |
| Data Type: |
xbrli:stringItemType |
| Balance Type: |
na |
| Period Type: |
duration |
|
| X |
- DefinitionTotal costs of sales and operating expenses for the period. Reference 1: http://fasb.org/us-gaap/role/ref/legacyRef
-Topic 220
-SubTopic 10
-Name Accounting Standards Codification
-Section S99
-Paragraph 2
-Subparagraph (SX 210.5-03)
-Publisher FASB
-URI https://asc.fasb.org/1943274/2147483621/220-10-S99-2
| Name: |
us-gaap_CostsAndExpenses |
| Namespace Prefix: |
us-gaap_ |
| Data Type: |
xbrli:monetaryItemType |
| Balance Type: |
debit |
| Period Type: |
duration |
|
| X |
- References
+ Details
| Name: |
us-gaap_EarningsPerShareAbstract |
| Namespace Prefix: |
us-gaap_ |
| Data Type: |
xbrli:stringItemType |
| Balance Type: |
na |
| Period Type: |
duration |
|
| X |
- DefinitionAmount of impairment loss from asset representing future economic benefit arising from other asset acquired in business combination or from joint venture formation or both, that is not individually identified and separately recognized. Reference 1: http://fasb.org/us-gaap/role/ref/legacyRef
-Name Accounting Standards Codification
-Section 45
-Paragraph 28
-Subparagraph (b)
-SubTopic 10
-Topic 230
-Publisher FASB
-URI https://asc.fasb.org/1943274/2147482740/230-10-45-28
Reference 2: http://www.xbrl.org/2003/role/exampleRef
-Topic 350
-SubTopic 20
-Name Accounting Standards Codification
-Section 55
-Paragraph 24
-Publisher FASB
-URI https://asc.fasb.org/1943274/2147482548/350-20-55-24
Reference 3: http://www.xbrl.org/2003/role/disclosureRef
-Topic 350
-SubTopic 20
-Name Accounting Standards Codification
-Section 50
-Paragraph 2
-Subparagraph (b)
-Publisher FASB
-URI https://asc.fasb.org/1943274/2147482573/350-20-50-2
Reference 4: http://www.xbrl.org/2003/role/exampleRef
-Topic 820
-SubTopic 10
-Name Accounting Standards Codification
-Section 55
-Paragraph 100
-Subparagraph (d)
-Publisher FASB
-URI https://asc.fasb.org/1943274/2147482078/820-10-55-100
Reference 5: http://www.xbrl.org/2003/role/disclosureRef
-Topic 350
-SubTopic 20
-Name Accounting Standards Codification
-Section 50
-Paragraph 1
-Subparagraph (e)
-Publisher FASB
-URI https://asc.fasb.org/1943274/2147482573/350-20-50-1
Reference 6: http://www.xbrl.org/2003/role/disclosureRef
-Topic 350
-SubTopic 20
-Name Accounting Standards Codification
-Section 45
-Paragraph 2
-Publisher FASB
-URI https://asc.fasb.org/1943274/2147482598/350-20-45-2
| Name: |
us-gaap_GoodwillImpairmentLoss |
| Namespace Prefix: |
us-gaap_ |
| Data Type: |
xbrli:monetaryItemType |
| Balance Type: |
debit |
| Period Type: |
duration |
|
| X |
- DefinitionThe amount of net income (loss) from continuing operations per each share of common stock or unit outstanding during the reporting period. Reference 1: http://www.xbrl.org/2003/role/disclosureRef
-Topic 250
-SubTopic 10
-Name Accounting Standards Codification
-Section 50
-Paragraph 6
-Publisher FASB
-URI https://asc.fasb.org/1943274/2147483443/250-10-50-6
Reference 2: http://www.xbrl.org/2003/role/disclosureRef
-Topic 805
-SubTopic 60
-Name Accounting Standards Codification
-Section 65
-Paragraph 1
-Subparagraph (g)
-Publisher FASB
-URI https://asc.fasb.org/1943274/2147476176/805-60-65-1
Reference 3: http://www.xbrl.org/2003/role/disclosureRef
-Topic 740
-SubTopic 323
-Name Accounting Standards Codification
-Section 65
-Paragraph 2
-Subparagraph (g)(3)
-Publisher FASB
-URI https://asc.fasb.org/1943274/2147478666/740-323-65-2
Reference 4: http://fasb.org/us-gaap/role/ref/legacyRef
-Topic 220
-SubTopic 10
-Name Accounting Standards Codification
-Section S99
-Paragraph 2
-Subparagraph (SX 210.5-03(13))
-Publisher FASB
-URI https://asc.fasb.org/1943274/2147483621/220-10-S99-2
Reference 5: http://www.xbrl.org/2003/role/disclosureRef
-Topic 250
-SubTopic 10
-Name Accounting Standards Codification
-Section 50
-Paragraph 3
-Publisher FASB
-URI https://asc.fasb.org/1943274/2147483443/250-10-50-3
Reference 6: http://www.xbrl.org/2003/role/disclosureRef
-Topic 250
-SubTopic 10
-Name Accounting Standards Codification
-Section 50
-Paragraph 1
-Subparagraph (b)(2)
-Publisher FASB
-URI https://asc.fasb.org/1943274/2147483443/250-10-50-1
Reference 7: http://www.xbrl.org/2003/role/disclosureRef
-Topic 815
-SubTopic 40
-Name Accounting Standards Codification
-Section 65
-Paragraph 1
-Subparagraph (f)
-Publisher FASB
-URI https://asc.fasb.org/1943274/2147480175/815-40-65-1
Reference 8: http://www.xbrl.org/2003/role/disclosureRef
-Topic 250
-SubTopic 10
-Name Accounting Standards Codification
-Section 50
-Paragraph 11
-Subparagraph (a)
-Publisher FASB
-URI https://asc.fasb.org/1943274/2147483443/250-10-50-11
Reference 9: http://www.xbrl.org/2003/role/disclosureRef
-Topic 250
-SubTopic 10
-Name Accounting Standards Codification
-Section 50
-Paragraph 11
-Subparagraph (b)
-Publisher FASB
-URI https://asc.fasb.org/1943274/2147483443/250-10-50-11
Reference 10: http://www.xbrl.org/2003/role/disclosureRef
-Topic 260
-SubTopic 10
-Name Accounting Standards Codification
-Section 45
-Paragraph 2
-Publisher FASB
-URI https://asc.fasb.org/1943274/2147482689/260-10-45-2
Reference 11: http://www.xbrl.org/2003/role/disclosureRef
-Topic 260
-SubTopic 10
-Name Accounting Standards Codification
-Section 45
-Paragraph 60B
-Subparagraph (d)
-Publisher FASB
-URI https://asc.fasb.org/1943274/2147482689/260-10-45-60B
Reference 12: http://www.xbrl.org/2003/role/disclosureRef
-Topic 250
-SubTopic 10
-Name Accounting Standards Codification
-Section 50
-Paragraph 4
-Publisher FASB
-URI https://asc.fasb.org/1943274/2147483443/250-10-50-4
Reference 13: http://www.xbrl.org/2009/role/commonPracticeRef
-Topic 944
-SubTopic 220
-Name Accounting Standards Codification
-Section S99
-Paragraph 1
-Subparagraph (SX 210.7-04(23))
-Publisher FASB
-URI https://asc.fasb.org/1943274/2147477250/944-220-S99-1
Reference 14: http://www.xbrl.org/2003/role/disclosureRef
-Topic 220
-SubTopic 10
-Name Accounting Standards Codification
-Section S99
-Paragraph 2
-Subparagraph (SX 210.5-03(25))
-Publisher FASB
-URI https://asc.fasb.org/1943274/2147483621/220-10-S99-2
Reference 15: http://www.xbrl.org/2003/role/disclosureRef
-Topic 942
-SubTopic 220
-Name Accounting Standards Codification
-Section S99
-Paragraph 1
-Subparagraph (SX 210.9-04(27))
-Publisher FASB
-URI https://asc.fasb.org/1943274/2147478524/942-220-S99-1
Reference 16: http://www.xbrl.org/2003/role/disclosureRef
-Topic 260
-SubTopic 10
-Name Accounting Standards Codification
-Section 45
-Paragraph 7
-Publisher FASB
-URI https://asc.fasb.org/1943274/2147482689/260-10-45-7
Reference 17: http://fasb.org/us-gaap/role/ref/legacyRef
-Topic 942
-SubTopic 220
-Name Accounting Standards Codification
-Section S99
-Paragraph 1
-Subparagraph (SX 210.9-04(20))
-Publisher FASB
-URI https://asc.fasb.org/1943274/2147478524/942-220-S99-1
| Name: |
us-gaap_IncomeLossFromContinuingOperationsPerBasicShare |
| Namespace Prefix: |
us-gaap_ |
| Data Type: |
dtr-types:perShareItemType |
| Balance Type: |
na |
| Period Type: |
duration |
|
| X |
- DefinitionThe amount of net income (loss) derived from continuing operations during the period available to each share of common stock or common unit outstanding during the reporting period and to each share or unit that would have been outstanding assuming the issuance of common shares or units for all dilutive potential common shares or units outstanding during the reporting period. Reference 1: http://www.xbrl.org/2003/role/disclosureRef
-Topic 250
-SubTopic 10
-Name Accounting Standards Codification
-Section 50
-Paragraph 6
-Publisher FASB
-URI https://asc.fasb.org/1943274/2147483443/250-10-50-6
Reference 2: http://www.xbrl.org/2003/role/disclosureRef
-Topic 805
-SubTopic 60
-Name Accounting Standards Codification
-Section 65
-Paragraph 1
-Subparagraph (g)
-Publisher FASB
-URI https://asc.fasb.org/1943274/2147476176/805-60-65-1
Reference 3: http://fasb.org/us-gaap/role/ref/legacyRef
-Topic 220
-SubTopic 10
-Name Accounting Standards Codification
-Section S99
-Paragraph 2
-Subparagraph (SX 210.5-03(13))
-Publisher FASB
-URI https://asc.fasb.org/1943274/2147483621/220-10-S99-2
Reference 4: http://www.xbrl.org/2003/role/disclosureRef
-Topic 250
-SubTopic 10
-Name Accounting Standards Codification
-Section 50
-Paragraph 3
-Publisher FASB
-URI https://asc.fasb.org/1943274/2147483443/250-10-50-3
Reference 5: http://www.xbrl.org/2003/role/disclosureRef
-Topic 250
-SubTopic 10
-Name Accounting Standards Codification
-Section 50
-Paragraph 1
-Subparagraph (b)(2)
-Publisher FASB
-URI https://asc.fasb.org/1943274/2147483443/250-10-50-1
Reference 6: http://www.xbrl.org/2003/role/disclosureRef
-Topic 815
-SubTopic 40
-Name Accounting Standards Codification
-Section 65
-Paragraph 1
-Subparagraph (f)
-Publisher FASB
-URI https://asc.fasb.org/1943274/2147480175/815-40-65-1
Reference 7: http://www.xbrl.org/2003/role/disclosureRef
-Topic 250
-SubTopic 10
-Name Accounting Standards Codification
-Section 50
-Paragraph 11
-Subparagraph (a)
-Publisher FASB
-URI https://asc.fasb.org/1943274/2147483443/250-10-50-11
Reference 8: http://www.xbrl.org/2003/role/disclosureRef
-Topic 250
-SubTopic 10
-Name Accounting Standards Codification
-Section 50
-Paragraph 11
-Subparagraph (b)
-Publisher FASB
-URI https://asc.fasb.org/1943274/2147483443/250-10-50-11
Reference 9: http://www.xbrl.org/2003/role/disclosureRef
-Topic 260
-SubTopic 10
-Name Accounting Standards Codification
-Section 45
-Paragraph 2
-Publisher FASB
-URI https://asc.fasb.org/1943274/2147482689/260-10-45-2
Reference 10: http://www.xbrl.org/2003/role/disclosureRef
-Topic 260
-SubTopic 10
-Name Accounting Standards Codification
-Section 45
-Paragraph 60B
-Subparagraph (d)
-Publisher FASB
-URI https://asc.fasb.org/1943274/2147482689/260-10-45-60B
Reference 11: http://www.xbrl.org/2003/role/disclosureRef
-Topic 250
-SubTopic 10
-Name Accounting Standards Codification
-Section 50
-Paragraph 4
-Publisher FASB
-URI https://asc.fasb.org/1943274/2147483443/250-10-50-4
Reference 12: http://www.xbrl.org/2009/role/commonPracticeRef
-Topic 944
-SubTopic 220
-Name Accounting Standards Codification
-Section S99
-Paragraph 1
-Subparagraph (SX 210.7-04(23))
-Publisher FASB
-URI https://asc.fasb.org/1943274/2147477250/944-220-S99-1
Reference 13: http://www.xbrl.org/2003/role/disclosureRef
-Topic 260
-SubTopic 10
-Name Accounting Standards Codification
-Section 50
-Paragraph 1
-Subparagraph (a)
-Publisher FASB
-URI https://asc.fasb.org/1943274/2147482662/260-10-50-1
Reference 14: http://www.xbrl.org/2003/role/disclosureRef
-Topic 220
-SubTopic 10
-Name Accounting Standards Codification
-Section S99
-Paragraph 2
-Subparagraph (SX 210.5-03(25))
-Publisher FASB
-URI https://asc.fasb.org/1943274/2147483621/220-10-S99-2
Reference 15: http://www.xbrl.org/2003/role/disclosureRef
-Topic 942
-SubTopic 220
-Name Accounting Standards Codification
-Section S99
-Paragraph 1
-Subparagraph (SX 210.9-04(27))
-Publisher FASB
-URI https://asc.fasb.org/1943274/2147478524/942-220-S99-1
Reference 16: http://www.xbrl.org/2003/role/disclosureRef
-Topic 260
-SubTopic 10
-Name Accounting Standards Codification
-Section 45
-Paragraph 7
-Publisher FASB
-URI https://asc.fasb.org/1943274/2147482689/260-10-45-7
| Name: |
us-gaap_IncomeLossFromContinuingOperationsPerDilutedShare |
| Namespace Prefix: |
us-gaap_ |
| Data Type: |
dtr-types:perShareItemType |
| Balance Type: |
na |
| Period Type: |
duration |
|
| X |
- DefinitionInterest and debt related expenses associated with nonoperating financing activities of the entity. Reference 1: http://www.xbrl.org/2009/role/commonPracticeRef
-Topic 220
-SubTopic 10
-Name Accounting Standards Codification
-Section S99
-Paragraph 2
-Subparagraph (SX 210.5-03(8))
-Publisher FASB
-URI https://asc.fasb.org/1943274/2147483621/220-10-S99-2
| Name: |
us-gaap_InterestAndDebtExpense |
| Namespace Prefix: |
us-gaap_ |
| Data Type: |
xbrli:monetaryItemType |
| Balance Type: |
debit |
| Period Type: |
duration |
|
| X |
- DefinitionThe portion of profit or loss for the period, net of income taxes, which is attributable to the parent. Reference 1: http://www.xbrl.org/2003/role/disclosureRef
-Topic 250
-SubTopic 10
-Name Accounting Standards Codification
-Section 50
-Paragraph 6
-Publisher FASB
-URI https://asc.fasb.org/1943274/2147483443/250-10-50-6
Reference 2: http://www.xbrl.org/2003/role/disclosureRef
-Topic 250
-SubTopic 10
-Name Accounting Standards Codification
-Section 50
-Paragraph 9
-Publisher FASB
-URI https://asc.fasb.org/1943274/2147483443/250-10-50-9
Reference 3: http://www.xbrl.org/2003/role/disclosureRef
-Topic 805
-SubTopic 60
-Name Accounting Standards Codification
-Section 65
-Paragraph 1
-Subparagraph (g)
-Publisher FASB
-URI https://asc.fasb.org/1943274/2147476176/805-60-65-1
Reference 4: http://www.xbrl.org/2003/role/disclosureRef
-Topic 740
-SubTopic 323
-Name Accounting Standards Codification
-Section 65
-Paragraph 2
-Subparagraph (g)(3)
-Publisher FASB
-URI https://asc.fasb.org/1943274/2147478666/740-323-65-2
Reference 5: http://fasb.org/us-gaap/role/ref/legacyRef
-Topic 220
-SubTopic 10
-Name Accounting Standards Codification
-Section S99
-Paragraph 2
-Subparagraph (SX 210.5-03(20))
-Publisher FASB
-URI https://asc.fasb.org/1943274/2147483621/220-10-S99-2
Reference 6: http://www.xbrl.org/2003/role/disclosureRef
-Topic 235
-SubTopic 10
-Name Accounting Standards Codification
-Section S99
-Paragraph 1
-Subparagraph (SX 210.4-08(g)(1)(ii))
-Publisher FASB
-URI https://asc.fasb.org/1943274/2147480678/235-10-S99-1
Reference 7: http://www.xbrl.org/2003/role/disclosureRef
-Topic 323
-SubTopic 10
-Name Accounting Standards Codification
-Section 50
-Paragraph 3
-Subparagraph (c)
-Publisher FASB
-URI https://asc.fasb.org/1943274/2147481687/323-10-50-3
Reference 8: http://www.xbrl.org/2003/role/disclosureRef
-Topic 825
-SubTopic 10
-Name Accounting Standards Codification
-Section 50
-Paragraph 28
-Subparagraph (f)
-Publisher FASB
-URI https://asc.fasb.org/1943274/2147482907/825-10-50-28
Reference 9: http://www.xbrl.org/2003/role/disclosureRef
-Topic 220
-SubTopic 10
-Name Accounting Standards Codification
-Section 50
-Paragraph 6
-Publisher FASB
-URI https://asc.fasb.org/1943274/2147482765/220-10-50-6
Reference 10: http://www.xbrl.org/2003/role/disclosureRef
-Topic 250
-SubTopic 10
-Name Accounting Standards Codification
-Section 50
-Paragraph 3
-Publisher FASB
-URI https://asc.fasb.org/1943274/2147483443/250-10-50-3
Reference 11: http://www.xbrl.org/2003/role/disclosureRef
-Topic 250
-SubTopic 10
-Name Accounting Standards Codification
-Section 50
-Paragraph 1
-Subparagraph (b)(2)
-Publisher FASB
-URI https://asc.fasb.org/1943274/2147483443/250-10-50-1
Reference 12: http://www.xbrl.org/2003/role/disclosureRef
-Topic 815
-SubTopic 40
-Name Accounting Standards Codification
-Section 65
-Paragraph 1
-Subparagraph (f)
-Publisher FASB
-URI https://asc.fasb.org/1943274/2147480175/815-40-65-1
Reference 13: http://www.xbrl.org/2003/role/disclosureRef
-Topic 250
-SubTopic 10
-Name Accounting Standards Codification
-Section 50
-Paragraph 8
-Publisher FASB
-URI https://asc.fasb.org/1943274/2147483443/250-10-50-8
Reference 14: http://www.xbrl.org/2003/role/disclosureRef
-Topic 250
-SubTopic 10
-Name Accounting Standards Codification
-Section 50
-Paragraph 11
-Subparagraph (a)
-Publisher FASB
-URI https://asc.fasb.org/1943274/2147483443/250-10-50-11
Reference 15: http://www.xbrl.org/2003/role/disclosureRef
-Topic 250
-SubTopic 10
-Name Accounting Standards Codification
-Section 50
-Paragraph 11
-Subparagraph (b)
-Publisher FASB
-URI https://asc.fasb.org/1943274/2147483443/250-10-50-11
Reference 16: http://www.xbrl.org/2003/role/disclosureRef
-Topic 250
-SubTopic 10
-Name Accounting Standards Codification
-Section 50
-Paragraph 4
-Publisher FASB
-URI https://asc.fasb.org/1943274/2147483443/250-10-50-4
Reference 17: http://www.xbrl.org/2003/role/exampleRef
-Topic 946
-SubTopic 830
-Name Accounting Standards Codification
-Section 55
-Paragraph 10
-Publisher FASB
-URI https://asc.fasb.org/1943274/2147479168/946-830-55-10
Reference 18: http://www.xbrl.org/2003/role/disclosureRef
-Topic 946
-SubTopic 220
-Name Accounting Standards Codification
-Section 45
-Paragraph 7
-Publisher FASB
-URI https://asc.fasb.org/1943274/2147479105/946-220-45-7
Reference 19: http://www.xbrl.org/2003/role/disclosureRef
-Topic 944
-SubTopic 220
-Name Accounting Standards Codification
-Section S99
-Paragraph 1
-Subparagraph (SX 210.7-04(18))
-Publisher FASB
-URI https://asc.fasb.org/1943274/2147477250/944-220-S99-1
Reference 20: http://www.xbrl.org/2003/role/disclosureRef
-Topic 946
-SubTopic 220
-Name Accounting Standards Codification
-Section S99
-Paragraph 1
-Subparagraph (SX 210.6-07(9))
-Publisher FASB
-URI https://asc.fasb.org/1943274/2147479134/946-220-S99-1
Reference 21: http://www.xbrl.org/2003/role/disclosureRef
-Topic 946
-SubTopic 220
-Name Accounting Standards Codification
-Section S99
-Paragraph 3
-Subparagraph (SX 210.6-09(1)(d))
-Publisher FASB
-URI https://asc.fasb.org/1943274/2147479134/946-220-S99-3
Reference 22: http://www.xbrl.org/2003/role/disclosureRef
-Topic 470
-SubTopic 10
-Name Accounting Standards Codification
-Section S99
-Paragraph 1A
-Subparagraph (SX 210.13-01(a)(4)(i))
-Publisher FASB
-URI https://asc.fasb.org/1943274/2147480097/470-10-S99-1A
Reference 23: http://www.xbrl.org/2009/role/commonPracticeRef
-Topic 470
-SubTopic 10
-Name Accounting Standards Codification
-Section S99
-Paragraph 1A
-Subparagraph (SX 210.13-01(a)(4)(ii))
-Publisher FASB
-URI https://asc.fasb.org/1943274/2147480097/470-10-S99-1A
Reference 24: http://www.xbrl.org/2003/role/disclosureRef
-Topic 470
-SubTopic 10
-Name Accounting Standards Codification
-Section S99
-Paragraph 1A
-Subparagraph (SX 210.13-01(a)(4)(iii)(A))
-Publisher FASB
-URI https://asc.fasb.org/1943274/2147480097/470-10-S99-1A
Reference 25: http://www.xbrl.org/2003/role/disclosureRef
-Topic 470
-SubTopic 10
-Name Accounting Standards Codification
-Section S99
-Paragraph 1A
-Subparagraph (SX 210.13-01(a)(4)(iv))
-Publisher FASB
-URI https://asc.fasb.org/1943274/2147480097/470-10-S99-1A
Reference 26: http://www.xbrl.org/2003/role/disclosureRef
-Topic 470
-SubTopic 10
-Name Accounting Standards Codification
-Section S99
-Paragraph 1A
-Subparagraph (SX 210.13-01(a)(5))
-Publisher FASB
-URI https://asc.fasb.org/1943274/2147480097/470-10-S99-1A
Reference 27: http://www.xbrl.org/2003/role/disclosureRef
-Topic 470
-SubTopic 10
-Name Accounting Standards Codification
-Section S99
-Paragraph 1B
-Subparagraph (SX 210.13-02(a)(4)(i))
-Publisher FASB
-URI https://asc.fasb.org/1943274/2147480097/470-10-S99-1B
Reference 28: http://www.xbrl.org/2003/role/disclosureRef
-Topic 470
-SubTopic 10
-Name Accounting Standards Codification
-Section S99
-Paragraph 1B
-Subparagraph (SX 210.13-02(a)(4)(iii)(A))
-Publisher FASB
-URI https://asc.fasb.org/1943274/2147480097/470-10-S99-1B
Reference 29: http://www.xbrl.org/2003/role/disclosureRef
-Topic 470
-SubTopic 10
-Name Accounting Standards Codification
-Section S99
-Paragraph 1B
-Subparagraph (SX 210.13-02(a)(4)(iii)(B))
-Publisher FASB
-URI https://asc.fasb.org/1943274/2147480097/470-10-S99-1B
Reference 30: http://www.xbrl.org/2003/role/disclosureRef
-Topic 470
-SubTopic 10
-Name Accounting Standards Codification
-Section S99
-Paragraph 1B
-Subparagraph (SX 210.13-02(a)(4)(iv))
-Publisher FASB
-URI https://asc.fasb.org/1943274/2147480097/470-10-S99-1B
Reference 31: http://www.xbrl.org/2003/role/disclosureRef
-Topic 470
-SubTopic 10
-Name Accounting Standards Codification
-Section S99
-Paragraph 1B
-Subparagraph (SX 210.13-02(a)(5))
-Publisher FASB
-URI https://asc.fasb.org/1943274/2147480097/470-10-S99-1B
Reference 32: http://www.xbrl.org/2003/role/disclosureRef
-Topic 260
-SubTopic 10
-Name Accounting Standards Codification
-Section 45
-Paragraph 60B
-Subparagraph (a)
-Publisher FASB
-URI https://asc.fasb.org/1943274/2147482689/260-10-45-60B
Reference 33: http://www.xbrl.org/2003/role/disclosureRef
-Topic 205
-SubTopic 20
-Name Accounting Standards Codification
-Section 50
-Paragraph 7
-Publisher FASB
-URI https://asc.fasb.org/1943274/2147483499/205-20-50-7
Reference 34: http://fasb.org/us-gaap/role/ref/legacyRef
-Topic 230
-SubTopic 10
-Name Accounting Standards Codification
-Section 45
-Paragraph 28
-Publisher FASB
-URI https://asc.fasb.org/1943274/2147482740/230-10-45-28
Reference 35: http://www.xbrl.org/2003/role/disclosureRef
-Topic 220
-SubTopic 10
-Name Accounting Standards Codification
-Section 45
-Paragraph 1A
-Subparagraph (a)
-Publisher FASB
-URI https://asc.fasb.org/1943274/2147482790/220-10-45-1A
Reference 36: http://www.xbrl.org/2003/role/disclosureRef
-Topic 220
-SubTopic 10
-Name Accounting Standards Codification
-Section 45
-Paragraph 1B
-Subparagraph (a)
-Publisher FASB
-URI https://asc.fasb.org/1943274/2147482790/220-10-45-1B
Reference 37: http://fasb.org/us-gaap/role/ref/legacyRef
-Topic 942
-SubTopic 220
-Name Accounting Standards Codification
-Section S99
-Paragraph 1
-Subparagraph (SX 210.9-04(22))
-Publisher FASB
-URI https://asc.fasb.org/1943274/2147478524/942-220-S99-1
| Name: |
us-gaap_NetIncomeLoss |
| Namespace Prefix: |
us-gaap_ |
| Data Type: |
xbrli:monetaryItemType |
| Balance Type: |
credit |
| Period Type: |
duration |
|
| X |
- DefinitionAmount of income (expense) related to nonoperating activities, classified as other. Reference 1: http://fasb.org/us-gaap/role/ref/legacyRef
-Topic 220
-SubTopic 10
-Name Accounting Standards Codification
-Section S99
-Paragraph 2
-Subparagraph (SX 210.5-03(9))
-Publisher FASB
-URI https://asc.fasb.org/1943274/2147483621/220-10-S99-2
| Name: |
us-gaap_OtherNonoperatingIncomeExpense |
| Namespace Prefix: |
us-gaap_ |
| Data Type: |
xbrli:monetaryItemType |
| Balance Type: |
credit |
| Period Type: |
duration |
|
| X |
- DefinitionAmount of cost (reversal of cost) for pension and other postretirement benefits.
| Name: |
us-gaap_PensionAndOtherPostretirementBenefitExpense |
| Namespace Prefix: |
us-gaap_ |
| Data Type: |
xbrli:monetaryItemType |
| Balance Type: |
debit |
| Period Type: |
duration |
|
| X |
- DefinitionAmount of expense for research and development. Includes, but is not limited to, cost for computer software product to be sold, leased, or otherwise marketed and writeoff of research and development assets acquired in transaction other than business combination or joint venture formation or both. Excludes write-down of intangible asset acquired in business combination or from joint venture formation or both, used in research and development activity. Reference 1: http://www.xbrl.org/2003/role/exampleRef
-Topic 280
-SubTopic 10
-Name Accounting Standards Codification
-Section 55
-Paragraph 48
-Publisher FASB
-URI https://asc.fasb.org/1943274/2147482785/280-10-55-48
Reference 2: http://www.xbrl.org/2003/role/disclosureRef
-Topic 985
-SubTopic 20
-Name Accounting Standards Codification
-Section 50
-Paragraph 2
-Publisher FASB
-URI https://asc.fasb.org/1943274/2147481283/985-20-50-2
Reference 3: http://www.xbrl.org/2003/role/disclosureRef
-Topic 730
-SubTopic 10
-Name Accounting Standards Codification
-Section 50
-Paragraph 1
-Publisher FASB
-URI https://asc.fasb.org/1943274/2147482916/730-10-50-1
Reference 4: http://www.xbrl.org/2009/role/commonPracticeRef
-Topic 912
-SubTopic 730
-Name Accounting Standards Codification
-Section 25
-Paragraph 1
-Publisher FASB
-URI https://asc.fasb.org/1943274/2147479532/912-730-25-1
| Name: |
us-gaap_ResearchAndDevelopmentExpense |
| Namespace Prefix: |
us-gaap_ |
| Data Type: |
xbrli:monetaryItemType |
| Balance Type: |
debit |
| Period Type: |
duration |
|
| X |
- References
+ Details
| Name: |
us-gaap_RevenuesAbstract |
| Namespace Prefix: |
us-gaap_ |
| Data Type: |
xbrli:stringItemType |
| Balance Type: |
na |
| Period Type: |
duration |
|
| X |
- DefinitionThe aggregate total costs related to selling a firm's product and services, as well as all other general and administrative expenses. Direct selling expenses (for example, credit, warranty, and advertising) are expenses that can be directly linked to the sale of specific products. Indirect selling expenses are expenses that cannot be directly linked to the sale of specific products, for example telephone expenses, Internet, and postal charges. General and administrative expenses include salaries of non-sales personnel, rent, utilities, communication, etc. Reference 1: http://fasb.org/us-gaap/role/ref/legacyRef
-Topic 220
-SubTopic 10
-Name Accounting Standards Codification
-Section S99
-Paragraph 2
-Subparagraph (SX 210.5-03(4))
-Publisher FASB
-URI https://asc.fasb.org/1943274/2147483621/220-10-S99-2
| Name: |
us-gaap_SellingGeneralAndAdministrativeExpense |
| Namespace Prefix: |
us-gaap_ |
| Data Type: |
xbrli:monetaryItemType |
| Balance Type: |
debit |
| Period Type: |
duration |
|
| X |
- DefinitionThe average number of shares or units issued and outstanding that are used in calculating diluted EPS or earnings per unit (EPU), determined based on the timing of issuance of shares or units in the period. Reference 1: http://www.xbrl.org/2003/role/disclosureRef
-Topic 260
-SubTopic 10
-Name Accounting Standards Codification
-Section 50
-Paragraph 1
-Subparagraph (a)
-Publisher FASB
-URI https://asc.fasb.org/1943274/2147482662/260-10-50-1
Reference 2: http://www.xbrl.org/2003/role/disclosureRef
-Topic 260
-SubTopic 10
-Name Accounting Standards Codification
-Section 45
-Paragraph 16
-Publisher FASB
-URI https://asc.fasb.org/1943274/2147482689/260-10-45-16
| Name: |
us-gaap_WeightedAverageNumberOfDilutedSharesOutstanding |
| Namespace Prefix: |
us-gaap_ |
| Data Type: |
xbrli:sharesItemType |
| Balance Type: |
na |
| Period Type: |
duration |
|
| X |
- DefinitionNumber of [basic] shares or units, after adjustment for contingently issuable shares or units and other shares or units not deemed outstanding, determined by relating the portion of time within a reporting period that common shares or units have been outstanding to the total time in that period. Reference 1: http://www.xbrl.org/2003/role/disclosureRef
-Topic 260
-SubTopic 10
-Name Accounting Standards Codification
-Section 50
-Paragraph 1
-Subparagraph (a)
-Publisher FASB
-URI https://asc.fasb.org/1943274/2147482662/260-10-50-1
Reference 2: http://www.xbrl.org/2003/role/disclosureRef
-Topic 260
-SubTopic 10
-Name Accounting Standards Codification
-Section 45
-Paragraph 10
-Publisher FASB
-URI https://asc.fasb.org/1943274/2147482689/260-10-45-10
| Name: |
us-gaap_WeightedAverageNumberOfSharesOutstandingBasic |
| Namespace Prefix: |
us-gaap_ |
| Data Type: |
xbrli:sharesItemType |
| Balance Type: |
na |
| Period Type: |
duration |
|
| X |
- Details
| Name: |
srt_ProductOrServiceAxis=us-gaap_ProductMember |
| Namespace Prefix: |
|
| Data Type: |
na |
| Balance Type: |
|
| Period Type: |
|
|
| X |
- Details
| Name: |
srt_ProductOrServiceAxis=us-gaap_ShippingAndHandlingMember |
| Namespace Prefix: |
|
| Data Type: |
na |
| Balance Type: |
|
| Period Type: |
|
|
v3.24.3
Consolidated Statements Of Comprehensive Income (Loss) - USD ($)
$ in Thousands |
3 Months Ended |
9 Months Ended |
Sep. 30, 2024 |
Sep. 30, 2023 |
Sep. 30, 2024 |
Sep. 30, 2023 |
| Net Income (Loss) Attributable to Parent |
$ (3,946)
|
$ (50,380)
|
$ 8,134
|
$ (70,314)
|
| Other Comprehensive Income (Loss), Net of Tax [Abstract] |
|
|
|
|
| Other Comprehensive Income (Loss), Foreign Currency Transaction and Translation Adjustment, Net of Tax |
1,496
|
(1,818)
|
(5,740)
|
923
|
| Other Comprehensive Income (Loss), Cash Flow Hedge, Gain (Loss), after Reclassification and Tax |
423
|
69
|
(942)
|
1,706
|
| Other Comprehensive Income (Loss), Defined Benefit Plan, Gain (Loss) Arising During Period, after Tax |
|
442
|
|
442
|
| Post-Tax Actuarial Loss for Pension Settlement |
|
20,031
|
|
20,031
|
| Other Comprehensive (Income) Loss, Defined Benefit Plan, Reclassification Adjustment from AOCI, after Tax |
(27)
|
1,949
|
(82)
|
6,522
|
| Other Comprehensive Income (Loss), Net of Tax, Portion Attributable to Parent, Total |
1,892
|
20,673
|
(6,764)
|
29,624
|
| Comprehensive Income (Loss), Net of Tax, Attributable to Parent, Total |
(2,054)
|
(29,707)
|
1,370
|
(40,690)
|
| Retained Earnings [Member] |
|
|
|
|
| Net Income (Loss) Attributable to Parent |
(3,946)
|
(50,380)
|
8,134
|
(70,314)
|
| AOCI Attributable to Parent [Member] |
|
|
|
|
| Other Comprehensive Income (Loss), Net of Tax [Abstract] |
|
|
|
|
| Other Comprehensive Income (Loss), Foreign Currency Transaction and Translation Adjustment, Net of Tax |
1,496
|
(1,818)
|
(5,740)
|
923
|
| Other Comprehensive Income (Loss), Cash Flow Hedge, Gain (Loss), after Reclassification and Tax |
423
|
69
|
(942)
|
1,706
|
| Other Comprehensive Income (Loss), Defined Benefit Plan, Gain (Loss) Arising During Period, after Tax |
0
|
442
|
0
|
442
|
| Post-Tax Actuarial Loss for Pension Settlement |
0
|
20,031
|
0
|
20,031
|
| Other Comprehensive (Income) Loss, Defined Benefit Plan, Reclassification Adjustment from AOCI, after Tax |
$ (27)
|
$ 1,949
|
$ (82)
|
$ 6,522
|
| X |
- DefinitionPost-Tax Actuarial Loss for Pension Settlement
| Name: |
tg_PostTaxActuarialLossForPensionSettlement |
| Namespace Prefix: |
tg_ |
| Data Type: |
xbrli:monetaryItemType |
| Balance Type: |
credit |
| Period Type: |
duration |
|
| X |
- DefinitionAmount after tax of increase (decrease) in equity from transactions and other events and circumstances from net income and other comprehensive income, attributable to parent entity. Excludes changes in equity resulting from investments by owners and distributions to owners. Reference 1: http://www.xbrl.org/2003/role/disclosureRef
-Topic 220
-SubTopic 10
-Name Accounting Standards Codification
-Section S99
-Paragraph 2
-Subparagraph (SX 210.5-03(24))
-Publisher FASB
-URI https://asc.fasb.org/1943274/2147483621/220-10-S99-2
Reference 2: http://www.xbrl.org/2003/role/disclosureRef
-Topic 942
-SubTopic 220
-Name Accounting Standards Codification
-Section S99
-Paragraph 1
-Subparagraph (SX 210.9-04(26))
-Publisher FASB
-URI https://asc.fasb.org/1943274/2147478524/942-220-S99-1
Reference 3: http://www.xbrl.org/2003/role/disclosureRef
-Topic 944
-SubTopic 220
-Name Accounting Standards Codification
-Section S99
-Paragraph 1
-Subparagraph (SX 210.7-04(22))
-Publisher FASB
-URI https://asc.fasb.org/1943274/2147477250/944-220-S99-1
Reference 4: http://www.xbrl.org/2003/role/disclosureRef
-Topic 220
-SubTopic 10
-Name Accounting Standards Codification
-Section 45
-Paragraph 1A
-Subparagraph (c)
-Publisher FASB
-URI https://asc.fasb.org/1943274/2147482790/220-10-45-1A
Reference 5: http://www.xbrl.org/2003/role/disclosureRef
-Topic 220
-SubTopic 10
-Name Accounting Standards Codification
-Section 45
-Paragraph 1B
-Subparagraph (b)
-Publisher FASB
-URI https://asc.fasb.org/1943274/2147482790/220-10-45-1B
Reference 6: http://www.xbrl.org/2003/role/disclosureRef
-Topic 944
-SubTopic 220
-Name Accounting Standards Codification
-Section S99
-Paragraph 1
-Subparagraph (SX 210.7-04(20))
-Publisher FASB
-URI https://asc.fasb.org/1943274/2147477250/944-220-S99-1
Reference 7: http://fasb.org/us-gaap/role/ref/legacyRef
-Name Accounting Standards Codification
-Topic 220
-SubTopic 10
-Section 45
-Paragraph 5
-Publisher FASB
-URI https://asc.fasb.org/1943274/2147482790/220-10-45-5
| Name: |
us-gaap_ComprehensiveIncomeNetOfTax |
| Namespace Prefix: |
us-gaap_ |
| Data Type: |
xbrli:monetaryItemType |
| Balance Type: |
credit |
| Period Type: |
duration |
|
| X |
- DefinitionThe portion of profit or loss for the period, net of income taxes, which is attributable to the parent. Reference 1: http://www.xbrl.org/2003/role/disclosureRef
-Topic 250
-SubTopic 10
-Name Accounting Standards Codification
-Section 50
-Paragraph 6
-Publisher FASB
-URI https://asc.fasb.org/1943274/2147483443/250-10-50-6
Reference 2: http://www.xbrl.org/2003/role/disclosureRef
-Topic 250
-SubTopic 10
-Name Accounting Standards Codification
-Section 50
-Paragraph 9
-Publisher FASB
-URI https://asc.fasb.org/1943274/2147483443/250-10-50-9
Reference 3: http://www.xbrl.org/2003/role/disclosureRef
-Topic 805
-SubTopic 60
-Name Accounting Standards Codification
-Section 65
-Paragraph 1
-Subparagraph (g)
-Publisher FASB
-URI https://asc.fasb.org/1943274/2147476176/805-60-65-1
Reference 4: http://www.xbrl.org/2003/role/disclosureRef
-Topic 740
-SubTopic 323
-Name Accounting Standards Codification
-Section 65
-Paragraph 2
-Subparagraph (g)(3)
-Publisher FASB
-URI https://asc.fasb.org/1943274/2147478666/740-323-65-2
Reference 5: http://fasb.org/us-gaap/role/ref/legacyRef
-Topic 220
-SubTopic 10
-Name Accounting Standards Codification
-Section S99
-Paragraph 2
-Subparagraph (SX 210.5-03(20))
-Publisher FASB
-URI https://asc.fasb.org/1943274/2147483621/220-10-S99-2
Reference 6: http://www.xbrl.org/2003/role/disclosureRef
-Topic 235
-SubTopic 10
-Name Accounting Standards Codification
-Section S99
-Paragraph 1
-Subparagraph (SX 210.4-08(g)(1)(ii))
-Publisher FASB
-URI https://asc.fasb.org/1943274/2147480678/235-10-S99-1
Reference 7: http://www.xbrl.org/2003/role/disclosureRef
-Topic 323
-SubTopic 10
-Name Accounting Standards Codification
-Section 50
-Paragraph 3
-Subparagraph (c)
-Publisher FASB
-URI https://asc.fasb.org/1943274/2147481687/323-10-50-3
Reference 8: http://www.xbrl.org/2003/role/disclosureRef
-Topic 825
-SubTopic 10
-Name Accounting Standards Codification
-Section 50
-Paragraph 28
-Subparagraph (f)
-Publisher FASB
-URI https://asc.fasb.org/1943274/2147482907/825-10-50-28
Reference 9: http://www.xbrl.org/2003/role/disclosureRef
-Topic 220
-SubTopic 10
-Name Accounting Standards Codification
-Section 50
-Paragraph 6
-Publisher FASB
-URI https://asc.fasb.org/1943274/2147482765/220-10-50-6
Reference 10: http://www.xbrl.org/2003/role/disclosureRef
-Topic 250
-SubTopic 10
-Name Accounting Standards Codification
-Section 50
-Paragraph 3
-Publisher FASB
-URI https://asc.fasb.org/1943274/2147483443/250-10-50-3
Reference 11: http://www.xbrl.org/2003/role/disclosureRef
-Topic 250
-SubTopic 10
-Name Accounting Standards Codification
-Section 50
-Paragraph 1
-Subparagraph (b)(2)
-Publisher FASB
-URI https://asc.fasb.org/1943274/2147483443/250-10-50-1
Reference 12: http://www.xbrl.org/2003/role/disclosureRef
-Topic 815
-SubTopic 40
-Name Accounting Standards Codification
-Section 65
-Paragraph 1
-Subparagraph (f)
-Publisher FASB
-URI https://asc.fasb.org/1943274/2147480175/815-40-65-1
Reference 13: http://www.xbrl.org/2003/role/disclosureRef
-Topic 250
-SubTopic 10
-Name Accounting Standards Codification
-Section 50
-Paragraph 8
-Publisher FASB
-URI https://asc.fasb.org/1943274/2147483443/250-10-50-8
Reference 14: http://www.xbrl.org/2003/role/disclosureRef
-Topic 250
-SubTopic 10
-Name Accounting Standards Codification
-Section 50
-Paragraph 11
-Subparagraph (a)
-Publisher FASB
-URI https://asc.fasb.org/1943274/2147483443/250-10-50-11
Reference 15: http://www.xbrl.org/2003/role/disclosureRef
-Topic 250
-SubTopic 10
-Name Accounting Standards Codification
-Section 50
-Paragraph 11
-Subparagraph (b)
-Publisher FASB
-URI https://asc.fasb.org/1943274/2147483443/250-10-50-11
Reference 16: http://www.xbrl.org/2003/role/disclosureRef
-Topic 250
-SubTopic 10
-Name Accounting Standards Codification
-Section 50
-Paragraph 4
-Publisher FASB
-URI https://asc.fasb.org/1943274/2147483443/250-10-50-4
Reference 17: http://www.xbrl.org/2003/role/exampleRef
-Topic 946
-SubTopic 830
-Name Accounting Standards Codification
-Section 55
-Paragraph 10
-Publisher FASB
-URI https://asc.fasb.org/1943274/2147479168/946-830-55-10
Reference 18: http://www.xbrl.org/2003/role/disclosureRef
-Topic 946
-SubTopic 220
-Name Accounting Standards Codification
-Section 45
-Paragraph 7
-Publisher FASB
-URI https://asc.fasb.org/1943274/2147479105/946-220-45-7
Reference 19: http://www.xbrl.org/2003/role/disclosureRef
-Topic 944
-SubTopic 220
-Name Accounting Standards Codification
-Section S99
-Paragraph 1
-Subparagraph (SX 210.7-04(18))
-Publisher FASB
-URI https://asc.fasb.org/1943274/2147477250/944-220-S99-1
Reference 20: http://www.xbrl.org/2003/role/disclosureRef
-Topic 946
-SubTopic 220
-Name Accounting Standards Codification
-Section S99
-Paragraph 1
-Subparagraph (SX 210.6-07(9))
-Publisher FASB
-URI https://asc.fasb.org/1943274/2147479134/946-220-S99-1
Reference 21: http://www.xbrl.org/2003/role/disclosureRef
-Topic 946
-SubTopic 220
-Name Accounting Standards Codification
-Section S99
-Paragraph 3
-Subparagraph (SX 210.6-09(1)(d))
-Publisher FASB
-URI https://asc.fasb.org/1943274/2147479134/946-220-S99-3
Reference 22: http://www.xbrl.org/2003/role/disclosureRef
-Topic 470
-SubTopic 10
-Name Accounting Standards Codification
-Section S99
-Paragraph 1A
-Subparagraph (SX 210.13-01(a)(4)(i))
-Publisher FASB
-URI https://asc.fasb.org/1943274/2147480097/470-10-S99-1A
Reference 23: http://www.xbrl.org/2009/role/commonPracticeRef
-Topic 470
-SubTopic 10
-Name Accounting Standards Codification
-Section S99
-Paragraph 1A
-Subparagraph (SX 210.13-01(a)(4)(ii))
-Publisher FASB
-URI https://asc.fasb.org/1943274/2147480097/470-10-S99-1A
Reference 24: http://www.xbrl.org/2003/role/disclosureRef
-Topic 470
-SubTopic 10
-Name Accounting Standards Codification
-Section S99
-Paragraph 1A
-Subparagraph (SX 210.13-01(a)(4)(iii)(A))
-Publisher FASB
-URI https://asc.fasb.org/1943274/2147480097/470-10-S99-1A
Reference 25: http://www.xbrl.org/2003/role/disclosureRef
-Topic 470
-SubTopic 10
-Name Accounting Standards Codification
-Section S99
-Paragraph 1A
-Subparagraph (SX 210.13-01(a)(4)(iv))
-Publisher FASB
-URI https://asc.fasb.org/1943274/2147480097/470-10-S99-1A
Reference 26: http://www.xbrl.org/2003/role/disclosureRef
-Topic 470
-SubTopic 10
-Name Accounting Standards Codification
-Section S99
-Paragraph 1A
-Subparagraph (SX 210.13-01(a)(5))
-Publisher FASB
-URI https://asc.fasb.org/1943274/2147480097/470-10-S99-1A
Reference 27: http://www.xbrl.org/2003/role/disclosureRef
-Topic 470
-SubTopic 10
-Name Accounting Standards Codification
-Section S99
-Paragraph 1B
-Subparagraph (SX 210.13-02(a)(4)(i))
-Publisher FASB
-URI https://asc.fasb.org/1943274/2147480097/470-10-S99-1B
Reference 28: http://www.xbrl.org/2003/role/disclosureRef
-Topic 470
-SubTopic 10
-Name Accounting Standards Codification
-Section S99
-Paragraph 1B
-Subparagraph (SX 210.13-02(a)(4)(iii)(A))
-Publisher FASB
-URI https://asc.fasb.org/1943274/2147480097/470-10-S99-1B
Reference 29: http://www.xbrl.org/2003/role/disclosureRef
-Topic 470
-SubTopic 10
-Name Accounting Standards Codification
-Section S99
-Paragraph 1B
-Subparagraph (SX 210.13-02(a)(4)(iii)(B))
-Publisher FASB
-URI https://asc.fasb.org/1943274/2147480097/470-10-S99-1B
Reference 30: http://www.xbrl.org/2003/role/disclosureRef
-Topic 470
-SubTopic 10
-Name Accounting Standards Codification
-Section S99
-Paragraph 1B
-Subparagraph (SX 210.13-02(a)(4)(iv))
-Publisher FASB
-URI https://asc.fasb.org/1943274/2147480097/470-10-S99-1B
Reference 31: http://www.xbrl.org/2003/role/disclosureRef
-Topic 470
-SubTopic 10
-Name Accounting Standards Codification
-Section S99
-Paragraph 1B
-Subparagraph (SX 210.13-02(a)(5))
-Publisher FASB
-URI https://asc.fasb.org/1943274/2147480097/470-10-S99-1B
Reference 32: http://www.xbrl.org/2003/role/disclosureRef
-Topic 260
-SubTopic 10
-Name Accounting Standards Codification
-Section 45
-Paragraph 60B
-Subparagraph (a)
-Publisher FASB
-URI https://asc.fasb.org/1943274/2147482689/260-10-45-60B
Reference 33: http://www.xbrl.org/2003/role/disclosureRef
-Topic 205
-SubTopic 20
-Name Accounting Standards Codification
-Section 50
-Paragraph 7
-Publisher FASB
-URI https://asc.fasb.org/1943274/2147483499/205-20-50-7
Reference 34: http://fasb.org/us-gaap/role/ref/legacyRef
-Topic 230
-SubTopic 10
-Name Accounting Standards Codification
-Section 45
-Paragraph 28
-Publisher FASB
-URI https://asc.fasb.org/1943274/2147482740/230-10-45-28
Reference 35: http://www.xbrl.org/2003/role/disclosureRef
-Topic 220
-SubTopic 10
-Name Accounting Standards Codification
-Section 45
-Paragraph 1A
-Subparagraph (a)
-Publisher FASB
-URI https://asc.fasb.org/1943274/2147482790/220-10-45-1A
Reference 36: http://www.xbrl.org/2003/role/disclosureRef
-Topic 220
-SubTopic 10
-Name Accounting Standards Codification
-Section 45
-Paragraph 1B
-Subparagraph (a)
-Publisher FASB
-URI https://asc.fasb.org/1943274/2147482790/220-10-45-1B
Reference 37: http://fasb.org/us-gaap/role/ref/legacyRef
-Topic 942
-SubTopic 220
-Name Accounting Standards Codification
-Section S99
-Paragraph 1
-Subparagraph (SX 210.9-04(22))
-Publisher FASB
-URI https://asc.fasb.org/1943274/2147478524/942-220-S99-1
| Name: |
us-gaap_NetIncomeLoss |
| Namespace Prefix: |
us-gaap_ |
| Data Type: |
xbrli:monetaryItemType |
| Balance Type: |
credit |
| Period Type: |
duration |
|
| X |
- DefinitionAmount, after tax, of gain (loss) for (increase) decrease in value of benefit obligation for change in actuarial assumptions and increase (decrease) in value of plan assets from experience different from that assumed of defined benefit plan, that has not been recognized in net periodic benefit (cost) credit. Reference 1: http://fasb.org/us-gaap/role/ref/legacyRef
-Topic 220
-SubTopic 10
-Name Accounting Standards Codification
-Section 45
-Paragraph 11
-Publisher FASB
-URI https://asc.fasb.org/1943274/2147482790/220-10-45-11
Reference 2: http://fasb.org/us-gaap/role/ref/legacyRef
-Topic 220
-SubTopic 10
-Name Accounting Standards Codification
-Section 45
-Paragraph 10A
-Subparagraph (i)
-Publisher FASB
-URI https://asc.fasb.org/1943274/2147482790/220-10-45-10A
Reference 3: http://www.xbrl.org/2003/role/disclosureRef
-Topic 715
-SubTopic 20
-Name Accounting Standards Codification
-Section 50
-Paragraph 1
-Subparagraph (i)
-Publisher FASB
-URI https://asc.fasb.org/1943274/2147480506/715-20-50-1
| Name: |
us-gaap_OtherComprehensiveIncomeDefinedBenefitPlansNetUnamortizedGainLossArisingDuringPeriodNetOfTax |
| Namespace Prefix: |
us-gaap_ |
| Data Type: |
xbrli:monetaryItemType |
| Balance Type: |
credit |
| Period Type: |
duration |
|
| X |
- DefinitionAmount, after tax and reclassification, of gain (loss) from derivative instrument designated and qualifying as cash flow hedge included in assessment of hedge effectiveness. Reference 1: http://www.xbrl.org/2003/role/disclosureRef
-Topic 944
-SubTopic 220
-Name Accounting Standards Codification
-Section S99
-Paragraph 1
-Subparagraph (SX 210.7-04(19))
-Publisher FASB
-URI https://asc.fasb.org/1943274/2147477250/944-220-S99-1
Reference 2: http://www.xbrl.org/2003/role/disclosureRef
-Topic 220
-SubTopic 10
-Name Accounting Standards Codification
-Section 45
-Paragraph 11
-Publisher FASB
-URI https://asc.fasb.org/1943274/2147482790/220-10-45-11
Reference 3: http://www.xbrl.org/2003/role/disclosureRef
-Topic 220
-SubTopic 10
-Name Accounting Standards Codification
-Section 45
-Paragraph 10A
-Subparagraph (d)
-Publisher FASB
-URI https://asc.fasb.org/1943274/2147482790/220-10-45-10A
| Name: |
us-gaap_OtherComprehensiveIncomeLossCashFlowHedgeGainLossAfterReclassificationAndTax |
| Namespace Prefix: |
us-gaap_ |
| Data Type: |
xbrli:monetaryItemType |
| Balance Type: |
credit |
| Period Type: |
duration |
|
| X |
- DefinitionAmount after tax and reclassification adjustments of gain (loss) on foreign currency translation adjustments, foreign currency transactions designated and effective as economic hedges of a net investment in a foreign entity and intra-entity foreign currency transactions that are of a long-term-investment nature. Reference 1: http://fasb.org/us-gaap/role/ref/legacyRef
-Name Accounting Standards Codification
-Section 45
-Paragraph 10A
-Subparagraph (a)
-SubTopic 10
-Topic 220
-Publisher FASB
-URI https://asc.fasb.org/1943274/2147482790/220-10-45-10A
Reference 2: http://www.xbrl.org/2003/role/disclosureRef
-Topic 944
-SubTopic 220
-Name Accounting Standards Codification
-Section S99
-Paragraph 1
-Subparagraph (SX 210.7-04(19))
-Publisher FASB
-URI https://asc.fasb.org/1943274/2147477250/944-220-S99-1
| Name: |
us-gaap_OtherComprehensiveIncomeLossForeignCurrencyTransactionAndTranslationAdjustmentNetOfTax |
| Namespace Prefix: |
us-gaap_ |
| Data Type: |
xbrli:monetaryItemType |
| Balance Type: |
credit |
| Period Type: |
duration |
|
| X |
- References
+ Details
| Name: |
us-gaap_OtherComprehensiveIncomeLossNetOfTaxPeriodIncreaseDecreaseAbstract |
| Namespace Prefix: |
us-gaap_ |
| Data Type: |
xbrli:stringItemType |
| Balance Type: |
na |
| Period Type: |
duration |
|
| X |
- DefinitionAmount after tax of other comprehensive income (loss) attributable to parent entity. Reference 1: http://fasb.org/us-gaap/role/ref/legacyRef
-Topic 810
-SubTopic 10
-Name Accounting Standards Codification
-Section 45
-Paragraph 19
-Publisher FASB
-URI https://asc.fasb.org/1943274/2147481231/810-10-45-19
Reference 2: http://fasb.org/us-gaap/role/ref/legacyRef
-Name Accounting Standards Codification
-Section 45
-Paragraph 20
-SubTopic 10
-Topic 810
-Publisher FASB
-URI https://asc.fasb.org/1943274/2147481231/810-10-45-20
Reference 3: http://fasb.org/us-gaap/role/ref/legacyRef
-Name Accounting Standards Codification
-Section 50
-Paragraph 1A
-Subparagraph (c)(3)
-SubTopic 10
-Topic 810
-Publisher FASB
-URI https://asc.fasb.org/1943274/2147481203/810-10-50-1A
Reference 4: http://www.xbrl.org/2003/role/disclosureRef
-Topic 250
-SubTopic 10
-Name Accounting Standards Codification
-Section 50
-Paragraph 6
-Publisher FASB
-URI https://asc.fasb.org/1943274/2147483443/250-10-50-6
Reference 5: http://www.xbrl.org/2003/role/disclosureRef
-Topic 220
-SubTopic 10
-Name Accounting Standards Codification
-Section 45
-Paragraph 1B
-Subparagraph (b)
-Publisher FASB
-URI https://asc.fasb.org/1943274/2147482790/220-10-45-1B
Reference 6: http://www.xbrl.org/2003/role/disclosureRef
-Topic 220
-SubTopic 10
-Name Accounting Standards Codification
-Section 45
-Paragraph 1A
-Subparagraph (b)
-Publisher FASB
-URI https://asc.fasb.org/1943274/2147482790/220-10-45-1A
| Name: |
us-gaap_OtherComprehensiveIncomeLossNetOfTaxPortionAttributableToParent |
| Namespace Prefix: |
us-gaap_ |
| Data Type: |
xbrli:monetaryItemType |
| Balance Type: |
credit |
| Period Type: |
duration |
|
| X |
- DefinitionAmount, after tax, of reclassification adjustment from accumulated other comprehensive (income) loss for net periodic benefit cost (credit) of defined benefit plan. Reference 1: http://fasb.org/us-gaap/role/ref/legacyRef
-Name Accounting Standards Codification
-Section 45
-Paragraph 15
-SubTopic 10
-Topic 220
-Publisher FASB
-URI https://asc.fasb.org/1943274/2147482790/220-10-45-15
Reference 2: http://fasb.org/us-gaap/role/ref/legacyRef
-Topic 220
-SubTopic 10
-Name Accounting Standards Codification
-Section 45
-Paragraph 11
-Publisher FASB
-URI https://asc.fasb.org/1943274/2147482790/220-10-45-11
Reference 3: http://fasb.org/us-gaap/role/ref/legacyRef
-Topic 715
-SubTopic 20
-Name Accounting Standards Codification
-Section 50
-Paragraph 1
-Subparagraph (i)
-Publisher FASB
-URI https://asc.fasb.org/1943274/2147480506/715-20-50-1
Reference 4: http://www.xbrl.org/2003/role/disclosureRef
-Topic 220
-SubTopic 10
-Name Accounting Standards Codification
-Section 45
-Paragraph 17A
-Publisher FASB
-URI https://asc.fasb.org/1943274/2147482790/220-10-45-17A
| Name: |
us-gaap_OtherComprehensiveIncomeLossReclassificationAdjustmentFromAOCIPensionAndOtherPostretirementBenefitPlansNetOfTax |
| Namespace Prefix: |
us-gaap_ |
| Data Type: |
xbrli:monetaryItemType |
| Balance Type: |
credit |
| Period Type: |
duration |
|
| X |
- Details
| Name: |
us-gaap_StatementEquityComponentsAxis=us-gaap_RetainedEarningsMember |
| Namespace Prefix: |
|
| Data Type: |
na |
| Balance Type: |
|
| Period Type: |
|
|
| X |
- Details
| Name: |
us-gaap_StatementEquityComponentsAxis=us-gaap_AccumulatedOtherComprehensiveIncomeMember |
| Namespace Prefix: |
|
| Data Type: |
na |
| Balance Type: |
|
| Period Type: |
|
|
v3.24.3
Consolidated Statements Of Comprehensive Income (Loss) (Parenthetical) - USD ($)
$ in Thousands |
3 Months Ended |
9 Months Ended |
Sep. 30, 2024 |
Sep. 30, 2023 |
Sep. 30, 2024 |
Sep. 30, 2023 |
| Statement of Comprehensive Income [Abstract] |
|
|
|
|
| Foreign currency translation adjustment, tax (benefit) |
$ (4)
|
$ (25)
|
$ (466)
|
$ (640)
|
| Other Comprehensive Income (Loss), Cash Flow Hedge, Gain (Loss), after Reclassification, Tax |
120
|
538
|
273
|
798
|
| Tax on Actuarial Loss for Pension Settlement |
|
5,581
|
|
5,581
|
| Amortization of prior service costs and net gains or losses, tax |
$ 7
|
$ 637
|
$ 23
|
$ 1,911
|
| X |
- DefinitionTax on Actuarial Loss for Pension Settlement
| Name: |
tg_TaxOnActuarialLossForPensionSettlement |
| Namespace Prefix: |
tg_ |
| Data Type: |
xbrli:monetaryItemType |
| Balance Type: |
credit |
| Period Type: |
duration |
|
| X |
- DefinitionAmount, after reclassification, of tax expense (benefit) for gain (loss) from derivative instrument designated and qualifying as cash flow hedge included in assessment of hedge effectiveness. Reference 1: http://www.xbrl.org/2003/role/disclosureRef
-Topic 220
-SubTopic 10
-Name Accounting Standards Codification
-Section 45
-Paragraph 12
-Publisher FASB
-URI https://asc.fasb.org/1943274/2147482790/220-10-45-12
| Name: |
us-gaap_OtherComprehensiveIncomeLossCashFlowHedgeGainLossAfterReclassificationTax |
| Namespace Prefix: |
us-gaap_ |
| Data Type: |
xbrli:monetaryItemType |
| Balance Type: |
debit |
| Period Type: |
duration |
|
| X |
- DefinitionAmount of tax expense (benefit), after reclassification adjustments of gain (loss) on foreign currency translation adjustments, foreign currency transactions designated and effective as economic hedges of a net investment in a foreign entity and intra-entity foreign currency transactions that are of a long-term-investment nature. Reference 1: http://fasb.org/us-gaap/role/ref/legacyRef
-Name Accounting Standards Codification
-Section 45
-Paragraph 10A
-Subparagraph (a)
-SubTopic 10
-Topic 220
-Publisher FASB
-URI https://asc.fasb.org/1943274/2147482790/220-10-45-10A
Reference 2: http://fasb.org/us-gaap/role/ref/legacyRef
-Name Accounting Standards Codification
-Section 45
-Paragraph 12
-SubTopic 10
-Topic 220
-Publisher FASB
-URI https://asc.fasb.org/1943274/2147482790/220-10-45-12
Reference 3: http://www.xbrl.org/2003/role/disclosureRef
-Topic 830
-SubTopic 20
-Name Accounting Standards Codification
-Section 45
-Paragraph 5
-Publisher FASB
-URI https://asc.fasb.org/1943274/2147481956/830-20-45-5
Reference 4: http://www.xbrl.org/2003/role/disclosureRef
-Topic 830
-SubTopic 30
-Name Accounting Standards Codification
-Section 45
-Paragraph 21
-Publisher FASB
-URI https://asc.fasb.org/1943274/2147481694/830-30-45-21
| Name: |
us-gaap_OtherComprehensiveIncomeLossForeignCurrencyTranslationAdjustmentTax |
| Namespace Prefix: |
us-gaap_ |
| Data Type: |
xbrli:monetaryItemType |
| Balance Type: |
debit |
| Period Type: |
duration |
|
| X |
- DefinitionAmount of tax (expense) benefit for reclassification adjustment from accumulated other comprehensive (income) loss of defined benefit plan. Reference 1: http://fasb.org/us-gaap/role/ref/legacyRef
-Name Accounting Standards Codification
-Section 45
-Paragraph 12
-SubTopic 10
-Topic 220
-Publisher FASB
-URI https://asc.fasb.org/1943274/2147482790/220-10-45-12
Reference 2: http://fasb.org/us-gaap/role/ref/legacyRef
-Topic 810
-SubTopic 10
-Name Accounting Standards Codification
-Section 45
-Paragraph 19
-Publisher FASB
-URI https://asc.fasb.org/1943274/2147481231/810-10-45-19
| Name: |
us-gaap_OtherComprehensiveIncomeLossReclassificationAdjustmentFromAOCIPensionAndOtherPostretirementBenefitPlansTax |
| Namespace Prefix: |
us-gaap_ |
| Data Type: |
xbrli:monetaryItemType |
| Balance Type: |
debit |
| Period Type: |
duration |
|
| X |
- References
+ Details
| Name: |
us-gaap_StatementOfIncomeAndComprehensiveIncomeAbstract |
| Namespace Prefix: |
us-gaap_ |
| Data Type: |
xbrli:stringItemType |
| Balance Type: |
na |
| Period Type: |
duration |
|
v3.24.3
Consolidated Statements Of Cash Flows - USD ($)
$ in Thousands |
9 Months Ended |
Sep. 30, 2024 |
Sep. 30, 2023 |
| Cash flows from operating activities: |
|
|
| Net Income (Loss) Attributable to Parent |
$ 8,134
|
$ (70,314)
|
| Adjustments for noncash items: |
|
|
| Depreciation |
18,372
|
19,516
|
| Amortization of identifiable intangibles |
1,410
|
1,433
|
| Reduction of right-of-use lease asset |
1,735
|
1,633
|
| Goodwill, Impairment Loss |
0
|
34,891
|
| Deferred income taxes |
2,975
|
(16,820)
|
| Accrued pension and post-retirement benefits |
163
|
9,955
|
| Pension settlement loss |
0
|
25,612
|
| Stock-based compensation expense |
1,950
|
1,196
|
| Gain on investment in kaléo |
(144)
|
(262)
|
| Write-down of Richmond, Virginia Technical Center assets |
0
|
3,387
|
| Changes in assets and liabilities: |
|
|
| Accounts and other receivables |
(14,683)
|
14,630
|
| Inventories |
(8,711)
|
49,589
|
| Income taxes recoverable/payable |
(952)
|
(1,688)
|
| Prepaid expenses and other |
(286)
|
(142)
|
| Accounts payable and accrued expenses |
(3,454)
|
(27,970)
|
| Lease liability |
(2,118)
|
(1,669)
|
| Pension and postretirement benefit plan contributions |
(455)
|
(455)
|
| Other, net |
2,117
|
1,716
|
| Net Cash Provided by (Used in) Operating Activities |
6,053
|
44,238
|
| Cash flows from investing activities: |
|
|
| Capital expenditures |
(7,696)
|
(22,270)
|
| Proceeds from Sale of Investment Projects |
144
|
262
|
| Net cash provided by (used in) investing activities |
(7,469)
|
(22,008)
|
| Cash flows from financing activities: |
|
|
| Borrowings |
519,274
|
87,000
|
| Debt principal payments |
(522,240)
|
(69,000)
|
| Dividends paid |
0
|
(8,884)
|
| Debt financing costs |
(587)
|
(1,404)
|
| Net cash provided by (used in) financing activities |
(3,553)
|
7,712
|
| Effect of exchange rate changes on cash |
(1,898)
|
(570)
|
| Increase (decrease) in cash, cash equivalents and restricted cash |
(6,867)
|
29,372
|
| Cash, cash equivalents, and restricted cash at beginning of period |
13,455
|
19,232
|
| Cash, cash equivalents, and restricted cash at end of period |
6,588
|
48,604
|
| Proceeds from Sale of Other Assets, Investing Activities |
$ 83
|
$ 0
|
| X |
- DefinitionIncrease decrease in net deferred taxes.
| Name: |
tg_IncreaseDecreaseInNetDeferredTaxes |
| Namespace Prefix: |
tg_ |
| Data Type: |
xbrli:monetaryItemType |
| Balance Type: |
debit |
| Period Type: |
duration |
|
| X |
- DefinitionPre-tax Actuarial Loss for Pension Settlement
| Name: |
tg_PreTaxActuarialLossForPensionSettlement |
| Namespace Prefix: |
tg_ |
| Data Type: |
xbrli:monetaryItemType |
| Balance Type: |
debit |
| Period Type: |
duration |
|
| X |
- References
+ Details
| Name: |
us-gaap_AdjustmentsNoncashItemsToReconcileNetIncomeLossToCashProvidedByUsedInOperatingActivitiesAbstract |
| Namespace Prefix: |
us-gaap_ |
| Data Type: |
xbrli:stringItemType |
| Balance Type: |
na |
| Period Type: |
duration |
|
| X |
- DefinitionAmount of expense for award under share-based payment arrangement. Excludes amount capitalized. Reference 1: http://www.xbrl.org/2003/role/disclosureRef
-Topic 718
-SubTopic 10
-Name Accounting Standards Codification
-Section S99
-Paragraph 1
-Subparagraph (SAB Topic 14.F)
-Publisher FASB
-URI https://asc.fasb.org/1943274/2147479830/718-10-S99-1
Reference 2: http://www.xbrl.org/2003/role/disclosureRef
-Topic 718
-SubTopic 10
-Name Accounting Standards Codification
-Section 50
-Paragraph 2
-Subparagraph (h)(1)(i)
-Publisher FASB
-URI https://asc.fasb.org/1943274/2147480429/718-10-50-2
| Name: |
us-gaap_AllocatedShareBasedCompensationExpense |
| Namespace Prefix: |
us-gaap_ |
| Data Type: |
xbrli:monetaryItemType |
| Balance Type: |
debit |
| Period Type: |
duration |
|
| X |
- DefinitionThe aggregate expense charged against earnings to allocate the cost of intangible assets (nonphysical assets not used in production) in a systematic and rational manner to the periods expected to benefit from such assets. As a noncash expense, this element is added back to net income when calculating cash provided by or used in operations using the indirect method. Reference 1: http://fasb.org/us-gaap/role/ref/legacyRef
-Name Accounting Standards Codification
-Section 45
-Paragraph 28
-Subparagraph (b)
-SubTopic 10
-Topic 230
-Publisher FASB
-URI https://asc.fasb.org/1943274/2147482740/230-10-45-28
Reference 2: http://www.xbrl.org/2003/role/exampleRef
-Topic 350
-SubTopic 30
-Name Accounting Standards Codification
-Section 55
-Paragraph 40
-Publisher FASB
-URI https://asc.fasb.org/1943274/2147482640/350-30-55-40
Reference 3: http://www.xbrl.org/2003/role/disclosureRef
-Topic 350
-SubTopic 30
-Name Accounting Standards Codification
-Section 50
-Paragraph 2
-Subparagraph (a)(2)
-Publisher FASB
-URI https://asc.fasb.org/1943274/2147482665/350-30-50-2
Reference 4: http://www.xbrl.org/2003/role/disclosureRef
-Topic 350
-SubTopic 30
-Name Accounting Standards Codification
-Section 45
-Paragraph 2
-Publisher FASB
-URI https://asc.fasb.org/1943274/2147482686/350-30-45-2
| Name: |
us-gaap_AmortizationOfIntangibleAssets |
| Namespace Prefix: |
us-gaap_ |
| Data Type: |
xbrli:monetaryItemType |
| Balance Type: |
debit |
| Period Type: |
duration |
|
| X |
- DefinitionAmount of cash and cash equivalents, and cash and cash equivalents restricted to withdrawal or usage. Excludes amount for disposal group and discontinued operations. Cash includes, but is not limited to, currency on hand, demand deposits with banks or financial institutions, and other accounts with general characteristics of demand deposits. Cash equivalents include, but are not limited to, short-term, highly liquid investments that are both readily convertible to known amounts of cash and so near their maturity that they present insignificant risk of changes in value because of changes in interest rates. Reference 1: http://www.xbrl.org/2003/role/disclosureRef
-Topic 230
-SubTopic 10
-Name Accounting Standards Codification
-Section 50
-Paragraph 8
-Publisher FASB
-URI https://asc.fasb.org/1943274/2147482913/230-10-50-8
Reference 2: http://fasb.org/us-gaap/role/ref/legacyRef
-Topic 230
-SubTopic 10
-Name Accounting Standards Codification
-Section 45
-Paragraph 24
-Publisher FASB
-URI https://asc.fasb.org/1943274/2147482740/230-10-45-24
Reference 3: http://fasb.org/us-gaap/role/ref/legacyRef
-Name Accounting Standards Codification
-Topic 230
-SubTopic 10
-Section 45
-Paragraph 4
-Publisher FASB
-URI https://asc.fasb.org/1943274/2147482740/230-10-45-4
| Name: |
us-gaap_CashCashEquivalentsRestrictedCashAndRestrictedCashEquivalents |
| Namespace Prefix: |
us-gaap_ |
| Data Type: |
xbrli:monetaryItemType |
| Balance Type: |
debit |
| Period Type: |
instant |
|
| X |
- DefinitionAmount of increase (decrease) in cash, cash equivalents, and cash and cash equivalents restricted to withdrawal or usage; including effect from exchange rate change. Cash includes, but is not limited to, currency on hand, demand deposits with banks or financial institutions, and other accounts with general characteristics of demand deposits. Cash equivalents include, but are not limited to, short-term, highly liquid investments that are both readily convertible to known amounts of cash and so near their maturity that they present insignificant risk of changes in value because of changes in interest rates. Reference 1: http://fasb.org/us-gaap/role/ref/legacyRef
-Topic 230
-SubTopic 10
-Name Accounting Standards Codification
-Section 45
-Paragraph 24
-Publisher FASB
-URI https://asc.fasb.org/1943274/2147482740/230-10-45-24
Reference 2: http://fasb.org/us-gaap/role/ref/legacyRef
-Name Accounting Standards Codification
-Section 45
-Paragraph 1
-SubTopic 230
-Topic 830
-Publisher FASB
-URI https://asc.fasb.org/1943274/2147477401/830-230-45-1
| Name: |
us-gaap_CashCashEquivalentsRestrictedCashAndRestrictedCashEquivalentsPeriodIncreaseDecreaseIncludingExchangeRateEffect |
| Namespace Prefix: |
us-gaap_ |
| Data Type: |
xbrli:monetaryItemType |
| Balance Type: |
debit |
| Period Type: |
duration |
|
| X |
- DefinitionThe amount of expense recognized in the current period that reflects the allocation of the cost of tangible assets over the assets' useful lives. Includes production and non-production related depreciation. Reference 1: http://fasb.org/us-gaap/role/ref/legacyRef
-Name Accounting Standards Codification
-Section 45
-Paragraph 28
-Subparagraph (b)
-SubTopic 10
-Topic 230
-Publisher FASB
-URI https://asc.fasb.org/1943274/2147482740/230-10-45-28
Reference 2: http://fasb.org/us-gaap/role/ref/legacyRef
-Name Accounting Standards Codification
-Topic 360
-SubTopic 10
-Section 50
-Paragraph 1
-Subparagraph (a)
-Publisher FASB
-URI https://asc.fasb.org/1943274/2147482099/360-10-50-1
| Name: |
us-gaap_Depreciation |
| Namespace Prefix: |
us-gaap_ |
| Data Type: |
xbrli:monetaryItemType |
| Balance Type: |
debit |
| Period Type: |
duration |
|
| X |
- DefinitionAmount of increase (decrease) from effect of exchange rate changes on cash and cash equivalents, and cash and cash equivalents restricted to withdrawal or usage; held in foreign currencies. Excludes amounts for disposal group and discontinued operations. Cash includes, but is not limited to, currency on hand, demand deposits with banks or financial institutions, and other accounts with general characteristics of demand deposits. Cash equivalents include, but are not limited to, short-term, highly liquid investments that are both readily convertible to known amounts of cash and so near their maturity that they present insignificant risk of changes in value because of changes in interest rates. Reference 1: http://www.xbrl.org/2003/role/disclosureRef
-Topic 830
-SubTopic 230
-Name Accounting Standards Codification
-Section 45
-Paragraph 1
-Publisher FASB
-URI https://asc.fasb.org/1943274/2147477401/830-230-45-1
| Name: |
us-gaap_EffectOfExchangeRateOnCashCashEquivalentsRestrictedCashAndRestrictedCashEquivalents |
| Namespace Prefix: |
us-gaap_ |
| Data Type: |
xbrli:monetaryItemType |
| Balance Type: |
debit |
| Period Type: |
duration |
|
| X |
- DefinitionAmount of impairment loss from asset representing future economic benefit arising from other asset acquired in business combination or from joint venture formation or both, that is not individually identified and separately recognized. Reference 1: http://fasb.org/us-gaap/role/ref/legacyRef
-Name Accounting Standards Codification
-Section 45
-Paragraph 28
-Subparagraph (b)
-SubTopic 10
-Topic 230
-Publisher FASB
-URI https://asc.fasb.org/1943274/2147482740/230-10-45-28
Reference 2: http://www.xbrl.org/2003/role/exampleRef
-Topic 350
-SubTopic 20
-Name Accounting Standards Codification
-Section 55
-Paragraph 24
-Publisher FASB
-URI https://asc.fasb.org/1943274/2147482548/350-20-55-24
Reference 3: http://www.xbrl.org/2003/role/disclosureRef
-Topic 350
-SubTopic 20
-Name Accounting Standards Codification
-Section 50
-Paragraph 2
-Subparagraph (b)
-Publisher FASB
-URI https://asc.fasb.org/1943274/2147482573/350-20-50-2
Reference 4: http://www.xbrl.org/2003/role/exampleRef
-Topic 820
-SubTopic 10
-Name Accounting Standards Codification
-Section 55
-Paragraph 100
-Subparagraph (d)
-Publisher FASB
-URI https://asc.fasb.org/1943274/2147482078/820-10-55-100
Reference 5: http://www.xbrl.org/2003/role/disclosureRef
-Topic 350
-SubTopic 20
-Name Accounting Standards Codification
-Section 50
-Paragraph 1
-Subparagraph (e)
-Publisher FASB
-URI https://asc.fasb.org/1943274/2147482573/350-20-50-1
Reference 6: http://www.xbrl.org/2003/role/disclosureRef
-Topic 350
-SubTopic 20
-Name Accounting Standards Codification
-Section 45
-Paragraph 2
-Publisher FASB
-URI https://asc.fasb.org/1943274/2147482598/350-20-45-2
| Name: |
us-gaap_GoodwillImpairmentLoss |
| Namespace Prefix: |
us-gaap_ |
| Data Type: |
xbrli:monetaryItemType |
| Balance Type: |
debit |
| Period Type: |
duration |
|
| X |
- DefinitionThe increase (decrease) during the reporting period in the amount due from customers for the credit sale of goods and services; includes accounts receivable and other types of receivables. Reference 1: http://fasb.org/us-gaap/role/ref/legacyRef
-Name Accounting Standards Codification
-Section 45
-Paragraph 28
-Subparagraph (a)
-SubTopic 10
-Topic 230
-Publisher FASB
-URI https://asc.fasb.org/1943274/2147482740/230-10-45-28
| Name: |
us-gaap_IncreaseDecreaseInAccountsAndOtherReceivables |
| Namespace Prefix: |
us-gaap_ |
| Data Type: |
xbrli:monetaryItemType |
| Balance Type: |
credit |
| Period Type: |
duration |
|
| X |
- DefinitionThe increase (decrease) during the reporting period in the amounts payable to vendors for goods and services received and the amount of obligations and expenses incurred but not paid. Reference 1: http://fasb.org/us-gaap/role/ref/legacyRef
-Name Accounting Standards Codification
-Section 45
-Paragraph 28
-Subparagraph (a)
-SubTopic 10
-Topic 230
-Publisher FASB
-URI https://asc.fasb.org/1943274/2147482740/230-10-45-28
| Name: |
us-gaap_IncreaseDecreaseInAccountsPayableAndAccruedLiabilities |
| Namespace Prefix: |
us-gaap_ |
| Data Type: |
xbrli:monetaryItemType |
| Balance Type: |
debit |
| Period Type: |
duration |
|
| X |
- DefinitionThe increase (decrease) during the reporting period in the aggregate value of all inventory held by the reporting entity, associated with underlying transactions that are classified as operating activities. Reference 1: http://fasb.org/us-gaap/role/ref/legacyRef
-Name Accounting Standards Codification
-Section 45
-Paragraph 28
-Subparagraph (a)
-SubTopic 10
-Topic 230
-Publisher FASB
-URI https://asc.fasb.org/1943274/2147482740/230-10-45-28
| Name: |
us-gaap_IncreaseDecreaseInInventories |
| Namespace Prefix: |
us-gaap_ |
| Data Type: |
xbrli:monetaryItemType |
| Balance Type: |
credit |
| Period Type: |
duration |
|
| X |
- References
+ Details
| Name: |
us-gaap_IncreaseDecreaseInOperatingCapitalAbstract |
| Namespace Prefix: |
us-gaap_ |
| Data Type: |
xbrli:stringItemType |
| Balance Type: |
na |
| Period Type: |
duration |
|
| X |
- DefinitionAmount of increase (decrease) in obligation for pension and other postretirement benefits. Includes, but is not limited to, defined benefit and defined contribution plans. Reference 1: http://fasb.org/us-gaap/role/ref/legacyRef
-Name Accounting Standards Codification
-Section 45
-Paragraph 28
-Subparagraph (a)
-SubTopic 10
-Topic 230
-Publisher FASB
-URI https://asc.fasb.org/1943274/2147482740/230-10-45-28
| Name: |
us-gaap_IncreaseDecreaseInPensionAndPostretirementObligations |
| Namespace Prefix: |
us-gaap_ |
| Data Type: |
xbrli:monetaryItemType |
| Balance Type: |
debit |
| Period Type: |
duration |
|
| X |
- DefinitionAmount of increase (decrease) in prepaid expenses, and assets classified as other. Reference 1: http://fasb.org/us-gaap/role/ref/legacyRef
-Name Accounting Standards Codification
-Section 45
-Paragraph 28
-Subparagraph (a)
-SubTopic 10
-Topic 230
-Publisher FASB
-URI https://asc.fasb.org/1943274/2147482740/230-10-45-28
| Name: |
us-gaap_IncreaseDecreaseInPrepaidDeferredExpenseAndOtherAssets |
| Namespace Prefix: |
us-gaap_ |
| Data Type: |
xbrli:monetaryItemType |
| Balance Type: |
credit |
| Period Type: |
duration |
|
| X |
- DefinitionAmount of loss from reductions in inventory due to subsequent measurement adjustments, including, but not limited to, physical deterioration, obsolescence, or changes in price levels. Reference 1: http://www.xbrl.org/2003/role/disclosureRef
-Topic 330
-SubTopic 10
-Name Accounting Standards Codification
-Section 50
-Paragraph 2
-Publisher FASB
-URI https://asc.fasb.org/1943274/2147483080/330-10-50-2
| Name: |
us-gaap_InventoryWriteDown |
| Namespace Prefix: |
us-gaap_ |
| Data Type: |
xbrli:monetaryItemType |
| Balance Type: |
debit |
| Period Type: |
duration |
|
| X |
- DefinitionAmount of cash inflow (outflow) from financing activities, including discontinued operations. Financing activity cash flows include obtaining resources from owners and providing them with a return on, and a return of, their investment; borrowing money and repaying amounts borrowed, or settling the obligation; and obtaining and paying for other resources obtained from creditors on long-term credit. Reference 1: http://www.xbrl.org/2003/role/disclosureRef
-Topic 230
-SubTopic 10
-Name Accounting Standards Codification
-Section 45
-Paragraph 24
-Publisher FASB
-URI https://asc.fasb.org/1943274/2147482740/230-10-45-24
| Name: |
us-gaap_NetCashProvidedByUsedInFinancingActivities |
| Namespace Prefix: |
us-gaap_ |
| Data Type: |
xbrli:monetaryItemType |
| Balance Type: |
debit |
| Period Type: |
duration |
|
| X |
- References
+ Details
| Name: |
us-gaap_NetCashProvidedByUsedInFinancingActivitiesAbstract |
| Namespace Prefix: |
us-gaap_ |
| Data Type: |
xbrli:stringItemType |
| Balance Type: |
na |
| Period Type: |
duration |
|
| X |
- DefinitionAmount of cash inflow (outflow) from investing activities, including discontinued operations. Investing activity cash flows include making and collecting loans and acquiring and disposing of debt or equity instruments and property, plant, and equipment and other productive assets. Reference 1: http://www.xbrl.org/2003/role/disclosureRef
-Topic 230
-SubTopic 10
-Name Accounting Standards Codification
-Section 45
-Paragraph 24
-Publisher FASB
-URI https://asc.fasb.org/1943274/2147482740/230-10-45-24
| Name: |
us-gaap_NetCashProvidedByUsedInInvestingActivities |
| Namespace Prefix: |
us-gaap_ |
| Data Type: |
xbrli:monetaryItemType |
| Balance Type: |
debit |
| Period Type: |
duration |
|
| X |
- References
+ Details
| Name: |
us-gaap_NetCashProvidedByUsedInInvestingActivitiesAbstract |
| Namespace Prefix: |
us-gaap_ |
| Data Type: |
xbrli:stringItemType |
| Balance Type: |
na |
| Period Type: |
duration |
|
| X |
- DefinitionAmount of cash inflow (outflow) from operating activities, including discontinued operations. Operating activity cash flows include transactions, adjustments, and changes in value not defined as investing or financing activities. Reference 1: http://fasb.org/us-gaap/role/ref/legacyRef
-Topic 230
-SubTopic 10
-Name Accounting Standards Codification
-Section 45
-Paragraph 28
-Publisher FASB
-URI https://asc.fasb.org/1943274/2147482740/230-10-45-28
Reference 2: http://fasb.org/us-gaap/role/ref/legacyRef
-Topic 230
-SubTopic 10
-Name Accounting Standards Codification
-Section 45
-Paragraph 24
-Publisher FASB
-URI https://asc.fasb.org/1943274/2147482740/230-10-45-24
Reference 3: http://fasb.org/us-gaap/role/ref/legacyRef
-Topic 230
-SubTopic 10
-Name Accounting Standards Codification
-Section 45
-Paragraph 25
-Publisher FASB
-URI https://asc.fasb.org/1943274/2147482740/230-10-45-25
| Name: |
us-gaap_NetCashProvidedByUsedInOperatingActivities |
| Namespace Prefix: |
us-gaap_ |
| Data Type: |
xbrli:monetaryItemType |
| Balance Type: |
na |
| Period Type: |
duration |
|
| X |
- References
+ Details
| Name: |
us-gaap_NetCashProvidedByUsedInOperatingActivitiesAbstract |
| Namespace Prefix: |
us-gaap_ |
| Data Type: |
xbrli:stringItemType |
| Balance Type: |
na |
| Period Type: |
duration |
|
| X |
- DefinitionThe portion of profit or loss for the period, net of income taxes, which is attributable to the parent. Reference 1: http://www.xbrl.org/2003/role/disclosureRef
-Topic 250
-SubTopic 10
-Name Accounting Standards Codification
-Section 50
-Paragraph 6
-Publisher FASB
-URI https://asc.fasb.org/1943274/2147483443/250-10-50-6
Reference 2: http://www.xbrl.org/2003/role/disclosureRef
-Topic 250
-SubTopic 10
-Name Accounting Standards Codification
-Section 50
-Paragraph 9
-Publisher FASB
-URI https://asc.fasb.org/1943274/2147483443/250-10-50-9
Reference 3: http://www.xbrl.org/2003/role/disclosureRef
-Topic 805
-SubTopic 60
-Name Accounting Standards Codification
-Section 65
-Paragraph 1
-Subparagraph (g)
-Publisher FASB
-URI https://asc.fasb.org/1943274/2147476176/805-60-65-1
Reference 4: http://www.xbrl.org/2003/role/disclosureRef
-Topic 740
-SubTopic 323
-Name Accounting Standards Codification
-Section 65
-Paragraph 2
-Subparagraph (g)(3)
-Publisher FASB
-URI https://asc.fasb.org/1943274/2147478666/740-323-65-2
Reference 5: http://fasb.org/us-gaap/role/ref/legacyRef
-Topic 220
-SubTopic 10
-Name Accounting Standards Codification
-Section S99
-Paragraph 2
-Subparagraph (SX 210.5-03(20))
-Publisher FASB
-URI https://asc.fasb.org/1943274/2147483621/220-10-S99-2
Reference 6: http://www.xbrl.org/2003/role/disclosureRef
-Topic 235
-SubTopic 10
-Name Accounting Standards Codification
-Section S99
-Paragraph 1
-Subparagraph (SX 210.4-08(g)(1)(ii))
-Publisher FASB
-URI https://asc.fasb.org/1943274/2147480678/235-10-S99-1
Reference 7: http://www.xbrl.org/2003/role/disclosureRef
-Topic 323
-SubTopic 10
-Name Accounting Standards Codification
-Section 50
-Paragraph 3
-Subparagraph (c)
-Publisher FASB
-URI https://asc.fasb.org/1943274/2147481687/323-10-50-3
Reference 8: http://www.xbrl.org/2003/role/disclosureRef
-Topic 825
-SubTopic 10
-Name Accounting Standards Codification
-Section 50
-Paragraph 28
-Subparagraph (f)
-Publisher FASB
-URI https://asc.fasb.org/1943274/2147482907/825-10-50-28
Reference 9: http://www.xbrl.org/2003/role/disclosureRef
-Topic 220
-SubTopic 10
-Name Accounting Standards Codification
-Section 50
-Paragraph 6
-Publisher FASB
-URI https://asc.fasb.org/1943274/2147482765/220-10-50-6
Reference 10: http://www.xbrl.org/2003/role/disclosureRef
-Topic 250
-SubTopic 10
-Name Accounting Standards Codification
-Section 50
-Paragraph 3
-Publisher FASB
-URI https://asc.fasb.org/1943274/2147483443/250-10-50-3
Reference 11: http://www.xbrl.org/2003/role/disclosureRef
-Topic 250
-SubTopic 10
-Name Accounting Standards Codification
-Section 50
-Paragraph 1
-Subparagraph (b)(2)
-Publisher FASB
-URI https://asc.fasb.org/1943274/2147483443/250-10-50-1
Reference 12: http://www.xbrl.org/2003/role/disclosureRef
-Topic 815
-SubTopic 40
-Name Accounting Standards Codification
-Section 65
-Paragraph 1
-Subparagraph (f)
-Publisher FASB
-URI https://asc.fasb.org/1943274/2147480175/815-40-65-1
Reference 13: http://www.xbrl.org/2003/role/disclosureRef
-Topic 250
-SubTopic 10
-Name Accounting Standards Codification
-Section 50
-Paragraph 8
-Publisher FASB
-URI https://asc.fasb.org/1943274/2147483443/250-10-50-8
Reference 14: http://www.xbrl.org/2003/role/disclosureRef
-Topic 250
-SubTopic 10
-Name Accounting Standards Codification
-Section 50
-Paragraph 11
-Subparagraph (a)
-Publisher FASB
-URI https://asc.fasb.org/1943274/2147483443/250-10-50-11
Reference 15: http://www.xbrl.org/2003/role/disclosureRef
-Topic 250
-SubTopic 10
-Name Accounting Standards Codification
-Section 50
-Paragraph 11
-Subparagraph (b)
-Publisher FASB
-URI https://asc.fasb.org/1943274/2147483443/250-10-50-11
Reference 16: http://www.xbrl.org/2003/role/disclosureRef
-Topic 250
-SubTopic 10
-Name Accounting Standards Codification
-Section 50
-Paragraph 4
-Publisher FASB
-URI https://asc.fasb.org/1943274/2147483443/250-10-50-4
Reference 17: http://www.xbrl.org/2003/role/exampleRef
-Topic 946
-SubTopic 830
-Name Accounting Standards Codification
-Section 55
-Paragraph 10
-Publisher FASB
-URI https://asc.fasb.org/1943274/2147479168/946-830-55-10
Reference 18: http://www.xbrl.org/2003/role/disclosureRef
-Topic 946
-SubTopic 220
-Name Accounting Standards Codification
-Section 45
-Paragraph 7
-Publisher FASB
-URI https://asc.fasb.org/1943274/2147479105/946-220-45-7
Reference 19: http://www.xbrl.org/2003/role/disclosureRef
-Topic 944
-SubTopic 220
-Name Accounting Standards Codification
-Section S99
-Paragraph 1
-Subparagraph (SX 210.7-04(18))
-Publisher FASB
-URI https://asc.fasb.org/1943274/2147477250/944-220-S99-1
Reference 20: http://www.xbrl.org/2003/role/disclosureRef
-Topic 946
-SubTopic 220
-Name Accounting Standards Codification
-Section S99
-Paragraph 1
-Subparagraph (SX 210.6-07(9))
-Publisher FASB
-URI https://asc.fasb.org/1943274/2147479134/946-220-S99-1
Reference 21: http://www.xbrl.org/2003/role/disclosureRef
-Topic 946
-SubTopic 220
-Name Accounting Standards Codification
-Section S99
-Paragraph 3
-Subparagraph (SX 210.6-09(1)(d))
-Publisher FASB
-URI https://asc.fasb.org/1943274/2147479134/946-220-S99-3
Reference 22: http://www.xbrl.org/2003/role/disclosureRef
-Topic 470
-SubTopic 10
-Name Accounting Standards Codification
-Section S99
-Paragraph 1A
-Subparagraph (SX 210.13-01(a)(4)(i))
-Publisher FASB
-URI https://asc.fasb.org/1943274/2147480097/470-10-S99-1A
Reference 23: http://www.xbrl.org/2009/role/commonPracticeRef
-Topic 470
-SubTopic 10
-Name Accounting Standards Codification
-Section S99
-Paragraph 1A
-Subparagraph (SX 210.13-01(a)(4)(ii))
-Publisher FASB
-URI https://asc.fasb.org/1943274/2147480097/470-10-S99-1A
Reference 24: http://www.xbrl.org/2003/role/disclosureRef
-Topic 470
-SubTopic 10
-Name Accounting Standards Codification
-Section S99
-Paragraph 1A
-Subparagraph (SX 210.13-01(a)(4)(iii)(A))
-Publisher FASB
-URI https://asc.fasb.org/1943274/2147480097/470-10-S99-1A
Reference 25: http://www.xbrl.org/2003/role/disclosureRef
-Topic 470
-SubTopic 10
-Name Accounting Standards Codification
-Section S99
-Paragraph 1A
-Subparagraph (SX 210.13-01(a)(4)(iv))
-Publisher FASB
-URI https://asc.fasb.org/1943274/2147480097/470-10-S99-1A
Reference 26: http://www.xbrl.org/2003/role/disclosureRef
-Topic 470
-SubTopic 10
-Name Accounting Standards Codification
-Section S99
-Paragraph 1A
-Subparagraph (SX 210.13-01(a)(5))
-Publisher FASB
-URI https://asc.fasb.org/1943274/2147480097/470-10-S99-1A
Reference 27: http://www.xbrl.org/2003/role/disclosureRef
-Topic 470
-SubTopic 10
-Name Accounting Standards Codification
-Section S99
-Paragraph 1B
-Subparagraph (SX 210.13-02(a)(4)(i))
-Publisher FASB
-URI https://asc.fasb.org/1943274/2147480097/470-10-S99-1B
Reference 28: http://www.xbrl.org/2003/role/disclosureRef
-Topic 470
-SubTopic 10
-Name Accounting Standards Codification
-Section S99
-Paragraph 1B
-Subparagraph (SX 210.13-02(a)(4)(iii)(A))
-Publisher FASB
-URI https://asc.fasb.org/1943274/2147480097/470-10-S99-1B
Reference 29: http://www.xbrl.org/2003/role/disclosureRef
-Topic 470
-SubTopic 10
-Name Accounting Standards Codification
-Section S99
-Paragraph 1B
-Subparagraph (SX 210.13-02(a)(4)(iii)(B))
-Publisher FASB
-URI https://asc.fasb.org/1943274/2147480097/470-10-S99-1B
Reference 30: http://www.xbrl.org/2003/role/disclosureRef
-Topic 470
-SubTopic 10
-Name Accounting Standards Codification
-Section S99
-Paragraph 1B
-Subparagraph (SX 210.13-02(a)(4)(iv))
-Publisher FASB
-URI https://asc.fasb.org/1943274/2147480097/470-10-S99-1B
Reference 31: http://www.xbrl.org/2003/role/disclosureRef
-Topic 470
-SubTopic 10
-Name Accounting Standards Codification
-Section S99
-Paragraph 1B
-Subparagraph (SX 210.13-02(a)(5))
-Publisher FASB
-URI https://asc.fasb.org/1943274/2147480097/470-10-S99-1B
Reference 32: http://www.xbrl.org/2003/role/disclosureRef
-Topic 260
-SubTopic 10
-Name Accounting Standards Codification
-Section 45
-Paragraph 60B
-Subparagraph (a)
-Publisher FASB
-URI https://asc.fasb.org/1943274/2147482689/260-10-45-60B
Reference 33: http://www.xbrl.org/2003/role/disclosureRef
-Topic 205
-SubTopic 20
-Name Accounting Standards Codification
-Section 50
-Paragraph 7
-Publisher FASB
-URI https://asc.fasb.org/1943274/2147483499/205-20-50-7
Reference 34: http://fasb.org/us-gaap/role/ref/legacyRef
-Topic 230
-SubTopic 10
-Name Accounting Standards Codification
-Section 45
-Paragraph 28
-Publisher FASB
-URI https://asc.fasb.org/1943274/2147482740/230-10-45-28
Reference 35: http://www.xbrl.org/2003/role/disclosureRef
-Topic 220
-SubTopic 10
-Name Accounting Standards Codification
-Section 45
-Paragraph 1A
-Subparagraph (a)
-Publisher FASB
-URI https://asc.fasb.org/1943274/2147482790/220-10-45-1A
Reference 36: http://www.xbrl.org/2003/role/disclosureRef
-Topic 220
-SubTopic 10
-Name Accounting Standards Codification
-Section 45
-Paragraph 1B
-Subparagraph (a)
-Publisher FASB
-URI https://asc.fasb.org/1943274/2147482790/220-10-45-1B
Reference 37: http://fasb.org/us-gaap/role/ref/legacyRef
-Topic 942
-SubTopic 220
-Name Accounting Standards Codification
-Section S99
-Paragraph 1
-Subparagraph (SX 210.9-04(22))
-Publisher FASB
-URI https://asc.fasb.org/1943274/2147478524/942-220-S99-1
| Name: |
us-gaap_NetIncomeLoss |
| Namespace Prefix: |
us-gaap_ |
| Data Type: |
xbrli:monetaryItemType |
| Balance Type: |
credit |
| Period Type: |
duration |
|
| X |
- DefinitionAmount of periodic reduction over lease term of carrying amount of right-of-use asset from operating lease. Reference 1: http://www.xbrl.org/2009/role/commonPracticeRef
-Topic 230
-SubTopic 10
-Name Accounting Standards Codification
-Section 45
-Paragraph 28
-Subparagraph (b)
-Publisher FASB
-URI https://asc.fasb.org/1943274/2147482740/230-10-45-28
| Name: |
us-gaap_OperatingLeaseRightOfUseAssetAmortizationExpense |
| Namespace Prefix: |
us-gaap_ |
| Data Type: |
xbrli:monetaryItemType |
| Balance Type: |
debit |
| Period Type: |
duration |
|
| X |
- DefinitionOther cash or noncash adjustments to reconcile net income to cash provided by (used in) operating activities that are not separately disclosed in the statement of cash flows (for example, cash received or cash paid during the current period for miscellaneous operating activities, net change during the reporting period in other assets or other liabilities).
| Name: |
us-gaap_OtherOperatingActivitiesCashFlowStatement |
| Namespace Prefix: |
us-gaap_ |
| Data Type: |
xbrli:monetaryItemType |
| Balance Type: |
debit |
| Period Type: |
duration |
|
| X |
- DefinitionAmount of cash outflow in the form of ordinary dividends to common shareholders of the parent entity. Reference 1: http://fasb.org/us-gaap/role/ref/legacyRef
-Topic 230
-SubTopic 10
-Name Accounting Standards Codification
-Section 45
-Paragraph 15
-Subparagraph (a)
-Publisher FASB
-URI https://asc.fasb.org/1943274/2147482740/230-10-45-15
| Name: |
us-gaap_PaymentsOfDividendsCommonStock |
| Namespace Prefix: |
us-gaap_ |
| Data Type: |
xbrli:monetaryItemType |
| Balance Type: |
credit |
| Period Type: |
duration |
|
| X |
- DefinitionThe cash outflow for loan and debt issuance costs. Reference 1: http://fasb.org/us-gaap/role/ref/legacyRef
-Name Accounting Standards Codification
-Topic 230
-SubTopic 10
-Section 45
-Paragraph 15
-Publisher FASB
-URI https://asc.fasb.org/1943274/2147482740/230-10-45-15
| Name: |
us-gaap_PaymentsOfFinancingCosts |
| Namespace Prefix: |
us-gaap_ |
| Data Type: |
xbrli:monetaryItemType |
| Balance Type: |
credit |
| Period Type: |
duration |
|
| X |
- DefinitionThe cash outflow associated with the acquisition of long-lived, physical assets that are used in the normal conduct of business to produce goods and services and not intended for resale; includes cash outflows to pay for construction of self-constructed assets. Reference 1: http://fasb.org/us-gaap/role/ref/legacyRef
-Topic 230
-SubTopic 10
-Name Accounting Standards Codification
-Section 45
-Paragraph 13
-Subparagraph (c)
-Publisher FASB
-URI https://asc.fasb.org/1943274/2147482740/230-10-45-13
| Name: |
us-gaap_PaymentsToAcquirePropertyPlantAndEquipment |
| Namespace Prefix: |
us-gaap_ |
| Data Type: |
xbrli:monetaryItemType |
| Balance Type: |
credit |
| Period Type: |
duration |
|
| X |
- DefinitionAmount of cash outflow for pension and other postretirement benefits. Includes, but is not limited to, employer contribution to fund plan asset and payment to retiree. Reference 1: http://fasb.org/us-gaap/role/ref/legacyRef
-Name Accounting Standards Codification
-Section 45
-Paragraph 25
-Subparagraph (g)
-SubTopic 10
-Topic 230
-Publisher FASB
-URI https://asc.fasb.org/1943274/2147482740/230-10-45-25
| Name: |
us-gaap_PensionAndOtherPostretirementBenefitContributions |
| Namespace Prefix: |
us-gaap_ |
| Data Type: |
xbrli:monetaryItemType |
| Balance Type: |
credit |
| Period Type: |
duration |
|
| X |
- DefinitionThe cash inflow from a contractual arrangement with the lender, including letter of credit, standby letter of credit and revolving credit arrangements, under which borrowings can be made up to a specific amount at any point in time with maturities due beyond one year or the operating cycle, if longer. Reference 1: http://fasb.org/us-gaap/role/ref/legacyRef
-Name Accounting Standards Codification
-Topic 230
-SubTopic 10
-Section 45
-Paragraph 14
-Subparagraph (b)
-Publisher FASB
-URI https://asc.fasb.org/1943274/2147482740/230-10-45-14
| Name: |
us-gaap_ProceedsFromLongTermLinesOfCredit |
| Namespace Prefix: |
us-gaap_ |
| Data Type: |
xbrli:monetaryItemType |
| Balance Type: |
debit |
| Period Type: |
duration |
|
| X |
- DefinitionThe cash inflow from the sale of investment projects held by an entity in hopes of getting a future return or interest from it. Reference 1: http://fasb.org/us-gaap/role/ref/legacyRef
-Name Accounting Standards Codification
-Topic 230
-SubTopic 10
-Section 45
-Paragraph 12
-Publisher FASB
-URI https://asc.fasb.org/1943274/2147482740/230-10-45-12
| Name: |
us-gaap_ProceedsFromSaleOfInvestmentProjects |
| Namespace Prefix: |
us-gaap_ |
| Data Type: |
xbrli:monetaryItemType |
| Balance Type: |
debit |
| Period Type: |
duration |
|
| X |
- DefinitionAmount of cash inflow from the sale of other assets recognized in investing activities. Reference 1: http://www.xbrl.org/2009/role/commonPracticeRef
-Name Accounting Standards Codification
-Section 45
-Paragraph 12
-SubTopic 10
-Topic 230
-Publisher FASB
-URI https://asc.fasb.org/1943274/2147482740/230-10-45-12
| Name: |
us-gaap_ProceedsFromSaleOfOtherAssetsInvestingActivities |
| Namespace Prefix: |
us-gaap_ |
| Data Type: |
xbrli:monetaryItemType |
| Balance Type: |
debit |
| Period Type: |
duration |
|
| X |
- DefinitionThe cash outflow for the settlement of obligation drawn from a contractual arrangement with the lender, including letter of credit, standby letter of credit and revolving credit arrangements, under which borrowings can be made up to a specific amount at any point in time with maturities due beyond one year or the operating cycle, if longer. Reference 1: http://fasb.org/us-gaap/role/ref/legacyRef
-Topic 230
-SubTopic 10
-Name Accounting Standards Codification
-Section 45
-Paragraph 15
-Subparagraph (b)
-Publisher FASB
-URI https://asc.fasb.org/1943274/2147482740/230-10-45-15
| Name: |
us-gaap_RepaymentsOfLongTermLinesOfCredit |
| Namespace Prefix: |
us-gaap_ |
| Data Type: |
xbrli:monetaryItemType |
| Balance Type: |
credit |
| Period Type: |
duration |
|
| X |
- DefinitionAmount of cash outflow for short-term lease payment excluded from lease liability. Reference 1: http://www.xbrl.org/2003/role/disclosureRef
-Topic 842
-SubTopic 20
-Name Accounting Standards Codification
-Section 45
-Paragraph 5
-Subparagraph (d)
-Publisher FASB
-URI https://asc.fasb.org/1943274/2147479041/842-20-45-5
| Name: |
us-gaap_ShortTermLeasePayments |
| Namespace Prefix: |
us-gaap_ |
| Data Type: |
xbrli:monetaryItemType |
| Balance Type: |
credit |
| Period Type: |
duration |
|
| X |
- DefinitionAmount of unrealized gain (loss) on investment. Reference 1: http://fasb.org/us-gaap/role/ref/legacyRef
-Name Accounting Standards Codification
-Section 45
-Paragraph 28
-Subparagraph (b)
-SubTopic 10
-Topic 230
-Publisher FASB
-URI https://asc.fasb.org/1943274/2147482740/230-10-45-28
| Name: |
us-gaap_UnrealizedGainLossOnInvestments |
| Namespace Prefix: |
us-gaap_ |
| Data Type: |
xbrli:monetaryItemType |
| Balance Type: |
credit |
| Period Type: |
duration |
|
v3.24.3
Consolidated Statements Of Shareholders' Equity - USD ($)
$ in Thousands |
Total |
Common Stock [Member] |
Retained Earnings [Member] |
Trust For Saving Restoration Plan [Member] |
AOCI Attributable to Parent [Member] |
| Beginning Balance at Dec. 31, 2022 |
$ 201,762
|
$ 58,824
|
$ 292,721
|
$ (2,188)
|
$ (147,595)
|
| Net Income (Loss) |
(70,314)
|
|
(70,314)
|
|
|
| Other Comprehensive Income (Loss), Foreign Currency Transaction and Translation Adjustment, Net of Tax |
923
|
|
|
|
923
|
| Other Comprehensive Income (Loss), Cash Flow Hedge, Gain (Loss), after Reclassification and Tax |
1,706
|
|
|
|
1,706
|
| Other Comprehensive (Income) Loss, Defined Benefit Plan, Reclassification Adjustment from AOCI, after Tax |
6,522
|
|
|
|
6,522
|
| Dividends, Common Stock, Cash |
(8,884)
|
|
(8,884)
|
|
|
| Share Based Compensation Expense, Value |
2,257
|
2,257
|
|
|
|
| Stock Issued During Period, Value, Stock Options Exercised |
(254)
|
(254)
|
|
|
|
| Tredegar Common Stock Purchased by Trust for Savings Restoration Plan |
|
|
45
|
(45)
|
|
| Ending Balance at Sep. 30, 2023 |
154,191
|
60,827
|
213,568
|
(2,233)
|
(117,971)
|
| Other Comprehensive Income (Loss), Defined Benefit Plan, Gain (Loss) Arising During Period, after Tax |
442
|
|
|
|
442
|
| Post-Tax Actuarial Loss for Pension Settlement |
20,031
|
|
|
|
20,031
|
| Beginning Balance at Jun. 30, 2023 |
183,149
|
60,078
|
263,933
|
(2,218)
|
(138,644)
|
| Net Income (Loss) |
(50,380)
|
|
(50,380)
|
|
|
| Other Comprehensive Income (Loss), Foreign Currency Transaction and Translation Adjustment, Net of Tax |
(1,818)
|
|
|
|
(1,818)
|
| Other Comprehensive Income (Loss), Cash Flow Hedge, Gain (Loss), after Reclassification and Tax |
69
|
|
|
|
69
|
| Other Comprehensive (Income) Loss, Defined Benefit Plan, Reclassification Adjustment from AOCI, after Tax |
1,949
|
|
|
|
1,949
|
| Share Based Compensation Expense, Value |
749
|
749
|
|
|
|
| Tredegar Common Stock Purchased by Trust for Savings Restoration Plan |
|
|
15
|
(15)
|
|
| Ending Balance at Sep. 30, 2023 |
154,191
|
60,827
|
213,568
|
(2,233)
|
(117,971)
|
| Other Comprehensive Income (Loss), Defined Benefit Plan, Gain (Loss) Arising During Period, after Tax |
442
|
|
|
|
442
|
| Post-Tax Actuarial Loss for Pension Settlement |
20,031
|
|
|
|
20,031
|
| Beginning Balance at Dec. 31, 2023 |
155,653
|
61,606
|
177,977
|
(2,233)
|
(81,697)
|
| Net Income (Loss) |
8,134
|
|
8,134
|
|
|
| Other Comprehensive Income (Loss), Foreign Currency Transaction and Translation Adjustment, Net of Tax |
(5,740)
|
|
|
|
(5,740)
|
| Other Comprehensive Income (Loss), Cash Flow Hedge, Gain (Loss), after Reclassification and Tax |
(942)
|
|
|
|
(942)
|
| Other Comprehensive (Income) Loss, Defined Benefit Plan, Reclassification Adjustment from AOCI, after Tax |
(82)
|
|
|
|
(82)
|
| Share Based Compensation Expense, Value |
1,651
|
1,651
|
|
|
|
| Stock Issued During Period, Value, Stock Options Exercised |
(226)
|
(226)
|
|
|
|
| Ending Balance at Sep. 30, 2024 |
158,448
|
63,031
|
186,111
|
(2,233)
|
(88,461)
|
| Other Comprehensive Income (Loss), Defined Benefit Plan, Gain (Loss) Arising During Period, after Tax |
|
|
|
|
0
|
| Post-Tax Actuarial Loss for Pension Settlement |
|
|
|
|
0
|
| Beginning Balance at Jun. 30, 2024 |
159,964
|
62,493
|
190,057
|
(2,233)
|
(90,353)
|
| Net Income (Loss) |
(3,946)
|
|
(3,946)
|
|
|
| Other Comprehensive Income (Loss), Foreign Currency Transaction and Translation Adjustment, Net of Tax |
1,496
|
|
|
|
1,496
|
| Other Comprehensive Income (Loss), Cash Flow Hedge, Gain (Loss), after Reclassification and Tax |
423
|
|
|
|
423
|
| Other Comprehensive (Income) Loss, Defined Benefit Plan, Reclassification Adjustment from AOCI, after Tax |
(27)
|
|
|
|
(27)
|
| Share Based Compensation Expense, Value |
538
|
538
|
|
|
|
| Ending Balance at Sep. 30, 2024 |
$ 158,448
|
$ 63,031
|
$ 186,111
|
$ (2,233)
|
(88,461)
|
| Other Comprehensive Income (Loss), Defined Benefit Plan, Gain (Loss) Arising During Period, after Tax |
|
|
|
|
0
|
| Post-Tax Actuarial Loss for Pension Settlement |
|
|
|
|
$ 0
|
| X |
- DefinitionPost-Tax Actuarial Loss for Pension Settlement
| Name: |
tg_PostTaxActuarialLossForPensionSettlement |
| Namespace Prefix: |
tg_ |
| Data Type: |
xbrli:monetaryItemType |
| Balance Type: |
credit |
| Period Type: |
duration |
|
| X |
- DefinitionRepresents the expense recognized during the period arising from equity-based compensation arrangements (for example, stock options, restricted stock or other equity instruments) with employees, directors and certain consultants qualifying for treatment as employees.
| Name: |
tg_ShareBasedCompensationExpenseValue |
| Namespace Prefix: |
tg_ |
| Data Type: |
xbrli:monetaryItemType |
| Balance Type: |
credit |
| Period Type: |
duration |
|
| X |
- DefinitionTredegar Common Stock Purchased By Trust For Savings Restoration Plan
| Name: |
tg_TredegarCommonStockPurchasedByTrustForSavingsRestorationPlan |
| Namespace Prefix: |
tg_ |
| Data Type: |
xbrli:monetaryItemType |
| Balance Type: |
debit |
| Period Type: |
duration |
|
| X |
- DefinitionAmount of paid and unpaid common stock dividends declared with the form of settlement in cash. Reference 1: http://fasb.org/us-gaap/role/ref/legacyRef
-Topic 505
-SubTopic 10
-Name Accounting Standards Codification
-Section S99
-Paragraph 1
-Subparagraph (SX 210.3-04)
-Publisher FASB
-URI https://asc.fasb.org/1943274/2147480008/505-10-S99-1
| Name: |
us-gaap_DividendsCommonStockCash |
| Namespace Prefix: |
us-gaap_ |
| Data Type: |
xbrli:monetaryItemType |
| Balance Type: |
debit |
| Period Type: |
duration |
|
| X |
- DefinitionThe portion of profit or loss for the period, net of income taxes, which is attributable to the parent. Reference 1: http://www.xbrl.org/2003/role/disclosureRef
-Topic 250
-SubTopic 10
-Name Accounting Standards Codification
-Section 50
-Paragraph 6
-Publisher FASB
-URI https://asc.fasb.org/1943274/2147483443/250-10-50-6
Reference 2: http://www.xbrl.org/2003/role/disclosureRef
-Topic 250
-SubTopic 10
-Name Accounting Standards Codification
-Section 50
-Paragraph 9
-Publisher FASB
-URI https://asc.fasb.org/1943274/2147483443/250-10-50-9
Reference 3: http://www.xbrl.org/2003/role/disclosureRef
-Topic 805
-SubTopic 60
-Name Accounting Standards Codification
-Section 65
-Paragraph 1
-Subparagraph (g)
-Publisher FASB
-URI https://asc.fasb.org/1943274/2147476176/805-60-65-1
Reference 4: http://www.xbrl.org/2003/role/disclosureRef
-Topic 740
-SubTopic 323
-Name Accounting Standards Codification
-Section 65
-Paragraph 2
-Subparagraph (g)(3)
-Publisher FASB
-URI https://asc.fasb.org/1943274/2147478666/740-323-65-2
Reference 5: http://fasb.org/us-gaap/role/ref/legacyRef
-Topic 220
-SubTopic 10
-Name Accounting Standards Codification
-Section S99
-Paragraph 2
-Subparagraph (SX 210.5-03(20))
-Publisher FASB
-URI https://asc.fasb.org/1943274/2147483621/220-10-S99-2
Reference 6: http://www.xbrl.org/2003/role/disclosureRef
-Topic 235
-SubTopic 10
-Name Accounting Standards Codification
-Section S99
-Paragraph 1
-Subparagraph (SX 210.4-08(g)(1)(ii))
-Publisher FASB
-URI https://asc.fasb.org/1943274/2147480678/235-10-S99-1
Reference 7: http://www.xbrl.org/2003/role/disclosureRef
-Topic 323
-SubTopic 10
-Name Accounting Standards Codification
-Section 50
-Paragraph 3
-Subparagraph (c)
-Publisher FASB
-URI https://asc.fasb.org/1943274/2147481687/323-10-50-3
Reference 8: http://www.xbrl.org/2003/role/disclosureRef
-Topic 825
-SubTopic 10
-Name Accounting Standards Codification
-Section 50
-Paragraph 28
-Subparagraph (f)
-Publisher FASB
-URI https://asc.fasb.org/1943274/2147482907/825-10-50-28
Reference 9: http://www.xbrl.org/2003/role/disclosureRef
-Topic 220
-SubTopic 10
-Name Accounting Standards Codification
-Section 50
-Paragraph 6
-Publisher FASB
-URI https://asc.fasb.org/1943274/2147482765/220-10-50-6
Reference 10: http://www.xbrl.org/2003/role/disclosureRef
-Topic 250
-SubTopic 10
-Name Accounting Standards Codification
-Section 50
-Paragraph 3
-Publisher FASB
-URI https://asc.fasb.org/1943274/2147483443/250-10-50-3
Reference 11: http://www.xbrl.org/2003/role/disclosureRef
-Topic 250
-SubTopic 10
-Name Accounting Standards Codification
-Section 50
-Paragraph 1
-Subparagraph (b)(2)
-Publisher FASB
-URI https://asc.fasb.org/1943274/2147483443/250-10-50-1
Reference 12: http://www.xbrl.org/2003/role/disclosureRef
-Topic 815
-SubTopic 40
-Name Accounting Standards Codification
-Section 65
-Paragraph 1
-Subparagraph (f)
-Publisher FASB
-URI https://asc.fasb.org/1943274/2147480175/815-40-65-1
Reference 13: http://www.xbrl.org/2003/role/disclosureRef
-Topic 250
-SubTopic 10
-Name Accounting Standards Codification
-Section 50
-Paragraph 8
-Publisher FASB
-URI https://asc.fasb.org/1943274/2147483443/250-10-50-8
Reference 14: http://www.xbrl.org/2003/role/disclosureRef
-Topic 250
-SubTopic 10
-Name Accounting Standards Codification
-Section 50
-Paragraph 11
-Subparagraph (a)
-Publisher FASB
-URI https://asc.fasb.org/1943274/2147483443/250-10-50-11
Reference 15: http://www.xbrl.org/2003/role/disclosureRef
-Topic 250
-SubTopic 10
-Name Accounting Standards Codification
-Section 50
-Paragraph 11
-Subparagraph (b)
-Publisher FASB
-URI https://asc.fasb.org/1943274/2147483443/250-10-50-11
Reference 16: http://www.xbrl.org/2003/role/disclosureRef
-Topic 250
-SubTopic 10
-Name Accounting Standards Codification
-Section 50
-Paragraph 4
-Publisher FASB
-URI https://asc.fasb.org/1943274/2147483443/250-10-50-4
Reference 17: http://www.xbrl.org/2003/role/exampleRef
-Topic 946
-SubTopic 830
-Name Accounting Standards Codification
-Section 55
-Paragraph 10
-Publisher FASB
-URI https://asc.fasb.org/1943274/2147479168/946-830-55-10
Reference 18: http://www.xbrl.org/2003/role/disclosureRef
-Topic 946
-SubTopic 220
-Name Accounting Standards Codification
-Section 45
-Paragraph 7
-Publisher FASB
-URI https://asc.fasb.org/1943274/2147479105/946-220-45-7
Reference 19: http://www.xbrl.org/2003/role/disclosureRef
-Topic 944
-SubTopic 220
-Name Accounting Standards Codification
-Section S99
-Paragraph 1
-Subparagraph (SX 210.7-04(18))
-Publisher FASB
-URI https://asc.fasb.org/1943274/2147477250/944-220-S99-1
Reference 20: http://www.xbrl.org/2003/role/disclosureRef
-Topic 946
-SubTopic 220
-Name Accounting Standards Codification
-Section S99
-Paragraph 1
-Subparagraph (SX 210.6-07(9))
-Publisher FASB
-URI https://asc.fasb.org/1943274/2147479134/946-220-S99-1
Reference 21: http://www.xbrl.org/2003/role/disclosureRef
-Topic 946
-SubTopic 220
-Name Accounting Standards Codification
-Section S99
-Paragraph 3
-Subparagraph (SX 210.6-09(1)(d))
-Publisher FASB
-URI https://asc.fasb.org/1943274/2147479134/946-220-S99-3
Reference 22: http://www.xbrl.org/2003/role/disclosureRef
-Topic 470
-SubTopic 10
-Name Accounting Standards Codification
-Section S99
-Paragraph 1A
-Subparagraph (SX 210.13-01(a)(4)(i))
-Publisher FASB
-URI https://asc.fasb.org/1943274/2147480097/470-10-S99-1A
Reference 23: http://www.xbrl.org/2009/role/commonPracticeRef
-Topic 470
-SubTopic 10
-Name Accounting Standards Codification
-Section S99
-Paragraph 1A
-Subparagraph (SX 210.13-01(a)(4)(ii))
-Publisher FASB
-URI https://asc.fasb.org/1943274/2147480097/470-10-S99-1A
Reference 24: http://www.xbrl.org/2003/role/disclosureRef
-Topic 470
-SubTopic 10
-Name Accounting Standards Codification
-Section S99
-Paragraph 1A
-Subparagraph (SX 210.13-01(a)(4)(iii)(A))
-Publisher FASB
-URI https://asc.fasb.org/1943274/2147480097/470-10-S99-1A
Reference 25: http://www.xbrl.org/2003/role/disclosureRef
-Topic 470
-SubTopic 10
-Name Accounting Standards Codification
-Section S99
-Paragraph 1A
-Subparagraph (SX 210.13-01(a)(4)(iv))
-Publisher FASB
-URI https://asc.fasb.org/1943274/2147480097/470-10-S99-1A
Reference 26: http://www.xbrl.org/2003/role/disclosureRef
-Topic 470
-SubTopic 10
-Name Accounting Standards Codification
-Section S99
-Paragraph 1A
-Subparagraph (SX 210.13-01(a)(5))
-Publisher FASB
-URI https://asc.fasb.org/1943274/2147480097/470-10-S99-1A
Reference 27: http://www.xbrl.org/2003/role/disclosureRef
-Topic 470
-SubTopic 10
-Name Accounting Standards Codification
-Section S99
-Paragraph 1B
-Subparagraph (SX 210.13-02(a)(4)(i))
-Publisher FASB
-URI https://asc.fasb.org/1943274/2147480097/470-10-S99-1B
Reference 28: http://www.xbrl.org/2003/role/disclosureRef
-Topic 470
-SubTopic 10
-Name Accounting Standards Codification
-Section S99
-Paragraph 1B
-Subparagraph (SX 210.13-02(a)(4)(iii)(A))
-Publisher FASB
-URI https://asc.fasb.org/1943274/2147480097/470-10-S99-1B
Reference 29: http://www.xbrl.org/2003/role/disclosureRef
-Topic 470
-SubTopic 10
-Name Accounting Standards Codification
-Section S99
-Paragraph 1B
-Subparagraph (SX 210.13-02(a)(4)(iii)(B))
-Publisher FASB
-URI https://asc.fasb.org/1943274/2147480097/470-10-S99-1B
Reference 30: http://www.xbrl.org/2003/role/disclosureRef
-Topic 470
-SubTopic 10
-Name Accounting Standards Codification
-Section S99
-Paragraph 1B
-Subparagraph (SX 210.13-02(a)(4)(iv))
-Publisher FASB
-URI https://asc.fasb.org/1943274/2147480097/470-10-S99-1B
Reference 31: http://www.xbrl.org/2003/role/disclosureRef
-Topic 470
-SubTopic 10
-Name Accounting Standards Codification
-Section S99
-Paragraph 1B
-Subparagraph (SX 210.13-02(a)(5))
-Publisher FASB
-URI https://asc.fasb.org/1943274/2147480097/470-10-S99-1B
Reference 32: http://www.xbrl.org/2003/role/disclosureRef
-Topic 260
-SubTopic 10
-Name Accounting Standards Codification
-Section 45
-Paragraph 60B
-Subparagraph (a)
-Publisher FASB
-URI https://asc.fasb.org/1943274/2147482689/260-10-45-60B
Reference 33: http://www.xbrl.org/2003/role/disclosureRef
-Topic 205
-SubTopic 20
-Name Accounting Standards Codification
-Section 50
-Paragraph 7
-Publisher FASB
-URI https://asc.fasb.org/1943274/2147483499/205-20-50-7
Reference 34: http://fasb.org/us-gaap/role/ref/legacyRef
-Topic 230
-SubTopic 10
-Name Accounting Standards Codification
-Section 45
-Paragraph 28
-Publisher FASB
-URI https://asc.fasb.org/1943274/2147482740/230-10-45-28
Reference 35: http://www.xbrl.org/2003/role/disclosureRef
-Topic 220
-SubTopic 10
-Name Accounting Standards Codification
-Section 45
-Paragraph 1A
-Subparagraph (a)
-Publisher FASB
-URI https://asc.fasb.org/1943274/2147482790/220-10-45-1A
Reference 36: http://www.xbrl.org/2003/role/disclosureRef
-Topic 220
-SubTopic 10
-Name Accounting Standards Codification
-Section 45
-Paragraph 1B
-Subparagraph (a)
-Publisher FASB
-URI https://asc.fasb.org/1943274/2147482790/220-10-45-1B
Reference 37: http://fasb.org/us-gaap/role/ref/legacyRef
-Topic 942
-SubTopic 220
-Name Accounting Standards Codification
-Section S99
-Paragraph 1
-Subparagraph (SX 210.9-04(22))
-Publisher FASB
-URI https://asc.fasb.org/1943274/2147478524/942-220-S99-1
| Name: |
us-gaap_NetIncomeLoss |
| Namespace Prefix: |
us-gaap_ |
| Data Type: |
xbrli:monetaryItemType |
| Balance Type: |
credit |
| Period Type: |
duration |
|
| X |
- DefinitionAmount, after tax, of gain (loss) for (increase) decrease in value of benefit obligation for change in actuarial assumptions and increase (decrease) in value of plan assets from experience different from that assumed of defined benefit plan, that has not been recognized in net periodic benefit (cost) credit. Reference 1: http://fasb.org/us-gaap/role/ref/legacyRef
-Topic 220
-SubTopic 10
-Name Accounting Standards Codification
-Section 45
-Paragraph 11
-Publisher FASB
-URI https://asc.fasb.org/1943274/2147482790/220-10-45-11
Reference 2: http://fasb.org/us-gaap/role/ref/legacyRef
-Topic 220
-SubTopic 10
-Name Accounting Standards Codification
-Section 45
-Paragraph 10A
-Subparagraph (i)
-Publisher FASB
-URI https://asc.fasb.org/1943274/2147482790/220-10-45-10A
Reference 3: http://www.xbrl.org/2003/role/disclosureRef
-Topic 715
-SubTopic 20
-Name Accounting Standards Codification
-Section 50
-Paragraph 1
-Subparagraph (i)
-Publisher FASB
-URI https://asc.fasb.org/1943274/2147480506/715-20-50-1
| Name: |
us-gaap_OtherComprehensiveIncomeDefinedBenefitPlansNetUnamortizedGainLossArisingDuringPeriodNetOfTax |
| Namespace Prefix: |
us-gaap_ |
| Data Type: |
xbrli:monetaryItemType |
| Balance Type: |
credit |
| Period Type: |
duration |
|
| X |
- DefinitionAmount, after tax and reclassification, of gain (loss) from derivative instrument designated and qualifying as cash flow hedge included in assessment of hedge effectiveness. Reference 1: http://www.xbrl.org/2003/role/disclosureRef
-Topic 944
-SubTopic 220
-Name Accounting Standards Codification
-Section S99
-Paragraph 1
-Subparagraph (SX 210.7-04(19))
-Publisher FASB
-URI https://asc.fasb.org/1943274/2147477250/944-220-S99-1
Reference 2: http://www.xbrl.org/2003/role/disclosureRef
-Topic 220
-SubTopic 10
-Name Accounting Standards Codification
-Section 45
-Paragraph 11
-Publisher FASB
-URI https://asc.fasb.org/1943274/2147482790/220-10-45-11
Reference 3: http://www.xbrl.org/2003/role/disclosureRef
-Topic 220
-SubTopic 10
-Name Accounting Standards Codification
-Section 45
-Paragraph 10A
-Subparagraph (d)
-Publisher FASB
-URI https://asc.fasb.org/1943274/2147482790/220-10-45-10A
| Name: |
us-gaap_OtherComprehensiveIncomeLossCashFlowHedgeGainLossAfterReclassificationAndTax |
| Namespace Prefix: |
us-gaap_ |
| Data Type: |
xbrli:monetaryItemType |
| Balance Type: |
credit |
| Period Type: |
duration |
|
| X |
- DefinitionAmount after tax and reclassification adjustments of gain (loss) on foreign currency translation adjustments, foreign currency transactions designated and effective as economic hedges of a net investment in a foreign entity and intra-entity foreign currency transactions that are of a long-term-investment nature. Reference 1: http://fasb.org/us-gaap/role/ref/legacyRef
-Name Accounting Standards Codification
-Section 45
-Paragraph 10A
-Subparagraph (a)
-SubTopic 10
-Topic 220
-Publisher FASB
-URI https://asc.fasb.org/1943274/2147482790/220-10-45-10A
Reference 2: http://www.xbrl.org/2003/role/disclosureRef
-Topic 944
-SubTopic 220
-Name Accounting Standards Codification
-Section S99
-Paragraph 1
-Subparagraph (SX 210.7-04(19))
-Publisher FASB
-URI https://asc.fasb.org/1943274/2147477250/944-220-S99-1
| Name: |
us-gaap_OtherComprehensiveIncomeLossForeignCurrencyTransactionAndTranslationAdjustmentNetOfTax |
| Namespace Prefix: |
us-gaap_ |
| Data Type: |
xbrli:monetaryItemType |
| Balance Type: |
credit |
| Period Type: |
duration |
|
| X |
- DefinitionAmount, after tax, of reclassification adjustment from accumulated other comprehensive (income) loss for net periodic benefit cost (credit) of defined benefit plan. Reference 1: http://fasb.org/us-gaap/role/ref/legacyRef
-Name Accounting Standards Codification
-Section 45
-Paragraph 15
-SubTopic 10
-Topic 220
-Publisher FASB
-URI https://asc.fasb.org/1943274/2147482790/220-10-45-15
Reference 2: http://fasb.org/us-gaap/role/ref/legacyRef
-Topic 220
-SubTopic 10
-Name Accounting Standards Codification
-Section 45
-Paragraph 11
-Publisher FASB
-URI https://asc.fasb.org/1943274/2147482790/220-10-45-11
Reference 3: http://fasb.org/us-gaap/role/ref/legacyRef
-Topic 715
-SubTopic 20
-Name Accounting Standards Codification
-Section 50
-Paragraph 1
-Subparagraph (i)
-Publisher FASB
-URI https://asc.fasb.org/1943274/2147480506/715-20-50-1
Reference 4: http://www.xbrl.org/2003/role/disclosureRef
-Topic 220
-SubTopic 10
-Name Accounting Standards Codification
-Section 45
-Paragraph 17A
-Publisher FASB
-URI https://asc.fasb.org/1943274/2147482790/220-10-45-17A
| Name: |
us-gaap_OtherComprehensiveIncomeLossReclassificationAdjustmentFromAOCIPensionAndOtherPostretirementBenefitPlansNetOfTax |
| Namespace Prefix: |
us-gaap_ |
| Data Type: |
xbrli:monetaryItemType |
| Balance Type: |
credit |
| Period Type: |
duration |
|
| X |
- DefinitionValue of stock issued as a result of the exercise of stock options. Reference 1: http://fasb.org/us-gaap/role/ref/legacyRef
-Name Accounting Standards Codification
-Section 50
-Paragraph 2
-SubTopic 10
-Topic 505
-Publisher FASB
-URI https://asc.fasb.org/1943274/2147481112/505-10-50-2
Reference 2: http://fasb.org/us-gaap/role/ref/legacyRef
-Topic 210
-SubTopic 10
-Name Accounting Standards Codification
-Section S99
-Paragraph 1
-Subparagraph (SX 210.5-02(29))
-Publisher FASB
-URI https://asc.fasb.org/1943274/2147480566/210-10-S99-1
Reference 3: http://fasb.org/us-gaap/role/ref/legacyRef
-Topic 210
-SubTopic 10
-Name Accounting Standards Codification
-Section S99
-Paragraph 1
-Subparagraph (SX 210.5-02(30))
-Publisher FASB
-URI https://asc.fasb.org/1943274/2147480566/210-10-S99-1
Reference 4: http://fasb.org/us-gaap/role/ref/legacyRef
-Topic 210
-SubTopic 10
-Name Accounting Standards Codification
-Section S99
-Paragraph 1
-Subparagraph (SX 210.5-02(31))
-Publisher FASB
-URI https://asc.fasb.org/1943274/2147480566/210-10-S99-1
Reference 5: http://fasb.org/us-gaap/role/ref/legacyRef
-Topic 505
-SubTopic 10
-Name Accounting Standards Codification
-Section S99
-Paragraph 1
-Subparagraph (SX 210.3-04)
-Publisher FASB
-URI https://asc.fasb.org/1943274/2147480008/505-10-S99-1
| Name: |
us-gaap_StockIssuedDuringPeriodValueStockOptionsExercised |
| Namespace Prefix: |
us-gaap_ |
| Data Type: |
xbrli:monetaryItemType |
| Balance Type: |
credit |
| Period Type: |
duration |
|
| X |
- DefinitionAmount of equity (deficit) attributable to parent. Excludes temporary equity and equity attributable to noncontrolling interest. Reference 1: http://fasb.org/us-gaap/role/ref/legacyRef
-Topic 210
-SubTopic 10
-Name Accounting Standards Codification
-Section S99
-Paragraph 1
-Subparagraph (SX 210.5-02(29))
-Publisher FASB
-URI https://asc.fasb.org/1943274/2147480566/210-10-S99-1
Reference 2: http://fasb.org/us-gaap/role/ref/legacyRef
-Topic 210
-SubTopic 10
-Name Accounting Standards Codification
-Section S99
-Paragraph 1
-Subparagraph (SX 210.5-02(30))
-Publisher FASB
-URI https://asc.fasb.org/1943274/2147480566/210-10-S99-1
Reference 3: http://fasb.org/us-gaap/role/ref/legacyRef
-Topic 210
-SubTopic 10
-Name Accounting Standards Codification
-Section S99
-Paragraph 1
-Subparagraph (SX 210.5-02(31))
-Publisher FASB
-URI https://asc.fasb.org/1943274/2147480566/210-10-S99-1
Reference 4: http://www.xbrl.org/2003/role/exampleRef
-Topic 852
-SubTopic 10
-Name Accounting Standards Codification
-Section 55
-Paragraph 10
-Publisher FASB
-URI https://asc.fasb.org/1943274/2147481372/852-10-55-10
Reference 5: http://www.xbrl.org/2003/role/exampleRef
-Topic 946
-SubTopic 830
-Name Accounting Standards Codification
-Section 55
-Paragraph 12
-Publisher FASB
-URI https://asc.fasb.org/1943274/2147479168/946-830-55-12
Reference 6: http://www.xbrl.org/2003/role/disclosureRef
-Topic 946
-SubTopic 210
-Name Accounting Standards Codification
-Section S99
-Paragraph 1
-Subparagraph (SX 210.6-04(19))
-Publisher FASB
-URI https://asc.fasb.org/1943274/2147479170/946-210-S99-1
Reference 7: http://www.xbrl.org/2003/role/disclosureRef
-Topic 946
-SubTopic 210
-Name Accounting Standards Codification
-Section S99
-Paragraph 2
-Subparagraph (SX 210.6-05(4))
-Publisher FASB
-URI https://asc.fasb.org/1943274/2147479170/946-210-S99-2
Reference 8: http://www.xbrl.org/2009/role/commonPracticeRef
-Topic 946
-SubTopic 220
-Name Accounting Standards Codification
-Section S99
-Paragraph 3
-Subparagraph (SX 210.6-09(4)(b))
-Publisher FASB
-URI https://asc.fasb.org/1943274/2147479134/946-220-S99-3
Reference 9: http://www.xbrl.org/2003/role/disclosureRef
-Topic 946
-SubTopic 220
-Name Accounting Standards Codification
-Section S99
-Paragraph 3
-Subparagraph (SX 210.6-09(6))
-Publisher FASB
-URI https://asc.fasb.org/1943274/2147479134/946-220-S99-3
Reference 10: http://www.xbrl.org/2003/role/disclosureRef
-Topic 946
-SubTopic 220
-Name Accounting Standards Codification
-Section S99
-Paragraph 3
-Subparagraph (SX 210.6-09(7))
-Publisher FASB
-URI https://asc.fasb.org/1943274/2147479134/946-220-S99-3
Reference 11: http://www.xbrl.org/2009/role/commonPracticeRef
-Topic 235
-SubTopic 10
-Name Accounting Standards Codification
-Section S99
-Paragraph 1
-Subparagraph (SX 210.4-08(g)(1)(ii))
-Publisher FASB
-URI https://asc.fasb.org/1943274/2147480678/235-10-S99-1
Reference 12: http://www.xbrl.org/2009/role/commonPracticeRef
-Topic 323
-SubTopic 10
-Name Accounting Standards Codification
-Section 50
-Paragraph 3
-Subparagraph (c)
-Publisher FASB
-URI https://asc.fasb.org/1943274/2147481687/323-10-50-3
Reference 13: http://www.xbrl.org/2009/role/commonPracticeRef
-Topic 825
-SubTopic 10
-Name Accounting Standards Codification
-Section 50
-Paragraph 28
-Subparagraph (f)
-Publisher FASB
-URI https://asc.fasb.org/1943274/2147482907/825-10-50-28
Reference 14: http://fasb.org/us-gaap/role/ref/legacyRef
-Topic 310
-SubTopic 10
-Name Accounting Standards Codification
-Section S99
-Paragraph 2
-Subparagraph (SAB Topic 4.E)
-Publisher FASB
-URI https://asc.fasb.org/1943274/2147480418/310-10-S99-2
| Name: |
us-gaap_StockholdersEquity |
| Namespace Prefix: |
us-gaap_ |
| Data Type: |
xbrli:monetaryItemType |
| Balance Type: |
credit |
| Period Type: |
instant |
|
v3.24.3
| X |
- DefinitionAggregate dividends declared during the period for each share of common stock outstanding. Reference 1: http://fasb.org/us-gaap/role/ref/legacyRef
-Topic 505
-SubTopic 10
-Name Accounting Standards Codification
-Section S99
-Paragraph 1
-Subparagraph (SX 210.3-04)
-Publisher FASB
-URI https://asc.fasb.org/1943274/2147480008/505-10-S99-1
| Name: |
us-gaap_CommonStockDividendsPerShareDeclared |
| Namespace Prefix: |
us-gaap_ |
| Data Type: |
dtr-types:perShareItemType |
| Balance Type: |
na |
| Period Type: |
duration |
|
| X |
- References
+ Details
| Name: |
us-gaap_StatementOfStockholdersEquityAbstract |
| Namespace Prefix: |
us-gaap_ |
| Data Type: |
xbrli:stringItemType |
| Balance Type: |
na |
| Period Type: |
duration |
|
v3.24.3
Basis Of Presentation
|
9 Months Ended |
Sep. 30, 2024 |
|---|
| Basis Of Presentation [Abstract] |
|
| Basis Of Presentation |
In the opinion of management, the accompanying condensed consolidated financial statements of Tredegar Corporation and its subsidiaries (“Tredegar,” “the Company,” “we,” “us” or “our”) contain all adjustments necessary to state fairly, in all material respects, Tredegar’s condensed consolidated financial position as of September 30, 2024, the condensed consolidated results of operations for the three and nine months ended September 30, 2024 and 2023, the condensed consolidated cash flows for the nine months ended September 30, 2024 and 2023, and the condensed consolidated changes in shareholders’ equity for the three and nine months ended September 30, 2024 and 2023, in accordance with U.S. generally accepted accounting principles (“GAAP”). All such adjustments, unless otherwise detailed in the notes to the condensed consolidated financial statements, are deemed to be of a normal, recurring nature. The Company operates on a calendar fiscal year except for the Aluminum Extrusions segment, which operates on a 52/53-week fiscal year basis. As such, the fiscal third quarter for 2024 and 2023 for this segment references 13-week periods ended September 29, 2024 and September 24, 2023, respectively. The Company does not believe the impact of reporting the results of this segment as stated above is material to the consolidated financial results. The Company may fund or receive cash from the Aluminum Extrusions segment based on Aluminum Extrusion’s cash flows from operations during the intervening period from Aluminum Extrusion’s fiscal quarter end and the Company’s fiscal quarter end. The condensed consolidated financial statements as of December 31, 2023 that is included herein was derived from the audited consolidated financial statements provided in the Company’s Annual Report on Form 10-K for the year ended December 31, 2023 (“2023 Form 10-K”) but does not include all disclosures required by GAAP. These financial statements should be read in conjunction with the audited consolidated financial statements and related notes included in the 2023 Form 10-K. The results of operations for the three and nine months ended September 30, 2024, are not necessarily indicative of the results to be expected for the full year. Sale of Flexible Packaging Films On September 1, 2023, the Company announced that it had entered into a definitive agreement to sell its Flexible Packaging Films business (also referred to as "Terphane") to Oben Group (the "Terphane Sale"). Completion of the sale is contingent upon the satisfaction of customary closing conditions, including the receipt of certain competition filing approvals by authorities in Brazil and Colombia. The Colombian authority cleared the merger review regarding the transaction in early February 2024. On October 27, 2023, the Company filed the requisite competition forms with the Administrative Council for Economic Defense (“CADE”) in Brazil. As part of the Brazilian merger review process regarding the sale of Terphane to Oben Group ("Oben"), on May 13, 2024, the General Superintendence of the Administrative Council for Economic Defense ("SG-CADE") issued a non-binding opinion ("SG Opinion") recommending the rejection of the transaction. Following this first stage of the two-stage Brazilian merger review process for complex transactions, the case was submitted to the CADE Tribunal, in accordance with the customary Brazilian merger review process. As of September 30, 2024, the Company reported results for Terphane as a continuing operation, due to the uncertainty related to the Brazilian merger review process. On October 16, 2024, CADE approved a merger control agreement allowing Tredegar to proceed with the sale of Terphane to Oben. This approval was the indication that the sale of Terphane was probable. Refer to Note 11 for additional information. Closure of PE Films Technical Center In August 2023, the Company adopted a plan to close the PE Films technical center in Richmond, VA and reduce its efforts to develop and sell films supporting the semiconductor market. Research & development activities for PE Films are now being performed at the production facility in Pottsville, PA. PE Films continues to have new business opportunities primarily relating to surface protection films that protect components of flat panel and flexible displays. All activities ceased at the PE Films technical center in Richmond, VA as of the end of the first quarter of 2024. The Company recognized expense incurred through September 30, 2024 associated with the exit activities of $0.2 million for building closure costs. In addition, the Company recognized a non-cash loss on the lease abandonment ($0.3 million). Supply Chain Financing As of September 30, 2024 and December 31, 2023, $11.8 million and $15.8 million, respectively, of the Company’s accounts payable were financed by participating suppliers through third-party financial institutions. Goodwill The Company assesses goodwill for impairment when events or circumstances indicate that the carrying value may not be recoverable, or, at a minimum, on an annual basis (December 1st of each year). As of September 30, 2024, the Company’s reporting units with goodwill were Surface Protection in PE Films ("Surface Protection") and Futura in Aluminum Extrusions (“Futura”). No events or circumstances were identified during the third quarter of 2024 that indicate that Surface Protection's fair value is more likely than not less than its carrying amount. No events or circumstances were identified during the third quarter of 2023 that indicated that Futura’s fair value was more likely than not less than its carrying amount. Uncertainty about the timing of a recovery in the consumer electronics market persists, and manufacturers in the supply chain for consumer electronics continue to experience reduced capacity utilization and inventory corrections. In light of the limited visibility on the timing of a recovery and the expected adverse future impact to the Surface Protection business, coupled with a cautious outlook on new product development opportunities, the Company performed a Step 1 goodwill impairment analysis of the Surface Protection component of PE Films, as of September 30, 2023. This analysis utilized projections that contemplate the expected market recovery and business conditions, including for its three significant customers, as these events indicated Surface Protection’s fair value is more likely than not less than its carrying amount. The Company estimated the fair value of Surface Protection at September 30, 2023 by: (i) computing an estimated enterprise value (“EV”) utilizing the discounted cash flow method (the “DCF Method”), (ii) applying adjustments for any surplus or deficient working capital, (iii) adding cash and cash equivalents, and (iv) subtracting interest-bearing debt. The DCF Method was used, incorporating Surface Protection’s latest projections which reflect updated expected market recovery levels, feasibility of launching new product applications, competitive pricing and cash flows associated with production efficiencies, as well as consideration of cost savings and inventory corrections. The analysis concluded that the fair value of Surface Protection was less than its carrying value, thus a non-cash partial goodwill impairment of $19.5 million ($15.1 million after deferred income tax benefits) was recognized during the third quarter of 2023 and $34.9 million ($27.0 million after deferred income tax benefits) during the first nine months of 2023. Accounting standards not yet adopted
|
| X |
- DefinitionBasis Of Presentation [Abstract]
| Name: |
tg_BasisOfPresentationAbstract |
| Namespace Prefix: |
tg_ |
| Data Type: |
xbrli:stringItemType |
| Balance Type: |
na |
| Period Type: |
duration |
|
| X |
- DefinitionThe entire disclosure for the basis of accounting, or basis of presentation, used to prepare the financial statements (for example, US Generally Accepted Accounting Principles, Other Comprehensive Basis of Accounting, IFRS). Reference 1: http://fasb.org/us-gaap/role/ref/legacyRef
-Topic 235
-Name Accounting Standards Codification
-Publisher FASB
-URI https://asc.fasb.org/235/tableOfContent
| Name: |
us-gaap_BasisOfAccounting |
| Namespace Prefix: |
us-gaap_ |
| Data Type: |
dtr-types:textBlockItemType |
| Balance Type: |
na |
| Period Type: |
duration |
|
v3.24.3
Accounts and Other Receivables
|
9 Months Ended |
Sep. 30, 2024 |
|---|
| Receivables [Abstract] |
|
| Accounts and Other Receivables |
As of September 30, 2024 and December 31, 2023, accounts and other receivables, net include the following: | | | | | | | | | | | | | (In thousands) | September 30, 2024 | | December 31, 2023 | | Customer receivables | $ | 81,735 | | | $ | 67,183 | | | Other receivables | 2,327 | | | 3,056 | | | Total accounts and other receivables | 84,062 | | | 70,239 | | | Less: Allowance for bad debts | (2,426) | | | (2,301) | | | Total accounts and other receivables, net | $ | 81,636 | | | $ | 67,938 | |
|
| X |
- DefinitionThe entire disclosure for financing receivable. Reference 1: http://www.xbrl.org/2003/role/exampleRef
-Topic 310
-SubTopic 10
-Name Accounting Standards Codification
-Section 55
-Paragraph 12A
-Publisher FASB
-URI https://asc.fasb.org/1943274/2147481933/310-10-55-12A
Reference 2: http://www.xbrl.org/2003/role/disclosureRef
-Topic 310
-SubTopic 10
-Name Accounting Standards Codification
-Section 50
-Paragraph 42
-Subparagraph (a)(2)
-Publisher FASB
-URI https://asc.fasb.org/1943274/2147481962/310-10-50-42
Reference 3: http://www.xbrl.org/2003/role/disclosureRef
-Topic 310
-SubTopic 10
-Name Accounting Standards Codification
-Section 50
-Paragraph 44
-Subparagraph (a)(1)
-Publisher FASB
-URI https://asc.fasb.org/1943274/2147481962/310-10-50-44
Reference 4: http://www.xbrl.org/2003/role/disclosureRef
-Topic 310
-SubTopic 10
-Name Accounting Standards Codification
-Publisher FASB
-URI https://asc.fasb.org/310-10/tableOfContent
Reference 5: http://www.xbrl.org/2003/role/disclosureRef
-Topic 310
-SubTopic 20
-Name Accounting Standards Codification
-Publisher FASB
-URI https://asc.fasb.org/310-20/tableOfContent
| Name: |
us-gaap_FinancingReceivablesTextBlock |
| Namespace Prefix: |
us-gaap_ |
| Data Type: |
dtr-types:textBlockItemType |
| Balance Type: |
na |
| Period Type: |
duration |
|
| X |
- References
+ Details
| Name: |
us-gaap_ReceivablesAbstract |
| Namespace Prefix: |
us-gaap_ |
| Data Type: |
xbrli:stringItemType |
| Balance Type: |
na |
| Period Type: |
duration |
|
v3.24.3
Inventories
|
9 Months Ended |
Sep. 30, 2024 |
|---|
| Inventory, Net [Abstract] |
|
| Inventories |
The components of inventories are as follows: | | | | | | | | | | | | | (In thousands) | September 30, 2024 | | December 31, 2023 | | Finished goods | $ | 31,782 | | | $ | 29,821 | | | Work-in-process | 8,332 | | | 7,830 | | | Raw materials | 23,497 | | | 21,939 | | | Stores, supplies and other | 24,447 | | | 22,447 | | | Total | $ | 88,058 | | | $ | 82,037 | |
|
| X |
- DefinitionThe entire disclosure for inventory. Includes, but is not limited to, the basis of stating inventory, the method of determining inventory cost, the classes of inventory, and the nature of the cost elements included in inventory. Reference 1: http://www.xbrl.org/2003/role/disclosureRef
-Topic 330
-Name Accounting Standards Codification
-Publisher FASB
-URI https://asc.fasb.org/330/tableOfContent
| Name: |
us-gaap_InventoryDisclosureTextBlock |
| Namespace Prefix: |
us-gaap_ |
| Data Type: |
dtr-types:textBlockItemType |
| Balance Type: |
na |
| Period Type: |
duration |
|
| X |
- References
+ Details
| Name: |
us-gaap_InventoryNetAbstract |
| Namespace Prefix: |
us-gaap_ |
| Data Type: |
xbrli:stringItemType |
| Balance Type: |
na |
| Period Type: |
duration |
|
v3.24.3
Pension And Other Post-Retirement Benefits
|
9 Months Ended |
Sep. 30, 2024 |
|---|
| Retirement Benefits [Abstract] |
|
| Pension And Other Post-Retirement Benefits |
Tredegar sponsored a noncontributory defined benefit (pension) plan covering certain current and former U.S. employees. As of January 31, 2018, the plan no longer accrued benefits associated with crediting employees for service, thereby freezing all future benefits under the plan. On February 10, 2022, Tredegar announced the initiation of a process to terminate and settle its frozen defined benefit pension plan through lump sum distributions and the purchase of annuity contracts. On November 3, 2023, the pension plan termination and settlement process for the Company was completed, and the remaining pension plan obligation was transferred to Massachusetts Mutual Life Insurance Company. During 2023, the Company recognized a total pre-tax pension settlement loss of $92.3 million. During the third quarter of 2023, the Company remeasured the pension plan, which resulted in a pre-tax pension settlement loss in the condensed consolidated results of operation of $25.6 million. The remeasurement of the pension benefit obligation and plan assets was triggered by $64.5 million of lump sum distributions from the pension plan assets which exceeded the pension plan's service and interest cost. Tredegar also has a non-qualified supplemental pension plan covering certain employees. Effective December 31, 2005, further participation in this plan was terminated and benefit accruals for existing participants were frozen. Pension expense recognized for this plan was immaterial in the three and nine months ended September 30, 2024 and 2023. This information has been included in the pension benefit table below. The components of net periodic benefit cost for the pension and other postretirement benefit programs reflected in the condensed consolidated statements of income for the three and nine months ended September 30, 2024 and 2023, are shown below: | | | | | | | | | | | | | | | | | | | | | | | | | Pension Benefits | | Other Post-Retirement Benefits | | | Three Months Ended September 30, | | Three Months Ended September 30, | | (In thousands) | 2024 | | 2023 | | 2024 | | 2023 | | Service cost | $ | — | | | $ | — | | | $ | 3 | | | $ | 3 | | | Interest cost | 20 | | | 2,786 | | | 65 | | | 71 | | | Expected return on plan assets | — | | | (2,328) | | | — | | | — | | Pension settlement loss(a) | — | | | 25,612 | | | — | | | — | | | Amortization of prior service costs, (gains) losses and net transition asset | 3 | | | 2,644 | | | (37) | | | (58) | | | Net periodic benefit cost | $ | 23 | | | $ | 28,714 | | | $ | 31 | | | $ | 16 | | | | | | | | | | | Pension Benefits | | Other Post-Retirement Benefits | | | Nine Months Ended September 30, | | Nine Months Ended September 30, | | (In thousands) | 2024 | | 2023 | | 2024 | | 2023 | | Service cost | $ | — | | | $ | — | | | $ | 8 | | | $ | 9 | | | Interest cost | 57 | | | 8,842 | | | 203 | | | 213 | | | Expected return on plan assets | — | | | (7,542) | | | — | | | — | | Pension settlement loss(a) | — | | | 25,612 | | | — | | | — | | | Amortization of prior service costs, (gains) losses and net transition asset | 15 | | | 8,609 | | | (120) | | | (176) | | | Net periodic benefit cost | $ | 72 | | | $ | 35,521 | | | $ | 91 | | | $ | 46 | | | (a) Pension settlement loss, included in the consolidated statements of operation, represents pension settlement charges due to lump sum payments to participants. |
Pension and other postretirement liabilities were $7.1 million and $7.3 million at September 30, 2024 and December 31, 2023, respectively ($0.7 million included in “Accrued expenses” at September 30, 2024 and December 31, 2023 with the remainder included in “Pension and other postretirement benefit obligations, net” in the condensed consolidated balance sheets). Tredegar funds its other postretirement benefits on a claims-made basis; for 2024, the Company anticipates the amount will be consistent with amounts paid for the year ended December 31, 2023, or approximately $0.4 million.
|
| X |
- References
+ Details
| Name: |
us-gaap_CompensationAndRetirementDisclosureAbstract |
| Namespace Prefix: |
us-gaap_ |
| Data Type: |
xbrli:stringItemType |
| Balance Type: |
na |
| Period Type: |
duration |
|
| X |
- DefinitionThe entire disclosure for retirement benefits. Reference 1: http://www.xbrl.org/2003/role/disclosureRef
-Topic 715
-SubTopic 70
-Name Accounting Standards Codification
-Section 50
-Paragraph 1
-Publisher FASB
-URI https://asc.fasb.org/1943274/2147480794/715-70-50-1
Reference 2: http://www.xbrl.org/2003/role/exampleRef
-Topic 715
-SubTopic 20
-Name Accounting Standards Codification
-Section 55
-Paragraph 17
-Publisher FASB
-URI https://asc.fasb.org/1943274/2147480482/715-20-55-17
Reference 3: http://www.xbrl.org/2003/role/disclosureRef
-Topic 715
-SubTopic 20
-Name Accounting Standards Codification
-Section 50
-Paragraph 1
-Subparagraph (d)(iv)(03)
-Publisher FASB
-URI https://asc.fasb.org/1943274/2147480506/715-20-50-1
Reference 4: http://www.xbrl.org/2003/role/disclosureRef
-Topic 715
-SubTopic 20
-Name Accounting Standards Codification
-Section 50
-Paragraph 1
-Subparagraph (d)(i)
-Publisher FASB
-URI https://asc.fasb.org/1943274/2147480506/715-20-50-1
Reference 5: http://www.xbrl.org/2003/role/disclosureRef
-Topic 715
-SubTopic 20
-Name Accounting Standards Codification
-Section 50
-Paragraph 1
-Subparagraph (q)
-Publisher FASB
-URI https://asc.fasb.org/1943274/2147480506/715-20-50-1
Reference 6: http://www.xbrl.org/2003/role/disclosureRef
-Topic 715
-SubTopic 20
-Name Accounting Standards Codification
-Section 50
-Paragraph 1
-Subparagraph (l)
-Publisher FASB
-URI https://asc.fasb.org/1943274/2147480506/715-20-50-1
Reference 7: http://www.xbrl.org/2003/role/disclosureRef
-Topic 715
-Name Accounting Standards Codification
-Publisher FASB
-URI https://asc.fasb.org/715/tableOfContent
Reference 8: http://www.xbrl.org/2003/role/disclosureRef
-Topic 715
-SubTopic 20
-Name Accounting Standards Codification
-Section 50
-Paragraph 1
-Subparagraph (d)(iii)
-Publisher FASB
-URI https://asc.fasb.org/1943274/2147480506/715-20-50-1
Reference 9: http://www.xbrl.org/2003/role/disclosureRef
-Topic 715
-SubTopic 20
-Name Accounting Standards Codification
-Section 50
-Paragraph 1
-Subparagraph (o)
-Publisher FASB
-URI https://asc.fasb.org/1943274/2147480506/715-20-50-1
Reference 10: http://www.xbrl.org/2003/role/disclosureRef
-Topic 715
-SubTopic 20
-Name Accounting Standards Codification
-Section 50
-Paragraph 1
-Subparagraph (p)
-Publisher FASB
-URI https://asc.fasb.org/1943274/2147480506/715-20-50-1
Reference 11: http://www.xbrl.org/2003/role/disclosureRef
-Topic 715
-SubTopic 20
-Name Accounting Standards Codification
-Section 50
-Paragraph 1
-Subparagraph (r)(1)
-Publisher FASB
-URI https://asc.fasb.org/1943274/2147480506/715-20-50-1
Reference 12: http://www.xbrl.org/2003/role/disclosureRef
-Topic 715
-SubTopic 20
-Name Accounting Standards Codification
-Section 50
-Paragraph 1
-Subparagraph (r)(2)
-Publisher FASB
-URI https://asc.fasb.org/1943274/2147480506/715-20-50-1
Reference 13: http://www.xbrl.org/2003/role/disclosureRef
-Topic 715
-SubTopic 20
-Name Accounting Standards Codification
-Section S99
-Paragraph 2
-Publisher FASB
-URI https://asc.fasb.org/1943274/2147480126/715-20-S99-2
Reference 14: http://www.xbrl.org/2003/role/disclosureRef
-Topic 715
-SubTopic 60
-Name Accounting Standards Codification
-Section 50
-Paragraph 3
-Subparagraph (c)
-Publisher FASB
-URI https://asc.fasb.org/1943274/2147480266/715-60-50-3
| Name: |
us-gaap_PensionAndOtherPostretirementBenefitsDisclosureTextBlock |
| Namespace Prefix: |
us-gaap_ |
| Data Type: |
dtr-types:textBlockItemType |
| Balance Type: |
na |
| Period Type: |
duration |
|
v3.24.3
Earnings Per Share
|
9 Months Ended |
Sep. 30, 2024 |
|---|
| Earnings Per Share [Abstract] |
|
| Earnings Per Share |
Basic earnings per share is computed by dividing net income (loss) by the weighted average number of shares of common stock outstanding. Diluted earnings per share is computed by dividing net income (loss) by the weighted average common and potentially dilutive common equivalent shares outstanding, determined as follows: | | | | | | | | | | | | | | | | | | | | | | | | | | Three Months Ended September 30, | | Nine Months Ended September 30, | | (In thousands) | 2024 | | 2023 | | 2024 | | 2023 | | Weighted average shares outstanding used to compute basic earnings per share | 34,391 | | | 34,264 | | | 34,364 | | | 34,081 | | | Incremental dilutive shares attributable to stock options and restricted stock | — | | | — | | | — | | | — | | | Shares used to compute diluted earnings per share | 34,391 | | | 34,264 | | | 34,364 | | | 34,081 | |
Incremental shares attributable to stock options and restricted stock are computed under the treasury stock method using the average market price during the related period. If the Company had reported net income for the three months ended September 30, 2024, average out-of-the-money options to purchase shares that were excluded from the calculation of incremental shares attributable to stock options and restricted stock would have been 2,353,905. Average out-of-the-money options to purchase shares that were excluded from the calculation of incremental shares attributable to stock options and restricted stock were 2,550,542 for the nine months ended September 30, 2024. If the Company had reported net income for the three and nine months ended September 30, 2023, the average out-of-the-money options to purchase shares that would be excluded from the calculation of incremental shares attributable to stock options and restricted stock would have been 3,019,333 and 2,893,677, respectively.
|
| X |
- References
+ Details
| Name: |
us-gaap_EarningsPerShareAbstract |
| Namespace Prefix: |
us-gaap_ |
| Data Type: |
xbrli:stringItemType |
| Balance Type: |
na |
| Period Type: |
duration |
|
| X |
- DefinitionThe entire disclosure for earnings per share. Reference 1: http://www.xbrl.org/2003/role/disclosureRef
-Topic 260
-SubTopic 10
-Name Accounting Standards Codification
-Section 50
-Paragraph 1
-Subparagraph (c)
-Publisher FASB
-URI https://asc.fasb.org/1943274/2147482662/260-10-50-1
Reference 2: http://www.xbrl.org/2003/role/disclosureRef
-Topic 260
-Name Accounting Standards Codification
-Publisher FASB
-URI https://asc.fasb.org/260/tableOfContent
Reference 3: http://www.xbrl.org/2003/role/disclosureRef
-Topic 260
-SubTopic 10
-Name Accounting Standards Codification
-Section 50
-Paragraph 2
-Publisher FASB
-URI https://asc.fasb.org/1943274/2147482662/260-10-50-2
Reference 4: http://www.xbrl.org/2003/role/disclosureRef
-Topic 260
-SubTopic 10
-Name Accounting Standards Codification
-Section 50
-Paragraph 3
-Publisher FASB
-URI https://asc.fasb.org/1943274/2147482662/260-10-50-3
| Name: |
us-gaap_EarningsPerShareTextBlock |
| Namespace Prefix: |
us-gaap_ |
| Data Type: |
dtr-types:textBlockItemType |
| Balance Type: |
na |
| Period Type: |
duration |
|
v3.24.3
Accumulated Other Comprehensive Income (Loss)
|
9 Months Ended |
Sep. 30, 2023 |
|---|
| Other Comprehensive Income (Loss), Net of Tax [Abstract] |
|
| Comprehensive Income (Loss) Note [Text Block] |
The changes in accumulated other comprehensive income (loss) by component for the three months ended September 30, 2024. | | | | | | | | | | | | | | | | | | | | | | | | | (In thousands) | Foreign Currency Translation | | Gain (Loss) on Derivative Financial Instruments | | Pension & Other Postretirement Benefit Adjust | | Total Accumulated Other Comprehensive Income (Loss) | | Balance at July 1, 2024 | $ | (90,273) | | | $ | (564) | | | $ | 484 | | | $ | (90,353) | | | Other comprehensive income (loss) | 1,500 | | | 262 | | | — | | | 1,762 | | | Income tax (expense) benefit | (4) | | | (41) | | | — | | | (45) | | | Other comprehensive income (loss), net of tax | 1,496 | | | 221 | | | — | | | 1,717 | | | Reclassification adjustment to net income (loss) | — | | | 281 | | | (34) | | | 247 | | | Income tax (expense) benefit | — | | | (79) | | | 7 | | | (72) | | | Reclassification adjustment to net income (loss), net of tax | — | | | 202 | | | (27) | | | 175 | | | Other comprehensive income (loss), net of tax | 1,496 | | | 423 | | | (27) | | | 1,892 | | Balance at September 30, 2024 | $ | (88,777) | | | $ | (141) | | | $ | 457 | | | $ | (88,461) | |
The changes in accumulated other comprehensive income (loss) by component for the nine months ended September 30, 2024. | | | | | | | | | | | | | | | | | | | | | | | | | (In thousands) | Foreign Currency Translation | | Gain (Loss) on Derivative Financial Instruments | | Pension & Other Postretirement Benefit Adjust | | Total Accumulated Other Comprehensive Income (Loss) | | Balance at January 1, 2024 | $ | (83,037) | | | $ | 801 | | | $ | 539 | | | $ | (81,697) | | | Other comprehensive income (loss) | (6,206) | | | (1,435) | | | — | | | (7,641) | | | Income tax (expense) benefit | 466 | | | 275 | | | — | | | 741 | | | Other comprehensive income (loss), net of tax | (5,740) | | | (1,160) | | | — | | | (6,900) | | | Reclassification adjustment to net income (loss) | — | | | 220 | | | (105) | | | 115 | | | Income tax (expense) benefit | — | | | (2) | | | 23 | | | 21 | | | Reclassification adjustment to net income (loss), net of tax | — | | | 218 | | | (82) | | | 136 | | | Other comprehensive income (loss), net of tax | (5,740) | | | (942) | | | (82) | | | (6,764) | | Balance at September 30, 2024 | $ | (88,777) | | | $ | (141) | | | $ | 457 | | | $ | (88,461) | |
The changes in accumulated other comprehensive income (loss) by component for the three months ended September 30, 2023. | | | | | | | | | | | | | | | | | | | | | | | | | (In thousands) | Foreign Currency Translation | | Gain (Loss) on Derivative Financial Instruments | | Pension & Other Postretirement Benefit Adjust | | Total Accumulated Other Comprehensive Income (Loss) | | Balance at July 1, 2023 | $ | (83,338) | | | $ | (843) | | | $ | (54,463) | | | $ | (138,644) | | | Other comprehensive income (loss) | (1,793) | | | 2,287 | | | 442 | | | 936 | | | Income tax (expense) benefit | (25) | | | (197) | | | — | | | (222) | | | Other comprehensive income (loss), net of tax | (1,818) | | | 2,090 | | | 442 | | | 714 | | | Reclassification adjustment to net income (loss) | — | | | (2,756) | | | 28,198 | | | 25,442 | | | Income tax (expense) benefit | — | | | 735 | | | (6,218) | | | (5,483) | | | Reclassification adjustment to net income (loss), net of tax | — | | | (2,021) | | | 21,980 | | | 19,959 | | | Other comprehensive income (loss), net of tax | (1,818) | | | 69 | | | 22,422 | | | 20,673 | | Balance at September 30, 2023 | $ | (85,156) | | | $ | (774) | | | $ | (32,041) | | | $ | (117,971) | |
The changes in accumulated other comprehensive income (loss) by component for the nine months ended September 30, 2023. | | | | | | | | | | | | | | | | | | | | | | | | | (In thousands) | Foreign Currency Translation | | Gain (Loss) on Derivative Financial Instruments | | Pension & Other Postretirement Benefit Adjust | | Total Accumulated Other Comprehensive Income (Loss) | | Balance at January 1, 2023 | $ | (86,079) | | | $ | (2,480) | | | $ | (59,036) | | | $ | (147,595) | | | Other comprehensive income (loss) | 1,563 | | | 7,852 | | | 442 | | | 9,857 | | | Income tax (expense) benefit | (640) | | | (2,228) | | | — | | | (2,868) | | | Other comprehensive income (loss), net of tax | 923 | | | 5,624 | | | 442 | | | 6,989 | | | Reclassification adjustment to net income (loss) | — | | | (5,350) | | | 34,045 | | | 28,695 | | | Income tax (expense) benefit | — | | | 1,432 | | | (7,492) | | | (6,060) | | | Reclassification adjustment to net income (loss), net of tax | — | | | (3,918) | | | 26,553 | | | 22,635 | | | Other comprehensive income (loss), net of tax | 923 | | | 1,706 | | | 26,995 | | | 29,624 | | Balance at September 30, 2023 | $ | (85,156) | | | $ | (774) | | | $ | (32,041) | | | $ | (117,971) | |
|
| X |
- DefinitionThe entire disclosure for comprehensive income, which includes, but is not limited to, 1) the amount of income tax expense or benefit allocated to each component of other comprehensive income, including reclassification adjustments, 2) the reclassification adjustments for each classification of other comprehensive income and 3) the ending accumulated balances for each component of comprehensive income. Reference 1: http://www.xbrl.org/2003/role/disclosureRef
-Topic 944
-SubTopic 220
-Name Accounting Standards Codification
-Section S99
-Paragraph 1
-Subparagraph (SX 210.7-04(19))
-Publisher FASB
-URI https://asc.fasb.org/1943274/2147477250/944-220-S99-1
Reference 2: http://www.xbrl.org/2003/role/disclosureRef
-Topic 220
-SubTopic 10
-Name Accounting Standards Codification
-Section S99
-Paragraph 2
-Subparagraph (SX 210.5-03(21))
-Publisher FASB
-URI https://asc.fasb.org/1943274/2147483621/220-10-S99-2
Reference 3: http://www.xbrl.org/2003/role/disclosureRef
-Topic 942
-SubTopic 220
-Name Accounting Standards Codification
-Section S99
-Paragraph 1
-Subparagraph (SX 210.9-04(23))
-Publisher FASB
-URI https://asc.fasb.org/1943274/2147478524/942-220-S99-1
Reference 4: http://fasb.org/us-gaap/role/ref/legacyRef
-Topic 220
-Name Accounting Standards Codification
-Publisher FASB
-URI https://asc.fasb.org/220/tableOfContent
| Name: |
us-gaap_ComprehensiveIncomeNoteTextBlock |
| Namespace Prefix: |
us-gaap_ |
| Data Type: |
dtr-types:textBlockItemType |
| Balance Type: |
na |
| Period Type: |
duration |
|
| X |
- References
+ Details
| Name: |
us-gaap_OtherComprehensiveIncomeLossNetOfTaxPeriodIncreaseDecreaseAbstract |
| Namespace Prefix: |
us-gaap_ |
| Data Type: |
xbrli:stringItemType |
| Balance Type: |
na |
| Period Type: |
duration |
|
v3.24.3
Derivative Financial Instruments
|
9 Months Ended |
Sep. 30, 2024 |
|---|
| Summary of Derivative Instruments [Abstract] |
|
| Derivative Financial Instruments |
Tredegar uses derivative financial instruments for the purpose of hedging margin exposure from fixed-price forward sales contracts in Aluminum Extrusions and exposure from currency volatility that exists as part of ongoing business operations in Flexible Packaging Films. These derivative financial instruments are designated as and qualify as cash flow hedges and are recognized in the condensed consolidated balance sheet at fair value. If individual derivative instruments with the same counterparty can be settled on a net basis, the Company records the corresponding derivative fair values as a net asset or net liability. In the normal course of business, Aluminum Extrusions enters into fixed-price forward sales contracts with a small subset of its customers for the future sale of fixed quantities of aluminum extrusions at scheduled intervals. In order to hedge margin exposure created from the fixing of future sales prices relative to volatile raw material (aluminum) costs, Aluminum Extrusions enters into a combination of forward purchase commitments and futures contracts to acquire or hedge aluminum, based on the scheduled purchases for the firm sales commitments. The fixed-price firm sales commitments and related hedging instruments have durations generally no longer than 12 months. The notional amount of aluminum futures contracts that hedged future purchases of aluminum to meet fixed-price forward sales contract obligations was $6.0 million (4.3 million pounds of aluminum) at September 30, 2024 and $7.7 million (5.6 million pounds of aluminum) at December 31, 2023. The table below summarizes the location and gross amounts of aluminum futures contract fair values (Level 2) in the condensed consolidated balance sheets as of September 30, 2024 and December 31, 2023: | | | | | | | | | | | | | | | | | | | | | | | | | | September 30, 2024 | | December 31, 2023 | | (In thousands) | Balance Sheet
Account | | Fair
Value | | Balance Sheet
Account | | Fair
Value | | Derivatives Designated as Hedging Instruments | | | | | | | | Asset derivatives: Aluminum futures contracts | Prepaid expenses and other | | $ | 354 | | | Prepaid expenses and other | | $ | — | | | | | | | | | | Liability derivatives: Aluminum futures contracts | Accrued expenses | | (128) | | | Accrued expenses | | (483) | | | Aluminum futures contracts | Other non-current liabilities | | — | | | Other non-current liabilities | | (9) | | | Net asset (liability) | | | $ | 226 | | | | | $ | (492) | |
In the event that a counterparty to an aluminum fixed-price forward sales contract chooses not to take delivery of its aluminum extrusions, the customer is contractually obligated to compensate Aluminum Extrusions for any losses on the related aluminum futures and/or forward contracts through the date of cancellation. The Company's earnings are exposed to foreign currency exchange risk primarily through the translation of the financial statements of subsidiaries that have a functional currency other than the U.S. Dollar. The Company estimates that the net mismatch translation exposure for the Flexible Packaging Film's business unit in Brazil (“Terphane Ltda.”) of its sales and raw materials quoted or priced in U.S. Dollars and its variable conversion, fixed conversion and sales, general and administrative costs (before depreciation and amortization) quoted or priced in Brazilian Real ("R$") will result in an annual net cost of R$139 million for the full year of 2024. Terphane Ltda. had the following outstanding foreign exchange average forward rate contracts to purchase Brazilian Real and sell U.S. Dollars as of September 30, 2024: | | | | | | | | | | | | | | | | USD Notional Amount (000s) | Average Forward Rate Contracted on USD/BRL | R$ Equivalent Amount (000s) | Applicable Month | Estimated % of Terphane Ltda. R$ Operating Cost Exposure Hedged | | | | | | | | | | | | | | | | | | | | | | | | | | | | | | | | | | | | | | | | | | | | | | | | | | | | | | | | | | | | | | | | | | | | | | | | | | | | | | | | | | | | | | | | | | | | $1,851 | 5.4225 | R$10,037 | Oct-24 | 87% | | $1,837 | 5.4403 | R$9,994 | Nov-24 | 86% | | $1,801 | 5.4580 | R$9,830 | Dec-24 | 85% | | $5,489 | 5.4402 | R$29,861 | | 85% |
These foreign currency exchange contracts have been designated and qualify as cash flow hedges of Terphane Ltda.’s forecasted sales to customers quoted or priced in U.S. Dollars over that period. By changing the currency risk associated with these U.S. Dollar sales, the derivatives have the effect of offsetting operating costs quoted or priced in Brazilian Real and decreasing the net exposure to Brazilian Real in the condensed consolidated statements of income. The table below summarizes the location and gross amounts of foreign currency forward contract fair values (Level 2) in the condensed consolidated balance sheets as of September 30, 2024 and December 31, 2023: | | | | | | | | | | | | | | | | | | | | | | | | | | | September 30, 2024 | | December 31, 2023 | | (In thousands) | Balance Sheet
Account | | Fair
Value | | Balance Sheet
Account | | | Fair
Value | | Derivatives Designated as Hedging Instruments | | | | | | | | | Asset derivatives: Foreign currency forward contracts | Prepaid expenses and other | | $ | 219 | | | Prepaid expenses and other | | | $ | 2,050 | | | Foreign currency forward contracts | Other assets | | — | | | Other assets | | | 146 | | Liability derivatives: Foreign currency forward contracts | Accrued expenses | | (299) | | | Other non-current liabilities | | | — | | | | | | | | | | | | Net asset (liability) | | | $ | (80) | | | | | | $ | 2,196 | |
These derivative contracts involve elements of market risk that are not reflected on the condensed consolidated balance sheet, including the risk of dealing with counterparties and their ability to meet the terms of the contracts. The counterparties to any forward purchase commitments are major aluminum brokers and suppliers, and the counterparties to any aluminum futures contracts are major financial institutions. Fixed-price forward sales contracts are only made available to the most credit-worthy customers. The counterparties to the Company’s foreign currency cash flow hedge contracts are major financial institutions. The pre-tax effect on net income (loss) and other comprehensive income (loss) of derivative instruments classified as cash flow hedges and described in the previous paragraphs for the three and nine month periods ended September 30, 2024 and 2023 is summarized in the table below: | | | | | | | | | | | | | | | | | | | | | | | | | | | | | | | | | | Cash Flow Derivative Hedges | | | Three Months Ended September 30, | | | Aluminum Futures Contracts | | Foreign Currency Forwards | | (In thousands) | 2024 | | 2023 | | 2024 | | 2023 | | Amount of pre-tax gain (loss) recognized in other comprehensive income (loss) | $ | 10 | | | $ | 2,908 | | | $ | — | | $ | 252 | | | $ | — | | | $ | (621) | | | Location of gain (loss) reclassified from accumulated other comprehensive income (loss) into net income (effective portion) | Cost of goods sold | | Cost of goods sold | | Cost of goods sold | Selling, general & admin | | Cost of goods sold | | Selling, general & admin | | Amount of pre-tax gain (loss) reclassified from accumulated other comprehensive income (loss) to net income (effective portion) | $ | (153) | | | $ | 1,716 | | | $ | 16 | | $ | (144) | | | $ | 16 | | | $ | 1,024 | | | | Nine Months Ended September 30, | | | Aluminum Futures Contracts | | Foreign Currency Forwards | | | 2024 | | 2023 | | 2024 | | 2023 | | Amount of pre-tax gain (loss) recognized in other comprehensive income (loss) | $ | 56 | | | $ | 4,867 | | | $ | — | | $ | (1,491) | | | $ | — | | | $ | 2,985 | | | Location of gain (loss) reclassified from accumulated other comprehensive income (loss) into net income (effective portion) | Cost of goods sold | | Cost of goods sold | | Cost of goods sold | Selling, general & admin | | Cost of goods sold | | Selling, general & admin | | Amount of pre-tax gain (loss) reclassified from accumulated other comprehensive income (loss) to net income (effective portion) | $ | (662) | | | $ | 3,273 | | | $ | 46 | | $ | 396 | | | $ | 46 | | | $ | 2,031 | |
As of September 30, 2024, the Company expects $0.1 million of unrealized after-tax gains on aluminum and foreign currency derivative instruments reported in accumulated other comprehensive income (loss) to be reclassified to earnings within the next 12 months. For the three and nine month periods ended September 30, 2024 and 2023, net gains or losses realized, from previously unrealized net gains or losses on hedges that had been discontinued, were not material.
|
| X |
- DefinitionThe entire disclosure for derivative instruments and hedging activities including, but not limited to, risk management strategies, non-hedging derivative instruments, assets, liabilities, revenue and expenses, and methodologies and assumptions used in determining the amounts. Reference 1: http://www.xbrl.org/2003/role/disclosureRef
-Topic 815
-SubTopic 40
-Name Accounting Standards Codification
-Section 50
-Paragraph 5
-Subparagraph (f)
-Publisher FASB
-URI https://asc.fasb.org/1943274/2147480237/815-40-50-5
Reference 2: http://www.xbrl.org/2003/role/disclosureRef
-Topic 815
-SubTopic 10
-Name Accounting Standards Codification
-Section 50
-Paragraph 5C
-Subparagraph (b)
-Publisher FASB
-URI https://asc.fasb.org/1943274/2147480434/815-10-50-5C
Reference 3: http://fasb.org/us-gaap/role/ref/legacyRef
-Topic 815
-Name Accounting Standards Codification
-Publisher FASB
-URI https://asc.fasb.org/815/tableOfContent
| Name: |
us-gaap_DerivativeInstrumentsAndHedgingActivitiesDisclosureTextBlock |
| Namespace Prefix: |
us-gaap_ |
| Data Type: |
dtr-types:textBlockItemType |
| Balance Type: |
na |
| Period Type: |
duration |
|
| X |
- References
+ Details
| Name: |
us-gaap_SummaryOfDerivativeInstrumentsAbstract |
| Namespace Prefix: |
us-gaap_ |
| Data Type: |
xbrli:stringItemType |
| Balance Type: |
na |
| Period Type: |
duration |
|
v3.24.3
Income Taxes
|
9 Months Ended |
Sep. 30, 2024 |
|---|
| Income Tax Disclosure [Abstract] |
|
| Income Taxes |
Tredegar recorded tax expense (benefit) of $3.6 million on pre-tax income (loss) of $11.7 million in the first nine months of 2024. The effective tax rate in the first nine months of 2024 was 30.5% and 18.8% in the first nine months of 2023. The change in effective tax rate was primarily due to pre-tax income in the first nine months of 2024 versus a pre-tax loss in the first nine months of 2023. During the first nine months of 2024, Tredegar increased the valuation allowance on existing deferred tax assets as a result of the sale of Terphane by $1.0 million. The effective tax rate for the first nine months of 2024 varies from the 21% statutory rate primarily due to foreign rate differences and non-deductible expenses offset by Brazilian tax incentives and federal tax credits. The Brazilian federal statutory income tax rate is a composite of 34.0% (25.0% of income tax and 9.0% of social contribution on income). Terphane Ltda.’s manufacturing facility in Brazil is the beneficiary of certain income tax incentives that allow for a reduction in the statutory Brazilian federal income tax rate to 15.25% levied on the operating profit on certain of its products. The incentives have been granted for a 10-year period, from the commencement date of January 1, 2015 and were to expire at the end of 2024.
|
| X |
- DefinitionThe entire disclosure for income tax. Reference 1: http://www.xbrl.org/2003/role/disclosureRef
-Topic 740
-SubTopic 10
-Name Accounting Standards Codification
-Section 50
-Paragraph 12
-Publisher FASB
-URI https://asc.fasb.org/1943274/2147482685/740-10-50-12
Reference 2: http://www.xbrl.org/2003/role/exampleRef
-Topic 740
-SubTopic 10
-Name Accounting Standards Codification
-Section 55
-Paragraph 231
-Publisher FASB
-URI https://asc.fasb.org/1943274/2147482663/740-10-55-231
Reference 3: http://www.xbrl.org/2003/role/disclosureRef
-Topic 740
-SubTopic 10
-Name Accounting Standards Codification
-Section 50
-Paragraph 12C
-Publisher FASB
-URI https://asc.fasb.org/1943274/2147482685/740-10-50-12C
Reference 4: http://www.xbrl.org/2003/role/disclosureRef
-Topic 740
-SubTopic 10
-Name Accounting Standards Codification
-Section 50
-Paragraph 12B
-Publisher FASB
-URI https://asc.fasb.org/1943274/2147482685/740-10-50-12B
Reference 5: http://www.xbrl.org/2003/role/disclosureRef
-Topic 740
-SubTopic 270
-Name Accounting Standards Codification
-Section 50
-Paragraph 1
-Publisher FASB
-URI https://asc.fasb.org/1943274/2147477891/740-270-50-1
Reference 6: http://www.xbrl.org/2003/role/disclosureRef
-Topic 740
-SubTopic 10
-Name Accounting Standards Codification
-Section S99
-Paragraph 1
-Subparagraph (SAB Topic 6.I.5.Q1)
-Publisher FASB
-URI https://asc.fasb.org/1943274/2147479360/740-10-S99-1
Reference 7: http://www.xbrl.org/2003/role/disclosureRef
-Topic 946
-SubTopic 20
-Name Accounting Standards Codification
-Section 50
-Paragraph 13
-Publisher FASB
-URI https://asc.fasb.org/1943274/2147480990/946-20-50-13
Reference 8: http://www.xbrl.org/2003/role/disclosureRef
-Topic 235
-SubTopic 10
-Name Accounting Standards Codification
-Section S99
-Paragraph 1
-Subparagraph (SX 210.4-08(h)(2))
-Publisher FASB
-URI https://asc.fasb.org/1943274/2147480678/235-10-S99-1
Reference 9: http://www.xbrl.org/2003/role/disclosureRef
-Topic 740
-Name Accounting Standards Codification
-Publisher FASB
-URI https://asc.fasb.org/740/tableOfContent
Reference 10: http://www.xbrl.org/2003/role/disclosureRef
-Topic 740
-SubTopic 10
-Name Accounting Standards Codification
-Section 50
-Paragraph 14
-Publisher FASB
-URI https://asc.fasb.org/1943274/2147482685/740-10-50-14
Reference 11: http://www.xbrl.org/2003/role/disclosureRef
-Topic 740
-SubTopic 10
-Name Accounting Standards Codification
-Section 50
-Paragraph 21
-Publisher FASB
-URI https://asc.fasb.org/1943274/2147482685/740-10-50-21
Reference 12: http://www.xbrl.org/2003/role/disclosureRef
-Topic 740
-SubTopic 10
-Name Accounting Standards Codification
-Section 50
-Paragraph 17
-Subparagraph (b)
-Publisher FASB
-URI https://asc.fasb.org/1943274/2147482685/740-10-50-17
Reference 13: http://www.xbrl.org/2003/role/disclosureRef
-Topic 740
-SubTopic 10
-Name Accounting Standards Codification
-Section S99
-Paragraph 2
-Subparagraph (SAB Topic 11.C)
-Publisher FASB
-URI https://asc.fasb.org/1943274/2147479360/740-10-S99-2
Reference 14: http://www.xbrl.org/2003/role/disclosureRef
-Topic 740
-SubTopic 30
-Name Accounting Standards Codification
-Section 50
-Paragraph 2
-Subparagraph (a)
-Publisher FASB
-URI https://asc.fasb.org/1943274/2147482603/740-30-50-2
| Name: |
us-gaap_IncomeTaxDisclosureTextBlock |
| Namespace Prefix: |
us-gaap_ |
| Data Type: |
dtr-types:textBlockItemType |
| Balance Type: |
na |
| Period Type: |
duration |
|
v3.24.3
Segment Reporting
|
9 Months Ended |
Sep. 30, 2024 |
|---|
| Segment Reporting [Abstract] |
|
| Segment Reporting |
The Company’s business segments are Aluminum Extrusions, PE Films, and Flexible Packaging Films. Information by business segment is reported below. There are no accounting transactions between segments and no allocations to segments. The Company’s reportable segments are based on its method of internal reporting, which is generally segregated by differences in products. Accounting standards for presentation of segments require an approach based on the way the Company organizes the segments for making operating decisions and how the CODM assesses performance. Earnings before interest, taxes, depreciation and amortization ("EBITDA") from ongoing operations is the key profitability measure used by the CODM (Tredegar’s President and Chief Executive Officer) for purposes of assessing financial performance. The Company uses sales less freight (“net sales”) as its measure of revenues from external customers at the segment level. This measure is separately included in the financial information regularly provided to the CODM. The following table presents net sales and EBITDA from ongoing operations by segment for the three and nine months ended September 30, 2024 and 2023: | | | | | | | | | | | | | | | | | | | | | | | | | Three Months Ended September 30, | | Nine Months Ended September 30, | | (In thousands) | 2024 | | 2023 | | 2024 | | 2023 | | Net Sales | | | | | | | | | Aluminum Extrusions | $ | 115,717 | | | $ | 109,410 | | | $ | 349,353 | | | $ | 364,607 | | | PE Films | 24,879 | | | 19,938 | | | 78,811 | | | 56,036 | | | Flexible Packaging Films | 34,370 | | | 30,111 | | | 99,025 | | | 94,861 | | | Total net sales | 174,966 | | | 159,459 | | | 527,189 | | | 515,504 | | | Add back freight | 7,085 | | | 6,733 | | | 20,833 | | | 19,977 | | | Sales as shown in the condensed consolidated statements of income (loss) | $ | 182,051 | | | $ | 166,192 | | | $ | 548,022 | | | $ | 535,481 | | | EBITDA from Ongoing Operations | | | | | | | | | Aluminum Extrusions: | | | | | | | | | Ongoing operations: | | | | | | | | | EBITDA | $ | 6,177 | | | $ | 5,113 | | | $ | 31,624 | | | $ | 29,968 | | | Depreciation & amortization | (4,404) | | | (4,683) | | | (13,392) | | | (13,252) | | | EBIT | 1,773 | | | 430 | | | 18,232 | | | 16,716 | | | Plant shutdowns, asset impairments, restructurings and other | (2,170) | | | (1,483) | | | (4,986) | | | (1,821) | | | PE Films: | | | | | | | | | Ongoing operations: | | | | | | | | | EBITDA | 5,876 | | | 4,037 | | | 22,913 | | | 6,700 | | | Depreciation & amortization | (1,299) | | | (2,111) | | | (3,944) | | | (5,305) | | | EBIT | 4,577 | | | 1,926 | | | 18,969 | | | 1,395 | | | Plant shutdowns, asset impairments, restructurings and other | — | | | (4,566) | | | (584) | | | (4,565) | | | Goodwill impairment | — | | | (19,478) | | | — | | | (34,891) | | | Flexible Packaging Films: | | | | | | | | | Ongoing operations: | | | | | | | | | EBITDA | 3,749 | | | 477 | | | 8,915 | | | 2,076 | | | Depreciation & amortization | (708) | | | (704) | | | (2,191) | | | (2,115) | | | EBIT | 3,041 | | | (227) | | | 6,724 | | | (39) | | | Plant shutdowns, asset impairments, restructurings and other | (103) | | | — | | | (103) | | | (79) | | | Total | 7,118 | | | (23,398) | | | 38,252 | | | (23,284) | | | Interest income | 8 | | | 62 | | | 36 | | | 135 | | | Interest expense | 3,480 | | | 3,106 | | | 10,314 | | | 7,791 | | | Gain on investment in kaleo, Inc. | — | | | — | | | 144 | | | 262 | | | Stock option-based compensation costs | — | | | — | | | — | | | 231 | | | Pension settlement loss | — | | | 25,612 | | | — | | | 25,612 | | | Corporate expenses, net | 6,644 | | | 11,633 | | | 16,411 | | | 30,100 | | | Income (loss) before income taxes | (2,998) | | | (63,687) | | | 11,707 | | | (86,621) | | | Income tax expense (benefit) | 948 | | | (13,307) | | | 3,573 | | | (16,307) | | | Net income (loss) | $ | (3,946) | | | $ | (50,380) | | | $ | 8,134 | | | $ | (70,314) | |
The following table presents identifiable assets by segment at September 30, 2024 and December 31, 2023: | | | | | | | | | | | | | (In thousands) | September 30, 2024 | | December 31, 2023 | | Aluminum Extrusions | $ | 258,410 | | | $ | 255,756 | | | PE Films | 57,989 | | | 56,536 | | | Flexible Packaging Films | 85,297 | | | 84,062 | | | Subtotal | 401,696 | | | 396,354 | | | General corporate | 34,256 | | | 36,652 | | | Cash, cash equivalents and restricted cash | 6,588 | | | 13,455 | | | Total | $ | 442,540 | | | $ | 446,461 | |
The following tables disaggregate the Company’s revenue by geographic area and product group for the three and nine months ended September 30, 2024 and 2023: | | | | | | | | | | | | | | | | | | | | | | | | | Net Sales by Geographic Area (a) | | Three Months Ended September 30, | | Nine Months Ended September 30, | | (In thousands) | 2024 | | 2023 | | 2024 | | 2023 | | United States | $ | 133,157 | | | $ | 125,407 | | | $ | 407,465 | | | $ | 409,433 | | | Exports from the United States to: | | | | | | | | | Asia | 11,875 | | | 7,873 | | | 34,534 | | | 19,082 | | | Latin America | 1,395 | | | 1,764 | | | 4,121 | | | 5,440 | | | Canada | 3,437 | | | 3,640 | | | 10,459 | | | 12,879 | | | Europe | 405 | | | 282 | | | 1,053 | | | 1,414 | | | Operations outside the United States: | | | | | | | | | Brazil | 24,408 | | | 20,351 | | | 69,002 | | | 66,954 | | | Asia | 289 | | | 142 | | | 555 | | | 302 | | | Total | $ | 174,966 | | | $ | 159,459 | | | $ | 527,189 | | | $ | 515,504 | | (a) Export sales relate mostly to PE Films. Operations in Brazil relate to Flexible Packaging Films. |
The Company’s facilities in Pottsville, PA (“PV”) and Guangzhou, China (“GZ”) have a tolling arrangement whereby certain surface protection films are manufactured in GZ for a fee with raw materials supplied from PV that are then shipped by GZ directly to customers principally in the Asian market, but paid by customers directly to PV. Amounts associated with this intercompany tolling arrangement are reported in the table above as export sales from the U.S. to Asia, and include net sales of $6.5 million and $4.8 million in the third quarter of 2024 and 2023, respectively, and $19.1 million and $11.7 million in the first nine months of 2024 and 2023, respectively. | | | | | | | | | | | | | | | | | | | | | | | | | Net Sales by Product Group | | Three Months Ended September 30, | | Nine Months Ended September 30, | | (In thousands) | 2024 | | 2023 | | 2024 | | 2023 | | Aluminum Extrusions: | | | | | | | | | Nonresidential building & construction | $ | 61,988 | | | $ | 59,476 | | | $ | 195,603 | | | $ | 203,889 | | | Consumer durables | 8,581 | | | 8,662 | | | 25,487 | | | 30,723 | | | Automotive | 11,060 | | | 13,025 | | | 31,793 | | | 36,916 | | | Residential building & construction | 9,790 | | | 7,999 | | | 27,575 | | | 29,658 | | | Electrical | 8,926 | | | 2,016 | | | 21,983 | | | 16,223 | | | Machinery & equipment | 13,131 | | | 14,202 | | | 37,995 | | | 36,008 | | | Distribution | 2,241 | | | 4,030 | | | 8,917 | | | 11,190 | | | Subtotal | 115,717 | | | 109,410 | | | 349,353 | | | 364,607 | | | PE Films: | | | | | | | | | Surface protection films | 17,516 | | | 12,755 | | | 56,241 | | | 34,251 | | | Overwrap packaging | 7,363 | | | 7,183 | | | 22,570 | | | 21,785 | | | Subtotal | 24,879 | | | 19,938 | | | 78,811 | | | 56,036 | | | Flexible Packaging Films | 34,370 | | | 30,111 | | | 99,025 | | | 94,861 | | | Total | $ | 174,966 | | | $ | 159,459 | | | $ | 527,189 | | | $ | 515,504 | |
|
| X |
- References
+ Details
| Name: |
us-gaap_SegmentReportingAbstract |
| Namespace Prefix: |
us-gaap_ |
| Data Type: |
xbrli:stringItemType |
| Balance Type: |
na |
| Period Type: |
duration |
|
| X |
- DefinitionThe entire disclosure for reporting segments including data and tables. Reportable segments include those that meet any of the following quantitative thresholds a) it's reported revenue, including sales to external customers and intersegment sales or transfers is 10 percent or more of the combined revenue, internal and external, of all operating segments b) the absolute amount of its reported profit or loss is 10 percent or more of the greater, in absolute amount of 1) the combined reported profit of all operating segments that did not report a loss or 2) the combined reported loss of all operating segments that did report a loss c) its assets are 10 percent or more of the combined assets of all operating segments. Reference 1: http://www.xbrl.org/2003/role/exampleRef
-Topic 280
-SubTopic 10
-Name Accounting Standards Codification
-Section 55
-Paragraph 48
-Publisher FASB
-URI https://asc.fasb.org/1943274/2147482785/280-10-55-48
Reference 2: http://www.xbrl.org/2003/role/disclosureRef
-Topic 280
-SubTopic 10
-Name Accounting Standards Codification
-Section 50
-Paragraph 32
-Subparagraph (f)
-Publisher FASB
-URI https://asc.fasb.org/1943274/2147482810/280-10-50-32
Reference 3: http://www.xbrl.org/2003/role/disclosureRef
-Topic 270
-SubTopic 10
-Name Accounting Standards Codification
-Section 50
-Paragraph 1
-Subparagraph (i)
-Publisher FASB
-URI https://asc.fasb.org/1943274/2147482964/270-10-50-1
Reference 4: http://www.xbrl.org/2003/role/disclosureRef
-Topic 280
-SubTopic 10
-Name Accounting Standards Codification
-Section 50
-Paragraph 32
-Subparagraph (ee)
-Publisher FASB
-URI https://asc.fasb.org/1943274/2147482810/280-10-50-32
Reference 5: http://fasb.org/us-gaap/role/ref/otherTransitionRef
-Topic 280
-SubTopic 10
-Name Accounting Standards Codification
-Section 50
-Paragraph 32
-Subparagraph (d)
-Publisher FASB
-URI https://asc.fasb.org/1943274/2147482810/280-10-50-32
Reference 6: http://www.xbrl.org/2003/role/exampleRef
-Topic 280
-SubTopic 10
-Name Accounting Standards Codification
-Section 55
-Paragraph 54
-Subparagraph (d)
-Publisher FASB
-URI https://asc.fasb.org/1943274/2147482785/280-10-55-54
Reference 7: http://www.xbrl.org/2003/role/exampleRef
-Topic 280
-SubTopic 10
-Name Accounting Standards Codification
-Section 55
-Paragraph 47
-Subparagraph (c)
-Publisher FASB
-URI https://asc.fasb.org/1943274/2147482785/280-10-55-47
Reference 8: http://www.xbrl.org/2003/role/exampleRef
-Topic 280
-SubTopic 10
-Name Accounting Standards Codification
-Section 55
-Paragraph 54
-Subparagraph (a)
-Publisher FASB
-URI https://asc.fasb.org/1943274/2147482785/280-10-55-54
Reference 9: http://www.xbrl.org/2003/role/exampleRef
-Topic 280
-SubTopic 10
-Name Accounting Standards Codification
-Section 55
-Paragraph 47
-Subparagraph (a)
-Publisher FASB
-URI https://asc.fasb.org/1943274/2147482785/280-10-55-47
Reference 10: http://www.xbrl.org/2003/role/exampleRef
-Topic 280
-SubTopic 10
-Name Accounting Standards Codification
-Section 55
-Paragraph 54
-Subparagraph (e)
-Publisher FASB
-URI https://asc.fasb.org/1943274/2147482785/280-10-55-54
Reference 11: http://www.xbrl.org/2003/role/exampleRef
-Topic 280
-SubTopic 10
-Name Accounting Standards Codification
-Section 55
-Paragraph 47
-Subparagraph (d)
-Publisher FASB
-URI https://asc.fasb.org/1943274/2147482785/280-10-55-47
Reference 12: http://www.xbrl.org/2003/role/disclosureRef
-Topic 280
-SubTopic 10
-Name Accounting Standards Codification
-Section 50
-Paragraph 22
-Publisher FASB
-URI https://asc.fasb.org/1943274/2147482810/280-10-50-22
Reference 13: http://www.xbrl.org/2003/role/disclosureRef
-Topic 280
-SubTopic 10
-Name Accounting Standards Codification
-Section 50
-Paragraph 31
-Publisher FASB
-URI https://asc.fasb.org/1943274/2147482810/280-10-50-31
Reference 14: http://www.xbrl.org/2003/role/disclosureRef
-Topic 280
-SubTopic 10
-Name Accounting Standards Codification
-Section 50
-Paragraph 34
-Publisher FASB
-URI https://asc.fasb.org/1943274/2147482810/280-10-50-34
Reference 15: http://www.xbrl.org/2003/role/disclosureRef
-Topic 280
-SubTopic 10
-Name Accounting Standards Codification
-Section 50
-Paragraph 26C
-Publisher FASB
-URI https://asc.fasb.org/1943274/2147482810/280-10-50-26C
Reference 16: http://www.xbrl.org/2003/role/disclosureRef
-Topic 280
-SubTopic 10
-Name Accounting Standards Codification
-Section 50
-Paragraph 26B
-Publisher FASB
-URI https://asc.fasb.org/1943274/2147482810/280-10-50-26B
Reference 17: http://www.xbrl.org/2003/role/disclosureRef
-Topic 280
-SubTopic 10
-Name Accounting Standards Codification
-Section 50
-Paragraph 15
-Publisher FASB
-URI https://asc.fasb.org/1943274/2147482810/280-10-50-15
Reference 18: http://www.xbrl.org/2003/role/disclosureRef
-Topic 280
-SubTopic 10
-Name Accounting Standards Codification
-Section 50
-Paragraph 42
-Publisher FASB
-URI https://asc.fasb.org/1943274/2147482810/280-10-50-42
Reference 19: http://www.xbrl.org/2003/role/disclosureRef
-Topic 280
-SubTopic 10
-Name Accounting Standards Codification
-Section 50
-Paragraph 40
-Publisher FASB
-URI https://asc.fasb.org/1943274/2147482810/280-10-50-40
Reference 20: http://www.xbrl.org/2003/role/disclosureRef
-Topic 280
-Name Accounting Standards Codification
-Publisher FASB
-URI https://asc.fasb.org/280/tableOfContent
Reference 21: http://www.xbrl.org/2003/role/disclosureRef
-Topic 280
-SubTopic 10
-Name Accounting Standards Codification
-Section 50
-Paragraph 26
-Publisher FASB
-URI https://asc.fasb.org/1943274/2147482810/280-10-50-26
Reference 22: http://www.xbrl.org/2003/role/disclosureRef
-Topic 280
-SubTopic 10
-Name Accounting Standards Codification
-Section 50
-Paragraph 41
-Publisher FASB
-URI https://asc.fasb.org/1943274/2147482810/280-10-50-41
Reference 23: http://www.xbrl.org/2003/role/disclosureRef
-Topic 280
-SubTopic 10
-Name Accounting Standards Codification
-Section 50
-Paragraph 21
-Subparagraph (a)
-Publisher FASB
-URI https://asc.fasb.org/1943274/2147482810/280-10-50-21
Reference 24: http://www.xbrl.org/2003/role/disclosureRef
-Topic 280
-SubTopic 10
-Name Accounting Standards Codification
-Section 50
-Paragraph 21
-Subparagraph (b)
-Publisher FASB
-URI https://asc.fasb.org/1943274/2147482810/280-10-50-21
Reference 25: http://www.xbrl.org/2003/role/disclosureRef
-Topic 280
-SubTopic 10
-Name Accounting Standards Codification
-Section 50
-Paragraph 32
-Subparagraph (e)
-Publisher FASB
-URI https://asc.fasb.org/1943274/2147482810/280-10-50-32
| Name: |
us-gaap_SegmentReportingDisclosureTextBlock |
| Namespace Prefix: |
us-gaap_ |
| Data Type: |
dtr-types:textBlockItemType |
| Balance Type: |
na |
| Period Type: |
duration |
|
v3.24.3
Debt (Notes)
|
9 Months Ended |
Sep. 30, 2024 |
|---|
| Debt Disclosure [Abstract] |
|
| Debt Disclosure [Text Block] |
ABL Facility On December 27, 2023, the Company entered into Amendment No. 3 to the Second Amended and Restated Credit Agreement (the "Credit Agreement"), which provides the Company with a $180 million senior secured asset-based revolving credit facility that will mature on June 30, 2026. On April 16, 2024, the Company entered into Amendment No. 4 to the Credit Agreement (as amended by Amendment No. 3 and Amendment No. 4, the “ABL Facility”) that, among other items: (i) moves the ABL Adjustment Date (defined below) from March 31, 2025 to September 30, 2025 and (ii) requires weekly reporting of the borrowing base financial covenant until the ABL Adjustment Date. The ABL Facility is secured by substantially all assets of the Company and its domestic subsidiaries, including equity in certain material first-tier foreign subsidiaries. Availability for borrowings under the ABL Facility is governed by a borrowing base, determined by the application of specified advance rates against eligible assets, including a portion of trade accounts receivable, inventory, cash and cash equivalents, owned real properties, and owned machinery and equipment. Upon the earlier of September 30, 2025 or the date the Company receives the proceeds from the sale of Terphane (the “ABL Adjustment Date”), the $180 million ABL Facility will be reduced to $125 million. As of September 30, 2024, Minimum Liquidity (as defined in the ABL Facility) of $45.1 million, after reducing the borrowing base by the aggregate outstanding borrowings of $122.0 million and standby letters of credit of $12.9 million, was in excess of the $10 million Minimum Liquidity financial covenant. Outstanding borrowings accrue interest at the rates elected by the Company depending on the type of loan and denomination of such borrowing. With respect to revolving loans denominated in U.S. Dollars, the Company may elect interest rates at: •Alternate Base Rate (“ABR”) plus 2.50% before the ABL Adjustment Date and the applicable ABR Spread (as defined in the ABL Facility) after the ABL Adjustment Date are determined in accordance with an excess availability-based pricing grid. ABR is defined, in part, as the greater of (a) the Prime Rate in effect on such day, (b) the Federal Reserve Bank of New York Rate in effect on such day plus ½ of 1% and (c) the Adjusted Term SOFR Rate (defined below) for a one-month period plus 1%; or •The Adjusted Term Secured Overnight Financing Rate ("SOFR") Rate plus 3.50% before the ABL Adjustment Date and the applicable Term Benchmark Spread (as defined in the ABL Facility) are determined in accordance with an excess availability-based pricing grid after the ABL Adjustment Date. Adjusted Term SOFR Rate is defined as the Term SOFR Rate plus 0.10%, subject to an initial Floor (as defined in the ABL Facility) of 0%. Interest rate indices for select non-U.S. dollar borrowings, including borrowings denominated in Euro, Pounds Sterling, Swiss Francs and Japanese Yen, remain consistent with the Second Amended and Restated Credit Agreement. Based upon the quarterly average of daily availability under the ABL Facility, the interest rate pricing grid applicable after the ABL Adjustment Date will be as follows: | | | | | | | | | | | | | Pricing under the ABL Facility (Basis Points) | | Quarter Average of Daily Availability | Term Benchmark
Spread | ABR
Spread | Commitment
Fee* | | > 66% of $125 million aggregate commitment | 225.0 | 125.0 | 40.0 | | ≤ 66% but > 33% of $125 million aggregate commitment | 250.0 | 150.0 | 40.0 | | ≤ 33% of $125 million aggregate commitment | 275.0 | 175.0 | 40.0 | *The Commitment Fee before the ABL Adjustment Date and after the ABL Adjustment Date remain the same as reflected in this table. |
Under the terms of the ABL Facility, certain domestic bank accounts are subject to blocked account agreements, each of which contains a springing feature whereby the lenders may exercise control over those accounts during a cash dominion period (any such period, a “Cash Dominion Period”). A Cash Dominion Period was implemented on the date of the closing of the ABL Facility and will remain in effect at all times prior to the ABL Adjustment Date. After the ABL Adjustment Date, a Cash Dominion Period goes into effect if availability under the ABL Facility falls below 12.5% or an Event of Default (as defined in the ABL Facility) occurs. The Company would then be subject to the Cash Dominion Period until the Event of Default is waived or ABL Facility availability is above 12.5% of the $125 million aggregate commitment for 30 consecutive days. Receipts that have not yet been applied to the ABL Facility are classified as restricted cash in the Company’s consolidated balance sheets. The financial covenants in the ABL Facility are as follows: •Until the ABL Adjustment Date, the Company is required to maintain (i) a minimum Credit EBITDA (as defined in the ABL Facility), as of the end of each fiscal month for the 12-month period then ended (presented below) and (ii) a Minimum Liquidity of $10.0 million. | | | | | | | Minimum Credit EBITDA (In thousands) | | September 2024 | $ | 25,370 | | | October 2024 | 26,070 | | | November 2024 | 27,640 | | | December 2024 | 29,640 | | | January 2025 | 29,740 | | | February 2025 | 29,850 | | | March 2025 | 29,980 | | | April 2025 | 30,340 | | | May 2025 | 30,700 | | | June 2025 | 31,030 | | | July 2025 | 31,370 | | | August 2025 | 31,710 | | | September 2025 | $ | 32,080 | |
•Following the ABL Adjustment Date, the foregoing financial covenants will cease to exist and will be replaced with a minimum fixed charge coverage ratio of 1.00:1.00 that will be triggered in the event that availability is less than 10% of $125 million commitment amount and continuing thereafter until availability is greater than 10% of the $125 million commitment amount for 30 consecutive days. In addition to the financial covenants, the ABL Facility contains restrictive covenants, including covenants that restrict the Company’s ability to pay dividends and repurchase shares of its common stock. After the ABL Adjustment Date, the Company is no longer prohibited from making dividend payments and share repurchases. All decisions with respect to the declaration and payment of future dividends and share repurchases will be made by the Board in its sole discretion based upon earnings, financial condition, anticipated cash needs and other such considerations as the Board deems relevant. If at any time the availability under the ABL facility after the ABL Adjustment Date is less than 20% of the maximum aggregate principal amount in effect at such time or an Event of Default occurs, the Company’s current weekly reporting requirements to lenders will continue until the Event of Default is waived, cured or the availability under the ABL facility is above 20% of the maximum aggregate principal amount for 30 consecutive days. The ABL Facility has customary representations and warranties including, as a condition to each borrowing, that all such representations and warranties are true and correct in all material respects (including a representation that no Material Adverse Effect (as defined in the ABL Facility) has occurred since December 31, 2022). In the event that the Company cannot certify that all conditions to the borrowing have been met, the lenders can restrict the Company’s future borrowings under the ABL Facility. Because a Cash Dominion Period was in effect as of September 30, 2024 and December 31, 2023 and the Company was required to represent that no Material Adverse Effect has occurred as a condition to borrowing, the outstanding debt under the ABL Facility (all contractual payments due on June 30, 2026) was classified as a current liability in the condensed consolidated balance sheets as of the dates presented. In accordance with the ABL Facility, the lenders have been provided with the Company’s financial statements, covenant compliance certificates and projections to facilitate their ongoing assessment of the Company. Accordingly, the Company believes the likelihood that lenders would exercise the subjective acceleration clause whereby prohibiting future borrowings is remote. As of September 30, 2024, the Company was in compliance with all debt covenants. On November 1, 2024, with the closing of the Terphane Sale, the ABL Adjustment Date has occurred. Terphane Brazil Loan On October 26, 2023, Flexible Packaging Film's business unit (“Terphane Ltda.”), the Company’s wholly owned subsidiary in Brazil, borrowed $20 million secured by certain of its assets (“Terphane Brazil Loan”). This U.S. Dollar borrowing matures on October 30, 2028, with interest payable quarterly at an annual floating interest rate of the SOFR plus 5.99%. The SOFR rate was 5.35% as of September 30, 2024. Quarterly principal payments of $1.7 million begin starting in year 3 of the loan. There are no prepayment penalties. On October 26, 2023, the Company borrowed $20 million from Terphane Ltda. (the “Intercompany Loan”) at the same interest rate as the Terphane Brazil Loan, thereby transferring the funds to the U.S. In connection with the closing of the Terphane Sale, both the Terphane Brazil Loan and the Intercompany Loan were assumed by Oben. PE Films Guangzhou Loan On June 25, 2024, PE Films' business location in Guangzhou, China, Guangzhou Tredegar Film Products Co., Ltd. (“Guangzhou Tredegar”), entered into a 9.5 million Chinese Yuan, which is equivalent to $1.4 million as of September 30, 2024, revolving loan with the Industrial and Commercial Bank of China. The loan matures on July 3, 2025. The interest rate is the one year loan prime rate published by the National Interbank Funding Center for the working day immediately preceding the drawdown date, minus 0.45%. As of September 30, 2024, the National Interbank Funding Center rate was 3.35%. The revolving loan is secured by a mortgage contract listing the Guangzhou Tredegar factory building as collateral. The mortgage contract has a maximum value of 30 million Chinese Yuan and is effective from June 25, 2024 through May 31, 2027.
|
| X |
- References
+ Details
| Name: |
us-gaap_DebtDisclosureAbstract |
| Namespace Prefix: |
us-gaap_ |
| Data Type: |
xbrli:stringItemType |
| Balance Type: |
na |
| Period Type: |
duration |
|
| X |
- DefinitionThe entire disclosure for information about short-term and long-term debt arrangements, which includes amounts of borrowings under each line of credit, note payable, commercial paper issue, bonds indenture, debenture issue, own-share lending arrangements and any other contractual agreement to repay funds, and about the underlying arrangements, rationale for a classification as long-term, including repayment terms, interest rates, collateral provided, restrictions on use of assets and activities, whether or not in compliance with debt covenants, and other matters important to users of the financial statements, such as the effects of refinancing and noncompliance with debt covenants. Reference 1: http://www.xbrl.org/2003/role/disclosureRef
-Topic 470
-SubTopic 10
-Name Accounting Standards Codification
-Section 50
-Paragraph 6
-Subparagraph (b)
-Publisher FASB
-URI https://asc.fasb.org/1943274/2147481544/470-10-50-6
Reference 2: http://www.xbrl.org/2003/role/disclosureRef
-Topic 470
-SubTopic 10
-Name Accounting Standards Codification
-Section 50
-Paragraph 6
-Subparagraph (a)
-Publisher FASB
-URI https://asc.fasb.org/1943274/2147481544/470-10-50-6
Reference 3: http://www.xbrl.org/2003/role/disclosureRef
-Topic 405
-SubTopic 40
-Name Accounting Standards Codification
-Section 50
-Paragraph 1
-Subparagraph (d)
-Publisher FASB
-URI https://asc.fasb.org/1943274/2147477092/405-40-50-1
Reference 4: http://www.xbrl.org/2003/role/disclosureRef
-Topic 405
-SubTopic 40
-Name Accounting Standards Codification
-Section 50
-Paragraph 1
-Subparagraph (a)(3)
-Publisher FASB
-URI https://asc.fasb.org/1943274/2147477092/405-40-50-1
Reference 5: http://www.xbrl.org/2003/role/disclosureRef
-Topic 405
-SubTopic 40
-Name Accounting Standards Codification
-Section 50
-Paragraph 1
-Subparagraph (a)(2)
-Publisher FASB
-URI https://asc.fasb.org/1943274/2147477092/405-40-50-1
Reference 6: http://www.xbrl.org/2003/role/disclosureRef
-Topic 405
-SubTopic 40
-Name Accounting Standards Codification
-Section 50
-Paragraph 1
-Subparagraph (a)(1)
-Publisher FASB
-URI https://asc.fasb.org/1943274/2147477092/405-40-50-1
Reference 7: http://www.xbrl.org/2003/role/disclosureRef
-Topic 405
-SubTopic 40
-Name Accounting Standards Codification
-Section 50
-Paragraph 1
-Subparagraph (a)
-Publisher FASB
-URI https://asc.fasb.org/1943274/2147477092/405-40-50-1
Reference 8: http://www.xbrl.org/2003/role/disclosureRef
-Topic 470
-SubTopic 20
-Name Accounting Standards Codification
-Section 50
-Paragraph 1B
-Subparagraph (h)
-Publisher FASB
-URI https://asc.fasb.org/1943274/2147481139/470-20-50-1B
Reference 9: http://www.xbrl.org/2003/role/disclosureRef
-Topic 235
-SubTopic 10
-Name Accounting Standards Codification
-Section S99
-Paragraph 1
-Subparagraph (SX 210.4-08(c))
-Publisher FASB
-URI https://asc.fasb.org/1943274/2147480678/235-10-S99-1
Reference 10: http://fasb.org/us-gaap/role/ref/legacyRef
-Topic 470
-Name Accounting Standards Codification
-Publisher FASB
-URI https://asc.fasb.org/470/tableOfContent
Reference 11: http://www.xbrl.org/2003/role/disclosureRef
-Topic 835
-SubTopic 30
-Name Accounting Standards Codification
-Section 45
-Paragraph 2
-Publisher FASB
-URI https://asc.fasb.org/1943274/2147482925/835-30-45-2
Reference 12: http://www.xbrl.org/2003/role/disclosureRef
-Topic 470
-SubTopic 20
-Name Accounting Standards Codification
-Section 50
-Paragraph 1B
-Publisher FASB
-URI https://asc.fasb.org/1943274/2147481139/470-20-50-1B
Reference 13: http://www.xbrl.org/2003/role/disclosureRef
-Topic 470
-SubTopic 20
-Name Accounting Standards Codification
-Section 50
-Paragraph 1B
-Subparagraph (g)
-Publisher FASB
-URI https://asc.fasb.org/1943274/2147481139/470-20-50-1B
Reference 14: http://www.xbrl.org/2003/role/disclosureRef
-Topic 470
-SubTopic 20
-Name Accounting Standards Codification
-Section 50
-Paragraph 1B
-Subparagraph (i)
-Publisher FASB
-URI https://asc.fasb.org/1943274/2147481139/470-20-50-1B
Reference 15: http://www.xbrl.org/2003/role/disclosureRef
-Topic 470
-SubTopic 20
-Name Accounting Standards Codification
-Section 50
-Paragraph 1C
-Subparagraph (a)
-Publisher FASB
-URI https://asc.fasb.org/1943274/2147481139/470-20-50-1C
Reference 16: http://www.xbrl.org/2003/role/disclosureRef
-Topic 470
-SubTopic 20
-Name Accounting Standards Codification
-Section 50
-Paragraph 1C
-Subparagraph (b)
-Publisher FASB
-URI https://asc.fasb.org/1943274/2147481139/470-20-50-1C
Reference 17: http://www.xbrl.org/2003/role/disclosureRef
-Topic 470
-SubTopic 20
-Name Accounting Standards Codification
-Section 50
-Paragraph 1C
-Subparagraph (c)
-Publisher FASB
-URI https://asc.fasb.org/1943274/2147481139/470-20-50-1C
Reference 18: http://www.xbrl.org/2003/role/disclosureRef
-Topic 470
-SubTopic 20
-Name Accounting Standards Codification
-Section 50
-Paragraph 1E
-Subparagraph (b)
-Publisher FASB
-URI https://asc.fasb.org/1943274/2147481139/470-20-50-1E
Reference 19: http://www.xbrl.org/2003/role/disclosureRef
-Topic 470
-SubTopic 20
-Name Accounting Standards Codification
-Section 50
-Paragraph 1I
-Subparagraph (a)
-Publisher FASB
-URI https://asc.fasb.org/1943274/2147481139/470-20-50-1I
Reference 20: http://www.xbrl.org/2003/role/disclosureRef
-Topic 470
-SubTopic 20
-Name Accounting Standards Codification
-Section 50
-Paragraph 1I
-Subparagraph (b)
-Publisher FASB
-URI https://asc.fasb.org/1943274/2147481139/470-20-50-1I
Reference 21: http://www.xbrl.org/2003/role/disclosureRef
-Topic 470
-SubTopic 20
-Name Accounting Standards Codification
-Section 50
-Paragraph 1I
-Subparagraph (d)
-Publisher FASB
-URI https://asc.fasb.org/1943274/2147481139/470-20-50-1I
| Name: |
us-gaap_DebtDisclosureTextBlock |
| Namespace Prefix: |
us-gaap_ |
| Data Type: |
dtr-types:textBlockItemType |
| Balance Type: |
na |
| Period Type: |
duration |
|
v3.24.3
Subsequent Events (Notes)
|
9 Months Ended |
Sep. 30, 2024 |
|---|
| Subsequent Events [Abstract] |
|
| Subsequent Events [Text Block] |
On September 1, 2023, the Company entered into an agreement to sell Terphane, headquartered in Brazil, to Oben for net cash-free and debt-free base consideration of $116 million. On November 1, 2024, Tredegar completed the sale of Terphane to Oben. At closing, Tredegar received $60 million in cash, which is net of Terphane debt assumed by Oben of $20 million and Terphane cash retained by Oben of $2 million. Accordingly, on a cash-free and debt-free basis, the enterprise value of the Terphane transaction at closing for Tredegar was $78 million. Tredegar anticipates receiving an additional $7 million in cash following the release of certain escrow funds within 120 days of closing. The cash proceeds received by Tredegar at closing are after deducting projected Brazil withholding taxes, net working capital adjustments, escrow funds, U.S. capital gains taxes and transaction expenses. The total estimated proceeds from the sale of Terphane are required to be used to pay down the outstanding ABL Facility debt. An estimated pre-tax loss on the sale of $72.5 million ($65.5 million after-tax) is expected to be recognized in the fourth quarter of 2024. The estimated net loss on sale includes $100 million of estimated cumulative translation adjustment losses and gains on derivative financial instruments reclassified from other comprehensive income (loss). Expected amounts are based on Terphane’s estimated closing balance sheet, which are subject to change. As of and for the nine months ended September 30, 2024, the Flexible Packaging Films business had net assets of approximately $36 million and EBITDA from ongoing operations of $8.9 million. See Note 9 where Flexible Packing Films is presented as a reportable segment. As a result of the completion of the sale, the Company will classify and report Terphane as discontinued operations in the fourth quarter of 2024.
|
| X |
- References
+ Details
| Name: |
us-gaap_SubsequentEventsAbstract |
| Namespace Prefix: |
us-gaap_ |
| Data Type: |
xbrli:stringItemType |
| Balance Type: |
na |
| Period Type: |
duration |
|
| X |
- DefinitionThe entire disclosure for significant events or transactions that occurred after the balance sheet date through the date the financial statements were issued or the date the financial statements were available to be issued. Examples include: the sale of a capital stock issue, purchase of a business, settlement of litigation, catastrophic loss, significant foreign exchange rate changes, loans to insiders or affiliates, and transactions not in the ordinary course of business. Reference 1: http://www.xbrl.org/2003/role/disclosureRef
-Topic 855
-Name Accounting Standards Codification
-Publisher FASB
-URI https://asc.fasb.org/855/tableOfContent
Reference 2: http://www.xbrl.org/2003/role/disclosureRef
-Topic 855
-SubTopic 10
-Name Accounting Standards Codification
-Section 50
-Paragraph 2
-Subparagraph (a)
-Publisher FASB
-URI https://asc.fasb.org/1943274/2147483399/855-10-50-2
| Name: |
us-gaap_SubsequentEventsTextBlock |
| Namespace Prefix: |
us-gaap_ |
| Data Type: |
dtr-types:textBlockItemType |
| Balance Type: |
na |
| Period Type: |
duration |
|
v3.24.3
| X |
- ReferencesReference 1: http://www.xbrl.org/2003/role/presentationRef
-Publisher SEC
-Name Regulation S-K
-Number 229
-Section 402
-Subsection v
-Paragraph 1
| Name: |
ecd_PvpTable |
| Namespace Prefix: |
ecd_ |
| Data Type: |
xbrli:stringItemType |
| Balance Type: |
na |
| Period Type: |
duration |
|
| X |
- DefinitionThe portion of profit or loss for the period, net of income taxes, which is attributable to the parent. Reference 1: http://www.xbrl.org/2003/role/disclosureRef
-Topic 250
-SubTopic 10
-Name Accounting Standards Codification
-Section 50
-Paragraph 6
-Publisher FASB
-URI https://asc.fasb.org/1943274/2147483443/250-10-50-6
Reference 2: http://www.xbrl.org/2003/role/disclosureRef
-Topic 250
-SubTopic 10
-Name Accounting Standards Codification
-Section 50
-Paragraph 9
-Publisher FASB
-URI https://asc.fasb.org/1943274/2147483443/250-10-50-9
Reference 3: http://www.xbrl.org/2003/role/disclosureRef
-Topic 805
-SubTopic 60
-Name Accounting Standards Codification
-Section 65
-Paragraph 1
-Subparagraph (g)
-Publisher FASB
-URI https://asc.fasb.org/1943274/2147476176/805-60-65-1
Reference 4: http://www.xbrl.org/2003/role/disclosureRef
-Topic 740
-SubTopic 323
-Name Accounting Standards Codification
-Section 65
-Paragraph 2
-Subparagraph (g)(3)
-Publisher FASB
-URI https://asc.fasb.org/1943274/2147478666/740-323-65-2
Reference 5: http://fasb.org/us-gaap/role/ref/legacyRef
-Topic 220
-SubTopic 10
-Name Accounting Standards Codification
-Section S99
-Paragraph 2
-Subparagraph (SX 210.5-03(20))
-Publisher FASB
-URI https://asc.fasb.org/1943274/2147483621/220-10-S99-2
Reference 6: http://www.xbrl.org/2003/role/disclosureRef
-Topic 235
-SubTopic 10
-Name Accounting Standards Codification
-Section S99
-Paragraph 1
-Subparagraph (SX 210.4-08(g)(1)(ii))
-Publisher FASB
-URI https://asc.fasb.org/1943274/2147480678/235-10-S99-1
Reference 7: http://www.xbrl.org/2003/role/disclosureRef
-Topic 323
-SubTopic 10
-Name Accounting Standards Codification
-Section 50
-Paragraph 3
-Subparagraph (c)
-Publisher FASB
-URI https://asc.fasb.org/1943274/2147481687/323-10-50-3
Reference 8: http://www.xbrl.org/2003/role/disclosureRef
-Topic 825
-SubTopic 10
-Name Accounting Standards Codification
-Section 50
-Paragraph 28
-Subparagraph (f)
-Publisher FASB
-URI https://asc.fasb.org/1943274/2147482907/825-10-50-28
Reference 9: http://www.xbrl.org/2003/role/disclosureRef
-Topic 220
-SubTopic 10
-Name Accounting Standards Codification
-Section 50
-Paragraph 6
-Publisher FASB
-URI https://asc.fasb.org/1943274/2147482765/220-10-50-6
Reference 10: http://www.xbrl.org/2003/role/disclosureRef
-Topic 250
-SubTopic 10
-Name Accounting Standards Codification
-Section 50
-Paragraph 3
-Publisher FASB
-URI https://asc.fasb.org/1943274/2147483443/250-10-50-3
Reference 11: http://www.xbrl.org/2003/role/disclosureRef
-Topic 250
-SubTopic 10
-Name Accounting Standards Codification
-Section 50
-Paragraph 1
-Subparagraph (b)(2)
-Publisher FASB
-URI https://asc.fasb.org/1943274/2147483443/250-10-50-1
Reference 12: http://www.xbrl.org/2003/role/disclosureRef
-Topic 815
-SubTopic 40
-Name Accounting Standards Codification
-Section 65
-Paragraph 1
-Subparagraph (f)
-Publisher FASB
-URI https://asc.fasb.org/1943274/2147480175/815-40-65-1
Reference 13: http://www.xbrl.org/2003/role/disclosureRef
-Topic 250
-SubTopic 10
-Name Accounting Standards Codification
-Section 50
-Paragraph 8
-Publisher FASB
-URI https://asc.fasb.org/1943274/2147483443/250-10-50-8
Reference 14: http://www.xbrl.org/2003/role/disclosureRef
-Topic 250
-SubTopic 10
-Name Accounting Standards Codification
-Section 50
-Paragraph 11
-Subparagraph (a)
-Publisher FASB
-URI https://asc.fasb.org/1943274/2147483443/250-10-50-11
Reference 15: http://www.xbrl.org/2003/role/disclosureRef
-Topic 250
-SubTopic 10
-Name Accounting Standards Codification
-Section 50
-Paragraph 11
-Subparagraph (b)
-Publisher FASB
-URI https://asc.fasb.org/1943274/2147483443/250-10-50-11
Reference 16: http://www.xbrl.org/2003/role/disclosureRef
-Topic 250
-SubTopic 10
-Name Accounting Standards Codification
-Section 50
-Paragraph 4
-Publisher FASB
-URI https://asc.fasb.org/1943274/2147483443/250-10-50-4
Reference 17: http://www.xbrl.org/2003/role/exampleRef
-Topic 946
-SubTopic 830
-Name Accounting Standards Codification
-Section 55
-Paragraph 10
-Publisher FASB
-URI https://asc.fasb.org/1943274/2147479168/946-830-55-10
Reference 18: http://www.xbrl.org/2003/role/disclosureRef
-Topic 946
-SubTopic 220
-Name Accounting Standards Codification
-Section 45
-Paragraph 7
-Publisher FASB
-URI https://asc.fasb.org/1943274/2147479105/946-220-45-7
Reference 19: http://www.xbrl.org/2003/role/disclosureRef
-Topic 944
-SubTopic 220
-Name Accounting Standards Codification
-Section S99
-Paragraph 1
-Subparagraph (SX 210.7-04(18))
-Publisher FASB
-URI https://asc.fasb.org/1943274/2147477250/944-220-S99-1
Reference 20: http://www.xbrl.org/2003/role/disclosureRef
-Topic 946
-SubTopic 220
-Name Accounting Standards Codification
-Section S99
-Paragraph 1
-Subparagraph (SX 210.6-07(9))
-Publisher FASB
-URI https://asc.fasb.org/1943274/2147479134/946-220-S99-1
Reference 21: http://www.xbrl.org/2003/role/disclosureRef
-Topic 946
-SubTopic 220
-Name Accounting Standards Codification
-Section S99
-Paragraph 3
-Subparagraph (SX 210.6-09(1)(d))
-Publisher FASB
-URI https://asc.fasb.org/1943274/2147479134/946-220-S99-3
Reference 22: http://www.xbrl.org/2003/role/disclosureRef
-Topic 470
-SubTopic 10
-Name Accounting Standards Codification
-Section S99
-Paragraph 1A
-Subparagraph (SX 210.13-01(a)(4)(i))
-Publisher FASB
-URI https://asc.fasb.org/1943274/2147480097/470-10-S99-1A
Reference 23: http://www.xbrl.org/2009/role/commonPracticeRef
-Topic 470
-SubTopic 10
-Name Accounting Standards Codification
-Section S99
-Paragraph 1A
-Subparagraph (SX 210.13-01(a)(4)(ii))
-Publisher FASB
-URI https://asc.fasb.org/1943274/2147480097/470-10-S99-1A
Reference 24: http://www.xbrl.org/2003/role/disclosureRef
-Topic 470
-SubTopic 10
-Name Accounting Standards Codification
-Section S99
-Paragraph 1A
-Subparagraph (SX 210.13-01(a)(4)(iii)(A))
-Publisher FASB
-URI https://asc.fasb.org/1943274/2147480097/470-10-S99-1A
Reference 25: http://www.xbrl.org/2003/role/disclosureRef
-Topic 470
-SubTopic 10
-Name Accounting Standards Codification
-Section S99
-Paragraph 1A
-Subparagraph (SX 210.13-01(a)(4)(iv))
-Publisher FASB
-URI https://asc.fasb.org/1943274/2147480097/470-10-S99-1A
Reference 26: http://www.xbrl.org/2003/role/disclosureRef
-Topic 470
-SubTopic 10
-Name Accounting Standards Codification
-Section S99
-Paragraph 1A
-Subparagraph (SX 210.13-01(a)(5))
-Publisher FASB
-URI https://asc.fasb.org/1943274/2147480097/470-10-S99-1A
Reference 27: http://www.xbrl.org/2003/role/disclosureRef
-Topic 470
-SubTopic 10
-Name Accounting Standards Codification
-Section S99
-Paragraph 1B
-Subparagraph (SX 210.13-02(a)(4)(i))
-Publisher FASB
-URI https://asc.fasb.org/1943274/2147480097/470-10-S99-1B
Reference 28: http://www.xbrl.org/2003/role/disclosureRef
-Topic 470
-SubTopic 10
-Name Accounting Standards Codification
-Section S99
-Paragraph 1B
-Subparagraph (SX 210.13-02(a)(4)(iii)(A))
-Publisher FASB
-URI https://asc.fasb.org/1943274/2147480097/470-10-S99-1B
Reference 29: http://www.xbrl.org/2003/role/disclosureRef
-Topic 470
-SubTopic 10
-Name Accounting Standards Codification
-Section S99
-Paragraph 1B
-Subparagraph (SX 210.13-02(a)(4)(iii)(B))
-Publisher FASB
-URI https://asc.fasb.org/1943274/2147480097/470-10-S99-1B
Reference 30: http://www.xbrl.org/2003/role/disclosureRef
-Topic 470
-SubTopic 10
-Name Accounting Standards Codification
-Section S99
-Paragraph 1B
-Subparagraph (SX 210.13-02(a)(4)(iv))
-Publisher FASB
-URI https://asc.fasb.org/1943274/2147480097/470-10-S99-1B
Reference 31: http://www.xbrl.org/2003/role/disclosureRef
-Topic 470
-SubTopic 10
-Name Accounting Standards Codification
-Section S99
-Paragraph 1B
-Subparagraph (SX 210.13-02(a)(5))
-Publisher FASB
-URI https://asc.fasb.org/1943274/2147480097/470-10-S99-1B
Reference 32: http://www.xbrl.org/2003/role/disclosureRef
-Topic 260
-SubTopic 10
-Name Accounting Standards Codification
-Section 45
-Paragraph 60B
-Subparagraph (a)
-Publisher FASB
-URI https://asc.fasb.org/1943274/2147482689/260-10-45-60B
Reference 33: http://www.xbrl.org/2003/role/disclosureRef
-Topic 205
-SubTopic 20
-Name Accounting Standards Codification
-Section 50
-Paragraph 7
-Publisher FASB
-URI https://asc.fasb.org/1943274/2147483499/205-20-50-7
Reference 34: http://fasb.org/us-gaap/role/ref/legacyRef
-Topic 230
-SubTopic 10
-Name Accounting Standards Codification
-Section 45
-Paragraph 28
-Publisher FASB
-URI https://asc.fasb.org/1943274/2147482740/230-10-45-28
Reference 35: http://www.xbrl.org/2003/role/disclosureRef
-Topic 220
-SubTopic 10
-Name Accounting Standards Codification
-Section 45
-Paragraph 1A
-Subparagraph (a)
-Publisher FASB
-URI https://asc.fasb.org/1943274/2147482790/220-10-45-1A
Reference 36: http://www.xbrl.org/2003/role/disclosureRef
-Topic 220
-SubTopic 10
-Name Accounting Standards Codification
-Section 45
-Paragraph 1B
-Subparagraph (a)
-Publisher FASB
-URI https://asc.fasb.org/1943274/2147482790/220-10-45-1B
Reference 37: http://fasb.org/us-gaap/role/ref/legacyRef
-Topic 942
-SubTopic 220
-Name Accounting Standards Codification
-Section S99
-Paragraph 1
-Subparagraph (SX 210.9-04(22))
-Publisher FASB
-URI https://asc.fasb.org/1943274/2147478524/942-220-S99-1
| Name: |
us-gaap_NetIncomeLoss |
| Namespace Prefix: |
us-gaap_ |
| Data Type: |
xbrli:monetaryItemType |
| Balance Type: |
credit |
| Period Type: |
duration |
|
v3.24.3
| X |
- ReferencesReference 1: http://www.xbrl.org/2003/role/presentationRef
-Publisher SEC
-Name Regulation S-K
-Number 229
-Section 408
-Subsection a
-Paragraph 1
| Name: |
ecd_NonRule10b51ArrAdoptedFlag |
| Namespace Prefix: |
ecd_ |
| Data Type: |
xbrli:booleanItemType |
| Balance Type: |
na |
| Period Type: |
duration |
|
| X |
- ReferencesReference 1: http://www.xbrl.org/2003/role/presentationRef
-Publisher SEC
-Name Regulation S-K
-Number 229
-Section 408
-Subsection a
-Paragraph 1
| Name: |
ecd_NonRule10b51ArrTrmntdFlag |
| Namespace Prefix: |
ecd_ |
| Data Type: |
xbrli:booleanItemType |
| Balance Type: |
na |
| Period Type: |
duration |
|
| X |
- ReferencesReference 1: http://www.xbrl.org/2003/role/presentationRef
-Publisher SEC
-Name Regulation S-K
-Number 229
-Section 408
-Subsection a
-Paragraph 1
| Name: |
ecd_Rule10b51ArrAdoptedFlag |
| Namespace Prefix: |
ecd_ |
| Data Type: |
xbrli:booleanItemType |
| Balance Type: |
na |
| Period Type: |
duration |
|
| X |
- ReferencesReference 1: http://www.xbrl.org/2003/role/presentationRef
-Publisher SEC
-Name Regulation S-K
-Number 229
-Section 408
-Subsection a
-Paragraph 1
| Name: |
ecd_Rule10b51ArrTrmntdFlag |
| Namespace Prefix: |
ecd_ |
| Data Type: |
xbrli:booleanItemType |
| Balance Type: |
na |
| Period Type: |
duration |
|
| X |
- ReferencesReference 1: http://www.xbrl.org/2003/role/presentationRef
-Publisher SEC
-Name Regulation S-K
-Number 229
-Section 408
-Subsection a
-Paragraph 2
-Subparagraph A
| Name: |
ecd_TradingArrByIndTable |
| Namespace Prefix: |
ecd_ |
| Data Type: |
xbrli:stringItemType |
| Balance Type: |
na |
| Period Type: |
duration |
|
v3.24.3
Accounts and Other Receivables (Tables)
|
9 Months Ended |
Sep. 30, 2024 |
|---|
| Receivables [Abstract] |
|
| Schedule of Accounts, Notes, Loans and Financing Receivable [Table Text Block] |
As of September 30, 2024 and December 31, 2023, accounts and other receivables, net include the following: | | | | | | | | | | | | | (In thousands) | September 30, 2024 | | December 31, 2023 | | Customer receivables | $ | 81,735 | | | $ | 67,183 | | | Other receivables | 2,327 | | | 3,056 | | | Total accounts and other receivables | 84,062 | | | 70,239 | | | Less: Allowance for bad debts | (2,426) | | | (2,301) | | | Total accounts and other receivables, net | $ | 81,636 | | | $ | 67,938 | |
|
| X |
- References
+ Details
| Name: |
us-gaap_ReceivablesAbstract |
| Namespace Prefix: |
us-gaap_ |
| Data Type: |
xbrli:stringItemType |
| Balance Type: |
na |
| Period Type: |
duration |
|
| X |
- DefinitionTabular disclosure of the various types of trade accounts and notes receivable and for each the gross carrying value, allowance, and net carrying value as of the balance sheet date. Presentation is categorized by current, noncurrent and unclassified receivables. Reference 1: http://fasb.org/us-gaap/role/ref/legacyRef
-Topic 210
-SubTopic 10
-Name Accounting Standards Codification
-Section S99
-Paragraph 1
-Subparagraph (SX 210.5-02(4))
-Publisher FASB
-URI https://asc.fasb.org/1943274/2147480566/210-10-S99-1
Reference 2: http://fasb.org/us-gaap/role/ref/legacyRef
-Topic 210
-SubTopic 10
-Name Accounting Standards Codification
-Section S99
-Paragraph 1
-Subparagraph (SX 210.5-02(3))
-Publisher FASB
-URI https://asc.fasb.org/1943274/2147480566/210-10-S99-1
| Name: |
us-gaap_ScheduleOfAccountsNotesLoansAndFinancingReceivableTextBlock |
| Namespace Prefix: |
us-gaap_ |
| Data Type: |
dtr-types:textBlockItemType |
| Balance Type: |
na |
| Period Type: |
duration |
|
v3.24.3
Inventories (Tables)
|
9 Months Ended |
Sep. 30, 2024 |
|---|
| Inventory, Net [Abstract] |
|
| Schedule of Inventory, Current |
The components of inventories are as follows: | | | | | | | | | | | | | (In thousands) | September 30, 2024 | | December 31, 2023 | | Finished goods | $ | 31,782 | | | $ | 29,821 | | | Work-in-process | 8,332 | | | 7,830 | | | Raw materials | 23,497 | | | 21,939 | | | Stores, supplies and other | 24,447 | | | 22,447 | | | Total | $ | 88,058 | | | $ | 82,037 | |
|
| X |
- References
+ Details
| Name: |
us-gaap_InventoryNetAbstract |
| Namespace Prefix: |
us-gaap_ |
| Data Type: |
xbrli:stringItemType |
| Balance Type: |
na |
| Period Type: |
duration |
|
| X |
- DefinitionTabular disclosure of the carrying amount as of the balance sheet date of merchandise, goods, commodities, or supplies held for future sale or to be used in manufacturing, servicing or production process. Reference 1: http://fasb.org/us-gaap/role/ref/legacyRef
-Topic 210
-SubTopic 10
-Name Accounting Standards Codification
-Section S99
-Paragraph 1
-Subparagraph (SX 210.5-02(6)(a))
-Publisher FASB
-URI https://asc.fasb.org/1943274/2147480566/210-10-S99-1
Reference 2: http://fasb.org/us-gaap/role/ref/legacyRef
-Topic 210
-SubTopic 10
-Name Accounting Standards Codification
-Section S99
-Paragraph 1
-Subparagraph (SX 210.5-02(6)(b))
-Publisher FASB
-URI https://asc.fasb.org/1943274/2147480566/210-10-S99-1
Reference 3: http://fasb.org/us-gaap/role/ref/legacyRef
-Topic 210
-SubTopic 10
-Name Accounting Standards Codification
-Section S99
-Paragraph 1
-Subparagraph (SX 210.5-02(6)(c))
-Publisher FASB
-URI https://asc.fasb.org/1943274/2147480566/210-10-S99-1
Reference 4: http://fasb.org/us-gaap/role/ref/legacyRef
-Name Accounting Standards Codification
-Topic 210
-SubTopic 10
-Section 50
-Paragraph 1
-Publisher FASB
-URI https://asc.fasb.org/1943274/2147483489/210-10-50-1
| Name: |
us-gaap_ScheduleOfInventoryCurrentTableTextBlock |
| Namespace Prefix: |
us-gaap_ |
| Data Type: |
dtr-types:textBlockItemType |
| Balance Type: |
na |
| Period Type: |
duration |
|
v3.24.3
Pension And Other Post-Retirement Benefits (Tables)
|
9 Months Ended |
Sep. 30, 2024 |
|---|
| Retirement Benefits [Abstract] |
|
| Schedule Of Components Of Net Periodic Benefit Cost For Pension And Other Post-Retirement Benefit Programs |
The components of net periodic benefit cost for the pension and other postretirement benefit programs reflected in the condensed consolidated statements of income for the three and nine months ended September 30, 2024 and 2023, are shown below: | | | | | | | | | | | | | | | | | | | | | | | | | Pension Benefits | | Other Post-Retirement Benefits | | | Three Months Ended September 30, | | Three Months Ended September 30, | | (In thousands) | 2024 | | 2023 | | 2024 | | 2023 | | Service cost | $ | — | | | $ | — | | | $ | 3 | | | $ | 3 | | | Interest cost | 20 | | | 2,786 | | | 65 | | | 71 | | | Expected return on plan assets | — | | | (2,328) | | | — | | | — | | Pension settlement loss(a) | — | | | 25,612 | | | — | | | — | | | Amortization of prior service costs, (gains) losses and net transition asset | 3 | | | 2,644 | | | (37) | | | (58) | | | Net periodic benefit cost | $ | 23 | | | $ | 28,714 | | | $ | 31 | | | $ | 16 | | | | | | | | | | | Pension Benefits | | Other Post-Retirement Benefits | | | Nine Months Ended September 30, | | Nine Months Ended September 30, | | (In thousands) | 2024 | | 2023 | | 2024 | | 2023 | | Service cost | $ | — | | | $ | — | | | $ | 8 | | | $ | 9 | | | Interest cost | 57 | | | 8,842 | | | 203 | | | 213 | | | Expected return on plan assets | — | | | (7,542) | | | — | | | — | | Pension settlement loss(a) | — | | | 25,612 | | | — | | | — | | | Amortization of prior service costs, (gains) losses and net transition asset | 15 | | | 8,609 | | | (120) | | | (176) | | | Net periodic benefit cost | $ | 72 | | | $ | 35,521 | | | $ | 91 | | | $ | 46 | | | (a) Pension settlement loss, included in the consolidated statements of operation, represents pension settlement charges due to lump sum payments to participants. |
|
| X |
- DefinitionSchedule Of Components Of Net Periodic Benefit Cost For Pension And Other Post-Retirement Benefit Programs [Table Text Block]
| Name: |
tg_ScheduleOfComponentsOfNetPeriodicBenefitCostForPensionAndOtherPostRetirementBenefitProgramsTableTextBlock |
| Namespace Prefix: |
tg_ |
| Data Type: |
dtr-types1:textBlockItemType |
| Balance Type: |
na |
| Period Type: |
duration |
|
| X |
- References
+ Details
| Name: |
us-gaap_CompensationAndRetirementDisclosureAbstract |
| Namespace Prefix: |
us-gaap_ |
| Data Type: |
xbrli:stringItemType |
| Balance Type: |
na |
| Period Type: |
duration |
|
v3.24.3
Earnings Per Share (Tables)
|
9 Months Ended |
Sep. 30, 2024 |
|---|
| Earnings Per Share [Abstract] |
|
| Schedule of Earnings Per Share, Basic and Diluted |
Diluted earnings per share is computed by dividing net income (loss) by the weighted average common and potentially dilutive common equivalent shares outstanding, determined as follows: | | | | | | | | | | | | | | | | | | | | | | | | | | Three Months Ended September 30, | | Nine Months Ended September 30, | | (In thousands) | 2024 | | 2023 | | 2024 | | 2023 | | Weighted average shares outstanding used to compute basic earnings per share | 34,391 | | | 34,264 | | | 34,364 | | | 34,081 | | | Incremental dilutive shares attributable to stock options and restricted stock | — | | | — | | | — | | | — | | | Shares used to compute diluted earnings per share | 34,391 | | | 34,264 | | | 34,364 | | | 34,081 | |
|
| X |
- References
+ Details
| Name: |
us-gaap_EarningsPerShareAbstract |
| Namespace Prefix: |
us-gaap_ |
| Data Type: |
xbrli:stringItemType |
| Balance Type: |
na |
| Period Type: |
duration |
|
| X |
- DefinitionTabular disclosure of an entity's basic and diluted earnings per share calculations, including a reconciliation of numerators and denominators of the basic and diluted per-share computations for income from continuing operations. Reference 1: http://www.xbrl.org/2009/role/commonPracticeRef
-Topic 260
-SubTopic 10
-Name Accounting Standards Codification
-Section 50
-Paragraph 1
-Subparagraph (a)
-Publisher FASB
-URI https://asc.fasb.org/1943274/2147482662/260-10-50-1
| Name: |
us-gaap_ScheduleOfEarningsPerShareBasicAndDilutedTableTextBlock |
| Namespace Prefix: |
us-gaap_ |
| Data Type: |
dtr-types:textBlockItemType |
| Balance Type: |
na |
| Period Type: |
duration |
|
v3.24.3
Accumulated Other Comprehensive Income (Loss) (Tables)
|
3 Months Ended |
Sep. 30, 2023 |
|---|
| Other Comprehensive Income (Loss), Net of Tax [Abstract] |
|
| Schedule Of Reclassifications Of Balances Out Of Accumulated Other Comprehensive Income (Loss) Into Net Income |
The changes in accumulated other comprehensive income (loss) by component for the three months ended September 30, 2024. | | | | | | | | | | | | | | | | | | | | | | | | | (In thousands) | Foreign Currency Translation | | Gain (Loss) on Derivative Financial Instruments | | Pension & Other Postretirement Benefit Adjust | | Total Accumulated Other Comprehensive Income (Loss) | | Balance at July 1, 2024 | $ | (90,273) | | | $ | (564) | | | $ | 484 | | | $ | (90,353) | | | Other comprehensive income (loss) | 1,500 | | | 262 | | | — | | | 1,762 | | | Income tax (expense) benefit | (4) | | | (41) | | | — | | | (45) | | | Other comprehensive income (loss), net of tax | 1,496 | | | 221 | | | — | | | 1,717 | | | Reclassification adjustment to net income (loss) | — | | | 281 | | | (34) | | | 247 | | | Income tax (expense) benefit | — | | | (79) | | | 7 | | | (72) | | | Reclassification adjustment to net income (loss), net of tax | — | | | 202 | | | (27) | | | 175 | | | Other comprehensive income (loss), net of tax | 1,496 | | | 423 | | | (27) | | | 1,892 | | Balance at September 30, 2024 | $ | (88,777) | | | $ | (141) | | | $ | 457 | | | $ | (88,461) | |
The changes in accumulated other comprehensive income (loss) by component for the nine months ended September 30, 2024. | | | | | | | | | | | | | | | | | | | | | | | | | (In thousands) | Foreign Currency Translation | | Gain (Loss) on Derivative Financial Instruments | | Pension & Other Postretirement Benefit Adjust | | Total Accumulated Other Comprehensive Income (Loss) | | Balance at January 1, 2024 | $ | (83,037) | | | $ | 801 | | | $ | 539 | | | $ | (81,697) | | | Other comprehensive income (loss) | (6,206) | | | (1,435) | | | — | | | (7,641) | | | Income tax (expense) benefit | 466 | | | 275 | | | — | | | 741 | | | Other comprehensive income (loss), net of tax | (5,740) | | | (1,160) | | | — | | | (6,900) | | | Reclassification adjustment to net income (loss) | — | | | 220 | | | (105) | | | 115 | | | Income tax (expense) benefit | — | | | (2) | | | 23 | | | 21 | | | Reclassification adjustment to net income (loss), net of tax | — | | | 218 | | | (82) | | | 136 | | | Other comprehensive income (loss), net of tax | (5,740) | | | (942) | | | (82) | | | (6,764) | | Balance at September 30, 2024 | $ | (88,777) | | | $ | (141) | | | $ | 457 | | | $ | (88,461) | |
The changes in accumulated other comprehensive income (loss) by component for the three months ended September 30, 2023. | | | | | | | | | | | | | | | | | | | | | | | | | (In thousands) | Foreign Currency Translation | | Gain (Loss) on Derivative Financial Instruments | | Pension & Other Postretirement Benefit Adjust | | Total Accumulated Other Comprehensive Income (Loss) | | Balance at July 1, 2023 | $ | (83,338) | | | $ | (843) | | | $ | (54,463) | | | $ | (138,644) | | | Other comprehensive income (loss) | (1,793) | | | 2,287 | | | 442 | | | 936 | | | Income tax (expense) benefit | (25) | | | (197) | | | — | | | (222) | | | Other comprehensive income (loss), net of tax | (1,818) | | | 2,090 | | | 442 | | | 714 | | | Reclassification adjustment to net income (loss) | — | | | (2,756) | | | 28,198 | | | 25,442 | | | Income tax (expense) benefit | — | | | 735 | | | (6,218) | | | (5,483) | | | Reclassification adjustment to net income (loss), net of tax | — | | | (2,021) | | | 21,980 | | | 19,959 | | | Other comprehensive income (loss), net of tax | (1,818) | | | 69 | | | 22,422 | | | 20,673 | | Balance at September 30, 2023 | $ | (85,156) | | | $ | (774) | | | $ | (32,041) | | | $ | (117,971) | |
The changes in accumulated other comprehensive income (loss) by component for the nine months ended September 30, 2023. | | | | | | | | | | | | | | | | | | | | | | | | | (In thousands) | Foreign Currency Translation | | Gain (Loss) on Derivative Financial Instruments | | Pension & Other Postretirement Benefit Adjust | | Total Accumulated Other Comprehensive Income (Loss) | | Balance at January 1, 2023 | $ | (86,079) | | | $ | (2,480) | | | $ | (59,036) | | | $ | (147,595) | | | Other comprehensive income (loss) | 1,563 | | | 7,852 | | | 442 | | | 9,857 | | | Income tax (expense) benefit | (640) | | | (2,228) | | | — | | | (2,868) | | | Other comprehensive income (loss), net of tax | 923 | | | 5,624 | | | 442 | | | 6,989 | | | Reclassification adjustment to net income (loss) | — | | | (5,350) | | | 34,045 | | | 28,695 | | | Income tax (expense) benefit | — | | | 1,432 | | | (7,492) | | | (6,060) | | | Reclassification adjustment to net income (loss), net of tax | — | | | (3,918) | | | 26,553 | | | 22,635 | | | Other comprehensive income (loss), net of tax | 923 | | | 1,706 | | | 26,995 | | | 29,624 | | Balance at September 30, 2023 | $ | (85,156) | | | $ | (774) | | | $ | (32,041) | | | $ | (117,971) | |
|
| X |
- DefinitionSchedule Of Reclassifications Of Balances Out Of Accumulated Other Comprehensive Income (Loss) Into Net Income [Table Text Block]
| Name: |
tg_ScheduleOfReclassificationsOfBalancesOutOfAccumulatedOtherComprehensiveIncomeLossIntoNetIncomeTableTextBlock |
| Namespace Prefix: |
tg_ |
| Data Type: |
dtr-types1:textBlockItemType |
| Balance Type: |
na |
| Period Type: |
duration |
|
| X |
- References
+ Details
| Name: |
us-gaap_OtherComprehensiveIncomeLossNetOfTaxPeriodIncreaseDecreaseAbstract |
| Namespace Prefix: |
us-gaap_ |
| Data Type: |
xbrli:stringItemType |
| Balance Type: |
na |
| Period Type: |
duration |
|
v3.24.3
Derivative Financial Instruments (Tables)
|
9 Months Ended |
Sep. 30, 2024 |
|---|
| Summary of Derivative Instruments [Abstract] |
|
| Summary Of Location And Fair Value Of Derivative Financial Instruments |
The table below summarizes the location and gross amounts of aluminum futures contract fair values (Level 2) in the condensed consolidated balance sheets as of September 30, 2024 and December 31, 2023: | | | | | | | | | | | | | | | | | | | | | | | | | | September 30, 2024 | | December 31, 2023 | | (In thousands) | Balance Sheet
Account | | Fair
Value | | Balance Sheet
Account | | Fair
Value | | Derivatives Designated as Hedging Instruments | | | | | | | | Asset derivatives: Aluminum futures contracts | Prepaid expenses and other | | $ | 354 | | | Prepaid expenses and other | | $ | — | | | | | | | | | | Liability derivatives: Aluminum futures contracts | Accrued expenses | | (128) | | | Accrued expenses | | (483) | | | Aluminum futures contracts | Other non-current liabilities | | — | | | Other non-current liabilities | | (9) | | | Net asset (liability) | | | $ | 226 | | | | | $ | (492) | |
The table below summarizes the location and gross amounts of foreign currency forward contract fair values (Level 2) in the condensed consolidated balance sheets as of September 30, 2024 and December 31, 2023: | | | | | | | | | | | | | | | | | | | | | | | | | | | September 30, 2024 | | December 31, 2023 | | (In thousands) | Balance Sheet
Account | | Fair
Value | | Balance Sheet
Account | | | Fair
Value | | Derivatives Designated as Hedging Instruments | | | | | | | | | Asset derivatives: Foreign currency forward contracts | Prepaid expenses and other | | $ | 219 | | | Prepaid expenses and other | | | $ | 2,050 | | | Foreign currency forward contracts | Other assets | | — | | | Other assets | | | 146 | | Liability derivatives: Foreign currency forward contracts | Accrued expenses | | (299) | | | Other non-current liabilities | | | — | | | | | | | | | | | | Net asset (liability) | | | $ | (80) | | | | | | $ | 2,196 | |
|
| Derivative, Description of Hedged Item |
Terphane Ltda. had the following outstanding foreign exchange average forward rate contracts to purchase Brazilian Real and sell U.S. Dollars as of September 30, 2024: | | | | | | | | | | | | | | | | USD Notional Amount (000s) | Average Forward Rate Contracted on USD/BRL | R$ Equivalent Amount (000s) | Applicable Month | Estimated % of Terphane Ltda. R$ Operating Cost Exposure Hedged | | | | | | | | | | | | | | | | | | | | | | | | | | | | | | | | | | | | | | | | | | | | | | | | | | | | | | | | | | | | | | | | | | | | | | | | | | | | | | | | | | | | | | | | | | | | $1,851 | 5.4225 | R$10,037 | Oct-24 | 87% | | $1,837 | 5.4403 | R$9,994 | Nov-24 | 86% | | $1,801 | 5.4580 | R$9,830 | Dec-24 | 85% | | $5,489 | 5.4402 | R$29,861 | | 85% |
|
| Schedule of Derivative Instruments in Statement of Financial Position, Fair Value [Table Text Block] |
The table below summarizes the location and gross amounts of aluminum futures contract fair values (Level 2) in the condensed consolidated balance sheets as of September 30, 2024 and December 31, 2023: | | | | | | | | | | | | | | | | | | | | | | | | | | September 30, 2024 | | December 31, 2023 | | (In thousands) | Balance Sheet
Account | | Fair
Value | | Balance Sheet
Account | | Fair
Value | | Derivatives Designated as Hedging Instruments | | | | | | | | Asset derivatives: Aluminum futures contracts | Prepaid expenses and other | | $ | 354 | | | Prepaid expenses and other | | $ | — | | | | | | | | | | Liability derivatives: Aluminum futures contracts | Accrued expenses | | (128) | | | Accrued expenses | | (483) | | | Aluminum futures contracts | Other non-current liabilities | | — | | | Other non-current liabilities | | (9) | | | Net asset (liability) | | | $ | 226 | | | | | $ | (492) | |
The table below summarizes the location and gross amounts of foreign currency forward contract fair values (Level 2) in the condensed consolidated balance sheets as of September 30, 2024 and December 31, 2023: | | | | | | | | | | | | | | | | | | | | | | | | | | | September 30, 2024 | | December 31, 2023 | | (In thousands) | Balance Sheet
Account | | Fair
Value | | Balance Sheet
Account | | | Fair
Value | | Derivatives Designated as Hedging Instruments | | | | | | | | | Asset derivatives: Foreign currency forward contracts | Prepaid expenses and other | | $ | 219 | | | Prepaid expenses and other | | | $ | 2,050 | | | Foreign currency forward contracts | Other assets | | — | | | Other assets | | | 146 | | Liability derivatives: Foreign currency forward contracts | Accrued expenses | | (299) | | | Other non-current liabilities | | | — | | | | | | | | | | | | Net asset (liability) | | | $ | (80) | | | | | | $ | 2,196 | |
|
| Schedule Of Pretax Effect On Net Income (Loss) And Other Comprehensive Income (Loss) Of Derivative Instruments Classified As Cash Flow Hedges |
The pre-tax effect on net income (loss) and other comprehensive income (loss) of derivative instruments classified as cash flow hedges and described in the previous paragraphs for the three and nine month periods ended September 30, 2024 and 2023 is summarized in the table below: | | | | | | | | | | | | | | | | | | | | | | | | | | | | | | | | | | Cash Flow Derivative Hedges | | | Three Months Ended September 30, | | | Aluminum Futures Contracts | | Foreign Currency Forwards | | (In thousands) | 2024 | | 2023 | | 2024 | | 2023 | | Amount of pre-tax gain (loss) recognized in other comprehensive income (loss) | $ | 10 | | | $ | 2,908 | | | $ | — | | $ | 252 | | | $ | — | | | $ | (621) | | | Location of gain (loss) reclassified from accumulated other comprehensive income (loss) into net income (effective portion) | Cost of goods sold | | Cost of goods sold | | Cost of goods sold | Selling, general & admin | | Cost of goods sold | | Selling, general & admin | | Amount of pre-tax gain (loss) reclassified from accumulated other comprehensive income (loss) to net income (effective portion) | $ | (153) | | | $ | 1,716 | | | $ | 16 | | $ | (144) | | | $ | 16 | | | $ | 1,024 | | | | Nine Months Ended September 30, | | | Aluminum Futures Contracts | | Foreign Currency Forwards | | | 2024 | | 2023 | | 2024 | | 2023 | | Amount of pre-tax gain (loss) recognized in other comprehensive income (loss) | $ | 56 | | | $ | 4,867 | | | $ | — | | $ | (1,491) | | | $ | — | | | $ | 2,985 | | | Location of gain (loss) reclassified from accumulated other comprehensive income (loss) into net income (effective portion) | Cost of goods sold | | Cost of goods sold | | Cost of goods sold | Selling, general & admin | | Cost of goods sold | | Selling, general & admin | | Amount of pre-tax gain (loss) reclassified from accumulated other comprehensive income (loss) to net income (effective portion) | $ | (662) | | | $ | 3,273 | | | $ | 46 | | $ | 396 | | | $ | 46 | | | $ | 2,031 | |
|
| X |
- DefinitionTabular disclosure of the effective portion of the gains and losses on derivative instruments designated (and non-derivative instruments) designated and qualifying in cash flow hedges and net investment hedges that was recognized in other comprehensive income (loss) during the current period. Reference 1: http://fasb.org/us-gaap/role/ref/legacyRef
-Topic 815
-SubTopic 10
-Name Accounting Standards Codification
-Section 50
-Paragraph 4C
-Subparagraph (b)
-Publisher FASB
-URI https://asc.fasb.org/1943274/2147480434/815-10-50-4C
| Name: |
us-gaap_ScheduleOfDerivativeInstrumentsEffectOnOtherComprehensiveIncomeLossTableTextBlock |
| Namespace Prefix: |
us-gaap_ |
| Data Type: |
dtr-types:textBlockItemType |
| Balance Type: |
na |
| Period Type: |
duration |
|
| X |
- DefinitionTabular disclosure of the location and fair value amounts of derivative instruments (and nonderivative instruments that are designated and qualify as hedging instruments) reported in the statement of financial position. Reference 1: http://fasb.org/us-gaap/role/ref/legacyRef
-Name Accounting Standards Codification
-Topic 815
-SubTopic 10
-Section 50
-Paragraph 4B
-Publisher FASB
-URI https://asc.fasb.org/1943274/2147480434/815-10-50-4B
| Name: |
us-gaap_ScheduleOfDerivativeInstrumentsInStatementOfFinancialPositionFairValueTextBlock |
| Namespace Prefix: |
us-gaap_ |
| Data Type: |
dtr-types:textBlockItemType |
| Balance Type: |
na |
| Period Type: |
duration |
|
| X |
- DefinitionTabular disclosure of pertinent information about a derivative or group of derivatives on a disaggregated basis, such as for individual instruments, or small groups of similar instruments. May include a combination of the type of instrument, risks being hedged, notional amount, hedge designation, related hedged item, inception date, maturity date, or other relevant item. Reference 1: http://fasb.org/us-gaap/role/ref/legacyRef
-Name Accounting Standards Codification
-Section 50
-Paragraph 2
-SubTopic 10
-Topic 815
-Publisher FASB
-URI https://asc.fasb.org/1943274/2147480434/815-10-50-2
Reference 2: http://fasb.org/us-gaap/role/ref/legacyRef
-Name Accounting Standards Codification
-Topic 815
-SubTopic 10
-Section 50
-Paragraph 1A
-Publisher FASB
-URI https://asc.fasb.org/1943274/2147480434/815-10-50-1A
Reference 3: http://fasb.org/us-gaap/role/ref/legacyRef
-Name Accounting Standards Codification
-Topic 815
-SubTopic 10
-Section 50
-Paragraph 1B
-Publisher FASB
-URI https://asc.fasb.org/1943274/2147480434/815-10-50-1B
Reference 4: http://fasb.org/us-gaap/role/ref/legacyRef
-Name Accounting Standards Codification
-Topic 815
-SubTopic 10
-Section 50
-Paragraph 8
-Publisher FASB
-URI https://asc.fasb.org/1943274/2147480434/815-10-50-8
Reference 5: http://fasb.org/us-gaap/role/ref/legacyRef
-Name Accounting Standards Codification
-Topic 815
-SubTopic 10
-Section 50
-Paragraph 4B
-Publisher FASB
-URI https://asc.fasb.org/1943274/2147480434/815-10-50-4B
Reference 6: http://fasb.org/us-gaap/role/ref/legacyRef
-Name Accounting Standards Codification
-Topic 815
-SubTopic 10
-Section 50
-Paragraph 1
-Publisher FASB
-URI https://asc.fasb.org/1943274/2147480434/815-10-50-1
Reference 7: http://fasb.org/us-gaap/role/ref/legacyRef
-Name Accounting Standards Codification
-Topic 815
-SubTopic 10
-Section 50
-Paragraph 4
-Publisher FASB
-URI https://asc.fasb.org/1943274/2147480434/815-10-50-4
Reference 8: http://fasb.org/us-gaap/role/ref/legacyRef
-Name Accounting Standards Codification
-Topic 815
-SubTopic 10
-Section 50
-Paragraph 5
-Publisher FASB
-URI https://asc.fasb.org/1943274/2147480434/815-10-50-5
Reference 9: http://fasb.org/us-gaap/role/ref/legacyRef
-Name Accounting Standards Codification
-Topic 815
-SubTopic 10
-Section 50
-Paragraph 4C
-Publisher FASB
-URI https://asc.fasb.org/1943274/2147480434/815-10-50-4C
| Name: |
us-gaap_ScheduleOfDerivativeInstrumentsTextBlock |
| Namespace Prefix: |
us-gaap_ |
| Data Type: |
dtr-types:textBlockItemType |
| Balance Type: |
na |
| Period Type: |
duration |
|
| X |
- References
+ Details
| Name: |
us-gaap_SummaryOfDerivativeInstrumentsAbstract |
| Namespace Prefix: |
us-gaap_ |
| Data Type: |
xbrli:stringItemType |
| Balance Type: |
na |
| Period Type: |
duration |
|
v3.24.3
Segment Reporting (Tables)
|
9 Months Ended |
Sep. 30, 2024 |
|---|
| Segment Reporting [Abstract] |
|
| Schedule Of Segment Reporting Information By Segment |
The following table presents net sales and EBITDA from ongoing operations by segment for the three and nine months ended September 30, 2024 and 2023: | | | | | | | | | | | | | | | | | | | | | | | | | Three Months Ended September 30, | | Nine Months Ended September 30, | | (In thousands) | 2024 | | 2023 | | 2024 | | 2023 | | Net Sales | | | | | | | | | Aluminum Extrusions | $ | 115,717 | | | $ | 109,410 | | | $ | 349,353 | | | $ | 364,607 | | | PE Films | 24,879 | | | 19,938 | | | 78,811 | | | 56,036 | | | Flexible Packaging Films | 34,370 | | | 30,111 | | | 99,025 | | | 94,861 | | | Total net sales | 174,966 | | | 159,459 | | | 527,189 | | | 515,504 | | | Add back freight | 7,085 | | | 6,733 | | | 20,833 | | | 19,977 | | | Sales as shown in the condensed consolidated statements of income (loss) | $ | 182,051 | | | $ | 166,192 | | | $ | 548,022 | | | $ | 535,481 | | | EBITDA from Ongoing Operations | | | | | | | | | Aluminum Extrusions: | | | | | | | | | Ongoing operations: | | | | | | | | | EBITDA | $ | 6,177 | | | $ | 5,113 | | | $ | 31,624 | | | $ | 29,968 | | | Depreciation & amortization | (4,404) | | | (4,683) | | | (13,392) | | | (13,252) | | | EBIT | 1,773 | | | 430 | | | 18,232 | | | 16,716 | | | Plant shutdowns, asset impairments, restructurings and other | (2,170) | | | (1,483) | | | (4,986) | | | (1,821) | | | PE Films: | | | | | | | | | Ongoing operations: | | | | | | | | | EBITDA | 5,876 | | | 4,037 | | | 22,913 | | | 6,700 | | | Depreciation & amortization | (1,299) | | | (2,111) | | | (3,944) | | | (5,305) | | | EBIT | 4,577 | | | 1,926 | | | 18,969 | | | 1,395 | | | Plant shutdowns, asset impairments, restructurings and other | — | | | (4,566) | | | (584) | | | (4,565) | | | Goodwill impairment | — | | | (19,478) | | | — | | | (34,891) | | | Flexible Packaging Films: | | | | | | | | | Ongoing operations: | | | | | | | | | EBITDA | 3,749 | | | 477 | | | 8,915 | | | 2,076 | | | Depreciation & amortization | (708) | | | (704) | | | (2,191) | | | (2,115) | | | EBIT | 3,041 | | | (227) | | | 6,724 | | | (39) | | | Plant shutdowns, asset impairments, restructurings and other | (103) | | | — | | | (103) | | | (79) | | | Total | 7,118 | | | (23,398) | | | 38,252 | | | (23,284) | | | Interest income | 8 | | | 62 | | | 36 | | | 135 | | | Interest expense | 3,480 | | | 3,106 | | | 10,314 | | | 7,791 | | | Gain on investment in kaleo, Inc. | — | | | — | | | 144 | | | 262 | | | Stock option-based compensation costs | — | | | — | | | — | | | 231 | | | Pension settlement loss | — | | | 25,612 | | | — | | | 25,612 | | | Corporate expenses, net | 6,644 | | | 11,633 | | | 16,411 | | | 30,100 | | | Income (loss) before income taxes | (2,998) | | | (63,687) | | | 11,707 | | | (86,621) | | | Income tax expense (benefit) | 948 | | | (13,307) | | | 3,573 | | | (16,307) | | | Net income (loss) | $ | (3,946) | | | $ | (50,380) | | | $ | 8,134 | | | $ | (70,314) | |
|
| Schedule Of Identifiable Assets By Segment |
The following table presents identifiable assets by segment at September 30, 2024 and December 31, 2023: | | | | | | | | | | | | | (In thousands) | September 30, 2024 | | December 31, 2023 | | Aluminum Extrusions | $ | 258,410 | | | $ | 255,756 | | | PE Films | 57,989 | | | 56,536 | | | Flexible Packaging Films | 85,297 | | | 84,062 | | | Subtotal | 401,696 | | | 396,354 | | | General corporate | 34,256 | | | 36,652 | | | Cash, cash equivalents and restricted cash | 6,588 | | | 13,455 | | | Total | $ | 442,540 | | | $ | 446,461 | |
|
| Disaggregation of Revenue [Table Text Block] |
The following tables disaggregate the Company’s revenue by geographic area and product group for the three and nine months ended September 30, 2024 and 2023: | | | | | | | | | | | | | | | | | | | | | | | | | Net Sales by Geographic Area (a) | | Three Months Ended September 30, | | Nine Months Ended September 30, | | (In thousands) | 2024 | | 2023 | | 2024 | | 2023 | | United States | $ | 133,157 | | | $ | 125,407 | | | $ | 407,465 | | | $ | 409,433 | | | Exports from the United States to: | | | | | | | | | Asia | 11,875 | | | 7,873 | | | 34,534 | | | 19,082 | | | Latin America | 1,395 | | | 1,764 | | | 4,121 | | | 5,440 | | | Canada | 3,437 | | | 3,640 | | | 10,459 | | | 12,879 | | | Europe | 405 | | | 282 | | | 1,053 | | | 1,414 | | | Operations outside the United States: | | | | | | | | | Brazil | 24,408 | | | 20,351 | | | 69,002 | | | 66,954 | | | Asia | 289 | | | 142 | | | 555 | | | 302 | | | Total | $ | 174,966 | | | $ | 159,459 | | | $ | 527,189 | | | $ | 515,504 | | (a) Export sales relate mostly to PE Films. Operations in Brazil relate to Flexible Packaging Films. |
The Company’s facilities in Pottsville, PA (“PV”) and Guangzhou, China (“GZ”) have a tolling arrangement whereby certain surface protection films are manufactured in GZ for a fee with raw materials supplied from PV that are then shipped by GZ directly to customers principally in the Asian market, but paid by customers directly to PV. Amounts associated with this intercompany tolling arrangement are reported in the table above as export sales from the U.S. to Asia, and include net sales of $6.5 million and $4.8 million in the third quarter of 2024 and 2023, respectively, and $19.1 million and $11.7 million in the first nine months of 2024 and 2023, respectively. | | | | | | | | | | | | | | | | | | | | | | | | | Net Sales by Product Group | | Three Months Ended September 30, | | Nine Months Ended September 30, | | (In thousands) | 2024 | | 2023 | | 2024 | | 2023 | | Aluminum Extrusions: | | | | | | | | | Nonresidential building & construction | $ | 61,988 | | | $ | 59,476 | | | $ | 195,603 | | | $ | 203,889 | | | Consumer durables | 8,581 | | | 8,662 | | | 25,487 | | | 30,723 | | | Automotive | 11,060 | | | 13,025 | | | 31,793 | | | 36,916 | | | Residential building & construction | 9,790 | | | 7,999 | | | 27,575 | | | 29,658 | | | Electrical | 8,926 | | | 2,016 | | | 21,983 | | | 16,223 | | | Machinery & equipment | 13,131 | | | 14,202 | | | 37,995 | | | 36,008 | | | Distribution | 2,241 | | | 4,030 | | | 8,917 | | | 11,190 | | | Subtotal | 115,717 | | | 109,410 | | | 349,353 | | | 364,607 | | | PE Films: | | | | | | | | | Surface protection films | 17,516 | | | 12,755 | | | 56,241 | | | 34,251 | | | Overwrap packaging | 7,363 | | | 7,183 | | | 22,570 | | | 21,785 | | | Subtotal | 24,879 | | | 19,938 | | | 78,811 | | | 56,036 | | | Flexible Packaging Films | 34,370 | | | 30,111 | | | 99,025 | | | 94,861 | | | Total | $ | 174,966 | | | $ | 159,459 | | | $ | 527,189 | | | $ | 515,504 | |
|
| X |
- DefinitionSchedule of identifiable assets by segment.
| Name: |
tg_ScheduleOfIdentifiableAssetsBySegmentTableTextBlock |
| Namespace Prefix: |
tg_ |
| Data Type: |
dtr-types1:textBlockItemType |
| Balance Type: |
na |
| Period Type: |
duration |
|
| X |
- DefinitionTabular disclosure of disaggregation of revenue into categories depicting how nature, amount, timing, and uncertainty of revenue and cash flows are affected by economic factor. Reference 1: http://www.xbrl.org/2009/role/commonPracticeRef
-Topic 606
-SubTopic 10
-Name Accounting Standards Codification
-Section 50
-Paragraph 5
-Publisher FASB
-URI https://asc.fasb.org/1943274/2147479806/606-10-50-5
| Name: |
us-gaap_DisaggregationOfRevenueTableTextBlock |
| Namespace Prefix: |
us-gaap_ |
| Data Type: |
dtr-types:textBlockItemType |
| Balance Type: |
na |
| Period Type: |
duration |
|
| X |
- DefinitionTabular disclosure of the profit or loss and total assets for each reportable segment. An entity discloses certain information on each reportable segment if the amounts (a) are included in the measure of segment profit or loss reviewed by the chief operating decision maker or (b) are otherwise regularly provided to the chief operating decision maker, even if not included in that measure of segment profit or loss. Reference 1: http://fasb.org/us-gaap/role/ref/legacyRef
-Name Accounting Standards Codification
-Topic 280
-SubTopic 10
-Section 50
-Paragraph 25
-Publisher FASB
-URI https://asc.fasb.org/1943274/2147482810/280-10-50-25
Reference 2: http://fasb.org/us-gaap/role/ref/legacyRef
-Name Accounting Standards Codification
-Topic 280
-SubTopic 10
-Section 50
-Paragraph 22
-Publisher FASB
-URI https://asc.fasb.org/1943274/2147482810/280-10-50-22
Reference 3: http://fasb.org/us-gaap/role/ref/legacyRef
-Name Accounting Standards Codification
-Topic 280
-SubTopic 10
-Section 50
-Paragraph 30
-Publisher FASB
-URI https://asc.fasb.org/1943274/2147482810/280-10-50-30
| Name: |
us-gaap_ScheduleOfSegmentReportingInformationBySegmentTextBlock |
| Namespace Prefix: |
us-gaap_ |
| Data Type: |
dtr-types:textBlockItemType |
| Balance Type: |
na |
| Period Type: |
duration |
|
| X |
- References
+ Details
| Name: |
us-gaap_SegmentReportingAbstract |
| Namespace Prefix: |
us-gaap_ |
| Data Type: |
xbrli:stringItemType |
| Balance Type: |
na |
| Period Type: |
duration |
|
v3.24.3
Debt Pricing Under Credit Revolving Agreement Table (Tables)
|
9 Months Ended |
Sep. 30, 2024 |
|---|
| Debt Disclosure - Pricing Table [Abstract] |
|
| Schedule Of Borrowings Under Credit Agreement At Various Indebtedness To Adjusted Ebitda Levels |
Based upon the quarterly average of daily availability under the ABL Facility, the interest rate pricing grid applicable after the ABL Adjustment Date will be as follows: | | | | | | | | | | | | | Pricing under the ABL Facility (Basis Points) | | Quarter Average of Daily Availability | Term Benchmark
Spread | ABR
Spread | Commitment
Fee* | | > 66% of $125 million aggregate commitment | 225.0 | 125.0 | 40.0 | | ≤ 66% but > 33% of $125 million aggregate commitment | 250.0 | 150.0 | 40.0 | | ≤ 33% of $125 million aggregate commitment | 275.0 | 175.0 | 40.0 | *The Commitment Fee before the ABL Adjustment Date and after the ABL Adjustment Date remain the same as reflected in this table. |
|
| X |
- DefinitionDebt Disclosure - Pricing Table [Abstract]
| Name: |
tg_DebtDisclosurePricingTableAbstract |
| Namespace Prefix: |
tg_ |
| Data Type: |
xbrli:stringItemType |
| Balance Type: |
na |
| Period Type: |
duration |
|
| X |
- DefinitionSchedule Of Borrowings Under Credit Agreement At Various Indebtedness To Adjusted Ebitda Levels
| Name: |
tg_ScheduleOfBorrowingsUnderCreditAgreementAtVariousIndebtednessToAdjustedEbitdaLevelsTableTextBlock |
| Namespace Prefix: |
tg_ |
| Data Type: |
dtr-types1:textBlockItemType |
| Balance Type: |
na |
| Period Type: |
duration |
|
v3.24.3
Basis Of Presentation (Details) - USD ($)
$ in Thousands |
3 Months Ended |
9 Months Ended |
|
Sep. 30, 2024 |
Sep. 30, 2023 |
Sep. 30, 2024 |
Sep. 30, 2023 |
Dec. 31, 2023 |
| Accounts, Notes, Loans and Financing Receivable [Line Items] |
|
|
|
|
|
| Gain (Loss) on Termination of Lease |
|
|
$ 300
|
|
|
| Goodwill, Impairment Loss |
$ 0
|
$ 19,478
|
0
|
$ 34,891
|
|
| Surface Protection Films [Member] |
|
|
|
|
|
| Accounts, Notes, Loans and Financing Receivable [Line Items] |
|
|
|
|
|
| Goodwill, Impairment Loss |
|
19,500
|
|
34,900
|
|
| Goodwill, Impairment Loss, Net of Tax |
|
$ 15,100
|
|
$ 27,000
|
|
| Third-Party Financial Institutions |
|
|
|
|
|
| Accounts, Notes, Loans and Financing Receivable [Line Items] |
|
|
|
|
|
| Accounts Payable |
$ 11,800
|
|
11,800
|
|
$ 15,800
|
| Other Expense |
|
|
|
|
|
| Accounts, Notes, Loans and Financing Receivable [Line Items] |
|
|
|
|
|
| Business Exit Costs |
|
|
$ 200
|
|
|
| X |
- DefinitionLine items represent financial concepts included in a table. These concepts are used to disclose reportable information associated with domain members defined in one or many axes to the table. Reference 1: http://www.xbrl.org/2009/role/commonPracticeRef
-Topic 310
-SubTopic 20
-Name Accounting Standards Codification
-Section 40
-Paragraph 7
-Publisher FASB
-URI https://asc.fasb.org/1943274/2147481628/310-20-40-7
Reference 2: http://www.xbrl.org/2003/role/disclosureRef
-Topic 310
-SubTopic 10
-Name Accounting Standards Codification
-Section 45
-Paragraph 2
-Publisher FASB
-URI https://asc.fasb.org/1943274/2147481990/310-10-45-2
| Name: |
us-gaap_AccountsNotesAndLoansReceivableLineItems |
| Namespace Prefix: |
us-gaap_ |
| Data Type: |
xbrli:stringItemType |
| Balance Type: |
na |
| Period Type: |
duration |
|
| X |
- DefinitionCarrying value as of the balance sheet date of liabilities incurred (and for which invoices have typically been received) and payable to vendors for goods and services received that are used in an entity's business. Reference 1: http://fasb.org/us-gaap/role/ref/legacyRef
-Topic 942
-SubTopic 210
-Name Accounting Standards Codification
-Section S99
-Paragraph 1
-Subparagraph (SX 210.9-03(15)(5))
-Publisher FASB
-URI https://asc.fasb.org/1943274/2147478546/942-210-S99-1
Reference 2: http://www.xbrl.org/2009/role/commonPracticeRef
-Topic 944
-SubTopic 210
-Name Accounting Standards Codification
-Section S99
-Paragraph 1
-Subparagraph (SX 210.7-03(a)(15)(a))
-Publisher FASB
-URI https://asc.fasb.org/1943274/2147478777/944-210-S99-1
| Name: |
us-gaap_AccountsPayableCurrentAndNoncurrent |
| Namespace Prefix: |
us-gaap_ |
| Data Type: |
xbrli:monetaryItemType |
| Balance Type: |
credit |
| Period Type: |
instant |
|
| X |
- DefinitionAmount of expenses associated with exit or disposal activities pursuant to an authorized plan. Includes, but is not limited to, one-time termination benefits, termination of an operating lease or other contract, consolidating or closing facilities, and relocating employees, and termination benefits associated with an ongoing benefit arrangement. Excludes expenses associated with special or contractual termination benefits, a discontinued operation or an asset retirement obligation. Reference 1: http://fasb.org/us-gaap/role/ref/legacyRef
-Name Accounting Standards Codification
-Section 45
-Paragraph 28
-Subparagraph (b)
-SubTopic 10
-Topic 230
-Publisher FASB
-URI https://asc.fasb.org/1943274/2147482740/230-10-45-28
| Name: |
us-gaap_BusinessExitCosts1 |
| Namespace Prefix: |
us-gaap_ |
| Data Type: |
xbrli:monetaryItemType |
| Balance Type: |
debit |
| Period Type: |
duration |
|
| X |
- DefinitionAmount of gain (loss) on termination of lease before expiration of lease term. Reference 1: http://www.xbrl.org/2003/role/disclosureRef
-Topic 842
-SubTopic 20
-Name Accounting Standards Codification
-Section 40
-Paragraph 1
-Publisher FASB
-URI https://asc.fasb.org/1943274/2147479092/842-20-40-1
| Name: |
us-gaap_GainLossOnTerminationOfLease |
| Namespace Prefix: |
us-gaap_ |
| Data Type: |
xbrli:monetaryItemType |
| Balance Type: |
credit |
| Period Type: |
duration |
|
| X |
- DefinitionAmount of impairment loss from asset representing future economic benefit arising from other asset acquired in business combination or from joint venture formation or both, that is not individually identified and separately recognized. Reference 1: http://fasb.org/us-gaap/role/ref/legacyRef
-Name Accounting Standards Codification
-Section 45
-Paragraph 28
-Subparagraph (b)
-SubTopic 10
-Topic 230
-Publisher FASB
-URI https://asc.fasb.org/1943274/2147482740/230-10-45-28
Reference 2: http://www.xbrl.org/2003/role/exampleRef
-Topic 350
-SubTopic 20
-Name Accounting Standards Codification
-Section 55
-Paragraph 24
-Publisher FASB
-URI https://asc.fasb.org/1943274/2147482548/350-20-55-24
Reference 3: http://www.xbrl.org/2003/role/disclosureRef
-Topic 350
-SubTopic 20
-Name Accounting Standards Codification
-Section 50
-Paragraph 2
-Subparagraph (b)
-Publisher FASB
-URI https://asc.fasb.org/1943274/2147482573/350-20-50-2
Reference 4: http://www.xbrl.org/2003/role/exampleRef
-Topic 820
-SubTopic 10
-Name Accounting Standards Codification
-Section 55
-Paragraph 100
-Subparagraph (d)
-Publisher FASB
-URI https://asc.fasb.org/1943274/2147482078/820-10-55-100
Reference 5: http://www.xbrl.org/2003/role/disclosureRef
-Topic 350
-SubTopic 20
-Name Accounting Standards Codification
-Section 50
-Paragraph 1
-Subparagraph (e)
-Publisher FASB
-URI https://asc.fasb.org/1943274/2147482573/350-20-50-1
Reference 6: http://www.xbrl.org/2003/role/disclosureRef
-Topic 350
-SubTopic 20
-Name Accounting Standards Codification
-Section 45
-Paragraph 2
-Publisher FASB
-URI https://asc.fasb.org/1943274/2147482598/350-20-45-2
| Name: |
us-gaap_GoodwillImpairmentLoss |
| Namespace Prefix: |
us-gaap_ |
| Data Type: |
xbrli:monetaryItemType |
| Balance Type: |
debit |
| Period Type: |
duration |
|
| X |
- DefinitionAmount, after tax, of impairment loss from asset representing future economic benefit arising from other asset acquired in business combination or from joint venture formation or both, that is not individually identified and separately recognized.
| Name: |
us-gaap_GoodwillImpairmentLossNetOfTax |
| Namespace Prefix: |
us-gaap_ |
| Data Type: |
xbrli:monetaryItemType |
| Balance Type: |
debit |
| Period Type: |
duration |
|
| X |
- Details
| Name: |
dei_LegalEntityAxis=tg_SurfaceProtectionFilmsMember |
| Namespace Prefix: |
|
| Data Type: |
na |
| Balance Type: |
|
| Period Type: |
|
|
| X |
- Details
| Name: |
srt_CounterpartyNameAxis=tg_ThirdPartyFinancialInstitutionsMember |
| Namespace Prefix: |
|
| Data Type: |
na |
| Balance Type: |
|
| Period Type: |
|
|
| X |
- Details
| Name: |
us-gaap_NatureOfExpenseAxis=us-gaap_OtherExpenseMember |
| Namespace Prefix: |
|
| Data Type: |
na |
| Balance Type: |
|
| Period Type: |
|
|
v3.24.3
Accounts and Other Receivables (Details) - USD ($)
$ in Thousands |
Sep. 30, 2024 |
Dec. 31, 2023 |
| Receivables [Abstract] |
|
|
| Accounts Receivable, before Allowance for Credit Loss, Current |
$ 81,735
|
$ 67,183
|
| Other Receivables, Gross, Current |
2,327
|
3,056
|
| Accounts Receivable, before Allowance for Credit Loss |
84,062
|
70,239
|
| Accounts Receivable, Allowance for Credit Loss |
(2,426)
|
(2,301)
|
| Accounts and other receivables, net |
$ 81,636
|
$ 67,938
|
| X |
- DefinitionAmount, before allowance for credit loss, of right to consideration from customer for product sold and service rendered in normal course of business. Reference 1: http://www.xbrl.org/2003/role/disclosureRef
-Topic 310
-SubTopic 10
-Name Accounting Standards Codification
-Section 45
-Paragraph 2
-Publisher FASB
-URI https://asc.fasb.org/1943274/2147481990/310-10-45-2
Reference 2: http://www.xbrl.org/2003/role/disclosureRef
-Topic 310
-SubTopic 10
-Name Accounting Standards Codification
-Section 45
-Paragraph 13
-Publisher FASB
-URI https://asc.fasb.org/1943274/2147481990/310-10-45-13
Reference 3: http://www.xbrl.org/2009/role/commonPracticeRef
-Topic 944
-SubTopic 210
-Name Accounting Standards Codification
-Section S99
-Paragraph 1
-Subparagraph (SX 210.7-03(a)(5))
-Publisher FASB
-URI https://asc.fasb.org/1943274/2147478777/944-210-S99-1
Reference 4: http://www.xbrl.org/2003/role/disclosureRef
-Topic 210
-SubTopic 10
-Name Accounting Standards Codification
-Section S99
-Paragraph 1
-Subparagraph (SX 210.5-02(3)(a)(1))
-Publisher FASB
-URI https://asc.fasb.org/1943274/2147480566/210-10-S99-1
| Name: |
us-gaap_AccountsReceivableGross |
| Namespace Prefix: |
us-gaap_ |
| Data Type: |
xbrli:monetaryItemType |
| Balance Type: |
debit |
| Period Type: |
instant |
|
| X |
- DefinitionAmount, before allowance for credit loss, of right to consideration from customer for product sold and service rendered in normal course of business, classified as current. Reference 1: http://www.xbrl.org/2003/role/disclosureRef
-Topic 310
-SubTopic 10
-Name Accounting Standards Codification
-Section 45
-Paragraph 2
-Publisher FASB
-URI https://asc.fasb.org/1943274/2147481990/310-10-45-2
Reference 2: http://www.xbrl.org/2003/role/disclosureRef
-Topic 210
-SubTopic 10
-Name Accounting Standards Codification
-Section S99
-Paragraph 1
-Subparagraph (SX 210.5-02(3)(a)(1))
-Publisher FASB
-URI https://asc.fasb.org/1943274/2147480566/210-10-S99-1
Reference 3: http://www.xbrl.org/2003/role/exampleRef
-Topic 210
-SubTopic 10
-Name Accounting Standards Codification
-Section 45
-Paragraph 1
-Subparagraph (c)
-Publisher FASB
-URI https://asc.fasb.org/1943274/2147483467/210-10-45-1
| Name: |
us-gaap_AccountsReceivableGrossCurrent |
| Namespace Prefix: |
us-gaap_ |
| Data Type: |
xbrli:monetaryItemType |
| Balance Type: |
debit |
| Period Type: |
instant |
|
| X |
- DefinitionAmount, after allowance for credit loss, of right to consideration from customer for product sold and service rendered in normal course of business. Reference 1: http://www.xbrl.org/2003/role/exampleRef
-Topic 946
-SubTopic 310
-Name Accounting Standards Codification
-Section 45
-Paragraph 1
-Subparagraph (d)
-Publisher FASB
-URI https://asc.fasb.org/1943274/2147477802/946-310-45-1
Reference 2: http://www.xbrl.org/2009/role/commonPracticeRef
-Topic 944
-SubTopic 210
-Name Accounting Standards Codification
-Section S99
-Paragraph 1
-Subparagraph (SX 210.7-03(a)(5))
-Publisher FASB
-URI https://asc.fasb.org/1943274/2147478777/944-210-S99-1
Reference 3: http://www.xbrl.org/2003/role/disclosureRef
-Topic 946
-SubTopic 210
-Name Accounting Standards Codification
-Section S99
-Paragraph 1
-Subparagraph (SX 210.6-04(5)(b))
-Publisher FASB
-URI https://asc.fasb.org/1943274/2147479170/946-210-S99-1
Reference 4: http://www.xbrl.org/2003/role/disclosureRef
-Topic 954
-SubTopic 310
-Name Accounting Standards Codification
-Section 45
-Paragraph 1
-Publisher FASB
-URI https://asc.fasb.org/1943274/2147479196/954-310-45-1
Reference 5: http://www.xbrl.org/2009/role/commonPracticeRef
-Topic 944
-SubTopic 210
-Name Accounting Standards Codification
-Section S99
-Paragraph 1
-Subparagraph (SX 210.7-03(a)(3))
-Publisher FASB
-URI https://asc.fasb.org/1943274/2147478777/944-210-S99-1
| Name: |
us-gaap_AccountsReceivableNet |
| Namespace Prefix: |
us-gaap_ |
| Data Type: |
xbrli:monetaryItemType |
| Balance Type: |
debit |
| Period Type: |
instant |
|
| X |
- DefinitionAmount of allowance for credit loss on accounts receivable. Reference 1: http://www.xbrl.org/2009/role/commonPracticeRef
-Topic 944
-SubTopic 210
-Name Accounting Standards Codification
-Section S99
-Paragraph 1
-Subparagraph (SX 210.7-03(a)(5))
-Publisher FASB
-URI https://asc.fasb.org/1943274/2147478777/944-210-S99-1
Reference 2: http://www.xbrl.org/2003/role/disclosureRef
-Topic 210
-SubTopic 10
-Name Accounting Standards Codification
-Section S99
-Paragraph 1
-Subparagraph (SX 210.5-02(4))
-Publisher FASB
-URI https://asc.fasb.org/1943274/2147480566/210-10-S99-1
Reference 3: http://www.xbrl.org/2003/role/disclosureRef
-Topic 326
-SubTopic 20
-Name Accounting Standards Codification
-Section 45
-Paragraph 1
-Publisher FASB
-URI https://asc.fasb.org/1943274/2147479344/326-20-45-1
Reference 4: http://www.xbrl.org/2003/role/disclosureRef
-Topic 310
-SubTopic 10
-Name Accounting Standards Codification
-Section 50
-Paragraph 4
-Publisher FASB
-URI https://asc.fasb.org/1943274/2147481962/310-10-50-4
Reference 5: http://www.xbrl.org/2003/role/disclosureRef
-Topic 326
-SubTopic 20
-Name Accounting Standards Codification
-Section 50
-Paragraph 13
-Subparagraph (a)
-Publisher FASB
-URI https://asc.fasb.org/1943274/2147479319/326-20-50-13
Reference 6: http://www.xbrl.org/2003/role/disclosureRef
-Topic 326
-SubTopic 20
-Name Accounting Standards Codification
-Section 50
-Paragraph 13
-Subparagraph (f)
-Publisher FASB
-URI https://asc.fasb.org/1943274/2147479319/326-20-50-13
| Name: |
us-gaap_AllowanceForDoubtfulAccountsReceivable |
| Namespace Prefix: |
us-gaap_ |
| Data Type: |
xbrli:monetaryItemType |
| Balance Type: |
credit |
| Period Type: |
instant |
|
| X |
- DefinitionAmount, before allowance, of receivables classified as other, due within one year or the operating cycle, if longer. Reference 1: http://www.xbrl.org/2003/role/disclosureRef
-Topic 210
-SubTopic 10
-Name Accounting Standards Codification
-Section S99
-Paragraph 1
-Subparagraph (SX 210.5-02(3)(a)(4))
-Publisher FASB
-URI https://asc.fasb.org/1943274/2147480566/210-10-S99-1
| Name: |
us-gaap_OtherReceivablesGrossCurrent |
| Namespace Prefix: |
us-gaap_ |
| Data Type: |
xbrli:monetaryItemType |
| Balance Type: |
debit |
| Period Type: |
instant |
|
| X |
- References
+ Details
| Name: |
us-gaap_ReceivablesAbstract |
| Namespace Prefix: |
us-gaap_ |
| Data Type: |
xbrli:stringItemType |
| Balance Type: |
na |
| Period Type: |
duration |
|
v3.24.3
Inventories (Schedule Of Components Of Inventories) (Details) - USD ($)
$ in Thousands |
Sep. 30, 2024 |
Dec. 31, 2023 |
| Inventory, Net [Abstract] |
|
|
| Finished goods |
$ 31,782
|
$ 29,821
|
| Work-in-process |
8,332
|
7,830
|
| Raw materials |
23,497
|
21,939
|
| Stores, supplies and other |
24,447
|
22,447
|
| Inventories |
$ 88,058
|
$ 82,037
|
| X |
- DefinitionCarrying amount, net of valuation reserves and adjustments, as of the balance sheet date of merchandise or goods held by the company that are readily available for sale. Reference 1: http://fasb.org/us-gaap/role/ref/legacyRef
-Topic 330
-SubTopic 10
-Name Accounting Standards Codification
-Section S99
-Paragraph 2
-Subparagraph (SAB Topic 5.BB)
-Publisher FASB
-URI https://asc.fasb.org/1943274/2147480581/330-10-S99-2
Reference 2: http://www.xbrl.org/2003/role/exampleRef
-Topic 210
-SubTopic 10
-Name Accounting Standards Codification
-Section S99
-Paragraph 1
-Subparagraph (SX 210.5-02(6)(a)(1))
-Publisher FASB
-URI https://asc.fasb.org/1943274/2147480566/210-10-S99-1
| Name: |
us-gaap_InventoryFinishedGoodsNetOfReserves |
| Namespace Prefix: |
us-gaap_ |
| Data Type: |
xbrli:monetaryItemType |
| Balance Type: |
debit |
| Period Type: |
instant |
|
| X |
- DefinitionAmount after valuation and LIFO reserves of inventory expected to be sold, or consumed within one year or operating cycle, if longer. Reference 1: http://www.xbrl.org/2003/role/exampleRef
-Topic 852
-SubTopic 10
-Name Accounting Standards Codification
-Section 55
-Paragraph 10
-Publisher FASB
-URI https://asc.fasb.org/1943274/2147481372/852-10-55-10
Reference 2: http://www.xbrl.org/2003/role/exampleRef
-Topic 210
-SubTopic 10
-Name Accounting Standards Codification
-Section 45
-Paragraph 1
-Subparagraph (b)
-Publisher FASB
-URI https://asc.fasb.org/1943274/2147483467/210-10-45-1
Reference 3: http://www.xbrl.org/2003/role/disclosureRef
-Topic 210
-SubTopic 10
-Name Accounting Standards Codification
-Section S99
-Paragraph 1
-Subparagraph (SX 210.5-02(6))
-Publisher FASB
-URI https://asc.fasb.org/1943274/2147480566/210-10-S99-1
| Name: |
us-gaap_InventoryNet |
| Namespace Prefix: |
us-gaap_ |
| Data Type: |
xbrli:monetaryItemType |
| Balance Type: |
debit |
| Period Type: |
instant |
|
| X |
- References
+ Details
| Name: |
us-gaap_InventoryNetAbstract |
| Namespace Prefix: |
us-gaap_ |
| Data Type: |
xbrli:stringItemType |
| Balance Type: |
na |
| Period Type: |
duration |
|
| X |
- DefinitionCarrying amount, net of valuation reserves and adjustments, as of the balance sheet date of unprocessed items to be consumed in the manufacturing or production process. Reference 1: http://fasb.org/us-gaap/role/ref/legacyRef
-Topic 330
-SubTopic 10
-Name Accounting Standards Codification
-Section S99
-Paragraph 2
-Subparagraph (SAB Topic 5.BB)
-Publisher FASB
-URI https://asc.fasb.org/1943274/2147480581/330-10-S99-2
Reference 2: http://www.xbrl.org/2003/role/exampleRef
-Topic 210
-SubTopic 10
-Name Accounting Standards Codification
-Section S99
-Paragraph 1
-Subparagraph (SX 210.5-02(6)(a)(4))
-Publisher FASB
-URI https://asc.fasb.org/1943274/2147480566/210-10-S99-1
| Name: |
us-gaap_InventoryRawMaterialsNetOfReserves |
| Namespace Prefix: |
us-gaap_ |
| Data Type: |
xbrli:monetaryItemType |
| Balance Type: |
debit |
| Period Type: |
instant |
|
| X |
- DefinitionCarrying amount, net of valuation reserves and adjustments, as of the balance sheet date of products used directly or indirectly in the manufacturing or production process, which may or may not become part of the final product. May also include items used in the storage, presentation or transportation of physical goods. Reference 1: http://fasb.org/us-gaap/role/ref/legacyRef
-Topic 330
-SubTopic 10
-Name Accounting Standards Codification
-Section S99
-Paragraph 2
-Subparagraph (SAB Topic 5.BB)
-Publisher FASB
-URI https://asc.fasb.org/1943274/2147480581/330-10-S99-2
Reference 2: http://www.xbrl.org/2003/role/exampleRef
-Topic 210
-SubTopic 10
-Name Accounting Standards Codification
-Section S99
-Paragraph 1
-Subparagraph (SX 210.5-02(6)(a)(5))
-Publisher FASB
-URI https://asc.fasb.org/1943274/2147480566/210-10-S99-1
| Name: |
us-gaap_InventorySuppliesNetOfReserves |
| Namespace Prefix: |
us-gaap_ |
| Data Type: |
xbrli:monetaryItemType |
| Balance Type: |
debit |
| Period Type: |
instant |
|
| X |
- DefinitionAmount before valuation and LIFO reserves of merchandise or goods in the production process expected to be completed within one year or operating cycle, if longer. Reference 1: http://www.xbrl.org/2009/role/commonPracticeRef
-Topic 210
-SubTopic 10
-Name Accounting Standards Codification
-Section S99
-Paragraph 1
-Subparagraph (SX 210.5-02(6)(a)(3))
-Publisher FASB
-URI https://asc.fasb.org/1943274/2147480566/210-10-S99-1
| Name: |
us-gaap_InventoryWorkInProcess |
| Namespace Prefix: |
us-gaap_ |
| Data Type: |
xbrli:monetaryItemType |
| Balance Type: |
debit |
| Period Type: |
instant |
|
v3.24.3
Pension And Other Post-Retirement Benefits (Narrative) (Details) - USD ($)
$ in Thousands |
3 Months Ended |
9 Months Ended |
12 Months Ended |
Sep. 30, 2024 |
Sep. 30, 2023 |
Sep. 30, 2024 |
Sep. 30, 2023 |
Dec. 31, 2023 |
| Defined Benefit Plan Disclosure [Line Items] |
|
|
|
|
|
| Defined Benefit Plan, Amounts for Asset (Liability) Recognized in Statement of Financial Position |
$ 7,100
|
|
$ 7,100
|
|
$ 7,300
|
| Pension settlement loss |
0
|
$ 25,612
|
0
|
$ 25,612
|
$ 92,300
|
| Pension lump sum distribution |
|
64,500
|
|
64,500
|
|
| Other Post-Retirement Benefits |
|
|
|
|
|
| Defined Benefit Plan Disclosure [Line Items] |
|
|
|
|
|
| Expected required contributions |
|
|
400
|
|
|
| Pension settlement loss |
0
|
0
|
0
|
0
|
|
| Pension Benefits |
|
|
|
|
|
| Defined Benefit Plan Disclosure [Line Items] |
|
|
|
|
|
| Pension settlement loss |
0
|
$ 25,612
|
0
|
$ 25,612
|
|
| Accrued Expenses [Member] |
|
|
|
|
|
| Defined Benefit Plan Disclosure [Line Items] |
|
|
|
|
|
| Liability, Defined Benefit Plan, Current |
$ 700
|
|
$ 700
|
|
|
| X |
- DefinitionDefined benefit plan estimated required future employer contributions in current fiscal year.
| Name: |
tg_DefinedBenefitPlanEstimatedRequiredFutureEmployerContributionsInCurrentFiscalYear |
| Namespace Prefix: |
tg_ |
| Data Type: |
xbrli:monetaryItemType |
| Balance Type: |
debit |
| Period Type: |
duration |
|
| X |
- DefinitionPension lump sum distribution
| Name: |
tg_PensionLumpSumDistribution |
| Namespace Prefix: |
tg_ |
| Data Type: |
xbrli:monetaryItemType |
| Balance Type: |
debit |
| Period Type: |
instant |
|
| X |
- DefinitionPre-tax Actuarial Loss for Pension Settlement
| Name: |
tg_PreTaxActuarialLossForPensionSettlement |
| Namespace Prefix: |
tg_ |
| Data Type: |
xbrli:monetaryItemType |
| Balance Type: |
debit |
| Period Type: |
duration |
|
| X |
- DefinitionAmount of asset (liability), recognized in statement of financial position, for defined benefit pension and other postretirement plans. Reference 1: http://fasb.org/us-gaap/role/ref/legacyRef
-Name Accounting Standards Codification
-Topic 715
-SubTopic 20
-Section 45
-Paragraph 2
-Publisher FASB
-URI https://asc.fasb.org/1943274/2147480535/715-20-45-2
Reference 2: http://fasb.org/us-gaap/role/ref/legacyRef
-Name Accounting Standards Codification
-Topic 715
-SubTopic 20
-Section 50
-Paragraph 1
-Subparagraph (c)
-Publisher FASB
-URI https://asc.fasb.org/1943274/2147480506/715-20-50-1
| Name: |
us-gaap_DefinedBenefitPlanAmountsRecognizedInBalanceSheet |
| Namespace Prefix: |
us-gaap_ |
| Data Type: |
xbrli:monetaryItemType |
| Balance Type: |
debit |
| Period Type: |
instant |
|
| X |
- DefinitionLine items represent financial concepts included in a table. These concepts are used to disclose reportable information associated with domain members defined in one or many axes to the table.
| Name: |
us-gaap_DefinedBenefitPlanDisclosureLineItems |
| Namespace Prefix: |
us-gaap_ |
| Data Type: |
xbrli:stringItemType |
| Balance Type: |
na |
| Period Type: |
duration |
|
| X |
- DefinitionAmount of liability, recognized in statement of financial position, for defined benefit pension and other postretirement plans, classified as current. Reference 1: http://fasb.org/us-gaap/role/ref/legacyRef
-Topic 210
-SubTopic 10
-Name Accounting Standards Codification
-Section S99
-Paragraph 1
-Subparagraph (SX 210.5-02(20))
-Publisher FASB
-URI https://asc.fasb.org/1943274/2147480566/210-10-S99-1
Reference 2: http://www.xbrl.org/2003/role/exampleRef
-Topic 715
-SubTopic 20
-Name Accounting Standards Codification
-Section 55
-Paragraph 17
-Publisher FASB
-URI https://asc.fasb.org/1943274/2147480482/715-20-55-17
Reference 3: http://www.xbrl.org/2003/role/disclosureRef
-Topic 715
-SubTopic 20
-Name Accounting Standards Codification
-Section 45
-Paragraph 2
-Publisher FASB
-URI https://asc.fasb.org/1943274/2147480535/715-20-45-2
Reference 4: http://www.xbrl.org/2003/role/disclosureRef
-Topic 715
-SubTopic 20
-Name Accounting Standards Codification
-Section 45
-Paragraph 3
-Publisher FASB
-URI https://asc.fasb.org/1943274/2147480535/715-20-45-3
Reference 5: http://www.xbrl.org/2003/role/disclosureRef
-Topic 715
-SubTopic 20
-Name Accounting Standards Codification
-Section 50
-Paragraph 1
-Subparagraph (c)
-Publisher FASB
-URI https://asc.fasb.org/1943274/2147480506/715-20-50-1
| Name: |
us-gaap_PensionAndOtherPostretirementDefinedBenefitPlansCurrentLiabilities |
| Namespace Prefix: |
us-gaap_ |
| Data Type: |
xbrli:monetaryItemType |
| Balance Type: |
credit |
| Period Type: |
instant |
|
| X |
- Details
| Name: |
us-gaap_RetirementPlanTypeAxis=us-gaap_OtherPostretirementBenefitPlansDefinedBenefitMember |
| Namespace Prefix: |
|
| Data Type: |
na |
| Balance Type: |
|
| Period Type: |
|
|
| X |
- Details
| Name: |
us-gaap_RetirementPlanTypeAxis=us-gaap_PensionPlansDefinedBenefitMember |
| Namespace Prefix: |
|
| Data Type: |
na |
| Balance Type: |
|
| Period Type: |
|
|
| X |
- Details
| Name: |
us-gaap_BalanceSheetLocationAxis=tg_AccruedExpensesMember |
| Namespace Prefix: |
|
| Data Type: |
na |
| Balance Type: |
|
| Period Type: |
|
|
v3.24.3
Pension And Other Post-Retirement Benefits (Schedule Of Components Of Net Periodic Benefit Cost For Pension And Other Post-Retirement Benefit Programs) (Details) - USD ($)
$ in Thousands |
3 Months Ended |
9 Months Ended |
12 Months Ended |
Sep. 30, 2024 |
Sep. 30, 2023 |
Sep. 30, 2024 |
Sep. 30, 2023 |
Dec. 31, 2023 |
| Defined Benefit Plan Disclosure [Line Items] |
|
|
|
|
|
| Pension settlement loss |
$ 0
|
$ 25,612
|
$ 0
|
$ 25,612
|
$ 92,300
|
| Pension Benefits |
|
|
|
|
|
| Defined Benefit Plan Disclosure [Line Items] |
|
|
|
|
|
| Service cost |
0
|
0
|
0
|
0
|
|
| Interest cost |
20
|
2,786
|
57
|
8,842
|
|
| Expected return on plan assets |
0
|
(2,328)
|
0
|
(7,542)
|
|
| Pension settlement loss |
0
|
25,612
|
0
|
25,612
|
|
| Amortization of prior service costs, (gains) losses and net transition asset |
3
|
2,644
|
15
|
8,609
|
|
| Net periodic benefit cost |
23
|
28,714
|
72
|
35,521
|
|
| Other Post-Retirement Benefits |
|
|
|
|
|
| Defined Benefit Plan Disclosure [Line Items] |
|
|
|
|
|
| Service cost |
3
|
3
|
8
|
9
|
|
| Interest cost |
65
|
71
|
203
|
213
|
|
| Expected return on plan assets |
0
|
0
|
0
|
0
|
|
| Pension settlement loss |
0
|
0
|
0
|
0
|
|
| Amortization of prior service costs, (gains) losses and net transition asset |
(37)
|
(58)
|
(120)
|
(176)
|
|
| Net periodic benefit cost |
$ 31
|
$ 16
|
$ 91
|
$ 46
|
|
| X |
- DefinitionAmortization Of Prior Service Costs And Net Gains Loss
| Name: |
tg_AmortizationOfPriorServiceCostsAndNetGainsLoss |
| Namespace Prefix: |
tg_ |
| Data Type: |
xbrli:monetaryItemType |
| Balance Type: |
credit |
| Period Type: |
duration |
|
| X |
- DefinitionPre-tax Actuarial Loss for Pension Settlement
| Name: |
tg_PreTaxActuarialLossForPensionSettlement |
| Namespace Prefix: |
tg_ |
| Data Type: |
xbrli:monetaryItemType |
| Balance Type: |
debit |
| Period Type: |
duration |
|
| X |
- DefinitionLine items represent financial concepts included in a table. These concepts are used to disclose reportable information associated with domain members defined in one or many axes to the table.
| Name: |
us-gaap_DefinedBenefitPlanDisclosureLineItems |
| Namespace Prefix: |
us-gaap_ |
| Data Type: |
xbrli:stringItemType |
| Balance Type: |
na |
| Period Type: |
duration |
|
| X |
- DefinitionAmount of expected return (loss) recognized in net periodic benefit (cost) credit, calculated based on expected long-term rate of return and market-related value of plan assets of defined benefit plan. Reference 1: http://www.xbrl.org/2003/role/exampleRef
-Topic 715
-SubTopic 20
-Name Accounting Standards Codification
-Section 55
-Paragraph 17
-Publisher FASB
-URI https://asc.fasb.org/1943274/2147480482/715-20-55-17
Reference 2: http://www.xbrl.org/2003/role/disclosureRef
-Topic 715
-SubTopic 20
-Name Accounting Standards Codification
-Section 45
-Paragraph 3A
-Subparagraph (b)
-Publisher FASB
-URI https://asc.fasb.org/1943274/2147480535/715-20-45-3A
Reference 3: http://www.xbrl.org/2003/role/exampleRef
-Topic 715
-SubTopic 20
-Name Accounting Standards Codification
-Section 55
-Paragraph 18
-Publisher FASB
-URI https://asc.fasb.org/1943274/2147480482/715-20-55-18
Reference 4: http://www.xbrl.org/2003/role/disclosureRef
-Topic 715
-SubTopic 20
-Name Accounting Standards Codification
-Section 50
-Paragraph 1
-Subparagraph (h)(3)
-Publisher FASB
-URI https://asc.fasb.org/1943274/2147480506/715-20-50-1
Reference 5: http://www.xbrl.org/2003/role/disclosureRef
-Topic 715
-SubTopic 20
-Name Accounting Standards Codification
-Section 50
-Paragraph 6
-Subparagraph (a)(3)
-Publisher FASB
-URI https://asc.fasb.org/1943274/2147480506/715-20-50-6
| Name: |
us-gaap_DefinedBenefitPlanExpectedReturnOnPlanAssets |
| Namespace Prefix: |
us-gaap_ |
| Data Type: |
xbrli:monetaryItemType |
| Balance Type: |
credit |
| Period Type: |
duration |
|
| X |
- DefinitionAmount of cost recognized for passage of time related to defined benefit plan. Reference 1: http://www.xbrl.org/2003/role/exampleRef
-Topic 715
-SubTopic 20
-Name Accounting Standards Codification
-Section 55
-Paragraph 17
-Publisher FASB
-URI https://asc.fasb.org/1943274/2147480482/715-20-55-17
Reference 2: http://www.xbrl.org/2003/role/disclosureRef
-Topic 715
-SubTopic 20
-Name Accounting Standards Codification
-Section 45
-Paragraph 3A
-Subparagraph (b)
-Publisher FASB
-URI https://asc.fasb.org/1943274/2147480535/715-20-45-3A
Reference 3: http://www.xbrl.org/2003/role/exampleRef
-Topic 715
-SubTopic 20
-Name Accounting Standards Codification
-Section 55
-Paragraph 18
-Publisher FASB
-URI https://asc.fasb.org/1943274/2147480482/715-20-55-18
Reference 4: http://www.xbrl.org/2003/role/disclosureRef
-Topic 715
-SubTopic 20
-Name Accounting Standards Codification
-Section 50
-Paragraph 1
-Subparagraph (a)(2)
-Publisher FASB
-URI https://asc.fasb.org/1943274/2147480506/715-20-50-1
Reference 5: http://www.xbrl.org/2003/role/disclosureRef
-Topic 715
-SubTopic 20
-Name Accounting Standards Codification
-Section 50
-Paragraph 1
-Subparagraph (h)(2)
-Publisher FASB
-URI https://asc.fasb.org/1943274/2147480506/715-20-50-1
Reference 6: http://www.xbrl.org/2003/role/disclosureRef
-Topic 715
-SubTopic 20
-Name Accounting Standards Codification
-Section 50
-Paragraph 6
-Subparagraph (a)(2)
-Publisher FASB
-URI https://asc.fasb.org/1943274/2147480506/715-20-50-6
| Name: |
us-gaap_DefinedBenefitPlanInterestCost |
| Namespace Prefix: |
us-gaap_ |
| Data Type: |
xbrli:monetaryItemType |
| Balance Type: |
debit |
| Period Type: |
duration |
|
| X |
- DefinitionAmount of net periodic benefit cost (credit) for defined benefit plan. Reference 1: http://www.xbrl.org/2003/role/exampleRef
-Topic 715
-SubTopic 20
-Name Accounting Standards Codification
-Section 55
-Paragraph 17
-Publisher FASB
-URI https://asc.fasb.org/1943274/2147480482/715-20-55-17
Reference 2: http://www.xbrl.org/2003/role/exampleRef
-Topic 715
-SubTopic 20
-Name Accounting Standards Codification
-Section 55
-Paragraph 18
-Publisher FASB
-URI https://asc.fasb.org/1943274/2147480482/715-20-55-18
Reference 3: http://www.xbrl.org/2003/role/disclosureRef
-Topic 715
-SubTopic 20
-Name Accounting Standards Codification
-Section 50
-Paragraph 1
-Subparagraph (h)
-Publisher FASB
-URI https://asc.fasb.org/1943274/2147480506/715-20-50-1
Reference 4: http://www.xbrl.org/2003/role/disclosureRef
-Topic 715
-SubTopic 20
-Name Accounting Standards Codification
-Section 50
-Paragraph 6
-Subparagraph (a)
-Publisher FASB
-URI https://asc.fasb.org/1943274/2147480506/715-20-50-6
| Name: |
us-gaap_DefinedBenefitPlanNetPeriodicBenefitCost |
| Namespace Prefix: |
us-gaap_ |
| Data Type: |
xbrli:monetaryItemType |
| Balance Type: |
debit |
| Period Type: |
duration |
|
| X |
- DefinitionAmount of cost for actuarial present value of benefits attributed to service rendered by employee for defined benefit plan. Reference 1: http://www.xbrl.org/2003/role/exampleRef
-Topic 715
-SubTopic 20
-Name Accounting Standards Codification
-Section 55
-Paragraph 17
-Publisher FASB
-URI https://asc.fasb.org/1943274/2147480482/715-20-55-17
Reference 2: http://www.xbrl.org/2003/role/exampleRef
-Topic 715
-SubTopic 20
-Name Accounting Standards Codification
-Section 55
-Paragraph 18
-Publisher FASB
-URI https://asc.fasb.org/1943274/2147480482/715-20-55-18
Reference 3: http://www.xbrl.org/2003/role/disclosureRef
-Topic 715
-SubTopic 20
-Name Accounting Standards Codification
-Section 50
-Paragraph 1
-Subparagraph (a)(1)
-Publisher FASB
-URI https://asc.fasb.org/1943274/2147480506/715-20-50-1
Reference 4: http://www.xbrl.org/2003/role/disclosureRef
-Topic 715
-SubTopic 20
-Name Accounting Standards Codification
-Section 50
-Paragraph 1
-Subparagraph (h)(1)
-Publisher FASB
-URI https://asc.fasb.org/1943274/2147480506/715-20-50-1
Reference 5: http://www.xbrl.org/2003/role/disclosureRef
-Topic 715
-SubTopic 20
-Name Accounting Standards Codification
-Section 50
-Paragraph 6
-Subparagraph (a)(1)
-Publisher FASB
-URI https://asc.fasb.org/1943274/2147480506/715-20-50-6
| Name: |
us-gaap_DefinedBenefitPlanServiceCost |
| Namespace Prefix: |
us-gaap_ |
| Data Type: |
xbrli:monetaryItemType |
| Balance Type: |
debit |
| Period Type: |
duration |
|
| X |
- Details
| Name: |
us-gaap_RetirementPlanTypeAxis=us-gaap_PensionPlansDefinedBenefitMember |
| Namespace Prefix: |
|
| Data Type: |
na |
| Balance Type: |
|
| Period Type: |
|
|
| X |
- Details
| Name: |
us-gaap_RetirementPlanTypeAxis=us-gaap_OtherPostretirementBenefitPlansDefinedBenefitMember |
| Namespace Prefix: |
|
| Data Type: |
na |
| Balance Type: |
|
| Period Type: |
|
|
v3.24.3
Earnings Per Share (Narrative) (Details) - shares
|
3 Months Ended |
9 Months Ended |
Sep. 30, 2024 |
Sep. 30, 2023 |
Sep. 30, 2024 |
Sep. 30, 2023 |
| Earnings Per Share [Abstract] |
|
|
|
|
| Antidilutive Securities Excluded from Computation of Earnings Per Share, Amount |
2,353,905
|
3,019,333
|
2,550,542
|
2,893,677
|
| X |
- DefinitionSecurities (including those issuable pursuant to contingent stock agreements) that could potentially dilute basic earnings per share (EPS) or earnings per unit (EPU) in the future that were not included in the computation of diluted EPS or EPU because to do so would increase EPS or EPU amounts or decrease loss per share or unit amounts for the period presented. Reference 1: http://www.xbrl.org/2003/role/disclosureRef
-Topic 260
-SubTopic 10
-Name Accounting Standards Codification
-Section 50
-Paragraph 1
-Subparagraph (c)
-Publisher FASB
-URI https://asc.fasb.org/1943274/2147482662/260-10-50-1
| Name: |
us-gaap_AntidilutiveSecuritiesExcludedFromComputationOfEarningsPerShareAmount |
| Namespace Prefix: |
us-gaap_ |
| Data Type: |
xbrli:sharesItemType |
| Balance Type: |
na |
| Period Type: |
duration |
|
| X |
- References
+ Details
| Name: |
us-gaap_EarningsPerShareAbstract |
| Namespace Prefix: |
us-gaap_ |
| Data Type: |
xbrli:stringItemType |
| Balance Type: |
na |
| Period Type: |
duration |
|
v3.24.3
Earnings Per Share (Schedule Of Calculation Of Numerator And Denominator In Earnings Per Share) (Details) - shares
shares in Thousands |
3 Months Ended |
9 Months Ended |
Sep. 30, 2024 |
Sep. 30, 2023 |
Sep. 30, 2024 |
Sep. 30, 2023 |
| Earnings Per Share [Abstract] |
|
|
|
|
| Weighted average shares outstanding used to compute basic earnings per share |
34,391
|
34,264
|
34,364
|
34,081
|
| Incremental dilutive shares attributable to stock options and restricted stock |
0
|
0
|
0
|
0
|
| Shares used to compute diluted earnings per share |
34,391
|
34,264
|
34,364
|
34,081
|
| X |
- References
+ Details
| Name: |
us-gaap_EarningsPerShareAbstract |
| Namespace Prefix: |
us-gaap_ |
| Data Type: |
xbrli:stringItemType |
| Balance Type: |
na |
| Period Type: |
duration |
|
| X |
- DefinitionAdditional shares included in the calculation of diluted EPS as a result of the potentially dilutive effect of share based payment arrangements using the treasury stock method. Reference 1: http://www.xbrl.org/2003/role/disclosureRef
-Topic 718
-SubTopic 10
-Name Accounting Standards Codification
-Section 45
-Paragraph 1
-Publisher FASB
-URI https://asc.fasb.org/1943274/2147480454/718-10-45-1
Reference 2: http://www.xbrl.org/2003/role/disclosureRef
-Topic 260
-SubTopic 10
-Name Accounting Standards Codification
-Section 50
-Paragraph 1
-Subparagraph (a)
-Publisher FASB
-URI https://asc.fasb.org/1943274/2147482662/260-10-50-1
Reference 3: http://www.xbrl.org/2003/role/disclosureRef
-Topic 260
-SubTopic 10
-Name Accounting Standards Codification
-Section 45
-Paragraph 22
-Publisher FASB
-URI https://asc.fasb.org/1943274/2147482689/260-10-45-22
Reference 4: http://www.xbrl.org/2003/role/disclosureRef
-Topic 260
-SubTopic 10
-Name Accounting Standards Codification
-Section 45
-Paragraph 23
-Subparagraph (c)
-Publisher FASB
-URI https://asc.fasb.org/1943274/2147482689/260-10-45-23
Reference 5: http://www.xbrl.org/2003/role/disclosureRef
-Topic 260
-SubTopic 10
-Name Accounting Standards Codification
-Section 45
-Paragraph 28A
-Publisher FASB
-URI https://asc.fasb.org/1943274/2147482689/260-10-45-28A
| Name: |
us-gaap_IncrementalCommonSharesAttributableToShareBasedPaymentArrangements |
| Namespace Prefix: |
us-gaap_ |
| Data Type: |
xbrli:sharesItemType |
| Balance Type: |
na |
| Period Type: |
duration |
|
| X |
- DefinitionThe average number of shares or units issued and outstanding that are used in calculating diluted EPS or earnings per unit (EPU), determined based on the timing of issuance of shares or units in the period. Reference 1: http://www.xbrl.org/2003/role/disclosureRef
-Topic 260
-SubTopic 10
-Name Accounting Standards Codification
-Section 50
-Paragraph 1
-Subparagraph (a)
-Publisher FASB
-URI https://asc.fasb.org/1943274/2147482662/260-10-50-1
Reference 2: http://www.xbrl.org/2003/role/disclosureRef
-Topic 260
-SubTopic 10
-Name Accounting Standards Codification
-Section 45
-Paragraph 16
-Publisher FASB
-URI https://asc.fasb.org/1943274/2147482689/260-10-45-16
| Name: |
us-gaap_WeightedAverageNumberOfDilutedSharesOutstanding |
| Namespace Prefix: |
us-gaap_ |
| Data Type: |
xbrli:sharesItemType |
| Balance Type: |
na |
| Period Type: |
duration |
|
| X |
- DefinitionNumber of [basic] shares or units, after adjustment for contingently issuable shares or units and other shares or units not deemed outstanding, determined by relating the portion of time within a reporting period that common shares or units have been outstanding to the total time in that period. Reference 1: http://www.xbrl.org/2003/role/disclosureRef
-Topic 260
-SubTopic 10
-Name Accounting Standards Codification
-Section 50
-Paragraph 1
-Subparagraph (a)
-Publisher FASB
-URI https://asc.fasb.org/1943274/2147482662/260-10-50-1
Reference 2: http://www.xbrl.org/2003/role/disclosureRef
-Topic 260
-SubTopic 10
-Name Accounting Standards Codification
-Section 45
-Paragraph 10
-Publisher FASB
-URI https://asc.fasb.org/1943274/2147482689/260-10-45-10
| Name: |
us-gaap_WeightedAverageNumberOfSharesOutstandingBasic |
| Namespace Prefix: |
us-gaap_ |
| Data Type: |
xbrli:sharesItemType |
| Balance Type: |
na |
| Period Type: |
duration |
|
v3.24.3
Accumulated Other Comprehensive Income (Loss) (Schedule Of Reclassifications Of Balances Out Of Accumulated Other Comprehensive Income (Loss) Into Net Income) (Details) - USD ($)
$ in Thousands |
3 Months Ended |
9 Months Ended |
Sep. 30, 2024 |
Sep. 30, 2023 |
Sep. 30, 2024 |
Sep. 30, 2023 |
| Reclassification Adjustment out of Accumulated Other Comprehensive Income [Line Items] |
|
|
|
|
| Beginning Balance |
$ 159,964
|
$ 183,149
|
$ 155,653
|
$ 201,762
|
| OCI, before Reclassifications, before Tax, Attributable to Parent |
1,762
|
936
|
(7,641)
|
9,857
|
| Other Comprehensive Income (Loss) before Reclassifications, Tax |
(45)
|
(222)
|
741
|
(2,868)
|
| OCI, before Reclassifications, Net of Tax, Attributable to Parent |
1,717
|
714
|
(6,900)
|
6,989
|
| Reclassification from AOCI, Current Period, before Tax, Attributable to Parent |
247
|
25,442
|
115
|
28,695
|
| Reclassification from AOCI, Current Period, Tax |
(72)
|
(5,483)
|
21
|
(6,060)
|
| Reclassification from AOCI, Current Period, Net of Tax, Attributable to Parent |
175
|
19,959
|
136
|
22,635
|
| Other Comprehensive Income (Loss), Net of Tax, Portion Attributable to Parent, Total |
1,892
|
20,673
|
(6,764)
|
29,624
|
| Ending Balance |
158,448
|
154,191
|
158,448
|
154,191
|
| AOCI Attributable to Parent [Member] |
|
|
|
|
| Reclassification Adjustment out of Accumulated Other Comprehensive Income [Line Items] |
|
|
|
|
| Beginning Balance |
(90,353)
|
(138,644)
|
(81,697)
|
(147,595)
|
| Ending Balance |
(88,461)
|
(117,971)
|
(88,461)
|
(117,971)
|
| Accumulated Foreign Currency Adjustment Attributable to Parent [Member] |
|
|
|
|
| Reclassification Adjustment out of Accumulated Other Comprehensive Income [Line Items] |
|
|
|
|
| Beginning Balance |
(90,273)
|
(83,338)
|
(83,037)
|
(86,079)
|
| OCI, before Reclassifications, before Tax, Attributable to Parent |
1,500
|
(1,793)
|
(6,206)
|
1,563
|
| Other Comprehensive Income (Loss) before Reclassifications, Tax |
(4)
|
(25)
|
466
|
(640)
|
| OCI, before Reclassifications, Net of Tax, Attributable to Parent |
1,496
|
(1,818)
|
(5,740)
|
923
|
| Reclassification from AOCI, Current Period, before Tax, Attributable to Parent |
0
|
0
|
0
|
0
|
| Reclassification from AOCI, Current Period, Tax |
0
|
0
|
0
|
0
|
| Reclassification from AOCI, Current Period, Net of Tax, Attributable to Parent |
0
|
0
|
0
|
0
|
| Other Comprehensive Income (Loss), Net of Tax, Portion Attributable to Parent, Total |
1,496
|
(1,818)
|
(5,740)
|
923
|
| Ending Balance |
(88,777)
|
(85,156)
|
(88,777)
|
(85,156)
|
| Accumulated Gain (Loss), Net, Cash Flow Hedge, Parent [Member] |
|
|
|
|
| Reclassification Adjustment out of Accumulated Other Comprehensive Income [Line Items] |
|
|
|
|
| Beginning Balance |
(564)
|
(843)
|
801
|
(2,480)
|
| OCI, before Reclassifications, before Tax, Attributable to Parent |
262
|
2,287
|
(1,435)
|
7,852
|
| Other Comprehensive Income (Loss) before Reclassifications, Tax |
(41)
|
(197)
|
275
|
(2,228)
|
| OCI, before Reclassifications, Net of Tax, Attributable to Parent |
221
|
2,090
|
(1,160)
|
5,624
|
| Reclassification from AOCI, Current Period, before Tax, Attributable to Parent |
281
|
(2,756)
|
220
|
(5,350)
|
| Reclassification from AOCI, Current Period, Tax |
(79)
|
735
|
(2)
|
1,432
|
| Reclassification from AOCI, Current Period, Net of Tax, Attributable to Parent |
202
|
(2,021)
|
218
|
(3,918)
|
| Other Comprehensive Income (Loss), Net of Tax, Portion Attributable to Parent, Total |
423
|
69
|
(942)
|
1,706
|
| Ending Balance |
(141)
|
(774)
|
(141)
|
(774)
|
| Accumulated Defined Benefit Plans Adjustment Attributable to Parent [Member] |
|
|
|
|
| Reclassification Adjustment out of Accumulated Other Comprehensive Income [Line Items] |
|
|
|
|
| Beginning Balance |
484
|
(54,463)
|
539
|
(59,036)
|
| OCI, before Reclassifications, before Tax, Attributable to Parent |
0
|
442
|
0
|
442
|
| Other Comprehensive Income (Loss) before Reclassifications, Tax |
0
|
0
|
0
|
0
|
| OCI, before Reclassifications, Net of Tax, Attributable to Parent |
0
|
442
|
0
|
442
|
| Reclassification from AOCI, Current Period, before Tax, Attributable to Parent |
(34)
|
28,198
|
(105)
|
34,045
|
| Reclassification from AOCI, Current Period, Tax |
7
|
(6,218)
|
23
|
(7,492)
|
| Reclassification from AOCI, Current Period, Net of Tax, Attributable to Parent |
(27)
|
21,980
|
(82)
|
26,553
|
| Other Comprehensive Income (Loss), Net of Tax, Portion Attributable to Parent, Total |
(27)
|
22,422
|
(82)
|
26,995
|
| Ending Balance |
$ 457
|
$ (32,041)
|
$ 457
|
$ (32,041)
|
| X |
- DefinitionAmount before tax and reclassification adjustments of other comprehensive income (loss) attributable to parent. Reference 1: http://fasb.org/us-gaap/role/ref/legacyRef
-Name Accounting Standards Codification
-Topic 220
-SubTopic 10
-Section 45
-Paragraph 14A
-Publisher FASB
-URI https://asc.fasb.org/1943274/2147482790/220-10-45-14A
| Name: |
us-gaap_OciBeforeReclassificationsBeforeTaxAttributableToParent |
| Namespace Prefix: |
us-gaap_ |
| Data Type: |
xbrli:monetaryItemType |
| Balance Type: |
credit |
| Period Type: |
duration |
|
| X |
- DefinitionAmount after tax, before reclassification adjustments, of other comprehensive income (loss), attributable to parent. Reference 1: http://fasb.org/us-gaap/role/ref/legacyRef
-Name Accounting Standards Codification
-Topic 220
-SubTopic 10
-Section 45
-Paragraph 14A
-Publisher FASB
-URI https://asc.fasb.org/1943274/2147482790/220-10-45-14A
Reference 2: http://fasb.org/us-gaap/role/ref/legacyRef
-Name Accounting Standards Codification
-Section 55
-Paragraph 15
-SubTopic 10
-Topic 220
-Publisher FASB
-URI https://asc.fasb.org/1943274/2147482739/220-10-55-15
| Name: |
us-gaap_OciBeforeReclassificationsNetOfTaxAttributableToParent |
| Namespace Prefix: |
us-gaap_ |
| Data Type: |
xbrli:monetaryItemType |
| Balance Type: |
credit |
| Period Type: |
duration |
|
| X |
- DefinitionAmount of tax expense (benefit) allocated to other comprehensive income (loss) before reclassification adjustment from accumulated other comprehensive income (loss). Reference 1: http://fasb.org/us-gaap/role/ref/legacyRef
-Name Accounting Standards Codification
-Section 45
-Paragraph 12
-SubTopic 10
-Topic 220
-Publisher FASB
-URI https://asc.fasb.org/1943274/2147482790/220-10-45-12
Reference 2: http://www.xbrl.org/2003/role/disclosureRef
-Topic 220
-SubTopic 10
-Name Accounting Standards Codification
-Section 50
-Paragraph 4
-Publisher FASB
-URI https://asc.fasb.org/1943274/2147482765/220-10-50-4
Reference 3: http://www.xbrl.org/2003/role/disclosureRef
-Topic 944
-SubTopic 220
-Name Accounting Standards Codification
-Section S99
-Paragraph 1
-Subparagraph (SX 210.7-04(19))
-Publisher FASB
-URI https://asc.fasb.org/1943274/2147477250/944-220-S99-1
| Name: |
us-gaap_OtherComprehensiveIncomeLossBeforeReclassificationsTax |
| Namespace Prefix: |
us-gaap_ |
| Data Type: |
xbrli:monetaryItemType |
| Balance Type: |
debit |
| Period Type: |
duration |
|
| X |
- DefinitionAmount after tax of other comprehensive income (loss) attributable to parent entity. Reference 1: http://fasb.org/us-gaap/role/ref/legacyRef
-Topic 810
-SubTopic 10
-Name Accounting Standards Codification
-Section 45
-Paragraph 19
-Publisher FASB
-URI https://asc.fasb.org/1943274/2147481231/810-10-45-19
Reference 2: http://fasb.org/us-gaap/role/ref/legacyRef
-Name Accounting Standards Codification
-Section 45
-Paragraph 20
-SubTopic 10
-Topic 810
-Publisher FASB
-URI https://asc.fasb.org/1943274/2147481231/810-10-45-20
Reference 3: http://fasb.org/us-gaap/role/ref/legacyRef
-Name Accounting Standards Codification
-Section 50
-Paragraph 1A
-Subparagraph (c)(3)
-SubTopic 10
-Topic 810
-Publisher FASB
-URI https://asc.fasb.org/1943274/2147481203/810-10-50-1A
Reference 4: http://www.xbrl.org/2003/role/disclosureRef
-Topic 250
-SubTopic 10
-Name Accounting Standards Codification
-Section 50
-Paragraph 6
-Publisher FASB
-URI https://asc.fasb.org/1943274/2147483443/250-10-50-6
Reference 5: http://www.xbrl.org/2003/role/disclosureRef
-Topic 220
-SubTopic 10
-Name Accounting Standards Codification
-Section 45
-Paragraph 1B
-Subparagraph (b)
-Publisher FASB
-URI https://asc.fasb.org/1943274/2147482790/220-10-45-1B
Reference 6: http://www.xbrl.org/2003/role/disclosureRef
-Topic 220
-SubTopic 10
-Name Accounting Standards Codification
-Section 45
-Paragraph 1A
-Subparagraph (b)
-Publisher FASB
-URI https://asc.fasb.org/1943274/2147482790/220-10-45-1A
| Name: |
us-gaap_OtherComprehensiveIncomeLossNetOfTaxPortionAttributableToParent |
| Namespace Prefix: |
us-gaap_ |
| Data Type: |
xbrli:monetaryItemType |
| Balance Type: |
credit |
| Period Type: |
duration |
|
| X |
- DefinitionLine items represent financial concepts included in a table. These concepts are used to disclose reportable information associated with domain members defined in one or many axes to the table. Reference 1: http://www.xbrl.org/2003/role/disclosureRef
-Topic 220
-SubTopic 10
-Name Accounting Standards Codification
-Section 50
-Paragraph 6
-Publisher FASB
-URI https://asc.fasb.org/1943274/2147482765/220-10-50-6
| Name: |
us-gaap_ReclassificationAdjustmentOutOfAccumulatedOtherComprehensiveIncomeLineItems |
| Namespace Prefix: |
us-gaap_ |
| Data Type: |
xbrli:stringItemType |
| Balance Type: |
na |
| Period Type: |
duration |
|
| X |
- DefinitionAmount before tax of reclassification adjustments of other comprehensive income (loss) attributable to parent. Reference 1: http://fasb.org/us-gaap/role/ref/legacyRef
-Name Accounting Standards Codification
-Topic 220
-SubTopic 10
-Section 45
-Paragraph 14A
-Publisher FASB
-URI https://asc.fasb.org/1943274/2147482790/220-10-45-14A
| Name: |
us-gaap_ReclassificationFromAociCurrentPeriodBeforeTaxAttributableToParent |
| Namespace Prefix: |
us-gaap_ |
| Data Type: |
xbrli:monetaryItemType |
| Balance Type: |
debit |
| Period Type: |
duration |
|
| X |
- DefinitionAmount after tax of reclassification adjustments of other comprehensive income (loss) attributable to parent. Reference 1: http://fasb.org/us-gaap/role/ref/legacyRef
-Name Accounting Standards Codification
-Topic 220
-SubTopic 10
-Section 45
-Paragraph 14A
-Publisher FASB
-URI https://asc.fasb.org/1943274/2147482790/220-10-45-14A
Reference 2: http://fasb.org/us-gaap/role/ref/legacyRef
-Name Accounting Standards Codification
-Section 55
-Paragraph 15
-SubTopic 10
-Topic 220
-Publisher FASB
-URI https://asc.fasb.org/1943274/2147482739/220-10-55-15
| Name: |
us-gaap_ReclassificationFromAociCurrentPeriodNetOfTaxAttributableToParent |
| Namespace Prefix: |
us-gaap_ |
| Data Type: |
xbrli:monetaryItemType |
| Balance Type: |
debit |
| Period Type: |
duration |
|
| X |
- DefinitionAmount of tax expense (benefit) of reclassification adjustment from accumulated other comprehensive income (loss). Reference 1: http://fasb.org/us-gaap/role/ref/legacyRef
-Name Accounting Standards Codification
-Section 45
-Paragraph 12
-SubTopic 10
-Topic 220
-Publisher FASB
-URI https://asc.fasb.org/1943274/2147482790/220-10-45-12
Reference 2: http://www.xbrl.org/2003/role/disclosureRef
-Topic 220
-SubTopic 10
-Name Accounting Standards Codification
-Section 50
-Paragraph 4
-Publisher FASB
-URI https://asc.fasb.org/1943274/2147482765/220-10-50-4
Reference 3: http://www.xbrl.org/2003/role/disclosureRef
-Topic 944
-SubTopic 220
-Name Accounting Standards Codification
-Section S99
-Paragraph 1
-Subparagraph (SX 210.7-04(19))
-Publisher FASB
-URI https://asc.fasb.org/1943274/2147477250/944-220-S99-1
Reference 4: http://www.xbrl.org/2003/role/disclosureRef
-Topic 220
-SubTopic 10
-Name Accounting Standards Codification
-Section 45
-Paragraph 17A
-Publisher FASB
-URI https://asc.fasb.org/1943274/2147482790/220-10-45-17A
| Name: |
us-gaap_ReclassificationFromAociCurrentPeriodTax |
| Namespace Prefix: |
us-gaap_ |
| Data Type: |
xbrli:monetaryItemType |
| Balance Type: |
credit |
| Period Type: |
duration |
|
| X |
- DefinitionAmount of equity (deficit) attributable to parent. Excludes temporary equity and equity attributable to noncontrolling interest. Reference 1: http://fasb.org/us-gaap/role/ref/legacyRef
-Topic 210
-SubTopic 10
-Name Accounting Standards Codification
-Section S99
-Paragraph 1
-Subparagraph (SX 210.5-02(29))
-Publisher FASB
-URI https://asc.fasb.org/1943274/2147480566/210-10-S99-1
Reference 2: http://fasb.org/us-gaap/role/ref/legacyRef
-Topic 210
-SubTopic 10
-Name Accounting Standards Codification
-Section S99
-Paragraph 1
-Subparagraph (SX 210.5-02(30))
-Publisher FASB
-URI https://asc.fasb.org/1943274/2147480566/210-10-S99-1
Reference 3: http://fasb.org/us-gaap/role/ref/legacyRef
-Topic 210
-SubTopic 10
-Name Accounting Standards Codification
-Section S99
-Paragraph 1
-Subparagraph (SX 210.5-02(31))
-Publisher FASB
-URI https://asc.fasb.org/1943274/2147480566/210-10-S99-1
Reference 4: http://www.xbrl.org/2003/role/exampleRef
-Topic 852
-SubTopic 10
-Name Accounting Standards Codification
-Section 55
-Paragraph 10
-Publisher FASB
-URI https://asc.fasb.org/1943274/2147481372/852-10-55-10
Reference 5: http://www.xbrl.org/2003/role/exampleRef
-Topic 946
-SubTopic 830
-Name Accounting Standards Codification
-Section 55
-Paragraph 12
-Publisher FASB
-URI https://asc.fasb.org/1943274/2147479168/946-830-55-12
Reference 6: http://www.xbrl.org/2003/role/disclosureRef
-Topic 946
-SubTopic 210
-Name Accounting Standards Codification
-Section S99
-Paragraph 1
-Subparagraph (SX 210.6-04(19))
-Publisher FASB
-URI https://asc.fasb.org/1943274/2147479170/946-210-S99-1
Reference 7: http://www.xbrl.org/2003/role/disclosureRef
-Topic 946
-SubTopic 210
-Name Accounting Standards Codification
-Section S99
-Paragraph 2
-Subparagraph (SX 210.6-05(4))
-Publisher FASB
-URI https://asc.fasb.org/1943274/2147479170/946-210-S99-2
Reference 8: http://www.xbrl.org/2009/role/commonPracticeRef
-Topic 946
-SubTopic 220
-Name Accounting Standards Codification
-Section S99
-Paragraph 3
-Subparagraph (SX 210.6-09(4)(b))
-Publisher FASB
-URI https://asc.fasb.org/1943274/2147479134/946-220-S99-3
Reference 9: http://www.xbrl.org/2003/role/disclosureRef
-Topic 946
-SubTopic 220
-Name Accounting Standards Codification
-Section S99
-Paragraph 3
-Subparagraph (SX 210.6-09(6))
-Publisher FASB
-URI https://asc.fasb.org/1943274/2147479134/946-220-S99-3
Reference 10: http://www.xbrl.org/2003/role/disclosureRef
-Topic 946
-SubTopic 220
-Name Accounting Standards Codification
-Section S99
-Paragraph 3
-Subparagraph (SX 210.6-09(7))
-Publisher FASB
-URI https://asc.fasb.org/1943274/2147479134/946-220-S99-3
Reference 11: http://www.xbrl.org/2009/role/commonPracticeRef
-Topic 235
-SubTopic 10
-Name Accounting Standards Codification
-Section S99
-Paragraph 1
-Subparagraph (SX 210.4-08(g)(1)(ii))
-Publisher FASB
-URI https://asc.fasb.org/1943274/2147480678/235-10-S99-1
Reference 12: http://www.xbrl.org/2009/role/commonPracticeRef
-Topic 323
-SubTopic 10
-Name Accounting Standards Codification
-Section 50
-Paragraph 3
-Subparagraph (c)
-Publisher FASB
-URI https://asc.fasb.org/1943274/2147481687/323-10-50-3
Reference 13: http://www.xbrl.org/2009/role/commonPracticeRef
-Topic 825
-SubTopic 10
-Name Accounting Standards Codification
-Section 50
-Paragraph 28
-Subparagraph (f)
-Publisher FASB
-URI https://asc.fasb.org/1943274/2147482907/825-10-50-28
Reference 14: http://fasb.org/us-gaap/role/ref/legacyRef
-Topic 310
-SubTopic 10
-Name Accounting Standards Codification
-Section S99
-Paragraph 2
-Subparagraph (SAB Topic 4.E)
-Publisher FASB
-URI https://asc.fasb.org/1943274/2147480418/310-10-S99-2
| Name: |
us-gaap_StockholdersEquity |
| Namespace Prefix: |
us-gaap_ |
| Data Type: |
xbrli:monetaryItemType |
| Balance Type: |
credit |
| Period Type: |
instant |
|
| X |
- Details
| Name: |
us-gaap_StatementEquityComponentsAxis=us-gaap_AccumulatedOtherComprehensiveIncomeMember |
| Namespace Prefix: |
|
| Data Type: |
na |
| Balance Type: |
|
| Period Type: |
|
|
| X |
- Details
| Name: |
us-gaap_StatementEquityComponentsAxis=us-gaap_AccumulatedTranslationAdjustmentMember |
| Namespace Prefix: |
|
| Data Type: |
na |
| Balance Type: |
|
| Period Type: |
|
|
| X |
- Details
| Name: |
us-gaap_StatementEquityComponentsAxis=us-gaap_AccumulatedGainLossNetCashFlowHedgeParentMember |
| Namespace Prefix: |
|
| Data Type: |
na |
| Balance Type: |
|
| Period Type: |
|
|
| X |
- Details
| Name: |
us-gaap_StatementEquityComponentsAxis=us-gaap_AccumulatedDefinedBenefitPlansAdjustmentMember |
| Namespace Prefix: |
|
| Data Type: |
na |
| Balance Type: |
|
| Period Type: |
|
|
v3.24.3
Derivative Financial Instruments (Narrative) (Details)
R$ in Thousands, $ in Thousands, lbs in Millions |
9 Months Ended |
|
|
|
Sep. 30, 2024
USD ($)
lbs
|
Sep. 30, 2024
BRL (R$)
|
Sep. 30, 2024
BRL (R$)
lbs
|
Dec. 31, 2023
USD ($)
lbs
|
| Derivative [Line Items] |
|
|
|
|
| Cash Flow Hedge Gain (Loss) to be Reclassified within Twelve Months |
$ 100
|
|
|
|
| Aluminum Futures Contracts |
|
|
|
|
| Derivative [Line Items] |
|
|
|
|
| Derivative, Notional Amount |
$ 6,000
|
|
|
$ 7,700
|
| Commitment Under Cash Flow Hedges, Mass | lbs |
4.3
|
|
4.3
|
5.6
|
| Terphane Ltda [Member] |
|
|
|
|
| Derivative [Line Items] |
|
|
|
|
| Derivative, Notional Amount |
$ 5,489
|
|
R$ 29,861
|
|
| Terphane Ltda [Member] | Oct-2018 [Member] |
|
|
|
|
| Derivative [Line Items] |
|
|
|
|
| Annual Net Costs Mismatch Translation Exposure - Real vs US Dollar | R$ |
|
R$ 139,000
|
|
|
| X |
- DefinitionAnnual Net Costs Mismatch Translation Exposure - Real vs US Dollar
| Name: |
tg_AnnualNetCostsMismatchTranslationExposureRealvsUSDollar |
| Namespace Prefix: |
tg_ |
| Data Type: |
xbrli:monetaryItemType |
| Balance Type: |
debit |
| Period Type: |
duration |
|
| X |
- DefinitionCommitment Under Cash Flow Hedges, Mass
| Name: |
tg_CommitmentUnderCashFlowHedgesMass |
| Namespace Prefix: |
tg_ |
| Data Type: |
dtr-types1:weightItemType |
| Balance Type: |
na |
| Period Type: |
instant |
|
| X |
- DefinitionThe estimated net amount of existing gains or losses on cash flow hedges at the reporting date expected to be reclassified to earnings within the next 12 months. Reference 1: http://fasb.org/us-gaap/role/ref/legacyRef
-Name Accounting Standards Codification
-Topic 815
-SubTopic 30
-Section 50
-Paragraph 1
-Subparagraph (c)
-Publisher FASB
-URI https://asc.fasb.org/1943274/2147480870/815-30-50-1
| Name: |
us-gaap_CashFlowHedgeGainLossToBeReclassifiedWithinTwelveMonths |
| Namespace Prefix: |
us-gaap_ |
| Data Type: |
xbrli:monetaryItemType |
| Balance Type: |
credit |
| Period Type: |
duration |
|
| X |
- DefinitionLine items represent financial concepts included in a table. These concepts are used to disclose reportable information associated with domain members defined in one or many axes to the table. Reference 1: http://www.xbrl.org/2003/role/disclosureRef
-Topic 815
-SubTopic 40
-Name Accounting Standards Codification
-Section 50
-Paragraph 5
-Subparagraph (f)
-Publisher FASB
-URI https://asc.fasb.org/1943274/2147480237/815-40-50-5
| Name: |
us-gaap_DerivativeLineItems |
| Namespace Prefix: |
us-gaap_ |
| Data Type: |
xbrli:stringItemType |
| Balance Type: |
na |
| Period Type: |
duration |
|
| X |
- DefinitionNominal or face amount used to calculate payment on derivative. Reference 1: http://www.xbrl.org/2009/role/commonPracticeRef
-Topic 815
-SubTopic 10
-Name Accounting Standards Codification
-Section 50
-Paragraph 1B
-Publisher FASB
-URI https://asc.fasb.org/1943274/2147480434/815-10-50-1B
Reference 2: http://www.xbrl.org/2009/role/commonPracticeRef
-Topic 815
-SubTopic 10
-Name Accounting Standards Codification
-Section 50
-Paragraph 1A
-Subparagraph (d)
-Publisher FASB
-URI https://asc.fasb.org/1943274/2147480434/815-10-50-1A
| Name: |
us-gaap_DerivativeNotionalAmount |
| Namespace Prefix: |
us-gaap_ |
| Data Type: |
xbrli:monetaryItemType |
| Balance Type: |
na |
| Period Type: |
instant |
|
| X |
- Details
| Name: |
us-gaap_DerivativeInstrumentRiskAxis=tg_AluminumFuturesContractsMember |
| Namespace Prefix: |
|
| Data Type: |
na |
| Balance Type: |
|
| Period Type: |
|
|
| X |
- Details
| Name: |
us-gaap_DerivativeInstrumentRiskAxis=tg_TerphaneLtdaMember |
| Namespace Prefix: |
|
| Data Type: |
na |
| Balance Type: |
|
| Period Type: |
|
|
| X |
- Details
| Name: |
tg_CashFlowHedgeMaturityDateAxis=tg_Oct2018Member |
| Namespace Prefix: |
|
| Data Type: |
na |
| Balance Type: |
|
| Period Type: |
|
|
v3.24.3
Derivative Financial Instruments (Summary Of Location And Fair Value Of Derivative Financial Instruments) (Details) - USD ($)
$ in Thousands |
Sep. 30, 2024 |
Dec. 31, 2023 |
| Derivatives, Fair Value [Line Items] |
|
|
| Derivative Assets (Liabilities), at Fair Value, Net |
$ (80)
|
$ 2,196
|
| Derivatives Designated As Hedging Instruments [Member] | Accrued Expenses [Member] |
|
|
| Derivatives, Fair Value [Line Items] |
|
|
| Liability derivatives: Fair Value |
(299)
|
0
|
| Derivatives Designated As Hedging Instruments [Member] | Other Noncurrent Assets |
|
|
| Derivatives, Fair Value [Line Items] |
|
|
| Derivative Asset, Fair Value, Gross Asset |
0
|
146
|
| Derivatives Designated As Hedging Instruments [Member] | Prepaid Expenses and Other Current Assets |
|
|
| Derivatives, Fair Value [Line Items] |
|
|
| Derivative Asset, Fair Value, Gross Asset |
219
|
2,050
|
| Derivatives Designated As Hedging Instruments [Member] | Aluminum Futures Contracts |
|
|
| Derivatives, Fair Value [Line Items] |
|
|
| Derivative Assets (Liabilities), at Fair Value, Net |
226
|
(492)
|
| Derivatives Designated As Hedging Instruments [Member] | Aluminum Futures Contracts | Accrued Expenses [Member] |
|
|
| Derivatives, Fair Value [Line Items] |
|
|
| Liability derivatives: Fair Value |
128
|
483
|
| Derivatives Designated As Hedging Instruments [Member] | Aluminum Futures Contracts | Other non-current liabilities |
|
|
| Derivatives, Fair Value [Line Items] |
|
|
| Liability derivatives: Fair Value |
0
|
9
|
| Derivatives Designated As Hedging Instruments [Member] | Aluminum Futures Contracts | Prepaid Expenses and Other Current Assets |
|
|
| Derivatives, Fair Value [Line Items] |
|
|
| Derivative Asset, Fair Value, Gross Asset |
$ 354
|
$ 0
|
| X |
- DefinitionFair values as of the balance sheet date of the net amount of all assets and liabilities resulting from contracts that meet the criteria of being accounted for as derivative instruments. Reference 1: http://fasb.org/us-gaap/role/ref/legacyRef
-Name Accounting Standards Codification
-Section 45
-Paragraph 5
-SubTopic 10
-Topic 815
-Publisher FASB
-URI https://asc.fasb.org/1943274/2147480463/815-10-45-5
Reference 2: http://www.xbrl.org/2009/role/commonPracticeRef
-Topic 820
-SubTopic 10
-Name Accounting Standards Codification
-Section 50
-Paragraph 2
-Subparagraph (bbb)(2)(i)
-Publisher FASB
-URI https://asc.fasb.org/1943274/2147482106/820-10-50-2
Reference 3: http://www.xbrl.org/2009/role/commonPracticeRef
-Topic 820
-SubTopic 10
-Name Accounting Standards Codification
-Section 50
-Paragraph 2
-Subparagraph (bbb)(2)
-Publisher FASB
-URI https://asc.fasb.org/1943274/2147482106/820-10-50-2
Reference 4: http://www.xbrl.org/2009/role/commonPracticeRef
-Topic 820
-SubTopic 10
-Name Accounting Standards Codification
-Section 50
-Paragraph 2
-Subparagraph (bbb)(1)
-Publisher FASB
-URI https://asc.fasb.org/1943274/2147482106/820-10-50-2
| Name: |
us-gaap_DerivativeAssetsLiabilitiesAtFairValueNet |
| Namespace Prefix: |
us-gaap_ |
| Data Type: |
xbrli:monetaryItemType |
| Balance Type: |
debit |
| Period Type: |
instant |
|
| X |
- DefinitionFair value, before effects of master netting arrangements, of a financial asset or other contract with one or more underlyings, notional amount or payment provision or both, and the contract can be net settled by means outside the contract or delivery of an asset. Includes assets elected not to be offset. Excludes assets not subject to a master netting arrangement. Reference 1: http://fasb.org/us-gaap/role/ref/legacyRef
-Topic 815
-SubTopic 10
-Name Accounting Standards Codification
-Section 50
-Paragraph 4B
-Subparagraph (c)
-Publisher FASB
-URI https://asc.fasb.org/1943274/2147480434/815-10-50-4B
Reference 2: http://fasb.org/us-gaap/role/ref/legacyRef
-Topic 815
-SubTopic 10
-Name Accounting Standards Codification
-Section 50
-Paragraph 4B
-Subparagraph (a)
-Publisher FASB
-URI https://asc.fasb.org/1943274/2147480434/815-10-50-4B
Reference 3: http://www.xbrl.org/2003/role/exampleRef
-Topic 210
-SubTopic 20
-Name Accounting Standards Codification
-Section 55
-Paragraph 22
-Publisher FASB
-URI https://asc.fasb.org/1943274/2147483444/210-20-55-22
Reference 4: http://www.xbrl.org/2003/role/disclosureRef
-Topic 210
-SubTopic 20
-Name Accounting Standards Codification
-Section 50
-Paragraph 3
-Subparagraph (a)
-Publisher FASB
-URI https://asc.fasb.org/1943274/2147483466/210-20-50-3
Reference 5: http://fasb.org/us-gaap/role/ref/legacyRef
-Topic 210
-SubTopic 20
-Name Accounting Standards Codification
-Section 55
-Paragraph 7
-Publisher FASB
-URI https://asc.fasb.org/1943274/2147483444/210-20-55-7
Reference 6: http://fasb.org/us-gaap/role/ref/legacyRef
-Name Accounting Standards Codification
-Section 50
-Paragraph 4D
-Subparagraph (c)(2)
-SubTopic 20
-Topic 860
-Publisher FASB
-URI https://asc.fasb.org/1943274/2147481326/860-20-50-4D
| Name: |
us-gaap_DerivativeFairValueOfDerivativeAsset |
| Namespace Prefix: |
us-gaap_ |
| Data Type: |
xbrli:monetaryItemType |
| Balance Type: |
debit |
| Period Type: |
instant |
|
| X |
- DefinitionFair value, before effects of master netting arrangements, of a financial liability or contract with one or more underlyings, notional amount or payment provision or both, and the contract can be net settled by means outside the contract or delivery of an asset. Includes liabilities elected not to be offset. Excludes liabilities not subject to a master netting arrangement. Reference 1: http://fasb.org/us-gaap/role/ref/legacyRef
-Topic 815
-SubTopic 10
-Name Accounting Standards Codification
-Section 50
-Paragraph 4B
-Subparagraph (c)
-Publisher FASB
-URI https://asc.fasb.org/1943274/2147480434/815-10-50-4B
Reference 2: http://fasb.org/us-gaap/role/ref/legacyRef
-Topic 815
-SubTopic 10
-Name Accounting Standards Codification
-Section 50
-Paragraph 4B
-Subparagraph (a)
-Publisher FASB
-URI https://asc.fasb.org/1943274/2147480434/815-10-50-4B
Reference 3: http://www.xbrl.org/2003/role/exampleRef
-Topic 210
-SubTopic 20
-Name Accounting Standards Codification
-Section 55
-Paragraph 22
-Publisher FASB
-URI https://asc.fasb.org/1943274/2147483444/210-20-55-22
Reference 4: http://www.xbrl.org/2003/role/disclosureRef
-Topic 210
-SubTopic 20
-Name Accounting Standards Codification
-Section 50
-Paragraph 3
-Subparagraph (a)
-Publisher FASB
-URI https://asc.fasb.org/1943274/2147483466/210-20-50-3
Reference 5: http://fasb.org/us-gaap/role/ref/legacyRef
-Topic 210
-SubTopic 20
-Name Accounting Standards Codification
-Section 55
-Paragraph 7
-Publisher FASB
-URI https://asc.fasb.org/1943274/2147483444/210-20-55-7
Reference 6: http://fasb.org/us-gaap/role/ref/legacyRef
-Name Accounting Standards Codification
-Section 50
-Paragraph 4D
-Subparagraph (c)(2)
-SubTopic 20
-Topic 860
-Publisher FASB
-URI https://asc.fasb.org/1943274/2147481326/860-20-50-4D
| Name: |
us-gaap_DerivativeFairValueOfDerivativeLiability |
| Namespace Prefix: |
us-gaap_ |
| Data Type: |
xbrli:monetaryItemType |
| Balance Type: |
credit |
| Period Type: |
instant |
|
| X |
- DefinitionLine items represent financial concepts included in a table. These concepts are used to disclose reportable information associated with domain members defined in one or many axes to the table.
| Name: |
us-gaap_DerivativesFairValueLineItems |
| Namespace Prefix: |
us-gaap_ |
| Data Type: |
xbrli:stringItemType |
| Balance Type: |
na |
| Period Type: |
duration |
|
| X |
- Details
| Name: |
us-gaap_HedgingDesignationAxis=us-gaap_DesignatedAsHedgingInstrumentMember |
| Namespace Prefix: |
|
| Data Type: |
na |
| Balance Type: |
|
| Period Type: |
|
|
| X |
- Details
| Name: |
us-gaap_BalanceSheetLocationAxis=tg_AccruedExpensesMember |
| Namespace Prefix: |
|
| Data Type: |
na |
| Balance Type: |
|
| Period Type: |
|
|
| X |
- Details
| Name: |
us-gaap_BalanceSheetLocationAxis=us-gaap_OtherNoncurrentAssetsMember |
| Namespace Prefix: |
|
| Data Type: |
na |
| Balance Type: |
|
| Period Type: |
|
|
| X |
- Details
| Name: |
us-gaap_BalanceSheetLocationAxis=us-gaap_PrepaidExpensesAndOtherCurrentAssetsMember |
| Namespace Prefix: |
|
| Data Type: |
na |
| Balance Type: |
|
| Period Type: |
|
|
| X |
- Details
| Name: |
us-gaap_DerivativeInstrumentRiskAxis=tg_AluminumFuturesContractsMember |
| Namespace Prefix: |
|
| Data Type: |
na |
| Balance Type: |
|
| Period Type: |
|
|
| X |
- Details
| Name: |
us-gaap_BalanceSheetLocationAxis=us-gaap_OtherNoncurrentLiabilitiesMember |
| Namespace Prefix: |
|
| Data Type: |
na |
| Balance Type: |
|
| Period Type: |
|
|
v3.24.3
Derivative Financial Instruments Terphane Future Cash Flow Hedges (Details) - Terphane Ltda [Member]
R$ in Thousands, $ in Thousands |
Sep. 30, 2024
USD ($)
|
Sep. 30, 2024
BRL (R$)
|
| Derivative [Line Items] |
|
|
| Derivative, Notional Amount |
$ 5,489
|
R$ 29,861
|
| Foreign Currency Exchange Rate, Translation |
5.4402
|
5.4402
|
| Percentage of Coverage Using Cash Flow Hedges |
85.00%
|
85.00%
|
| Oct-24 |
|
|
| Derivative [Line Items] |
|
|
| Derivative, Notional Amount |
$ 1,851
|
R$ 10,037
|
| Foreign Currency Exchange Rate, Translation |
5.4225
|
5.4225
|
| Percentage of Coverage Using Cash Flow Hedges |
87.00%
|
87.00%
|
| Nov-24 |
|
|
| Derivative [Line Items] |
|
|
| Derivative, Notional Amount |
$ 1,837
|
R$ 9,994
|
| Foreign Currency Exchange Rate, Translation |
5.4403
|
5.4403
|
| Percentage of Coverage Using Cash Flow Hedges |
86.00%
|
86.00%
|
| Dec-24 |
|
|
| Derivative [Line Items] |
|
|
| Derivative, Notional Amount |
$ 1,801
|
R$ 9,830
|
| Foreign Currency Exchange Rate, Translation |
5.4580
|
5.4580
|
| Percentage of Coverage Using Cash Flow Hedges |
85.00%
|
85.00%
|
| X |
- DefinitionPercentage of Coverage Using Cash Flow Hedges
| Name: |
tg_PercentageofCoverageUsingCashFlowHedges |
| Namespace Prefix: |
tg_ |
| Data Type: |
dtr-types1:percentItemType |
| Balance Type: |
na |
| Period Type: |
instant |
|
| X |
- DefinitionLine items represent financial concepts included in a table. These concepts are used to disclose reportable information associated with domain members defined in one or many axes to the table. Reference 1: http://www.xbrl.org/2003/role/disclosureRef
-Topic 815
-SubTopic 40
-Name Accounting Standards Codification
-Section 50
-Paragraph 5
-Subparagraph (f)
-Publisher FASB
-URI https://asc.fasb.org/1943274/2147480237/815-40-50-5
| Name: |
us-gaap_DerivativeLineItems |
| Namespace Prefix: |
us-gaap_ |
| Data Type: |
xbrli:stringItemType |
| Balance Type: |
na |
| Period Type: |
duration |
|
| X |
- DefinitionNominal or face amount used to calculate payment on derivative. Reference 1: http://www.xbrl.org/2009/role/commonPracticeRef
-Topic 815
-SubTopic 10
-Name Accounting Standards Codification
-Section 50
-Paragraph 1B
-Publisher FASB
-URI https://asc.fasb.org/1943274/2147480434/815-10-50-1B
Reference 2: http://www.xbrl.org/2009/role/commonPracticeRef
-Topic 815
-SubTopic 10
-Name Accounting Standards Codification
-Section 50
-Paragraph 1A
-Subparagraph (d)
-Publisher FASB
-URI https://asc.fasb.org/1943274/2147480434/815-10-50-1A
| Name: |
us-gaap_DerivativeNotionalAmount |
| Namespace Prefix: |
us-gaap_ |
| Data Type: |
xbrli:monetaryItemType |
| Balance Type: |
na |
| Period Type: |
instant |
|
| X |
- DefinitionForeign exchange rate used to translate amounts denominated in functional currency to reporting currency. Reference 1: http://www.xbrl.org/2003/role/disclosureRef
-Topic 830
-SubTopic 30
-Name Accounting Standards Codification
-Section 50
-Paragraph 2
-Publisher FASB
-URI https://asc.fasb.org/1943274/2147481674/830-30-50-2
Reference 2: http://www.xbrl.org/2003/role/disclosureRef
-Topic 830
-SubTopic 30
-Name Accounting Standards Codification
-Section S99
-Paragraph 1
-Publisher FASB
-URI https://asc.fasb.org/1943274/2147479424/830-30-S99-1
| Name: |
us-gaap_ForeignCurrencyExchangeRateTranslation1 |
| Namespace Prefix: |
us-gaap_ |
| Data Type: |
xbrli:pureItemType |
| Balance Type: |
na |
| Period Type: |
instant |
|
| X |
- Details
| Name: |
us-gaap_DerivativeInstrumentRiskAxis=tg_TerphaneLtdaMember |
| Namespace Prefix: |
|
| Data Type: |
na |
| Balance Type: |
|
| Period Type: |
|
|
| X |
- Details
| Name: |
tg_CashFlowHedgeMaturityDateAxis=tg_Oct24Member |
| Namespace Prefix: |
|
| Data Type: |
na |
| Balance Type: |
|
| Period Type: |
|
|
| X |
- Details
| Name: |
tg_CashFlowHedgeMaturityDateAxis=tg_Nov24Member |
| Namespace Prefix: |
|
| Data Type: |
na |
| Balance Type: |
|
| Period Type: |
|
|
| X |
- Details
| Name: |
tg_CashFlowHedgeMaturityDateAxis=tg_Dec24Member |
| Namespace Prefix: |
|
| Data Type: |
na |
| Balance Type: |
|
| Period Type: |
|
|
v3.24.3
Derivative Financial Instruments (Schedule Of Pretax Effect On Net Income (Loss) And Other Comprehensive Income (Loss) Of Derivative Instruments Classified As Cash Flow Hedges) (Details) - Cash Flow Hedging - USD ($)
$ in Thousands |
3 Months Ended |
9 Months Ended |
Sep. 30, 2024 |
Sep. 30, 2023 |
Sep. 30, 2024 |
Sep. 30, 2023 |
| Aluminum Futures Contracts | Cost of goods sold |
|
|
|
|
| Derivative Instruments, Gain (Loss) [Line Items] |
|
|
|
|
| Amount of pre-tax gain (loss) recognized in other comprehensive income (loss) |
$ 10
|
$ 2,908
|
$ 56
|
$ 4,867
|
| Amount of pre-tax gain (loss) reclassified from accumulated other comprehensive income (loss) to net income (effective portion) |
(153)
|
1,716
|
(662)
|
3,273
|
| Foreign Currency Forwards | Cost of goods sold |
|
|
|
|
| Derivative Instruments, Gain (Loss) [Line Items] |
|
|
|
|
| Amount of pre-tax gain (loss) recognized in other comprehensive income (loss) |
0
|
0
|
0
|
0
|
| Amount of pre-tax gain (loss) reclassified from accumulated other comprehensive income (loss) to net income (effective portion) |
16
|
16
|
46
|
46
|
| Foreign Currency Forwards | Selling, general & admin |
|
|
|
|
| Derivative Instruments, Gain (Loss) [Line Items] |
|
|
|
|
| Amount of pre-tax gain (loss) recognized in other comprehensive income (loss) |
252
|
(621)
|
(1,491)
|
2,985
|
| Amount of pre-tax gain (loss) reclassified from accumulated other comprehensive income (loss) to net income (effective portion) |
$ (144)
|
$ 1,024
|
$ 396
|
$ 2,031
|
| X |
- DefinitionLine items represent financial concepts included in a table. These concepts are used to disclose reportable information associated with domain members defined in one or many axes to the table. Reference 1: http://www.xbrl.org/2003/role/disclosureRef
-Topic 815
-SubTopic 10
-Name Accounting Standards Codification
-Section 50
-Paragraph 4E
-Publisher FASB
-URI https://asc.fasb.org/1943274/2147480434/815-10-50-4E
| Name: |
us-gaap_DerivativeInstrumentsGainLossLineItems |
| Namespace Prefix: |
us-gaap_ |
| Data Type: |
xbrli:stringItemType |
| Balance Type: |
na |
| Period Type: |
duration |
|
| X |
- DefinitionAmount, before tax and reclassification, of gain (loss) from derivative instrument designated and qualifying cash flow hedge included in assessment of hedge effectiveness. Reference 1: http://www.xbrl.org/2003/role/disclosureRef
-Topic 220
-SubTopic 10
-Name Accounting Standards Codification
-Section 45
-Paragraph 11
-Publisher FASB
-URI https://asc.fasb.org/1943274/2147482790/220-10-45-11
Reference 2: http://www.xbrl.org/2003/role/disclosureRef
-Topic 815
-SubTopic 10
-Name Accounting Standards Codification
-Section 50
-Paragraph 4C
-Subparagraph (b)
-Publisher FASB
-URI https://asc.fasb.org/1943274/2147480434/815-10-50-4C
Reference 3: http://www.xbrl.org/2003/role/disclosureRef
-Topic 815
-SubTopic 20
-Name Accounting Standards Codification
-Section 45
-Paragraph 3
-Publisher FASB
-URI https://asc.fasb.org/1943274/2147480627/815-20-45-3
Reference 4: http://www.xbrl.org/2003/role/disclosureRef
-Topic 815
-SubTopic 10
-Name Accounting Standards Codification
-Section 50
-Paragraph 4A
-Subparagraph (b)(2)
-Publisher FASB
-URI https://asc.fasb.org/1943274/2147480434/815-10-50-4A
Reference 5: http://www.xbrl.org/2003/role/disclosureRef
-Topic 220
-SubTopic 10
-Name Accounting Standards Codification
-Section 45
-Paragraph 10A
-Subparagraph (d)
-Publisher FASB
-URI https://asc.fasb.org/1943274/2147482790/220-10-45-10A
| Name: |
us-gaap_OtherComprehensiveIncomeLossCashFlowHedgeGainLossBeforeReclassificationAndTax |
| Namespace Prefix: |
us-gaap_ |
| Data Type: |
xbrli:monetaryItemType |
| Balance Type: |
credit |
| Period Type: |
duration |
|
| X |
- DefinitionAmount, before tax, of reclassification of gain (loss) from accumulated other comprehensive income (AOCI) for derivative instrument designated and qualifying as cash flow hedge included in assessment of hedge effectiveness. Reference 1: http://www.xbrl.org/2003/role/disclosureRef
-Topic 220
-SubTopic 10
-Name Accounting Standards Codification
-Section 45
-Paragraph 11
-Publisher FASB
-URI https://asc.fasb.org/1943274/2147482790/220-10-45-11
Reference 2: http://www.xbrl.org/2003/role/disclosureRef
-Topic 220
-SubTopic 10
-Name Accounting Standards Codification
-Section 45
-Paragraph 15
-Publisher FASB
-URI https://asc.fasb.org/1943274/2147482790/220-10-45-15
Reference 3: http://www.xbrl.org/2003/role/disclosureRef
-Name Accounting Standards Codification
-Section 50
-Paragraph 4C
-Subparagraph (c)
-SubTopic 10
-Topic 815
-Publisher FASB
-URI https://asc.fasb.org/1943274/2147480434/815-10-50-4C
| Name: |
us-gaap_OtherComprehensiveIncomeLossCashFlowHedgeGainLossReclassificationBeforeTax |
| Namespace Prefix: |
us-gaap_ |
| Data Type: |
xbrli:monetaryItemType |
| Balance Type: |
debit |
| Period Type: |
duration |
|
| X |
- Details
| Name: |
us-gaap_DerivativeInstrumentRiskAxis=tg_AluminumFuturesContractsMember |
| Namespace Prefix: |
|
| Data Type: |
na |
| Balance Type: |
|
| Period Type: |
|
|
| X |
- Details
| Name: |
us-gaap_IncomeStatementLocationAxis=us-gaap_CostOfSalesMember |
| Namespace Prefix: |
|
| Data Type: |
na |
| Balance Type: |
|
| Period Type: |
|
|
| X |
- Details
| Name: |
us-gaap_DerivativeInstrumentsGainLossByHedgingRelationshipAxis=us-gaap_CashFlowHedgingMember |
| Namespace Prefix: |
|
| Data Type: |
na |
| Balance Type: |
|
| Period Type: |
|
|
| X |
- Details
| Name: |
us-gaap_DerivativeInstrumentRiskAxis=tg_ForeignCurrencyForwardsAndOptionsMember |
| Namespace Prefix: |
|
| Data Type: |
na |
| Balance Type: |
|
| Period Type: |
|
|
| X |
- Details
| Name: |
us-gaap_IncomeStatementLocationAxis=us-gaap_SellingGeneralAndAdministrativeExpensesMember |
| Namespace Prefix: |
|
| Data Type: |
na |
| Balance Type: |
|
| Period Type: |
|
|
v3.24.3
Income Taxes - Narrative (Details) - USD ($)
$ in Thousands |
3 Months Ended |
9 Months Ended |
Sep. 30, 2024 |
Sep. 30, 2023 |
Sep. 30, 2024 |
Sep. 30, 2023 |
| Income Taxes [Line Items] |
|
|
|
|
| Income Tax Expense (Benefit) |
$ 948
|
$ (13,307)
|
$ 3,573
|
$ (16,307)
|
| Income (loss) before income taxes |
$ (2,998)
|
$ (63,687)
|
$ 11,707
|
$ (86,621)
|
| Effective Income Tax Rate Reconciliation, Percent |
|
|
30.50%
|
18.80%
|
| Terphane Ltda [Member] |
|
|
|
|
| Income Taxes [Line Items] |
|
|
|
|
| Current Effective Tax Rate Including Social Contribution On Income |
|
|
15.25%
|
|
| Brazilian |
|
|
|
|
| Income Taxes [Line Items] |
|
|
|
|
| Effective Income Tax Rate Reconciliation Federal Statutory Tax Rate Including Social Contribution On Income |
|
|
34.00%
|
|
| Effective Income Tax Rate Reconciliation Federal Statutory Tax Rate Excluding Social Contribution On Income |
|
|
25.00%
|
|
| Effective income tax rate reconciliation social contribution on income |
|
|
9.00%
|
|
| X |
- DefinitionCurrent Effective Tax Rate Including Social Contribution On Income
| Name: |
tg_CurrentEffectiveTaxRateIncludingSocialContributionOnIncome |
| Namespace Prefix: |
tg_ |
| Data Type: |
dtr-types1:percentItemType |
| Balance Type: |
na |
| Period Type: |
duration |
|
v3.24.3
Segment Reporting (Schedule Of Segment Reporting Information By Segment) (Details) - USD ($)
$ in Thousands |
1 Months Ended |
3 Months Ended |
9 Months Ended |
12 Months Ended |
Jan. 31, 2023 |
Sep. 30, 2024 |
Sep. 30, 2023 |
Sep. 30, 2024 |
Sep. 30, 2023 |
Dec. 31, 2023 |
| Segment Reporting Information [Line Items] |
|
|
|
|
|
|
| Sales |
|
$ 174,966
|
$ 159,459
|
$ 527,189
|
$ 515,504
|
|
| Sales as shown in the condensed consolidated statements of income (loss) |
|
182,051
|
166,192
|
548,022
|
535,481
|
|
| Total Segment Income (Loss) |
|
7,118
|
(23,398)
|
38,252
|
(23,284)
|
|
| Interest income |
|
8
|
62
|
36
|
135
|
|
| Interest expense |
|
3,480
|
3,106
|
10,314
|
7,791
|
|
| Gain on investment in kaléo |
|
|
|
(144)
|
(262)
|
|
| Stock option-based compensation costs |
|
0
|
0
|
0
|
231
|
|
| Pension settlement loss |
|
0
|
25,612
|
0
|
25,612
|
$ 92,300
|
| Corporate expenses, net |
|
6,644
|
11,633
|
16,411
|
30,100
|
|
| Income (loss) before income taxes |
|
(2,998)
|
(63,687)
|
11,707
|
(86,621)
|
|
| Income Tax Expense (Benefit) |
|
948
|
(13,307)
|
3,573
|
(16,307)
|
|
| Net Income (Loss) |
|
(3,946)
|
(50,380)
|
8,134
|
(70,314)
|
|
| kaleo [Member] |
|
|
|
|
|
|
| Segment Reporting Information [Line Items] |
|
|
|
|
|
|
| Gain on investment in kaléo |
$ 0
|
|
0
|
144
|
262
|
|
| Freight |
|
|
|
|
|
|
| Segment Reporting Information [Line Items] |
|
|
|
|
|
|
| Cost of Goods and Services Sold |
|
7,085
|
6,733
|
20,833
|
19,977
|
|
| Aluminum Extrusions [Member] |
|
|
|
|
|
|
| Segment Reporting Information [Line Items] |
|
|
|
|
|
|
| Sales |
|
115,717
|
109,410
|
349,353
|
364,607
|
|
| Earnings before interest, taxes, depreciation and amortization (EBITDA) |
|
6,177
|
5,113
|
31,624
|
29,968
|
|
| Depreciation, Depletion and Amortization |
|
(4,404)
|
(4,683)
|
(13,392)
|
(13,252)
|
|
| Earnings before interest and taxes (EBIT) |
|
1,773
|
430
|
18,232
|
16,716
|
|
| EBITDA |
|
(2,170)
|
(1,483)
|
(4,986)
|
(1,821)
|
|
| PE Films [Member] |
|
|
|
|
|
|
| Segment Reporting Information [Line Items] |
|
|
|
|
|
|
| Sales |
|
24,879
|
19,938
|
78,811
|
56,036
|
|
| Earnings before interest, taxes, depreciation and amortization (EBITDA) |
|
5,876
|
4,037
|
22,913
|
6,700
|
|
| Depreciation, Depletion and Amortization |
|
(1,299)
|
(2,111)
|
(3,944)
|
(5,305)
|
|
| Earnings before interest and taxes (EBIT) |
|
4,577
|
1,926
|
18,969
|
1,395
|
|
| EBITDA |
|
0
|
(4,566)
|
(584)
|
(4,565)
|
|
| Flexible Packaging Films [Member] |
|
|
|
|
|
|
| Segment Reporting Information [Line Items] |
|
|
|
|
|
|
| Earnings before interest, taxes, depreciation and amortization (EBITDA) |
|
3,749
|
477
|
8,915
|
2,076
|
|
| Depreciation, Depletion and Amortization |
|
(708)
|
(704)
|
(2,191)
|
(2,115)
|
|
| Earnings before interest and taxes (EBIT) |
|
3,041
|
(227)
|
6,724
|
(39)
|
|
| EBITDA |
|
$ (103)
|
$ 0
|
$ (103)
|
$ (79)
|
|
| X |
- DefinitionEarnings before interest and taxes (EBIT)
| Name: |
tg_EarningsBeforeInterestAndTaxesEBIT |
| Namespace Prefix: |
tg_ |
| Data Type: |
xbrli:monetaryItemType |
| Balance Type: |
debit |
| Period Type: |
duration |
|
| X |
- DefinitionEarnings before interest, taxes, depreciation and amortization (EBITDA)
| Name: |
tg_EarningsBeforeInterestTaxesDepreciationAndAmortizationEBITDA |
| Namespace Prefix: |
tg_ |
| Data Type: |
xbrli:monetaryItemType |
| Balance Type: |
debit |
| Period Type: |
duration |
|
| X |
- DefinitionAggregrate revenue during the period from the sales of goods in the normal course of business, after deducting returns, allowances, discounts, and charges for outbound freight.
| Name: |
tg_NetSales |
| Namespace Prefix: |
tg_ |
| Data Type: |
xbrli:monetaryItemType |
| Balance Type: |
credit |
| Period Type: |
duration |
|
| X |
- DefinitionGains or losses associated with plant shutdowns, asset impairments and restructurings, gains or losses from the sale of assets, goodwill impairment losses and other non-recurring items which are not associated with the ongoing operations of a segment.
| Name: |
tg_PlantShutdownsAssetImpairmentsRestructuringAndOther |
| Namespace Prefix: |
tg_ |
| Data Type: |
xbrli:monetaryItemType |
| Balance Type: |
credit |
| Period Type: |
duration |
|
| X |
- DefinitionPre-tax Actuarial Loss for Pension Settlement
| Name: |
tg_PreTaxActuarialLossForPensionSettlement |
| Namespace Prefix: |
tg_ |
| Data Type: |
xbrli:monetaryItemType |
| Balance Type: |
debit |
| Period Type: |
duration |
|
| X |
- DefinitionTotal income and loss before income expenses associated with a specific segment. Includes income/loss from ongoing operations; plant shutdowns, asset impairments, restructurings and other non-recurring charges; and goodwill impairment charges.
| Name: |
tg_TotalIncomeLossAssociatedWithSegments |
| Namespace Prefix: |
tg_ |
| Data Type: |
xbrli:monetaryItemType |
| Balance Type: |
credit |
| Period Type: |
duration |
|
| X |
- DefinitionThe aggregate costs related to goods produced and sold and services rendered by an entity during the reporting period. This excludes costs incurred during the reporting period related to financial services rendered and other revenue generating activities. Reference 1: http://fasb.org/us-gaap/role/ref/legacyRef
-Topic 220
-SubTopic 10
-Name Accounting Standards Codification
-Section S99
-Paragraph 2
-Subparagraph (SX 210.5-03(2)(d))
-Publisher FASB
-URI https://asc.fasb.org/1943274/2147483621/220-10-S99-2
Reference 2: http://fasb.org/us-gaap/role/ref/legacyRef
-Topic 220
-SubTopic 10
-Name Accounting Standards Codification
-Section S99
-Paragraph 2
-Subparagraph (SX 210.5-03(2)(a))
-Publisher FASB
-URI https://asc.fasb.org/1943274/2147483621/220-10-S99-2
Reference 3: http://www.xbrl.org/2003/role/disclosureRef
-Topic 924
-SubTopic 10
-Name Accounting Standards Codification
-Section S99
-Paragraph 1
-Subparagraph (SAB Topic 11.L)
-Publisher FASB
-URI https://asc.fasb.org/1943274/2147479941/924-10-S99-1
| Name: |
us-gaap_CostOfGoodsAndServicesSold |
| Namespace Prefix: |
us-gaap_ |
| Data Type: |
xbrli:monetaryItemType |
| Balance Type: |
debit |
| Period Type: |
duration |
|
| X |
- DefinitionThe aggregate expense recognized in the current period that allocates the cost of tangible assets, intangible assets, or depleting assets to periods that benefit from use of the assets. Reference 1: http://fasb.org/us-gaap/role/ref/legacyRef
-Name Accounting Standards Codification
-Section 45
-Paragraph 28
-Subparagraph (b)
-SubTopic 10
-Topic 230
-Publisher FASB
-URI https://asc.fasb.org/1943274/2147482740/230-10-45-28
Reference 2: http://www.xbrl.org/2003/role/exampleRef
-Topic 280
-SubTopic 10
-Name Accounting Standards Codification
-Section 55
-Paragraph 48
-Publisher FASB
-URI https://asc.fasb.org/1943274/2147482785/280-10-55-48
Reference 3: http://www.xbrl.org/2003/role/exampleRef
-Topic 280
-SubTopic 10
-Name Accounting Standards Codification
-Section 55
-Paragraph 49
-Publisher FASB
-URI https://asc.fasb.org/1943274/2147482785/280-10-55-49
Reference 4: http://www.xbrl.org/2003/role/disclosureRef
-Topic 270
-SubTopic 10
-Name Accounting Standards Codification
-Section 50
-Paragraph 1
-Subparagraph (i)
-Publisher FASB
-URI https://asc.fasb.org/1943274/2147482964/270-10-50-1
Reference 5: http://www.xbrl.org/2003/role/disclosureRef
-Topic 280
-SubTopic 10
-Name Accounting Standards Codification
-Section 50
-Paragraph 32
-Subparagraph (ee)
-Publisher FASB
-URI https://asc.fasb.org/1943274/2147482810/280-10-50-32
Reference 6: http://www.xbrl.org/2003/role/disclosureRef
-Topic 280
-SubTopic 10
-Name Accounting Standards Codification
-Section 50
-Paragraph 22
-Subparagraph (e)
-Publisher FASB
-URI https://asc.fasb.org/1943274/2147482810/280-10-50-22
| Name: |
us-gaap_DepreciationDepletionAndAmortization |
| Namespace Prefix: |
us-gaap_ |
| Data Type: |
xbrli:monetaryItemType |
| Balance Type: |
debit |
| Period Type: |
duration |
|
| X |
- DefinitionInterest and debt related expenses associated with nonoperating financing activities of the entity. Reference 1: http://www.xbrl.org/2009/role/commonPracticeRef
-Topic 220
-SubTopic 10
-Name Accounting Standards Codification
-Section S99
-Paragraph 2
-Subparagraph (SX 210.5-03(8))
-Publisher FASB
-URI https://asc.fasb.org/1943274/2147483621/220-10-S99-2
| Name: |
us-gaap_InterestAndDebtExpense |
| Namespace Prefix: |
us-gaap_ |
| Data Type: |
xbrli:monetaryItemType |
| Balance Type: |
debit |
| Period Type: |
duration |
|
| X |
- DefinitionAmount before accretion (amortization) of purchase discount (premium) of interest income on nonoperating securities. Reference 1: http://www.xbrl.org/2003/role/disclosureRef
-Topic 280
-SubTopic 10
-Name Accounting Standards Codification
-Section 50
-Paragraph 22
-Subparagraph (c)
-Publisher FASB
-URI https://asc.fasb.org/1943274/2147482810/280-10-50-22
Reference 2: http://www.xbrl.org/2003/role/exampleRef
-Topic 280
-SubTopic 10
-Name Accounting Standards Codification
-Section 55
-Paragraph 48
-Publisher FASB
-URI https://asc.fasb.org/1943274/2147482785/280-10-55-48
Reference 3: http://www.xbrl.org/2009/role/commonPracticeRef
-Topic 220
-SubTopic 10
-Name Accounting Standards Codification
-Section S99
-Paragraph 2
-Subparagraph (SX 210.5-03(7)(b))
-Publisher FASB
-URI https://asc.fasb.org/1943274/2147483621/220-10-S99-2
Reference 4: http://www.xbrl.org/2003/role/disclosureRef
-Topic 270
-SubTopic 10
-Name Accounting Standards Codification
-Section 50
-Paragraph 1
-Subparagraph (i)
-Publisher FASB
-URI https://asc.fasb.org/1943274/2147482964/270-10-50-1
Reference 5: http://www.xbrl.org/2003/role/disclosureRef
-Topic 280
-SubTopic 10
-Name Accounting Standards Codification
-Section 50
-Paragraph 32
-Subparagraph (ee)
-Publisher FASB
-URI https://asc.fasb.org/1943274/2147482810/280-10-50-32
| Name: |
us-gaap_InvestmentIncomeInterest |
| Namespace Prefix: |
us-gaap_ |
| Data Type: |
xbrli:monetaryItemType |
| Balance Type: |
credit |
| Period Type: |
duration |
|
| X |
- DefinitionThe portion of profit or loss for the period, net of income taxes, which is attributable to the parent. Reference 1: http://www.xbrl.org/2003/role/disclosureRef
-Topic 250
-SubTopic 10
-Name Accounting Standards Codification
-Section 50
-Paragraph 6
-Publisher FASB
-URI https://asc.fasb.org/1943274/2147483443/250-10-50-6
Reference 2: http://www.xbrl.org/2003/role/disclosureRef
-Topic 250
-SubTopic 10
-Name Accounting Standards Codification
-Section 50
-Paragraph 9
-Publisher FASB
-URI https://asc.fasb.org/1943274/2147483443/250-10-50-9
Reference 3: http://www.xbrl.org/2003/role/disclosureRef
-Topic 805
-SubTopic 60
-Name Accounting Standards Codification
-Section 65
-Paragraph 1
-Subparagraph (g)
-Publisher FASB
-URI https://asc.fasb.org/1943274/2147476176/805-60-65-1
Reference 4: http://www.xbrl.org/2003/role/disclosureRef
-Topic 740
-SubTopic 323
-Name Accounting Standards Codification
-Section 65
-Paragraph 2
-Subparagraph (g)(3)
-Publisher FASB
-URI https://asc.fasb.org/1943274/2147478666/740-323-65-2
Reference 5: http://fasb.org/us-gaap/role/ref/legacyRef
-Topic 220
-SubTopic 10
-Name Accounting Standards Codification
-Section S99
-Paragraph 2
-Subparagraph (SX 210.5-03(20))
-Publisher FASB
-URI https://asc.fasb.org/1943274/2147483621/220-10-S99-2
Reference 6: http://www.xbrl.org/2003/role/disclosureRef
-Topic 235
-SubTopic 10
-Name Accounting Standards Codification
-Section S99
-Paragraph 1
-Subparagraph (SX 210.4-08(g)(1)(ii))
-Publisher FASB
-URI https://asc.fasb.org/1943274/2147480678/235-10-S99-1
Reference 7: http://www.xbrl.org/2003/role/disclosureRef
-Topic 323
-SubTopic 10
-Name Accounting Standards Codification
-Section 50
-Paragraph 3
-Subparagraph (c)
-Publisher FASB
-URI https://asc.fasb.org/1943274/2147481687/323-10-50-3
Reference 8: http://www.xbrl.org/2003/role/disclosureRef
-Topic 825
-SubTopic 10
-Name Accounting Standards Codification
-Section 50
-Paragraph 28
-Subparagraph (f)
-Publisher FASB
-URI https://asc.fasb.org/1943274/2147482907/825-10-50-28
Reference 9: http://www.xbrl.org/2003/role/disclosureRef
-Topic 220
-SubTopic 10
-Name Accounting Standards Codification
-Section 50
-Paragraph 6
-Publisher FASB
-URI https://asc.fasb.org/1943274/2147482765/220-10-50-6
Reference 10: http://www.xbrl.org/2003/role/disclosureRef
-Topic 250
-SubTopic 10
-Name Accounting Standards Codification
-Section 50
-Paragraph 3
-Publisher FASB
-URI https://asc.fasb.org/1943274/2147483443/250-10-50-3
Reference 11: http://www.xbrl.org/2003/role/disclosureRef
-Topic 250
-SubTopic 10
-Name Accounting Standards Codification
-Section 50
-Paragraph 1
-Subparagraph (b)(2)
-Publisher FASB
-URI https://asc.fasb.org/1943274/2147483443/250-10-50-1
Reference 12: http://www.xbrl.org/2003/role/disclosureRef
-Topic 815
-SubTopic 40
-Name Accounting Standards Codification
-Section 65
-Paragraph 1
-Subparagraph (f)
-Publisher FASB
-URI https://asc.fasb.org/1943274/2147480175/815-40-65-1
Reference 13: http://www.xbrl.org/2003/role/disclosureRef
-Topic 250
-SubTopic 10
-Name Accounting Standards Codification
-Section 50
-Paragraph 8
-Publisher FASB
-URI https://asc.fasb.org/1943274/2147483443/250-10-50-8
Reference 14: http://www.xbrl.org/2003/role/disclosureRef
-Topic 250
-SubTopic 10
-Name Accounting Standards Codification
-Section 50
-Paragraph 11
-Subparagraph (a)
-Publisher FASB
-URI https://asc.fasb.org/1943274/2147483443/250-10-50-11
Reference 15: http://www.xbrl.org/2003/role/disclosureRef
-Topic 250
-SubTopic 10
-Name Accounting Standards Codification
-Section 50
-Paragraph 11
-Subparagraph (b)
-Publisher FASB
-URI https://asc.fasb.org/1943274/2147483443/250-10-50-11
Reference 16: http://www.xbrl.org/2003/role/disclosureRef
-Topic 250
-SubTopic 10
-Name Accounting Standards Codification
-Section 50
-Paragraph 4
-Publisher FASB
-URI https://asc.fasb.org/1943274/2147483443/250-10-50-4
Reference 17: http://www.xbrl.org/2003/role/exampleRef
-Topic 946
-SubTopic 830
-Name Accounting Standards Codification
-Section 55
-Paragraph 10
-Publisher FASB
-URI https://asc.fasb.org/1943274/2147479168/946-830-55-10
Reference 18: http://www.xbrl.org/2003/role/disclosureRef
-Topic 946
-SubTopic 220
-Name Accounting Standards Codification
-Section 45
-Paragraph 7
-Publisher FASB
-URI https://asc.fasb.org/1943274/2147479105/946-220-45-7
Reference 19: http://www.xbrl.org/2003/role/disclosureRef
-Topic 944
-SubTopic 220
-Name Accounting Standards Codification
-Section S99
-Paragraph 1
-Subparagraph (SX 210.7-04(18))
-Publisher FASB
-URI https://asc.fasb.org/1943274/2147477250/944-220-S99-1
Reference 20: http://www.xbrl.org/2003/role/disclosureRef
-Topic 946
-SubTopic 220
-Name Accounting Standards Codification
-Section S99
-Paragraph 1
-Subparagraph (SX 210.6-07(9))
-Publisher FASB
-URI https://asc.fasb.org/1943274/2147479134/946-220-S99-1
Reference 21: http://www.xbrl.org/2003/role/disclosureRef
-Topic 946
-SubTopic 220
-Name Accounting Standards Codification
-Section S99
-Paragraph 3
-Subparagraph (SX 210.6-09(1)(d))
-Publisher FASB
-URI https://asc.fasb.org/1943274/2147479134/946-220-S99-3
Reference 22: http://www.xbrl.org/2003/role/disclosureRef
-Topic 470
-SubTopic 10
-Name Accounting Standards Codification
-Section S99
-Paragraph 1A
-Subparagraph (SX 210.13-01(a)(4)(i))
-Publisher FASB
-URI https://asc.fasb.org/1943274/2147480097/470-10-S99-1A
Reference 23: http://www.xbrl.org/2009/role/commonPracticeRef
-Topic 470
-SubTopic 10
-Name Accounting Standards Codification
-Section S99
-Paragraph 1A
-Subparagraph (SX 210.13-01(a)(4)(ii))
-Publisher FASB
-URI https://asc.fasb.org/1943274/2147480097/470-10-S99-1A
Reference 24: http://www.xbrl.org/2003/role/disclosureRef
-Topic 470
-SubTopic 10
-Name Accounting Standards Codification
-Section S99
-Paragraph 1A
-Subparagraph (SX 210.13-01(a)(4)(iii)(A))
-Publisher FASB
-URI https://asc.fasb.org/1943274/2147480097/470-10-S99-1A
Reference 25: http://www.xbrl.org/2003/role/disclosureRef
-Topic 470
-SubTopic 10
-Name Accounting Standards Codification
-Section S99
-Paragraph 1A
-Subparagraph (SX 210.13-01(a)(4)(iv))
-Publisher FASB
-URI https://asc.fasb.org/1943274/2147480097/470-10-S99-1A
Reference 26: http://www.xbrl.org/2003/role/disclosureRef
-Topic 470
-SubTopic 10
-Name Accounting Standards Codification
-Section S99
-Paragraph 1A
-Subparagraph (SX 210.13-01(a)(5))
-Publisher FASB
-URI https://asc.fasb.org/1943274/2147480097/470-10-S99-1A
Reference 27: http://www.xbrl.org/2003/role/disclosureRef
-Topic 470
-SubTopic 10
-Name Accounting Standards Codification
-Section S99
-Paragraph 1B
-Subparagraph (SX 210.13-02(a)(4)(i))
-Publisher FASB
-URI https://asc.fasb.org/1943274/2147480097/470-10-S99-1B
Reference 28: http://www.xbrl.org/2003/role/disclosureRef
-Topic 470
-SubTopic 10
-Name Accounting Standards Codification
-Section S99
-Paragraph 1B
-Subparagraph (SX 210.13-02(a)(4)(iii)(A))
-Publisher FASB
-URI https://asc.fasb.org/1943274/2147480097/470-10-S99-1B
Reference 29: http://www.xbrl.org/2003/role/disclosureRef
-Topic 470
-SubTopic 10
-Name Accounting Standards Codification
-Section S99
-Paragraph 1B
-Subparagraph (SX 210.13-02(a)(4)(iii)(B))
-Publisher FASB
-URI https://asc.fasb.org/1943274/2147480097/470-10-S99-1B
Reference 30: http://www.xbrl.org/2003/role/disclosureRef
-Topic 470
-SubTopic 10
-Name Accounting Standards Codification
-Section S99
-Paragraph 1B
-Subparagraph (SX 210.13-02(a)(4)(iv))
-Publisher FASB
-URI https://asc.fasb.org/1943274/2147480097/470-10-S99-1B
Reference 31: http://www.xbrl.org/2003/role/disclosureRef
-Topic 470
-SubTopic 10
-Name Accounting Standards Codification
-Section S99
-Paragraph 1B
-Subparagraph (SX 210.13-02(a)(5))
-Publisher FASB
-URI https://asc.fasb.org/1943274/2147480097/470-10-S99-1B
Reference 32: http://www.xbrl.org/2003/role/disclosureRef
-Topic 260
-SubTopic 10
-Name Accounting Standards Codification
-Section 45
-Paragraph 60B
-Subparagraph (a)
-Publisher FASB
-URI https://asc.fasb.org/1943274/2147482689/260-10-45-60B
Reference 33: http://www.xbrl.org/2003/role/disclosureRef
-Topic 205
-SubTopic 20
-Name Accounting Standards Codification
-Section 50
-Paragraph 7
-Publisher FASB
-URI https://asc.fasb.org/1943274/2147483499/205-20-50-7
Reference 34: http://fasb.org/us-gaap/role/ref/legacyRef
-Topic 230
-SubTopic 10
-Name Accounting Standards Codification
-Section 45
-Paragraph 28
-Publisher FASB
-URI https://asc.fasb.org/1943274/2147482740/230-10-45-28
Reference 35: http://www.xbrl.org/2003/role/disclosureRef
-Topic 220
-SubTopic 10
-Name Accounting Standards Codification
-Section 45
-Paragraph 1A
-Subparagraph (a)
-Publisher FASB
-URI https://asc.fasb.org/1943274/2147482790/220-10-45-1A
Reference 36: http://www.xbrl.org/2003/role/disclosureRef
-Topic 220
-SubTopic 10
-Name Accounting Standards Codification
-Section 45
-Paragraph 1B
-Subparagraph (a)
-Publisher FASB
-URI https://asc.fasb.org/1943274/2147482790/220-10-45-1B
Reference 37: http://fasb.org/us-gaap/role/ref/legacyRef
-Topic 942
-SubTopic 220
-Name Accounting Standards Codification
-Section S99
-Paragraph 1
-Subparagraph (SX 210.9-04(22))
-Publisher FASB
-URI https://asc.fasb.org/1943274/2147478524/942-220-S99-1
| Name: |
us-gaap_NetIncomeLoss |
| Namespace Prefix: |
us-gaap_ |
| Data Type: |
xbrli:monetaryItemType |
| Balance Type: |
credit |
| Period Type: |
duration |
|
| X |
- DefinitionAmount of noncash expense for option under share-based payment arrangement. Reference 1: http://fasb.org/us-gaap/role/ref/legacyRef
-Name Accounting Standards Codification
-Section 45
-Paragraph 28
-Subparagraph (b)
-SubTopic 10
-Topic 230
-Publisher FASB
-URI https://asc.fasb.org/1943274/2147482740/230-10-45-28
| Name: |
us-gaap_StockOptionPlanExpense |
| Namespace Prefix: |
us-gaap_ |
| Data Type: |
xbrli:monetaryItemType |
| Balance Type: |
debit |
| Period Type: |
duration |
|
| X |
- DefinitionAmount of unrealized gain (loss) on investment. Reference 1: http://fasb.org/us-gaap/role/ref/legacyRef
-Name Accounting Standards Codification
-Section 45
-Paragraph 28
-Subparagraph (b)
-SubTopic 10
-Topic 230
-Publisher FASB
-URI https://asc.fasb.org/1943274/2147482740/230-10-45-28
| Name: |
us-gaap_UnrealizedGainLossOnInvestments |
| Namespace Prefix: |
us-gaap_ |
| Data Type: |
xbrli:monetaryItemType |
| Balance Type: |
credit |
| Period Type: |
duration |
|
| X |
- Details
| Name: |
dei_LegalEntityAxis=tg_KaleoMember |
| Namespace Prefix: |
|
| Data Type: |
na |
| Balance Type: |
|
| Period Type: |
|
|
| X |
- Details
| Name: |
srt_ProductOrServiceAxis=us-gaap_ShippingAndHandlingMember |
| Namespace Prefix: |
|
| Data Type: |
na |
| Balance Type: |
|
| Period Type: |
|
|
| X |
- Details
| Name: |
us-gaap_StatementBusinessSegmentsAxis=tg_AluminumExtrusionsMember |
| Namespace Prefix: |
|
| Data Type: |
na |
| Balance Type: |
|
| Period Type: |
|
|
| X |
- Details
| Name: |
us-gaap_StatementBusinessSegmentsAxis=tg_PEFilmsMember |
| Namespace Prefix: |
|
| Data Type: |
na |
| Balance Type: |
|
| Period Type: |
|
|
| X |
- Details
| Name: |
us-gaap_StatementBusinessSegmentsAxis=tg_FlexiblePackagingFilmsMember |
| Namespace Prefix: |
|
| Data Type: |
na |
| Balance Type: |
|
| Period Type: |
|
|
v3.24.3
Segment Reporting (Schedule Of Identifiable Assets By Segment) (Details) - USD ($)
$ in Thousands |
Sep. 30, 2024 |
Dec. 31, 2023 |
Sep. 30, 2023 |
Dec. 31, 2022 |
| Assets |
$ 442,541
|
$ 446,461
|
|
|
| Cash and cash equivalents |
6,588
|
13,455
|
$ 48,604
|
$ 19,232
|
| Operating Segments |
|
|
|
|
| Assets |
442,540
|
446,461
|
|
|
| Aluminum Extrusions [Member] | Operating Segments |
|
|
|
|
| Assets |
258,410
|
255,756
|
|
|
| PE Films [Member] | Operating Segments |
|
|
|
|
| Assets |
57,989
|
56,536
|
|
|
| Flexible Packaging Films [Member] | Operating Segments |
|
|
|
|
| Assets |
85,297
|
84,062
|
|
|
| Subtotal | Operating Segments |
|
|
|
|
| Assets |
401,696
|
396,354
|
|
|
| General Corporate | Operating Segments |
|
|
|
|
| Assets |
$ 34,256
|
$ 36,652
|
|
|
| X |
- DefinitionAmount of asset recognized for present right to economic benefit. Reference 1: http://www.xbrl.org/2003/role/exampleRef
-Topic 280
-SubTopic 10
-Name Accounting Standards Codification
-Section 55
-Paragraph 48
-Publisher FASB
-URI https://asc.fasb.org/1943274/2147482785/280-10-55-48
Reference 2: http://www.xbrl.org/2003/role/exampleRef
-Topic 280
-SubTopic 10
-Name Accounting Standards Codification
-Section 55
-Paragraph 49
-Publisher FASB
-URI https://asc.fasb.org/1943274/2147482785/280-10-55-49
Reference 3: http://www.xbrl.org/2003/role/disclosureRef
-Topic 270
-SubTopic 10
-Name Accounting Standards Codification
-Section 50
-Paragraph 1
-Subparagraph (i)
-Publisher FASB
-URI https://asc.fasb.org/1943274/2147482964/270-10-50-1
Reference 4: http://www.xbrl.org/2003/role/disclosureRef
-Topic 280
-SubTopic 10
-Name Accounting Standards Codification
-Section 50
-Paragraph 32
-Subparagraph (ee)
-Publisher FASB
-URI https://asc.fasb.org/1943274/2147482810/280-10-50-32
Reference 5: http://fasb.org/us-gaap/role/ref/otherTransitionRef
-Topic 280
-SubTopic 10
-Name Accounting Standards Codification
-Section 50
-Paragraph 32
-Subparagraph (d)
-Publisher FASB
-URI https://asc.fasb.org/1943274/2147482810/280-10-50-32
Reference 6: http://www.xbrl.org/2003/role/disclosureRef
-Topic 280
-SubTopic 10
-Name Accounting Standards Codification
-Section 50
-Paragraph 22
-Publisher FASB
-URI https://asc.fasb.org/1943274/2147482810/280-10-50-22
Reference 7: http://www.xbrl.org/2003/role/disclosureRef
-Topic 810
-SubTopic 10
-Name Accounting Standards Codification
-Section 50
-Paragraph 3
-Subparagraph (bb)
-Publisher FASB
-URI https://asc.fasb.org/1943274/2147481203/810-10-50-3
Reference 8: http://www.xbrl.org/2003/role/disclosureRef
-Topic 810
-SubTopic 10
-Name Accounting Standards Codification
-Section 45
-Paragraph 25
-Subparagraph (a)
-Publisher FASB
-URI https://asc.fasb.org/1943274/2147481231/810-10-45-25
Reference 9: http://www.xbrl.org/2003/role/disclosureRef
-Topic 235
-SubTopic 10
-Name Accounting Standards Codification
-Section S99
-Paragraph 1
-Subparagraph (SX 210.4-08(g)(1)(ii))
-Publisher FASB
-URI https://asc.fasb.org/1943274/2147480678/235-10-S99-1
Reference 10: http://www.xbrl.org/2003/role/disclosureRef
-Topic 323
-SubTopic 10
-Name Accounting Standards Codification
-Section 50
-Paragraph 3
-Subparagraph (c)
-Publisher FASB
-URI https://asc.fasb.org/1943274/2147481687/323-10-50-3
Reference 11: http://www.xbrl.org/2003/role/disclosureRef
-Topic 825
-SubTopic 10
-Name Accounting Standards Codification
-Section 50
-Paragraph 28
-Subparagraph (f)
-Publisher FASB
-URI https://asc.fasb.org/1943274/2147482907/825-10-50-28
Reference 12: http://www.xbrl.org/2003/role/exampleRef
-Topic 852
-SubTopic 10
-Name Accounting Standards Codification
-Section 55
-Paragraph 10
-Publisher FASB
-URI https://asc.fasb.org/1943274/2147481372/852-10-55-10
Reference 13: http://www.xbrl.org/2003/role/exampleRef
-Topic 946
-SubTopic 830
-Name Accounting Standards Codification
-Section 55
-Paragraph 12
-Publisher FASB
-URI https://asc.fasb.org/1943274/2147479168/946-830-55-12
Reference 14: http://www.xbrl.org/2003/role/disclosureRef
-Topic 944
-SubTopic 210
-Name Accounting Standards Codification
-Section S99
-Paragraph 1
-Subparagraph (SX 210.7-03(a)(12))
-Publisher FASB
-URI https://asc.fasb.org/1943274/2147478777/944-210-S99-1
Reference 15: http://www.xbrl.org/2003/role/disclosureRef
-Topic 946
-SubTopic 210
-Name Accounting Standards Codification
-Section S99
-Paragraph 1
-Subparagraph (SX 210.6-04(8))
-Publisher FASB
-URI https://asc.fasb.org/1943274/2147479170/946-210-S99-1
Reference 16: http://www.xbrl.org/2003/role/disclosureRef
-Topic 210
-SubTopic 10
-Name Accounting Standards Codification
-Section S99
-Paragraph 1
-Subparagraph (SX 210.5-02(18))
-Publisher FASB
-URI https://asc.fasb.org/1943274/2147480566/210-10-S99-1
Reference 17: http://www.xbrl.org/2003/role/disclosureRef
-Topic 470
-SubTopic 10
-Name Accounting Standards Codification
-Section S99
-Paragraph 1A
-Subparagraph (SX 210.13-01(a)(4)(i))
-Publisher FASB
-URI https://asc.fasb.org/1943274/2147480097/470-10-S99-1A
Reference 18: http://www.xbrl.org/2009/role/commonPracticeRef
-Topic 470
-SubTopic 10
-Name Accounting Standards Codification
-Section S99
-Paragraph 1A
-Subparagraph (SX 210.13-01(a)(4)(ii))
-Publisher FASB
-URI https://asc.fasb.org/1943274/2147480097/470-10-S99-1A
Reference 19: http://www.xbrl.org/2009/role/commonPracticeRef
-Topic 470
-SubTopic 10
-Name Accounting Standards Codification
-Section S99
-Paragraph 1A
-Subparagraph (SX 210.13-01(a)(4)(iii))
-Publisher FASB
-URI https://asc.fasb.org/1943274/2147480097/470-10-S99-1A
Reference 20: http://www.xbrl.org/2003/role/disclosureRef
-Topic 470
-SubTopic 10
-Name Accounting Standards Codification
-Section S99
-Paragraph 1A
-Subparagraph (SX 210.13-01(a)(4)(iii)(A))
-Publisher FASB
-URI https://asc.fasb.org/1943274/2147480097/470-10-S99-1A
Reference 21: http://www.xbrl.org/2003/role/disclosureRef
-Topic 470
-SubTopic 10
-Name Accounting Standards Codification
-Section S99
-Paragraph 1A
-Subparagraph (SX 210.13-01(a)(4)(iv))
-Publisher FASB
-URI https://asc.fasb.org/1943274/2147480097/470-10-S99-1A
Reference 22: http://www.xbrl.org/2003/role/disclosureRef
-Topic 470
-SubTopic 10
-Name Accounting Standards Codification
-Section S99
-Paragraph 1A
-Subparagraph (SX 210.13-01(a)(5))
-Publisher FASB
-URI https://asc.fasb.org/1943274/2147480097/470-10-S99-1A
Reference 23: http://www.xbrl.org/2003/role/disclosureRef
-Topic 470
-SubTopic 10
-Name Accounting Standards Codification
-Section S99
-Paragraph 1B
-Subparagraph (SX 210.13-02(a)(4)(i))
-Publisher FASB
-URI https://asc.fasb.org/1943274/2147480097/470-10-S99-1B
Reference 24: http://www.xbrl.org/2003/role/disclosureRef
-Topic 470
-SubTopic 10
-Name Accounting Standards Codification
-Section S99
-Paragraph 1B
-Subparagraph (SX 210.13-02(a)(4)(iii)(A))
-Publisher FASB
-URI https://asc.fasb.org/1943274/2147480097/470-10-S99-1B
Reference 25: http://www.xbrl.org/2003/role/disclosureRef
-Topic 470
-SubTopic 10
-Name Accounting Standards Codification
-Section S99
-Paragraph 1B
-Subparagraph (SX 210.13-02(a)(4)(iii)(B))
-Publisher FASB
-URI https://asc.fasb.org/1943274/2147480097/470-10-S99-1B
Reference 26: http://www.xbrl.org/2003/role/disclosureRef
-Topic 470
-SubTopic 10
-Name Accounting Standards Codification
-Section S99
-Paragraph 1B
-Subparagraph (SX 210.13-02(a)(4)(iv))
-Publisher FASB
-URI https://asc.fasb.org/1943274/2147480097/470-10-S99-1B
Reference 27: http://www.xbrl.org/2003/role/disclosureRef
-Topic 470
-SubTopic 10
-Name Accounting Standards Codification
-Section S99
-Paragraph 1B
-Subparagraph (SX 210.13-02(a)(5))
-Publisher FASB
-URI https://asc.fasb.org/1943274/2147480097/470-10-S99-1B
Reference 28: http://www.xbrl.org/2009/role/commonPracticeRef
-Topic 852
-SubTopic 10
-Name Accounting Standards Codification
-Section 50
-Paragraph 7
-Subparagraph (a)
-Publisher FASB
-URI https://asc.fasb.org/1943274/2147481404/852-10-50-7
Reference 29: http://www.xbrl.org/2003/role/disclosureRef
-Topic 280
-SubTopic 10
-Name Accounting Standards Codification
-Section 50
-Paragraph 30
-Subparagraph (c)
-Publisher FASB
-URI https://asc.fasb.org/1943274/2147482810/280-10-50-30
Reference 30: http://fasb.org/us-gaap/role/ref/legacyRef
-Topic 942
-SubTopic 210
-Name Accounting Standards Codification
-Section S99
-Paragraph 1
-Subparagraph (SX 210.9-03(11))
-Publisher FASB
-URI https://asc.fasb.org/1943274/2147478546/942-210-S99-1
| Name: |
us-gaap_Assets |
| Namespace Prefix: |
us-gaap_ |
| Data Type: |
xbrli:monetaryItemType |
| Balance Type: |
debit |
| Period Type: |
instant |
|
| X |
- DefinitionAmount of cash and cash equivalents, and cash and cash equivalents restricted to withdrawal or usage. Excludes amount for disposal group and discontinued operations. Cash includes, but is not limited to, currency on hand, demand deposits with banks or financial institutions, and other accounts with general characteristics of demand deposits. Cash equivalents include, but are not limited to, short-term, highly liquid investments that are both readily convertible to known amounts of cash and so near their maturity that they present insignificant risk of changes in value because of changes in interest rates. Reference 1: http://www.xbrl.org/2003/role/disclosureRef
-Topic 230
-SubTopic 10
-Name Accounting Standards Codification
-Section 50
-Paragraph 8
-Publisher FASB
-URI https://asc.fasb.org/1943274/2147482913/230-10-50-8
Reference 2: http://fasb.org/us-gaap/role/ref/legacyRef
-Topic 230
-SubTopic 10
-Name Accounting Standards Codification
-Section 45
-Paragraph 24
-Publisher FASB
-URI https://asc.fasb.org/1943274/2147482740/230-10-45-24
Reference 3: http://fasb.org/us-gaap/role/ref/legacyRef
-Name Accounting Standards Codification
-Topic 230
-SubTopic 10
-Section 45
-Paragraph 4
-Publisher FASB
-URI https://asc.fasb.org/1943274/2147482740/230-10-45-4
| Name: |
us-gaap_CashCashEquivalentsRestrictedCashAndRestrictedCashEquivalents |
| Namespace Prefix: |
us-gaap_ |
| Data Type: |
xbrli:monetaryItemType |
| Balance Type: |
debit |
| Period Type: |
instant |
|
| X |
- Details
| Name: |
srt_ConsolidationItemsAxis=us-gaap_OperatingSegmentsMember |
| Namespace Prefix: |
|
| Data Type: |
na |
| Balance Type: |
|
| Period Type: |
|
|
| X |
- Details
| Name: |
us-gaap_StatementBusinessSegmentsAxis=tg_AluminumExtrusionsMember |
| Namespace Prefix: |
|
| Data Type: |
na |
| Balance Type: |
|
| Period Type: |
|
|
| X |
- Details
| Name: |
us-gaap_StatementBusinessSegmentsAxis=tg_PEFilmsMember |
| Namespace Prefix: |
|
| Data Type: |
na |
| Balance Type: |
|
| Period Type: |
|
|
| X |
- Details
| Name: |
us-gaap_StatementBusinessSegmentsAxis=tg_FlexiblePackagingFilmsMember |
| Namespace Prefix: |
|
| Data Type: |
na |
| Balance Type: |
|
| Period Type: |
|
|
| X |
- Details
| Name: |
us-gaap_StatementBusinessSegmentsAxis=tg_SubtotalMember |
| Namespace Prefix: |
|
| Data Type: |
na |
| Balance Type: |
|
| Period Type: |
|
|
| X |
- Details
| Name: |
us-gaap_StatementBusinessSegmentsAxis=tg_GeneralCorporateMember |
| Namespace Prefix: |
|
| Data Type: |
na |
| Balance Type: |
|
| Period Type: |
|
|
v3.24.3
Segment Reporting Schedule of Revenue by Geographic Location (Details) - USD ($)
$ in Thousands |
3 Months Ended |
9 Months Ended |
Sep. 30, 2024 |
Sep. 30, 2023 |
Sep. 30, 2024 |
Sep. 30, 2023 |
| Disaggregation of Revenue [Line Items] |
|
|
|
|
| Sales |
$ 174,966
|
$ 159,459
|
$ 527,189
|
$ 515,504
|
| Aluminum Extrusions [Member] |
|
|
|
|
| Disaggregation of Revenue [Line Items] |
|
|
|
|
| Sales |
115,717
|
109,410
|
349,353
|
364,607
|
| Aluminum Extrusions [Member] | Nonresidential Building And Construction [Member] |
|
|
|
|
| Disaggregation of Revenue [Line Items] |
|
|
|
|
| Sales |
61,988
|
59,476
|
195,603
|
203,889
|
| Aluminum Extrusions [Member] | Consumer Durables [Member] |
|
|
|
|
| Disaggregation of Revenue [Line Items] |
|
|
|
|
| Sales |
8,581
|
8,662
|
25,487
|
30,723
|
| Aluminum Extrusions [Member] | Automotive [Member] |
|
|
|
|
| Disaggregation of Revenue [Line Items] |
|
|
|
|
| Sales |
11,060
|
13,025
|
31,793
|
36,916
|
| Aluminum Extrusions [Member] | Residential Building And Construction [Member] |
|
|
|
|
| Disaggregation of Revenue [Line Items] |
|
|
|
|
| Sales |
9,790
|
7,999
|
27,575
|
29,658
|
| Aluminum Extrusions [Member] | Electrical [Member] |
|
|
|
|
| Disaggregation of Revenue [Line Items] |
|
|
|
|
| Sales |
8,926
|
2,016
|
21,983
|
16,223
|
| Aluminum Extrusions [Member] | Machinery and Equipment BNL [Domain] |
|
|
|
|
| Disaggregation of Revenue [Line Items] |
|
|
|
|
| Sales |
13,131
|
14,202
|
37,995
|
36,008
|
| Aluminum Extrusions [Member] | Distribution [Member] |
|
|
|
|
| Disaggregation of Revenue [Line Items] |
|
|
|
|
| Sales |
2,241
|
4,030
|
8,917
|
11,190
|
| Aluminum Extrusions [Member] | Aluminum Extrusions Subtotal [Member] |
|
|
|
|
| Disaggregation of Revenue [Line Items] |
|
|
|
|
| Sales |
115,717
|
109,410
|
349,353
|
364,607
|
| PE Films [Member] |
|
|
|
|
| Disaggregation of Revenue [Line Items] |
|
|
|
|
| Sales |
24,879
|
19,938
|
78,811
|
56,036
|
| PE Films [Member] | Surface Protection Films [Member] |
|
|
|
|
| Disaggregation of Revenue [Line Items] |
|
|
|
|
| Sales |
17,516
|
12,755
|
56,241
|
34,251
|
| PE Films [Member] | Personal Care Materials |
|
|
|
|
| Disaggregation of Revenue [Line Items] |
|
|
|
|
| Sales |
7,363
|
7,183
|
22,570
|
21,785
|
| PE Films [Member] | Film Products Subtotal [Member] |
|
|
|
|
| Disaggregation of Revenue [Line Items] |
|
|
|
|
| Sales |
24,879
|
19,938
|
78,811
|
56,036
|
| Flexible Packaging Films [Member] [Domain] |
|
|
|
|
| Disaggregation of Revenue [Line Items] |
|
|
|
|
| Sales |
34,370
|
30,111
|
99,025
|
94,861
|
| UNITED STATES |
|
|
|
|
| Disaggregation of Revenue [Line Items] |
|
|
|
|
| Sales |
133,157
|
125,407
|
407,465
|
409,433
|
| Asia [Member] | Exports From United States [Member] |
|
|
|
|
| Disaggregation of Revenue [Line Items] |
|
|
|
|
| Sales |
11,875
|
7,873
|
34,534
|
19,082
|
| Revenues |
6,500
|
4,800
|
19,100
|
11,700
|
| Asia [Member] | Operations Outside United States [Member] |
|
|
|
|
| Disaggregation of Revenue [Line Items] |
|
|
|
|
| Sales |
289
|
142
|
555
|
302
|
| Latin America [Member] | Exports From United States [Member] |
|
|
|
|
| Disaggregation of Revenue [Line Items] |
|
|
|
|
| Sales |
1,395
|
1,764
|
4,121
|
5,440
|
| CANADA | Exports From United States [Member] |
|
|
|
|
| Disaggregation of Revenue [Line Items] |
|
|
|
|
| Sales |
3,437
|
3,640
|
10,459
|
12,879
|
| Europe [Member] | Exports From United States [Member] |
|
|
|
|
| Disaggregation of Revenue [Line Items] |
|
|
|
|
| Sales |
405
|
282
|
1,053
|
1,414
|
| Brazil | Operations Outside United States [Member] |
|
|
|
|
| Disaggregation of Revenue [Line Items] |
|
|
|
|
| Sales |
$ 24,408
|
$ 20,351
|
$ 69,002
|
$ 66,954
|
| X |
- DefinitionAggregrate revenue during the period from the sales of goods in the normal course of business, after deducting returns, allowances, discounts, and charges for outbound freight.
| Name: |
tg_NetSales |
| Namespace Prefix: |
tg_ |
| Data Type: |
xbrli:monetaryItemType |
| Balance Type: |
credit |
| Period Type: |
duration |
|
| X |
- DefinitionLine items represent financial concepts included in a table. These concepts are used to disclose reportable information associated with domain members defined in one or many axes to the table. Reference 1: http://www.xbrl.org/2003/role/disclosureRef
-Topic 606
-SubTopic 10
-Name Accounting Standards Codification
-Section 50
-Paragraph 5
-Publisher FASB
-URI https://asc.fasb.org/1943274/2147479806/606-10-50-5
Reference 2: http://www.xbrl.org/2003/role/exampleRef
-Topic 606
-SubTopic 10
-Name Accounting Standards Codification
-Section 55
-Paragraph 91
-Subparagraph (a)
-Publisher FASB
-URI https://asc.fasb.org/1943274/2147479777/606-10-55-91
Reference 3: http://www.xbrl.org/2003/role/exampleRef
-Topic 606
-SubTopic 10
-Name Accounting Standards Codification
-Section 55
-Paragraph 91
-Subparagraph (b)
-Publisher FASB
-URI https://asc.fasb.org/1943274/2147479777/606-10-55-91
Reference 4: http://www.xbrl.org/2003/role/exampleRef
-Topic 606
-SubTopic 10
-Name Accounting Standards Codification
-Section 55
-Paragraph 91
-Subparagraph (c)
-Publisher FASB
-URI https://asc.fasb.org/1943274/2147479777/606-10-55-91
Reference 5: http://www.xbrl.org/2003/role/exampleRef
-Topic 606
-SubTopic 10
-Name Accounting Standards Codification
-Section 55
-Paragraph 91
-Subparagraph (d)
-Publisher FASB
-URI https://asc.fasb.org/1943274/2147479777/606-10-55-91
Reference 6: http://www.xbrl.org/2003/role/exampleRef
-Topic 606
-SubTopic 10
-Name Accounting Standards Codification
-Section 55
-Paragraph 91
-Subparagraph (e)
-Publisher FASB
-URI https://asc.fasb.org/1943274/2147479777/606-10-55-91
Reference 7: http://www.xbrl.org/2003/role/exampleRef
-Topic 606
-SubTopic 10
-Name Accounting Standards Codification
-Section 55
-Paragraph 91
-Subparagraph (f)
-Publisher FASB
-URI https://asc.fasb.org/1943274/2147479777/606-10-55-91
Reference 8: http://www.xbrl.org/2003/role/exampleRef
-Topic 606
-SubTopic 10
-Name Accounting Standards Codification
-Section 55
-Paragraph 91
-Subparagraph (g)
-Publisher FASB
-URI https://asc.fasb.org/1943274/2147479777/606-10-55-91
| Name: |
us-gaap_DisaggregationOfRevenueLineItems |
| Namespace Prefix: |
us-gaap_ |
| Data Type: |
xbrli:stringItemType |
| Balance Type: |
na |
| Period Type: |
duration |
|
| X |
- DefinitionAmount of revenue recognized from goods sold, services rendered, insurance premiums, or other activities that constitute an earning process. Includes, but is not limited to, investment and interest income before deduction of interest expense when recognized as a component of revenue, and sales and trading gain (loss). Reference 1: http://www.xbrl.org/2003/role/exampleRef
-Topic 280
-SubTopic 10
-Name Accounting Standards Codification
-Section 55
-Paragraph 48
-Publisher FASB
-URI https://asc.fasb.org/1943274/2147482785/280-10-55-48
Reference 2: http://www.xbrl.org/2003/role/disclosureRef
-Topic 280
-SubTopic 10
-Name Accounting Standards Codification
-Section 50
-Paragraph 41
-Subparagraph (a)
-Publisher FASB
-URI https://asc.fasb.org/1943274/2147482810/280-10-50-41
Reference 3: http://www.xbrl.org/2003/role/disclosureRef
-Topic 270
-SubTopic 10
-Name Accounting Standards Codification
-Section 50
-Paragraph 1
-Subparagraph (i)
-Publisher FASB
-URI https://asc.fasb.org/1943274/2147482964/270-10-50-1
Reference 4: http://www.xbrl.org/2003/role/disclosureRef
-Topic 280
-SubTopic 10
-Name Accounting Standards Codification
-Section 50
-Paragraph 32
-Subparagraph (ee)
-Publisher FASB
-URI https://asc.fasb.org/1943274/2147482810/280-10-50-32
Reference 5: http://fasb.org/us-gaap/role/ref/otherTransitionRef
-Topic 280
-SubTopic 10
-Name Accounting Standards Codification
-Section 50
-Paragraph 32
-Subparagraph (b)
-Publisher FASB
-URI https://asc.fasb.org/1943274/2147482810/280-10-50-32
Reference 6: http://fasb.org/us-gaap/role/ref/otherTransitionRef
-Topic 280
-SubTopic 10
-Name Accounting Standards Codification
-Section 50
-Paragraph 32
-Subparagraph (a)
-Publisher FASB
-URI https://asc.fasb.org/1943274/2147482810/280-10-50-32
Reference 7: http://www.xbrl.org/2003/role/disclosureRef
-Topic 235
-SubTopic 10
-Name Accounting Standards Codification
-Section S99
-Paragraph 1
-Subparagraph (SX 210.4-08(g)(1)(ii))
-Publisher FASB
-URI https://asc.fasb.org/1943274/2147480678/235-10-S99-1
Reference 8: http://www.xbrl.org/2003/role/disclosureRef
-Topic 323
-SubTopic 10
-Name Accounting Standards Codification
-Section 50
-Paragraph 3
-Subparagraph (c)
-Publisher FASB
-URI https://asc.fasb.org/1943274/2147481687/323-10-50-3
Reference 9: http://www.xbrl.org/2003/role/disclosureRef
-Topic 825
-SubTopic 10
-Name Accounting Standards Codification
-Section 50
-Paragraph 28
-Subparagraph (f)
-Publisher FASB
-URI https://asc.fasb.org/1943274/2147482907/825-10-50-28
Reference 10: http://www.xbrl.org/2003/role/disclosureRef
-Topic 470
-SubTopic 10
-Name Accounting Standards Codification
-Section S99
-Paragraph 1A
-Subparagraph (SX 210.13-01(a)(4)(i))
-Publisher FASB
-URI https://asc.fasb.org/1943274/2147480097/470-10-S99-1A
Reference 11: http://www.xbrl.org/2009/role/commonPracticeRef
-Topic 470
-SubTopic 10
-Name Accounting Standards Codification
-Section S99
-Paragraph 1A
-Subparagraph (SX 210.13-01(a)(4)(ii))
-Publisher FASB
-URI https://asc.fasb.org/1943274/2147480097/470-10-S99-1A
Reference 12: http://www.xbrl.org/2003/role/disclosureRef
-Topic 470
-SubTopic 10
-Name Accounting Standards Codification
-Section S99
-Paragraph 1A
-Subparagraph (SX 210.13-01(a)(4)(iii)(A))
-Publisher FASB
-URI https://asc.fasb.org/1943274/2147480097/470-10-S99-1A
Reference 13: http://www.xbrl.org/2003/role/disclosureRef
-Topic 470
-SubTopic 10
-Name Accounting Standards Codification
-Section S99
-Paragraph 1A
-Subparagraph (SX 210.13-01(a)(4)(iv))
-Publisher FASB
-URI https://asc.fasb.org/1943274/2147480097/470-10-S99-1A
Reference 14: http://www.xbrl.org/2003/role/disclosureRef
-Topic 470
-SubTopic 10
-Name Accounting Standards Codification
-Section S99
-Paragraph 1A
-Subparagraph (SX 210.13-01(a)(5))
-Publisher FASB
-URI https://asc.fasb.org/1943274/2147480097/470-10-S99-1A
Reference 15: http://www.xbrl.org/2003/role/disclosureRef
-Topic 470
-SubTopic 10
-Name Accounting Standards Codification
-Section S99
-Paragraph 1B
-Subparagraph (SX 210.13-02(a)(4)(i))
-Publisher FASB
-URI https://asc.fasb.org/1943274/2147480097/470-10-S99-1B
Reference 16: http://www.xbrl.org/2003/role/disclosureRef
-Topic 470
-SubTopic 10
-Name Accounting Standards Codification
-Section S99
-Paragraph 1B
-Subparagraph (SX 210.13-02(a)(4)(iii)(A))
-Publisher FASB
-URI https://asc.fasb.org/1943274/2147480097/470-10-S99-1B
Reference 17: http://www.xbrl.org/2003/role/disclosureRef
-Topic 470
-SubTopic 10
-Name Accounting Standards Codification
-Section S99
-Paragraph 1B
-Subparagraph (SX 210.13-02(a)(4)(iii)(B))
-Publisher FASB
-URI https://asc.fasb.org/1943274/2147480097/470-10-S99-1B
Reference 18: http://www.xbrl.org/2003/role/disclosureRef
-Topic 470
-SubTopic 10
-Name Accounting Standards Codification
-Section S99
-Paragraph 1B
-Subparagraph (SX 210.13-02(a)(4)(iv))
-Publisher FASB
-URI https://asc.fasb.org/1943274/2147480097/470-10-S99-1B
Reference 19: http://www.xbrl.org/2003/role/disclosureRef
-Topic 470
-SubTopic 10
-Name Accounting Standards Codification
-Section S99
-Paragraph 1B
-Subparagraph (SX 210.13-02(a)(5))
-Publisher FASB
-URI https://asc.fasb.org/1943274/2147480097/470-10-S99-1B
Reference 20: http://www.xbrl.org/2003/role/disclosureRef
-Topic 280
-SubTopic 10
-Name Accounting Standards Codification
-Section 50
-Paragraph 30
-Subparagraph (a)
-Publisher FASB
-URI https://asc.fasb.org/1943274/2147482810/280-10-50-30
Reference 21: http://www.xbrl.org/2003/role/disclosureRef
-Topic 280
-SubTopic 10
-Name Accounting Standards Codification
-Section 50
-Paragraph 42
-Publisher FASB
-URI https://asc.fasb.org/1943274/2147482810/280-10-50-42
Reference 22: http://www.xbrl.org/2003/role/disclosureRef
-Topic 280
-SubTopic 10
-Name Accounting Standards Codification
-Section 50
-Paragraph 22
-Subparagraph (b)
-Publisher FASB
-URI https://asc.fasb.org/1943274/2147482810/280-10-50-22
Reference 23: http://www.xbrl.org/2003/role/disclosureRef
-Topic 280
-SubTopic 10
-Name Accounting Standards Codification
-Section 50
-Paragraph 40
-Publisher FASB
-URI https://asc.fasb.org/1943274/2147482810/280-10-50-40
Reference 24: http://www.xbrl.org/2003/role/disclosureRef
-Topic 280
-SubTopic 10
-Name Accounting Standards Codification
-Section 50
-Paragraph 22
-Subparagraph (a)
-Publisher FASB
-URI https://asc.fasb.org/1943274/2147482810/280-10-50-22
Reference 25: http://www.xbrl.org/2003/role/disclosureRef
-Topic 942
-SubTopic 235
-Name Accounting Standards Codification
-Section S99
-Paragraph 1
-Subparagraph (SX 210.9-05(b)(2))
-Publisher FASB
-URI https://asc.fasb.org/1943274/2147477314/942-235-S99-1
Reference 26: http://www.xbrl.org/2003/role/disclosureRef
-Topic 220
-SubTopic 10
-Name Accounting Standards Codification
-Section S99
-Paragraph 2
-Subparagraph (SX 210.5-03(1))
-Publisher FASB
-URI https://asc.fasb.org/1943274/2147483621/220-10-S99-2
| Name: |
us-gaap_Revenues |
| Namespace Prefix: |
us-gaap_ |
| Data Type: |
xbrli:monetaryItemType |
| Balance Type: |
credit |
| Period Type: |
duration |
|
| X |
- Details
| Name: |
us-gaap_StatementBusinessSegmentsAxis=tg_AluminumExtrusionsMember |
| Namespace Prefix: |
|
| Data Type: |
na |
| Balance Type: |
|
| Period Type: |
|
|
| X |
- Details
| Name: |
srt_ProductOrServiceAxis=tg_NonresidentialBuildingAndConstructionMember |
| Namespace Prefix: |
|
| Data Type: |
na |
| Balance Type: |
|
| Period Type: |
|
|
| X |
- Details
| Name: |
srt_ProductOrServiceAxis=tg_ConsumerDurablesMember |
| Namespace Prefix: |
|
| Data Type: |
na |
| Balance Type: |
|
| Period Type: |
|
|
| X |
- Details
| Name: |
srt_ProductOrServiceAxis=tg_AutomotiveMember |
| Namespace Prefix: |
|
| Data Type: |
na |
| Balance Type: |
|
| Period Type: |
|
|
| X |
- Details
| Name: |
srt_ProductOrServiceAxis=tg_ResidentialBuildingAndConstructionMember |
| Namespace Prefix: |
|
| Data Type: |
na |
| Balance Type: |
|
| Period Type: |
|
|
| X |
- Details
| Name: |
srt_ProductOrServiceAxis=tg_ElectricalMember |
| Namespace Prefix: |
|
| Data Type: |
na |
| Balance Type: |
|
| Period Type: |
|
|
| X |
- Details
| Name: |
srt_ProductOrServiceAxis=tg_MachineryandEquipmentBNLDomain |
| Namespace Prefix: |
|
| Data Type: |
na |
| Balance Type: |
|
| Period Type: |
|
|
| X |
- Details
| Name: |
srt_ProductOrServiceAxis=tg_DistributionMember |
| Namespace Prefix: |
|
| Data Type: |
na |
| Balance Type: |
|
| Period Type: |
|
|
| X |
- Details
| Name: |
srt_ProductOrServiceAxis=tg_AluminumExtrusionsSubtotalMember |
| Namespace Prefix: |
|
| Data Type: |
na |
| Balance Type: |
|
| Period Type: |
|
|
| X |
- Details
| Name: |
us-gaap_StatementBusinessSegmentsAxis=tg_PEFilmsMember |
| Namespace Prefix: |
|
| Data Type: |
na |
| Balance Type: |
|
| Period Type: |
|
|
| X |
- Details
| Name: |
srt_ProductOrServiceAxis=tg_SurfaceProtectionFilmsMember |
| Namespace Prefix: |
|
| Data Type: |
na |
| Balance Type: |
|
| Period Type: |
|
|
| X |
- Details
| Name: |
srt_ProductOrServiceAxis=tg_OverwrapPackagingMember |
| Namespace Prefix: |
|
| Data Type: |
na |
| Balance Type: |
|
| Period Type: |
|
|
| X |
- Details
| Name: |
srt_ProductOrServiceAxis=tg_FilmProductsSubtotalMember |
| Namespace Prefix: |
|
| Data Type: |
na |
| Balance Type: |
|
| Period Type: |
|
|
| X |
- Details
| Name: |
us-gaap_StatementBusinessSegmentsAxis=tg_FlexiblePackagingFilmsMemberDomain |
| Namespace Prefix: |
|
| Data Type: |
na |
| Balance Type: |
|
| Period Type: |
|
|
| X |
- Details
| Name: |
srt_StatementGeographicalAxis=country_US |
| Namespace Prefix: |
|
| Data Type: |
na |
| Balance Type: |
|
| Period Type: |
|
|
| X |
- Details
| Name: |
srt_StatementGeographicalAxis=srt_AsiaMember |
| Namespace Prefix: |
|
| Data Type: |
na |
| Balance Type: |
|
| Period Type: |
|
|
| X |
- Details
| Name: |
us-gaap_StatementBusinessSegmentsAxis=tg_ExportsFromUnitedStatesMember |
| Namespace Prefix: |
|
| Data Type: |
na |
| Balance Type: |
|
| Period Type: |
|
|
| X |
- Details
| Name: |
us-gaap_StatementBusinessSegmentsAxis=tg_OperationsOutsideUnitedStatesMember |
| Namespace Prefix: |
|
| Data Type: |
na |
| Balance Type: |
|
| Period Type: |
|
|
| X |
- Details
| Name: |
srt_StatementGeographicalAxis=srt_LatinAmericaMember |
| Namespace Prefix: |
|
| Data Type: |
na |
| Balance Type: |
|
| Period Type: |
|
|
| X |
- Details
| Name: |
srt_StatementGeographicalAxis=country_CA |
| Namespace Prefix: |
|
| Data Type: |
na |
| Balance Type: |
|
| Period Type: |
|
|
| X |
- Details
| Name: |
srt_StatementGeographicalAxis=srt_EuropeMember |
| Namespace Prefix: |
|
| Data Type: |
na |
| Balance Type: |
|
| Period Type: |
|
|
| X |
- Details
| Name: |
srt_StatementGeographicalAxis=country_BR |
| Namespace Prefix: |
|
| Data Type: |
na |
| Balance Type: |
|
| Period Type: |
|
|
v3.24.3
Debt (Details)
$ in Thousands, ¥ in Millions |
9 Months Ended |
|
|
|
Sep. 30, 2024
USD ($)
|
Sep. 30, 2024
CNY (¥)
|
Dec. 31, 2023
USD ($)
|
| Line of Credit Facility [Line Items] |
|
|
|
| Line of Credit Facility, Maximum Borrowing Capacity |
|
|
$ 180,000
|
| Line of Credit, Maximum Borrowing Capacity after ABL Adjustment Date |
$ 125,000
|
|
|
| Line of Credit Facility, Remaining Borrowing Capacity |
45,100
|
|
|
| ABL revolving facility (matures June 30, 2026) |
122,000
|
|
$ 126,322
|
| Letters of Credit Outstanding, Amount |
$ 12,900
|
|
|
| Cash Dominion Availability after ABL Adjustment Date |
0.125
|
0.125
|
|
| Minimum Liquidity under ABL Facility |
$ 10,000
|
|
|
| Minimum Availability before ABL Adjustment Date |
0.10
|
0.10
|
|
| Debt Instrument, Periodic Payment, Principal |
$ 1,700
|
|
|
| Terphane Brazil Loan |
|
|
|
| Line of Credit Facility [Line Items] |
|
|
|
| Debt Instrument, Basis Spread on Variable Rate |
5.99%
|
|
|
| Other Borrowings |
$ 20,000
|
|
|
| Debt Instrument, Interest Rate, Stated Percentage |
5.35%
|
5.35%
|
|
| Tredegar intercompany |
|
|
|
| Line of Credit Facility [Line Items] |
|
|
|
| Other Borrowings |
$ 20,000
|
|
|
| Guangzhou Tredegar Loan |
|
|
|
| Line of Credit Facility [Line Items] |
|
|
|
| Debt Instrument, Basis Spread on Variable Rate |
0.45%
|
|
|
| Other Borrowings |
$ 1,400
|
¥ 9.5
|
|
| Debt Instrument, Interest Rate, Stated Percentage |
3.35%
|
3.35%
|
|
| Debt Instrument, Collateral Amount | ¥ |
|
¥ 30.0
|
|
| ABL Revolving Facility |
|
|
|
| Line of Credit Facility [Line Items] |
|
|
|
| ABL revolving facility (matures June 30, 2026) |
$ 122,000
|
|
|
| Sep-24 [Member] |
|
|
|
| Line of Credit Facility [Line Items] |
|
|
|
| Minimum EBITDA |
25,370
|
|
|
| Oct-24 |
|
|
|
| Line of Credit Facility [Line Items] |
|
|
|
| Minimum EBITDA |
26,070
|
|
|
| Nov-24 |
|
|
|
| Line of Credit Facility [Line Items] |
|
|
|
| Minimum EBITDA |
27,640
|
|
|
| Dec-24 |
|
|
|
| Line of Credit Facility [Line Items] |
|
|
|
| Minimum EBITDA |
29,640
|
|
|
| Jan-25 |
|
|
|
| Line of Credit Facility [Line Items] |
|
|
|
| Minimum EBITDA |
29,740
|
|
|
| Feb-25 |
|
|
|
| Line of Credit Facility [Line Items] |
|
|
|
| Minimum EBITDA |
29,850
|
|
|
| Mar-25 |
|
|
|
| Line of Credit Facility [Line Items] |
|
|
|
| Minimum EBITDA |
29,980
|
|
|
| Apr-23 [Member] |
|
|
|
| Line of Credit Facility [Line Items] |
|
|
|
| Minimum EBITDA |
30,340
|
|
|
| May-23 [Member] |
|
|
|
| Line of Credit Facility [Line Items] |
|
|
|
| Minimum EBITDA |
30,700
|
|
|
| Jun-23 [Member] |
|
|
|
| Line of Credit Facility [Line Items] |
|
|
|
| Minimum EBITDA |
31,030
|
|
|
| Jul-23 [Member] |
|
|
|
| Line of Credit Facility [Line Items] |
|
|
|
| Minimum EBITDA |
31,370
|
|
|
| Aug-23 [Member] |
|
|
|
| Line of Credit Facility [Line Items] |
|
|
|
| Minimum EBITDA |
31,710
|
|
|
| Sep-23 [Member] |
|
|
|
| Line of Credit Facility [Line Items] |
|
|
|
| Minimum EBITDA |
$ 32,080
|
|
|
| over 66% of $125 million aggregate commitment |
|
|
|
| Line of Credit Facility [Line Items] |
|
|
|
| Credit Spread Over London Interbank Offered Rate Basis Points |
2.25%
|
|
|
| Credit Spread over Alternate Base Rate Basis Points |
0.01250
|
0.01250
|
|
| Commitment Fee on Credit Facility, basis points |
0.00400
|
|
|
| less than 66% but over 33% of $125 million aggregate commitment |
|
|
|
| Line of Credit Facility [Line Items] |
|
|
|
| Credit Spread Over London Interbank Offered Rate Basis Points |
2.50%
|
|
|
| Credit Spread over Alternate Base Rate Basis Points |
0.01500
|
0.01500
|
|
| Commitment Fee on Credit Facility, basis points |
0.00400
|
|
|
| less than 33% of $125 million aggregate commitment |
|
|
|
| Line of Credit Facility [Line Items] |
|
|
|
| Credit Spread Over London Interbank Offered Rate Basis Points |
2.75%
|
|
|
| Credit Spread over Alternate Base Rate Basis Points |
0.01750
|
0.01750
|
|
| Commitment Fee on Credit Facility, basis points |
0.00400
|
|
|
| Base Rate |
|
|
|
| Line of Credit Facility [Line Items] |
|
|
|
| Debt Instrument, Basis Spread on Variable Rate |
2.50%
|
|
|
| Secured Overnight Financing Rate (SOFR) |
|
|
|
| Line of Credit Facility [Line Items] |
|
|
|
| Debt Instrument, Basis Spread on Variable Rate |
3.50%
|
|
|
| X |
- DefinitionCash Dominion Availability after ABL Adjustment Date
| Name: |
tg_CashDominionAvailabilityAfterABLAdjustmentDate |
| Namespace Prefix: |
tg_ |
| Data Type: |
xbrli:pureItemType |
| Balance Type: |
na |
| Period Type: |
instant |
|
| X |
- DefinitionCommitment Fee on Credit Facility, basis points
| Name: |
tg_CommitmentFeeOnCreditFacilityBasisPoints |
| Namespace Prefix: |
tg_ |
| Data Type: |
xbrli:pureItemType |
| Balance Type: |
na |
| Period Type: |
duration |
|
| X |
- DefinitionCredit Spread over Alternate Base Rate Basis Points
| Name: |
tg_CreditSpreadOverAlternateBaseRateBasisPoints |
| Namespace Prefix: |
tg_ |
| Data Type: |
xbrli:pureItemType |
| Balance Type: |
na |
| Period Type: |
instant |
|
| X |
- DefinitionCredit spread over SOFR basis points.
| Name: |
tg_CreditSpreadOverSecuredOvernightFinancingRateBasisPoints |
| Namespace Prefix: |
tg_ |
| Data Type: |
dtr-types1:percentItemType |
| Balance Type: |
na |
| Period Type: |
duration |
|
| X |
- DefinitionLine of Credit, Maximum Borrowing Capacity after ABL Adjustment Date
| Name: |
tg_LineOfCreditMaximumBorrowingCapacityAfterABLAdjustmentDate |
| Namespace Prefix: |
tg_ |
| Data Type: |
xbrli:monetaryItemType |
| Balance Type: |
credit |
| Period Type: |
instant |
|
| X |
- DefinitionMinimum Availability before ABL Adjustment Date
| Name: |
tg_MinimumAvailabilityBeforeABLAdjustmentDate |
| Namespace Prefix: |
tg_ |
| Data Type: |
xbrli:pureItemType |
| Balance Type: |
na |
| Period Type: |
instant |
|
| X |
- DefinitionMinimum Liquidity under ABL Facility
| Name: |
tg_MinimumLiquidityUnderABLFacility |
| Namespace Prefix: |
tg_ |
| Data Type: |
xbrli:monetaryItemType |
| Balance Type: |
debit |
| Period Type: |
instant |
|
| X |
- DefinitionPercentage points added to the reference rate to compute the variable rate on the debt instrument.
| Name: |
us-gaap_DebtInstrumentBasisSpreadOnVariableRate1 |
| Namespace Prefix: |
us-gaap_ |
| Data Type: |
dtr-types:percentItemType |
| Balance Type: |
na |
| Period Type: |
duration |
|
| X |
- DefinitionAmount of assets pledged to secure a debt instrument. Reference 1: http://fasb.org/us-gaap/role/ref/legacyRef
-Name Accounting Standards Codification
-Topic 942
-SubTopic 470
-Section 50
-Paragraph 3
-Subparagraph (d)
-Publisher FASB
-URI https://asc.fasb.org/1943274/2147477734/942-470-50-3
| Name: |
us-gaap_DebtInstrumentCollateralAmount |
| Namespace Prefix: |
us-gaap_ |
| Data Type: |
xbrli:monetaryItemType |
| Balance Type: |
debit |
| Period Type: |
instant |
|
| X |
- DefinitionContractual interest rate for funds borrowed, under the debt agreement. Reference 1: http://fasb.org/us-gaap/role/ref/legacyRef
-Topic 210
-SubTopic 10
-Name Accounting Standards Codification
-Section S99
-Paragraph 1
-Subparagraph (SX 210.5-02(22)(a)(1))
-Publisher FASB
-URI https://asc.fasb.org/1943274/2147480566/210-10-S99-1
Reference 2: http://www.xbrl.org/2003/role/disclosureRef
-Topic 470
-SubTopic 20
-Name Accounting Standards Codification
-Section 50
-Paragraph 1B
-Subparagraph (b)
-Publisher FASB
-URI https://asc.fasb.org/1943274/2147481139/470-20-50-1B
| Name: |
us-gaap_DebtInstrumentInterestRateStatedPercentage |
| Namespace Prefix: |
us-gaap_ |
| Data Type: |
dtr-types:percentItemType |
| Balance Type: |
na |
| Period Type: |
instant |
|
| X |
- DefinitionAmount of the required periodic payments applied to principal. Reference 1: http://fasb.org/us-gaap/role/ref/legacyRef
-Name Accounting Standards Codification
-Section S99
-Paragraph 1
-Subparagraph (SX 210.5-02(22))
-SubTopic 10
-Topic 210
-Publisher FASB
-URI https://asc.fasb.org/1943274/2147480566/210-10-S99-1
| Name: |
us-gaap_DebtInstrumentPeriodicPaymentPrincipal |
| Namespace Prefix: |
us-gaap_ |
| Data Type: |
xbrli:monetaryItemType |
| Balance Type: |
debit |
| Period Type: |
duration |
|
| X |
- DefinitionThe total amount of the contingent obligation under letters of credit outstanding as of the reporting date.
| Name: |
us-gaap_LettersOfCreditOutstandingAmount |
| Namespace Prefix: |
us-gaap_ |
| Data Type: |
xbrli:monetaryItemType |
| Balance Type: |
credit |
| Period Type: |
instant |
|
| X |
- DefinitionLine items represent financial concepts included in a table. These concepts are used to disclose reportable information associated with domain members defined in one or many axes to the table. Reference 1: http://www.xbrl.org/2003/role/disclosureRef
-Topic 470
-SubTopic 10
-Name Accounting Standards Codification
-Section 50
-Paragraph 6
-Subparagraph (b)
-Publisher FASB
-URI https://asc.fasb.org/1943274/2147481544/470-10-50-6
Reference 2: http://www.xbrl.org/2009/role/commonPracticeRef
-Topic 470
-SubTopic 10
-Name Accounting Standards Codification
-Section 50
-Paragraph 6
-Subparagraph (a)
-Publisher FASB
-URI https://asc.fasb.org/1943274/2147481544/470-10-50-6
Reference 3: http://www.xbrl.org/2009/role/commonPracticeRef
-Topic 235
-SubTopic 10
-Name Accounting Standards Codification
-Section S99
-Paragraph 1
-Subparagraph (SX 210.4-08(f))
-Publisher FASB
-URI https://asc.fasb.org/1943274/2147480678/235-10-S99-1
| Name: |
us-gaap_LineOfCreditFacilityLineItems |
| Namespace Prefix: |
us-gaap_ |
| Data Type: |
xbrli:stringItemType |
| Balance Type: |
na |
| Period Type: |
duration |
|
| X |
- DefinitionMaximum borrowing capacity under the credit facility without consideration of any current restrictions on the amount that could be borrowed or the amounts currently outstanding under the facility. Reference 1: http://fasb.org/us-gaap/role/ref/legacyRef
-Topic 210
-SubTopic 10
-Name Accounting Standards Codification
-Section S99
-Paragraph 1
-Subparagraph (SX 210.5-02(22)(b))
-Publisher FASB
-URI https://asc.fasb.org/1943274/2147480566/210-10-S99-1
Reference 2: http://fasb.org/us-gaap/role/ref/legacyRef
-Topic 210
-SubTopic 10
-Name Accounting Standards Codification
-Section S99
-Paragraph 1
-Subparagraph (SX 210.5-02(19)(b))
-Publisher FASB
-URI https://asc.fasb.org/1943274/2147480566/210-10-S99-1
| Name: |
us-gaap_LineOfCreditFacilityMaximumBorrowingCapacity |
| Namespace Prefix: |
us-gaap_ |
| Data Type: |
xbrli:monetaryItemType |
| Balance Type: |
credit |
| Period Type: |
instant |
|
| X |
- DefinitionAmount of borrowing capacity currently available under the credit facility (current borrowing capacity less the amount of borrowings outstanding). Reference 1: http://www.xbrl.org/2003/role/disclosureRef
-Topic 470
-SubTopic 10
-Name Accounting Standards Codification
-Section 50
-Paragraph 6
-Subparagraph (b)
-Publisher FASB
-URI https://asc.fasb.org/1943274/2147481544/470-10-50-6
Reference 2: http://fasb.org/us-gaap/role/ref/legacyRef
-Topic 210
-SubTopic 10
-Name Accounting Standards Codification
-Section S99
-Paragraph 1
-Subparagraph (SX 210.5-02(22)(b))
-Publisher FASB
-URI https://asc.fasb.org/1943274/2147480566/210-10-S99-1
Reference 3: http://fasb.org/us-gaap/role/ref/legacyRef
-Topic 210
-SubTopic 10
-Name Accounting Standards Codification
-Section S99
-Paragraph 1
-Subparagraph (SX 210.5-02(19)(b))
-Publisher FASB
-URI https://asc.fasb.org/1943274/2147480566/210-10-S99-1
| Name: |
us-gaap_LineOfCreditFacilityRemainingBorrowingCapacity |
| Namespace Prefix: |
us-gaap_ |
| Data Type: |
xbrli:monetaryItemType |
| Balance Type: |
credit |
| Period Type: |
instant |
|
| X |
- DefinitionThe carrying value as of the balance sheet date of the current portion of long-term obligations drawn from a line of credit, which is a bank's commitment to make loans up to a specific amount. Examples of items that might be included in the application of this element may consist of letters of credit, standby letters of credit, and revolving credit arrangements, under which borrowings can be made up to a maximum amount as of any point in time conditional on satisfaction of specified terms before, as of and after the date of drawdowns on the line. Includes short-term obligations that would normally be classified as current liabilities but for which (a) postbalance sheet date issuance of a long term obligation to refinance the short term obligation on a long term basis, or (b) the enterprise has entered into a financing agreement that clearly permits the enterprise to refinance the short-term obligation on a long term basis and the following conditions are met (1) the agreement does not expire within 1 year and is not cancelable by the lender except for violation of an objectively determinable provision, (2) no violation exists at the BS date, and (3) the lender has entered into the financing agreement is expected to be financially capable of honoring the agreement. Reference 1: http://fasb.org/us-gaap/role/ref/legacyRef
-Topic 210
-SubTopic 10
-Name Accounting Standards Codification
-Section S99
-Paragraph 1
-Subparagraph (SX 210.5-02(19))
-Publisher FASB
-URI https://asc.fasb.org/1943274/2147480566/210-10-S99-1
Reference 2: http://fasb.org/us-gaap/role/ref/legacyRef
-Topic 942
-SubTopic 210
-Name Accounting Standards Codification
-Section S99
-Paragraph 1
-Subparagraph (SX 210.9-03(13))
-Publisher FASB
-URI https://asc.fasb.org/1943274/2147478546/942-210-S99-1
| Name: |
us-gaap_LinesOfCreditCurrent |
| Namespace Prefix: |
us-gaap_ |
| Data Type: |
xbrli:monetaryItemType |
| Balance Type: |
credit |
| Period Type: |
instant |
|
| X |
- DefinitionThe carrying amount as of the balance sheet date for the aggregate of other miscellaneous borrowings owed by the reporting entity. Reference 1: http://fasb.org/us-gaap/role/ref/legacyRef
-Topic 942
-SubTopic 210
-Name Accounting Standards Codification
-Section S99
-Paragraph 1
-Subparagraph (SX 210.9-03(16))
-Publisher FASB
-URI https://asc.fasb.org/1943274/2147478546/942-210-S99-1
Reference 2: http://fasb.org/us-gaap/role/ref/legacyRef
-Topic 942
-SubTopic 210
-Name Accounting Standards Codification
-Section S99
-Paragraph 1
-Subparagraph (SX 210.9-03(13))
-Publisher FASB
-URI https://asc.fasb.org/1943274/2147478546/942-210-S99-1
| Name: |
us-gaap_OtherBorrowings |
| Namespace Prefix: |
us-gaap_ |
| Data Type: |
xbrli:monetaryItemType |
| Balance Type: |
credit |
| Period Type: |
instant |
|
| X |
- Details
| Name: |
us-gaap_DebtInstrumentAxis=tg_TerphaneBrazilLoanMember |
| Namespace Prefix: |
|
| Data Type: |
na |
| Balance Type: |
|
| Period Type: |
|
|
| X |
- Details
| Name: |
us-gaap_DebtInstrumentAxis=tg_TredegarIntercompanyMember |
| Namespace Prefix: |
|
| Data Type: |
na |
| Balance Type: |
|
| Period Type: |
|
|
| X |
- Details
| Name: |
us-gaap_DebtInstrumentAxis=tg_GuangzhouTredegarLoanMember |
| Namespace Prefix: |
|
| Data Type: |
na |
| Balance Type: |
|
| Period Type: |
|
|
| X |
- Details
| Name: |
us-gaap_DebtInstrumentAxis=tg_ABLRevolvingFacilityMember |
| Namespace Prefix: |
|
| Data Type: |
na |
| Balance Type: |
|
| Period Type: |
|
|
| X |
- Details
| Name: |
tg_MinimumEBITDAAxis=tg_Sep24Member |
| Namespace Prefix: |
|
| Data Type: |
na |
| Balance Type: |
|
| Period Type: |
|
|
| X |
- Details
| Name: |
tg_MinimumEBITDAAxis=tg_Oct24Member |
| Namespace Prefix: |
|
| Data Type: |
na |
| Balance Type: |
|
| Period Type: |
|
|
| X |
- Details
| Name: |
tg_MinimumEBITDAAxis=tg_Nov24Member |
| Namespace Prefix: |
|
| Data Type: |
na |
| Balance Type: |
|
| Period Type: |
|
|
| X |
- Details
| Name: |
tg_MinimumEBITDAAxis=tg_Dec24Member |
| Namespace Prefix: |
|
| Data Type: |
na |
| Balance Type: |
|
| Period Type: |
|
|
| X |
- Details
| Name: |
tg_MinimumEBITDAAxis=tg_Jan25Member |
| Namespace Prefix: |
|
| Data Type: |
na |
| Balance Type: |
|
| Period Type: |
|
|
| X |
- Details
| Name: |
tg_MinimumEBITDAAxis=tg_Feb25Member |
| Namespace Prefix: |
|
| Data Type: |
na |
| Balance Type: |
|
| Period Type: |
|
|
| X |
- Details
| Name: |
tg_MinimumEBITDAAxis=tg_Mar25Member |
| Namespace Prefix: |
|
| Data Type: |
na |
| Balance Type: |
|
| Period Type: |
|
|
| X |
- Details
| Name: |
tg_MinimumEBITDAAxis=tg_Apr25Member |
| Namespace Prefix: |
|
| Data Type: |
na |
| Balance Type: |
|
| Period Type: |
|
|
| X |
- Details
| Name: |
tg_MinimumEBITDAAxis=tg_May25Member |
| Namespace Prefix: |
|
| Data Type: |
na |
| Balance Type: |
|
| Period Type: |
|
|
| X |
- Details
| Name: |
tg_MinimumEBITDAAxis=tg_Jun25Member |
| Namespace Prefix: |
|
| Data Type: |
na |
| Balance Type: |
|
| Period Type: |
|
|
| X |
- Details
| Name: |
tg_MinimumEBITDAAxis=tg_Jul25Member |
| Namespace Prefix: |
|
| Data Type: |
na |
| Balance Type: |
|
| Period Type: |
|
|
| X |
- Details
| Name: |
tg_MinimumEBITDAAxis=tg_Aug25Member |
| Namespace Prefix: |
|
| Data Type: |
na |
| Balance Type: |
|
| Period Type: |
|
|
| X |
- Details
| Name: |
tg_MinimumEBITDAAxis=tg_Sep25Member |
| Namespace Prefix: |
|
| Data Type: |
na |
| Balance Type: |
|
| Period Type: |
|
|
| X |
- Details
| Name: |
us-gaap_CreditFacilityAxis=tg_Over66Of125MillionAggregateCommitmentMember |
| Namespace Prefix: |
|
| Data Type: |
na |
| Balance Type: |
|
| Period Type: |
|
|
| X |
- Details
| Name: |
us-gaap_CreditFacilityAxis=tg_LessThan66ButOver33Of125MillionAggregateCommitmentMember |
| Namespace Prefix: |
|
| Data Type: |
na |
| Balance Type: |
|
| Period Type: |
|
|
| X |
- Details
| Name: |
us-gaap_CreditFacilityAxis=tg_LessThan33Of125MillionAggregateCommitmentMember |
| Namespace Prefix: |
|
| Data Type: |
na |
| Balance Type: |
|
| Period Type: |
|
|
| X |
- Details
| Name: |
us-gaap_VariableRateAxis=us-gaap_BaseRateMember |
| Namespace Prefix: |
|
| Data Type: |
na |
| Balance Type: |
|
| Period Type: |
|
|
| X |
- Details
| Name: |
us-gaap_VariableRateAxis=us-gaap_SecuredOvernightFinancingRateSofrMember |
| Namespace Prefix: |
|
| Data Type: |
na |
| Balance Type: |
|
| Period Type: |
|
|
v3.24.3
Subsequent Events - Narrative (Details) - USD ($)
$ in Thousands |
3 Months Ended |
9 Months Ended |
Sep. 30, 2024 |
Sep. 30, 2023 |
Sep. 30, 2024 |
Sep. 30, 2023 |
| Subsequent Event [Line Items] |
|
|
|
|
| Business Combination, Consideration Transferred, Other |
|
|
$ 116,000
|
|
| Proceeds from Divestiture of Businesses, Net of Cash Divested |
|
|
60,000
|
|
| Disposal Group, Including Discontinued Operation, Cash and Cash Equivalents |
$ 2,000
|
|
2,000
|
|
| Proceeds from Divestiture of Businesses |
|
|
78,000
|
|
| Proceeds from Divested Business in Escrow |
7,000
|
|
7,000
|
|
| Gain (Loss) on Disposition of Business |
|
|
72,500
|
|
| Gain (Loss) on Disposition of Business, net of tax |
|
|
65,500
|
|
| Other Comprehensive Income (Loss), Foreign Currency Transaction and Translation Reclassification Adjustment from AOCI, Realized upon Sale or Liquidation, before Tax |
|
|
100,000
|
|
| Flexible Packaging Films [Member] |
|
|
|
|
| Subsequent Event [Line Items] |
|
|
|
|
| Net Assets |
36,000
|
|
36,000
|
|
| Earnings before interest, taxes, depreciation and amortization (EBITDA) |
3,749
|
$ 477
|
8,915
|
$ 2,076
|
| Tredegar intercompany |
|
|
|
|
| Subsequent Event [Line Items] |
|
|
|
|
| Disposal Group, Including Discontinued Operation, Liabilities |
$ 20,000
|
|
$ 20,000
|
|
| X |
- DefinitionEarnings before interest, taxes, depreciation and amortization (EBITDA)
| Name: |
tg_EarningsBeforeInterestTaxesDepreciationAndAmortizationEBITDA |
| Namespace Prefix: |
tg_ |
| Data Type: |
xbrli:monetaryItemType |
| Balance Type: |
debit |
| Period Type: |
duration |
|
| X |
- DefinitionGain (Loss) on Disposition of Business, net of tax
| Name: |
tg_GainLossOnDispositionOfBusinessNetOfTax |
| Namespace Prefix: |
tg_ |
| Data Type: |
xbrli:monetaryItemType |
| Balance Type: |
debit |
| Period Type: |
duration |
|
| X |
- DefinitionProceeds from Divested Business in Escrow
| Name: |
tg_ProceedsFromDivestedBusinessInEscrow |
| Namespace Prefix: |
tg_ |
| Data Type: |
xbrli:monetaryItemType |
| Balance Type: |
debit |
| Period Type: |
instant |
|
| X |
- DefinitionAmount of net assets (liabilities). Reference 1: http://fasb.org/us-gaap/role/ref/legacyRef
-Name Accounting Standards Codification
-Section 50
-Paragraph 1
-SubTopic 30
-Topic 205
-Publisher FASB
-URI https://asc.fasb.org/1943274/2147479910/205-30-50-1
| Name: |
us-gaap_AssetsNet |
| Namespace Prefix: |
us-gaap_ |
| Data Type: |
xbrli:monetaryItemType |
| Balance Type: |
debit |
| Period Type: |
instant |
|
| X |
- DefinitionAmount of tangible or intangible assets, including a business or subsidiary of the acquirer transferred by the entity to the former owners of the acquiree. Excludes cash. Reference 1: http://fasb.org/us-gaap/role/ref/legacyRef
-Name Accounting Standards Codification
-Section 50
-Paragraph 1
-Subparagraph (b)(2)
-SubTopic 30
-Topic 805
-Publisher FASB
-URI https://asc.fasb.org/1943274/2147479581/805-30-50-1
| Name: |
us-gaap_BusinessCombinationConsiderationTransferredOther1 |
| Namespace Prefix: |
us-gaap_ |
| Data Type: |
xbrli:monetaryItemType |
| Balance Type: |
credit |
| Period Type: |
duration |
|
| X |
- DefinitionAmount classified as cash and cash equivalents attributable to disposal group held for sale or disposed of. Reference 1: http://fasb.org/us-gaap/role/ref/legacyRef
-Name Accounting Standards Codification
-Section 45
-Paragraph 10
-SubTopic 20
-Topic 205
-Publisher FASB
-URI https://asc.fasb.org/1943274/2147483475/205-20-45-10
Reference 2: http://fasb.org/us-gaap/role/ref/legacyRef
-Topic 205
-SubTopic 20
-Name Accounting Standards Codification
-Section 50
-Paragraph 5B
-Subparagraph (e)
-Publisher FASB
-URI https://asc.fasb.org/1943274/2147483499/205-20-50-5B
Reference 3: http://fasb.org/us-gaap/role/ref/legacyRef
-Topic 360
-SubTopic 10
-Name Accounting Standards Codification
-Section 50
-Paragraph 3
-Subparagraph (e)
-Publisher FASB
-URI https://asc.fasb.org/1943274/2147482099/360-10-50-3
Reference 4: http://fasb.org/us-gaap/role/ref/legacyRef
-Topic 205
-SubTopic 20
-Name Accounting Standards Codification
-Section 45
-Paragraph 11
-Publisher FASB
-URI https://asc.fasb.org/1943274/2147483475/205-20-45-11
| Name: |
us-gaap_DisposalGroupIncludingDiscontinuedOperationCashAndCashEquivalents |
| Namespace Prefix: |
us-gaap_ |
| Data Type: |
xbrli:monetaryItemType |
| Balance Type: |
debit |
| Period Type: |
instant |
|
| X |
- DefinitionAmount of gain (loss) from sale and disposal of integrated set of activities and assets capable of being conducted and managed for purpose of providing return in form of dividend, lower cost, or other economic benefit to investor, owner, member and participant. Reference 1: http://www.xbrl.org/2009/role/commonPracticeRef
-Topic 230
-SubTopic 10
-Name Accounting Standards Codification
-Section 45
-Paragraph 28
-Subparagraph (b)
-Publisher FASB
-URI https://asc.fasb.org/1943274/2147482740/230-10-45-28
Reference 2: http://www.xbrl.org/2003/role/disclosureRef
-Topic 810
-SubTopic 10
-Name Accounting Standards Codification
-Section 50
-Paragraph 1B
-Subparagraph (a)
-Publisher FASB
-URI https://asc.fasb.org/1943274/2147481203/810-10-50-1B
| Name: |
us-gaap_GainLossOnSaleOfBusiness |
| Namespace Prefix: |
us-gaap_ |
| Data Type: |
xbrli:monetaryItemType |
| Balance Type: |
credit |
| Period Type: |
duration |
|
| X |
- DefinitionAmount classified as liabilities attributable to disposal group held for sale or disposed of. Reference 1: http://fasb.org/us-gaap/role/ref/legacyRef
-Name Accounting Standards Codification
-Section 45
-Paragraph 10
-SubTopic 20
-Topic 205
-Publisher FASB
-URI https://asc.fasb.org/1943274/2147483475/205-20-45-10
Reference 2: http://www.xbrl.org/2003/role/disclosureRef
-Topic 205
-SubTopic 20
-Name Accounting Standards Codification
-Section 50
-Paragraph 7
-Publisher FASB
-URI https://asc.fasb.org/1943274/2147483499/205-20-50-7
Reference 3: http://www.xbrl.org/2003/role/disclosureRef
-Topic 205
-SubTopic 20
-Name Accounting Standards Codification
-Section 50
-Paragraph 5C
-Subparagraph (a)(2)
-Publisher FASB
-URI https://asc.fasb.org/1943274/2147483499/205-20-50-5C
Reference 4: http://fasb.org/us-gaap/role/ref/legacyRef
-Topic 205
-SubTopic 20
-Name Accounting Standards Codification
-Section 50
-Paragraph 5B
-Subparagraph (e)
-Publisher FASB
-URI https://asc.fasb.org/1943274/2147483499/205-20-50-5B
Reference 5: http://fasb.org/us-gaap/role/ref/legacyRef
-Topic 360
-SubTopic 10
-Name Accounting Standards Codification
-Section 50
-Paragraph 3
-Subparagraph (e)
-Publisher FASB
-URI https://asc.fasb.org/1943274/2147482099/360-10-50-3
Reference 6: http://fasb.org/us-gaap/role/ref/legacyRef
-Topic 205
-SubTopic 20
-Name Accounting Standards Codification
-Section 45
-Paragraph 11
-Publisher FASB
-URI https://asc.fasb.org/1943274/2147483475/205-20-45-11
| Name: |
us-gaap_LiabilitiesOfDisposalGroupIncludingDiscontinuedOperation |
| Namespace Prefix: |
us-gaap_ |
| Data Type: |
xbrli:monetaryItemType |
| Balance Type: |
credit |
| Period Type: |
instant |
|
| X |
- DefinitionAmount before tax of reclassification adjustment from accumulated other comprehensive income for translation gain (loss) realized upon the sale or liquidation of an investment in a foreign entity and foreign currency hedges that are designated and qualified as hedging instruments for hedges of the foreign currency exposure of a net investment in a foreign operation. Reference 1: http://fasb.org/us-gaap/role/ref/legacyRef
-Name Accounting Standards Codification
-Section 45
-Paragraph 15
-SubTopic 10
-Topic 220
-Publisher FASB
-URI https://asc.fasb.org/1943274/2147482790/220-10-45-15
Reference 2: http://fasb.org/us-gaap/role/ref/legacyRef
-Topic 220
-SubTopic 10
-Name Accounting Standards Codification
-Section 45
-Paragraph 11
-Publisher FASB
-URI https://asc.fasb.org/1943274/2147482790/220-10-45-11
Reference 3: http://www.xbrl.org/2003/role/disclosureRef
-Topic 830
-SubTopic 30
-Name Accounting Standards Codification
-Section 40
-Paragraph 1
-Publisher FASB
-URI https://asc.fasb.org/1943274/2147481724/830-30-40-1
Reference 4: http://www.xbrl.org/2003/role/disclosureRef
-Topic 220
-SubTopic 10
-Name Accounting Standards Codification
-Section 45
-Paragraph 17A
-Publisher FASB
-URI https://asc.fasb.org/1943274/2147482790/220-10-45-17A
Reference 5: http://fasb.org/us-gaap/role/ref/legacyRef
-Name Accounting Standards Codification
-Section 45
-Paragraph 16
-SubTopic 10
-Topic 220
-Publisher FASB
-URI https://asc.fasb.org/1943274/2147482790/220-10-45-16
| Name: |
us-gaap_OtherComprehensiveIncomeLossForeignCurrencyTransactionAndTranslationReclassificationAdjustmentFromAOCIRealizedUponSaleOrLiquidationBeforeTax |
| Namespace Prefix: |
us-gaap_ |
| Data Type: |
xbrli:monetaryItemType |
| Balance Type: |
debit |
| Period Type: |
duration |
|
| X |
- DefinitionThe cash inflow associated with the amount received from the sale of a portion of the company's business, for example a segment, division, branch or other business, during the period. Reference 1: http://fasb.org/us-gaap/role/ref/legacyRef
-Name Accounting Standards Codification
-Topic 230
-SubTopic 10
-Section 45
-Paragraph 12
-Subparagraph (b)
-Publisher FASB
-URI https://asc.fasb.org/1943274/2147482740/230-10-45-12
| Name: |
us-gaap_ProceedsFromDivestitureOfBusinesses |
| Namespace Prefix: |
us-gaap_ |
| Data Type: |
xbrli:monetaryItemType |
| Balance Type: |
debit |
| Period Type: |
duration |
|
| X |
- DefinitionThis element represents the cash inflow during the period from the sale of a component of the entity. Reference 1: http://fasb.org/us-gaap/role/ref/legacyRef
-Name Accounting Standards Codification
-Topic 230
-SubTopic 10
-Section 45
-Paragraph 12
-Subparagraph (b)
-Publisher FASB
-URI https://asc.fasb.org/1943274/2147482740/230-10-45-12
| Name: |
us-gaap_ProceedsFromDivestitureOfBusinessesNetOfCashDivested |
| Namespace Prefix: |
us-gaap_ |
| Data Type: |
xbrli:monetaryItemType |
| Balance Type: |
debit |
| Period Type: |
duration |
|
| X |
- DefinitionDetail information of subsequent event by type. User is expected to use existing line items from elsewhere in the taxonomy as the primary line items for this disclosure, which is further associated with dimension and member elements pertaining to a subsequent event. Reference 1: http://www.xbrl.org/2003/role/disclosureRef
-Topic 830
-SubTopic 30
-Name Accounting Standards Codification
-Section 50
-Paragraph 2
-Publisher FASB
-URI https://asc.fasb.org/1943274/2147481674/830-30-50-2
Reference 2: http://www.xbrl.org/2003/role/disclosureRef
-Topic 855
-SubTopic 10
-Name Accounting Standards Codification
-Section 50
-Paragraph 2
-Publisher FASB
-URI https://asc.fasb.org/1943274/2147483399/855-10-50-2
| Name: |
us-gaap_SubsequentEventLineItems |
| Namespace Prefix: |
us-gaap_ |
| Data Type: |
xbrli:stringItemType |
| Balance Type: |
na |
| Period Type: |
duration |
|
| X |
- Details
| Name: |
us-gaap_StatementBusinessSegmentsAxis=tg_FlexiblePackagingFilmsMember |
| Namespace Prefix: |
|
| Data Type: |
na |
| Balance Type: |
|
| Period Type: |
|
|
| X |
- Details
| Name: |
us-gaap_DebtInstrumentAxis=tg_TredegarIntercompanyMember |
| Namespace Prefix: |
|
| Data Type: |
na |
| Balance Type: |
|
| Period Type: |
|
|
Tredegar (NYSE:TG)
Graphique Historique de l'Action
De Déc 2024 à Jan 2025

Tredegar (NYSE:TG)
Graphique Historique de l'Action
De Jan 2024 à Jan 2025
