Exxon On Pace for Lowest Close Since September 2010 -- Data Talk
31 Janvier 2020 - 9:00PM
Dow Jones News
Exxon Mobil Corporation (XOM) is currently at $61.95, down $2.84
or 4.38%
-- Would be lowest close since Sept. 30, 2010, when it closed at
$61.79
-- On pace for largest percent decrease since Feb. 5, 2018, when
it fell 5.69%
-- Earlier Friday, Exxon Mobil reported full-year profit of
$14.3 billion, down 31% from $20.8 billion the year before, and the
third lowest this century, according to FactSet. Revenue was down
nearly 9%, from $290 billion in 2018 to about $265 billion last
year
-- CFRA cut its price target on Exxon to $69.00/share from
$73.00/share, Benzinga reported
-- Currently down 12 of the past 13 days
-- Down 11.22% month-to-date; on pace for worst month since May
2019, when it fell 11.85%
-- Down 11.22% year-to-date
-- Down 40.65% from its all-time closing high of $104.38 on June
23, 2014
-- Down 18.40% from 52 weeks ago (Feb. 1, 2019), when it closed
at $75.92
-- Down 25.7% from its 52 week closing high of $83.38 on April
23, 2019
-- Would be a new 52 week closing low
-- Traded as low as $61.86; lowest intraday level since Oct. 4,
2010, when it hit $61.84
-- Down 4.52% at today's intraday low; largest intraday percent
decrease since April 27, 2018, when it fell as much as 5.42%
-- Second worst performer in the DJIA today
-- Sixth most active stock in the S&P 500 today
-- Subtracted 19.26 points from the DJIA so far today
-- All data as of 2:17:20 PM
Source: Dow Jones Market Data, FactSet
(END) Dow Jones Newswires
January 31, 2020 14:45 ET (19:45 GMT)
Copyright (c) 2020 Dow Jones & Company, Inc.
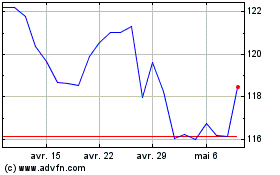
Exxon Mobil (NYSE:XOM)
Graphique Historique de l'Action
De Juin 2024 à Juil 2024

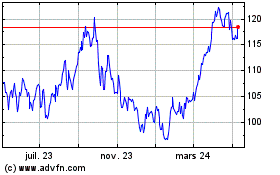
Exxon Mobil (NYSE:XOM)
Graphique Historique de l'Action
De Juil 2023 à Juil 2024
