Japan Gold Corporation (QB) (JGLDF)
USOTC
 Hot Features
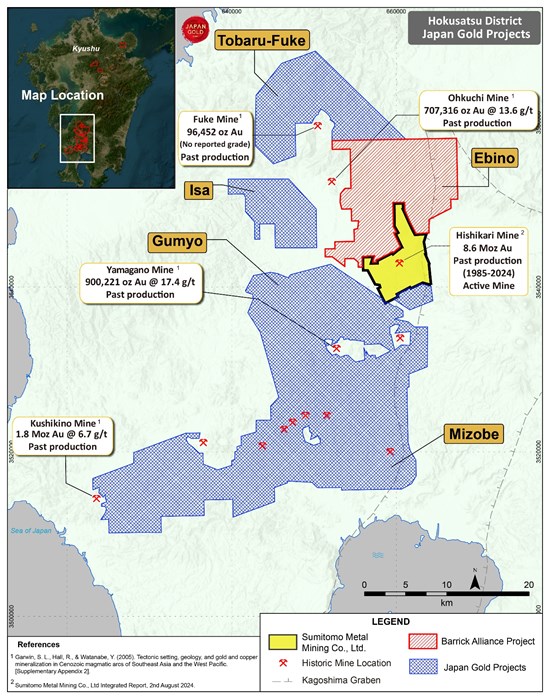
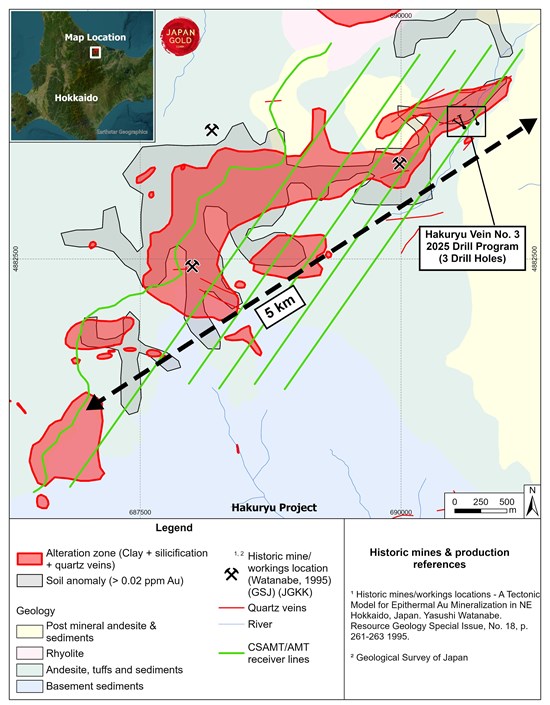
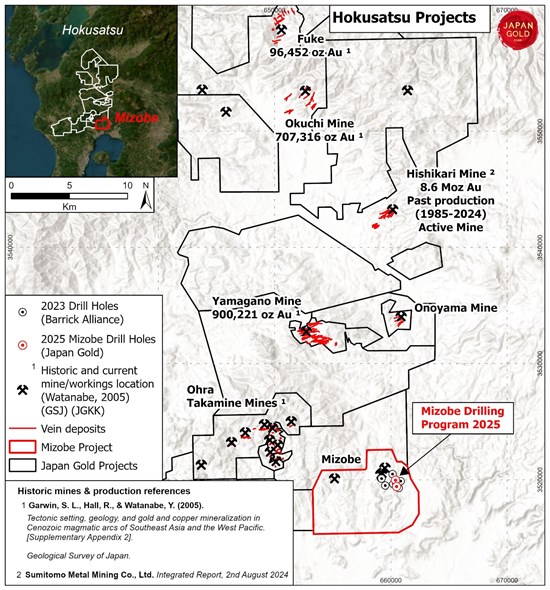
Japan Gold Corp., a mineral exploration company, engages in the exploration and evaluation of gold properties in Japan. The company also explores for silver and copper deposits. It holds a portfolio of 26 tenements located in the Hokkaido, Honshu, and Kyushu islands of Japan. Japan Gold Corp. is hea... Japan Gold Corp., a mineral exploration company, engages in the exploration and evaluation of gold properties in Japan. The company also explores for silver and copper deposits. It holds a portfolio of 26 tenements located in the Hokkaido, Honshu, and Kyushu islands of Japan. Japan Gold Corp. is headquartered in Vancouver, Canada. Show more


| Période | Variation | Variation % | Ouver. | Haut | Bas | Moyenne Vol. Quot. | VWAP | |
|---|---|---|---|---|---|---|---|---|
| 1 | 0.0045 | 7.5 | 0.06 | 0.0645 | 0.0595 | 17100 | 0.06040643 | CS |
| 4 | -0.00392 | -5.7293189126 | 0.06842 | 0.07124 | 0.057 | 8581 | 0.06220854 | CS |
| 12 | -0.0117 | -15.3543307087 | 0.0762 | 0.077 | 0.057 | 12402 | 0.06967414 | CS |
| 26 | -0.0335 | -34.1836734694 | 0.098 | 0.1088 | 0.057 | 37583 | 0.07779411 | CS |
| 52 | -0.0055 | -7.85714285714 | 0.07 | 0.234 | 0.0497 | 70107 | 0.10213304 | CS |
| 156 | -0.0468 | -42.0485175202 | 0.1113 | 0.234 | 0.03666 | 43339 | 0.08859243 | CS |
| 260 | -0.2383 | -78.6988110964 | 0.3028 | 0.3178 | 0.03666 | 36878 | 0.1336235 | CS |

Transactions différées
Pour obtenir des transactions en temps réel, améliorez votre compte
Passer à la version en temps réel| Aucune Discussion Trouvée |
| Ajouter une Discussion |

Les dernières valeurs consultées apparaîtront dans cette boîte, vous permettant de choisir facilement les titres vus auparavant.
Assistance: support@advfn.fr
En accédant aux services disponibles de ADVFN, vous acceptez les Conditions Générales de ADVFN Conditions Générales
 S'inscrire avec l'e-mail
Vous avez déjà un compte? Connexion
Vous n'avez pas de compte ? Inscription
En m'inscrivant, je confirme avoir lu, compris et accepté les Conditions générales d'ADVFN et j'affirme etre un investisseur privé.