Form 6-K - Report of foreign issuer [Rules 13a-16 and 15d-16]
26 Octobre 2023 - 12:01PM
Edgar (US Regulatory)
UNITED STATES
SECURITIES AND EXCHANGE COMMISSION
Washington, DC 20549
FORM 6-K
REPORT OF FOREIGN PRIVATE ISSUER PURSUANT TO RULE
13a-16 OR 15d-16
UNDER THE SECURITIES EXCHANGE ACT OF 1934
October 26, 2023
Commission File Number 1-10167
WESTPAC BANKING
CORPORATION
(Translation of registrant’s name into English)
275 KENT STREET, SYDNEY, NEW SOUTH WALES 2000,
AUSTRALIA
(Address of principal executive office)
Indicate by check mark whether the registrant
files or will file annual reports
under cover of Form 20-F or Form 40-F.
Form 20-F x Form 40-F ¨
Indicate by check mark if the registrant is submitting
the Form 6-K in paper as permitted by Regulation S-T Rule 101(b)(1):¨
Indicate by check mark if the registrant is submitting the
Form 6-K in paper as permitted by Regulation S-T Rule 101(b)(7):¨
Index to Exhibits
SIGNATURES
Pursuant to the requirements of the Securities Exchange Act of 1934,
the registrant has duly caused this report to be signed on its behalf by the undersigned, thereunto duly authorized.
| |
| |
WESTPAC BANKING CORPORATION |
|
(Registrant) |
| |
| Date: October 26, 2023 |
By: |
/s/ Yvette Adiguzel |
| |
|
Yvette Adiguzel |
| |
|
Tier One Attorney |
Exhibit 1
| ASX
Release
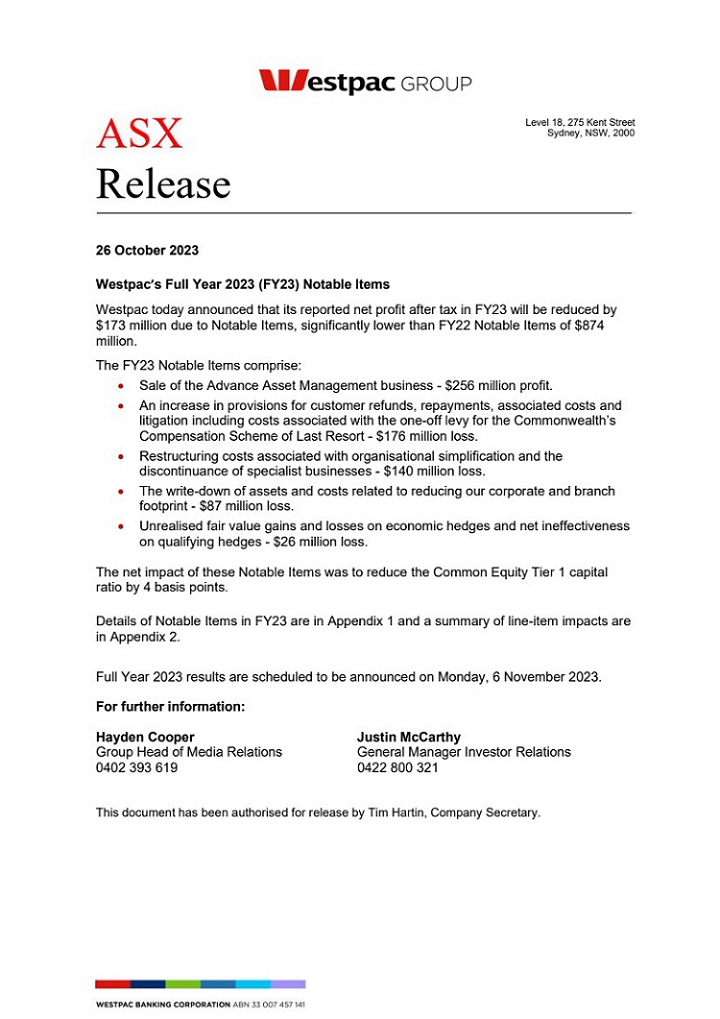
26 October 2023
Westpac’s Full Year 2023 (FY23) Notable Items
Westpac today announced that its reported net profit after tax in FY23 will be reduced by
$173 million due to Notable Items, significantly lower than FY22 Notable Items of $874
million.
The FY23 Notable Items comprise:
Sale of the Advance Asset Management business - $256 million profit.
An increase in provisions for customer refunds, repayments, associated costs and
litigation including costs associated with the one-off levy for the Commonwealth’s
Compensation Scheme of Last Resort - $176 million loss.
Restructuring costs associated with organisational simplification and the
discontinuance of specialist businesses - $140 million loss.
The write-down of assets and costs related to reducing our corporate and branch
footprint - $87 million loss.
Unrealised fair value gains and losses on economic hedges and net ineffectiveness
on qualifying hedges - $26 million loss.
The net impact of these Notable Items was to reduce the Common Equity Tier 1 capital
ratio by 4 basis points.
Details of Notable Items in FY23 are in Appendix 1 and a summary of line-item impacts are
in Appendix 2.
Full Year 2023 results are scheduled to be announced on Monday, 6 November 2023.
For further information:
Hayden Cooper Justin McCarthy
Group Head of Media Relations General Manager Investor Relations
0402 393 619 0422 800 321
This document has been authorised for release by Tim Hartin, Company Secretary.
Level 18, 275 Kent Street
Sydney, NSW, 2000 |
|
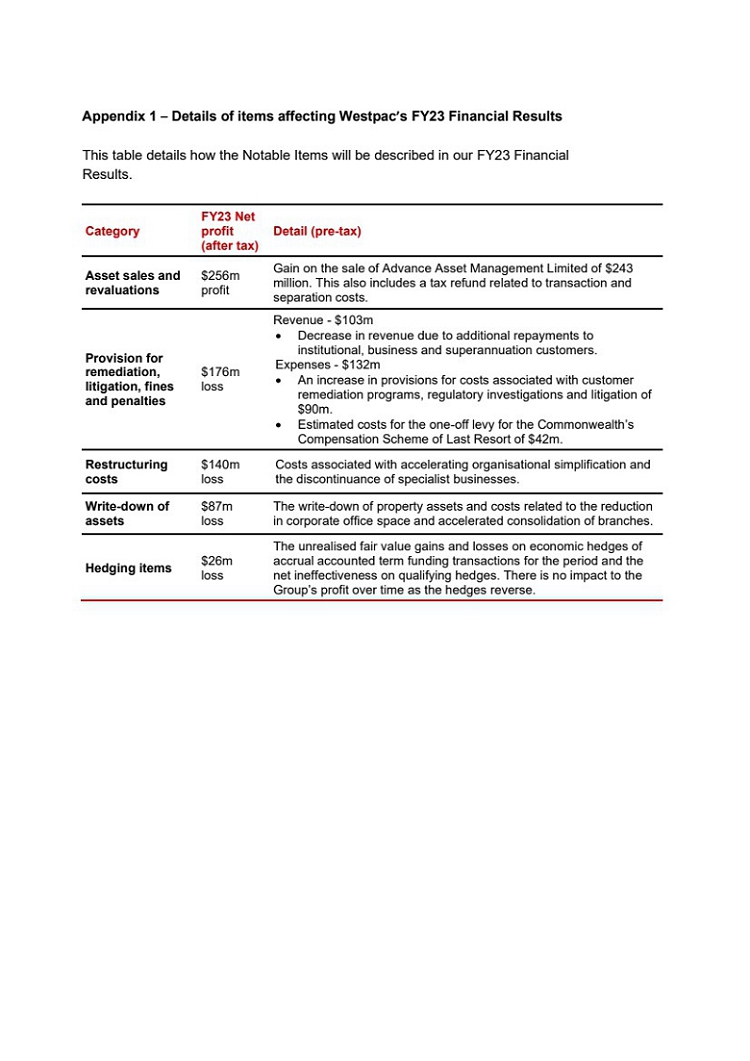
Appendix 1 – Details of items affecting Westpac’s FY23 Financial Results
This table details how the Notable Items will be described in our FY23 Financial
Results.
Category
FY23 Net
profit
(after tax)
Detail (pre-tax)
Asset sales and
revaluations
$256m
profit
Gain on the sale of Advance Asset Management Limited of $243
million. This also includes a tax refund related to transaction and
separation costs.
Provision for
remediation,
litigation, fines
and penalties
$176m
loss
Revenue - $103m
Decrease in revenue due to additional repayments to
institutional, business and superannuation customers.
Expenses - $132m
An increase in provisions for costs associated with customer
remediation programs, regulatory investigations and litigation of
$90m.
Estimated costs for the one-off levy for the Commonwealth’s
Compensation Scheme of Last Resort of $42m.
Restructuring
costs
$140m
loss
Costs associated with accelerating organisational simplification and
the discontinuance of specialist businesses.
Write-down of
assets
$87m
loss
The write-down of property assets and costs related to the reduction
in corporate office space and accelerated consolidation of branches.
Hedging items $26m
loss
The unrealised fair value gains and losses on economic hedges of
accrual accounted term funding transactions for the period and the
net ineffectiveness on qualifying hedges. There is no impact to the
Group’s profit over time as the hedges reverse. |
|
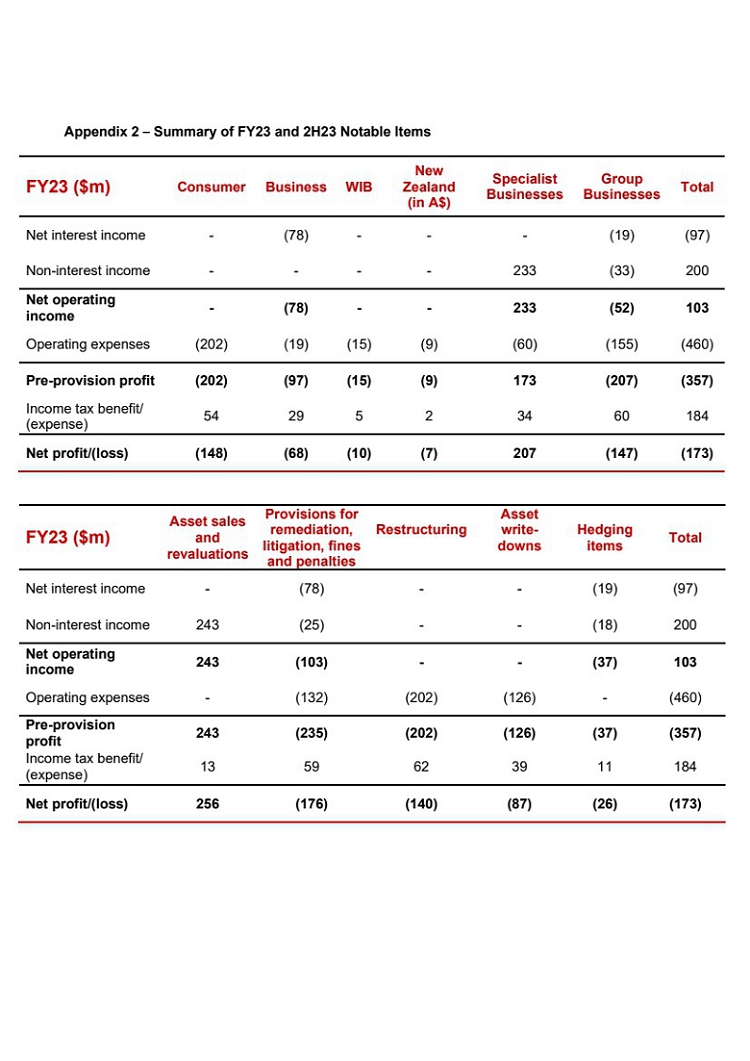
Appendix 2 – Summary of FY23 and 2H23 Notable Items
FY23 ($m) Consumer Business WIB
New
Zealand
(in A$)
Specialist
Businesses
Group
Businesses Total
Net interest income - (78) - - - (19) (97)
Non-interest income - - - - 233 (33) 200
Net operating
income - (78) - - 233 (52) 103
Operating expenses (202) (19) (15) (9) (60) (155) (460)
Pre-provision profit (202) (97) (15) (9) 173 (207) (357)
Income tax benefit/
(expense) 54 29 5 2 34 60 184
Net profit/(loss) (148) (68) (10) (7) 207 (147) (173)
FY23 ($m)
Asset sales
and
revaluations
Provisions for
remediation,
litigation, fines
and penalties
Restructuring
Asset
write-downs
Hedging
items Total
Net interest income - (78) - - (19) (97)
Non-interest income 243 (25) - - (18) 200
Net operating
income 243 (103) - - (37) 103
Operating expenses - (132) (202) (126) - (460)
Pre-provision
profit 243 (235) (202) (126) (37) (357)
Income tax benefit/
(expense) 13 59 62 39 11 184
Net profit/(loss) 256 (176) (140) (87) (26) (173)
|
|
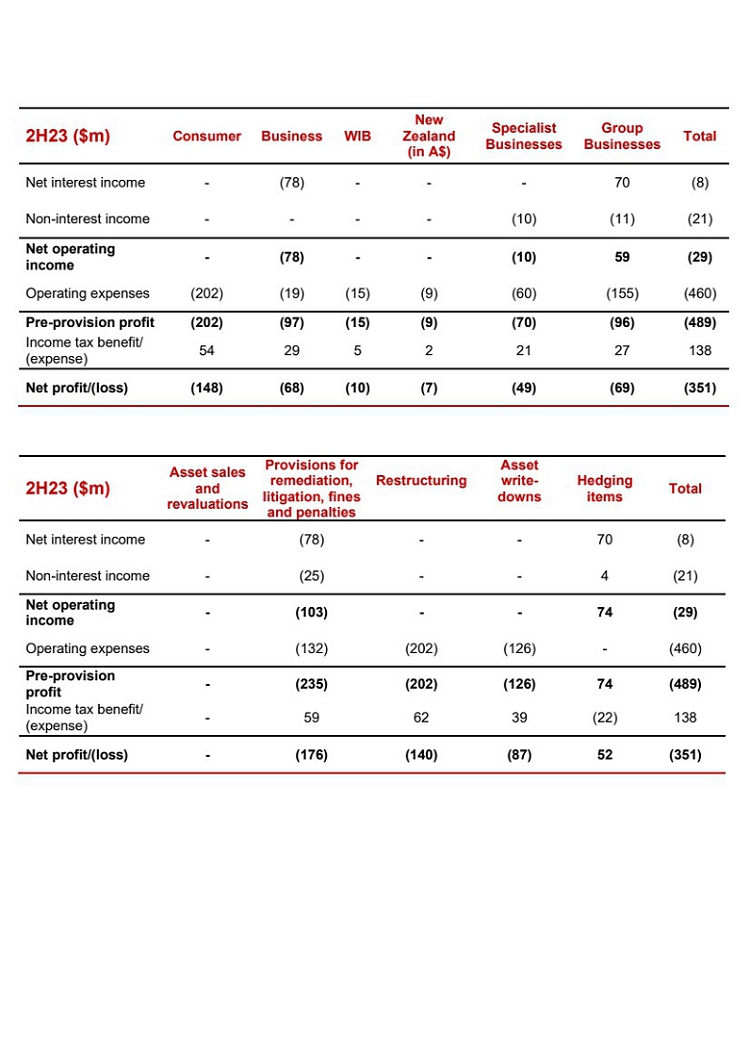
2H23 ($m) Consumer Business WIB
New
Zealand
(in A$)
Specialist
Businesses
Group
Businesses Total
Net interest income - (78) - - - 70 (8)
Non-interest income - - - - (10) (11) (21)
Net operating
income - (78) - - (10) 59 (29)
Operating expenses (202) (19) (15) (9) (60) (155) (460)
Pre-provision profit (202) (97) (15) (9) (70) (96) (489)
Income tax benefit/
(expense) 54 29 5 2 21 27 138
Net profit/(loss) (148) (68) (10) (7) (49) (69) (351)
2H23 ($m)
Asset sales
and
revaluations
Provisions for
remediation,
litigation, fines
and penalties
Restructuring
Asset
write-downs
Hedging
items Total
Net interest income - (78) - - 70 (8)
Non-interest income - (25) - - 4 (21)
Net operating
income - (103) - - 74 (29)
Operating expenses - (132) (202) (126) - (460)
Pre-provision
profit - (235) (202) (126) 74 (489)
Income tax benefit/
(expense) - 59 62 39 (22) 138
Net profit/(loss) - (176) (140) (87) 52 (351) |
Westpac Banking (PK) (USOTC:WEBNF)
Graphique Historique de l'Action
De Fév 2025 à Mar 2025
")
Westpac Banking (PK) (USOTC:WEBNF)
Graphique Historique de l'Action
De Mar 2024 à Mar 2025
")
Real-Time news about Westpac Banking Corp Ltd (PK) (OTCMarkets): 0 recent articles
Plus d'articles sur Westpac Banking Corp Ltd (PK)
