AMCON Distributing Company (“AMCON”) (NYSE American:DIT), an
Omaha, Nebraska based consumer products company is pleased to
announce fully diluted earnings per share of $2.45 on net income
available to common shareholders of $1.5 million for its second
fiscal quarter ended March 31, 2019.
“AMCON’s newly enhanced distribution facility in Bismarck, North
Dakota began shipping this quarter. Our management team and
associates did a tremendous job in completing this project in a
challenging weather environment. We have been a long-term service
provider in the northern marketplace and this new investment
reinforces our commitment to the success of our customers,” said
Christopher H. Atayan, AMCON’s Chairman and Chief Executive
Officer. He further noted, “Our organization continues its close
collaboration with customers to design leading edge foodservice
programs that are competitive with quick-service restaurants.
Additionally, we are actively seeking strategic acquisition
opportunities that we believe can benefit from AMCON’s portfolio of
technologies and services.”
“We are actively evaluating a number of additional strategic
facility initiatives to support the growth needs of our customer
base. Our emphasis on first class service and reliability is the
foundation of our position as a leader in the convenience
distribution industry. As such, we will continue to make
investments in people, facilities and equipment necessary for
sustained excellence,” said Andrew C. Plummer, AMCON’s President
and Chief Operating Officer. He further noted, “Our Healthy Edge
Retail Group management team is implementing a comprehensive
merchandising and point of sale system update to our base of retail
health food stores. These initiatives are in support of our
objective of being a total wellness solution for consumers.” Mr.
Plummer further added, “We were pleased to close March 31, 2019
with total shareholders’ equity of $64.8 million and consolidated
debt of $21.4 million.”
AMCON is a leading wholesale distributor of consumer products,
including beverages, candy, tobacco, groceries, foodservice, frozen
and chilled foods, and health and beauty care products with
locations in Illinois, Missouri, Nebraska, North Dakota, South
Dakota and Tennessee. AMCON also operates twenty-two (22) health
and natural product retail stores in the Midwest and Florida. The
retail stores operate under the names Akin’s Natural Foods Market
www.akins.com in its Midwest market, and Chamberlin's Market &
Cafe www.chamberlins.com and Earth Origins Market
www.earthoriginsmarket.com in its Florida market.
This news release contains forward-looking statements that are
subject to risks and uncertainties and which reflect management's
current beliefs and estimates of future economic circumstances,
industry conditions, Company performance and financial results. A
number of factors could affect the future results of the Company
and could cause those results to differ materially from those
expressed in the Company's forward-looking statements including,
without limitation, availability of sufficient cash resources to
conduct its business and meet its capital expenditures needs and
the other factors described under Item 1.A. of the Company’s Annual
Report on Form 10-K. Moreover, past financial performance should
not be considered a reliable indicator of future performance.
Accordingly, the Company claims the protection of the safe harbor
for forward-looking statements contained in the Private Securities
Litigation Reform Act of 1995 with respect to all such
forward-looking statements.
Visit AMCON Distributing Company's web site
at: www.amcon.com
AMCON Distributing Company and
Subsidiaries
Condensed Consolidated Balance
Sheets
March 31, 2019 and September 30,
2018
March September 2019 2018
(Unaudited) ASSETS Current assets: Cash $ 642,116 $
520,644 Accounts receivable, less allowance for doubtful accounts
of $0.9 million at March 2019 and September 2018 28,016,243
31,428,845 Inventories, net 57,650,559 78,869,615 Income taxes
receivable — 272,112 Prepaid and other current assets
7,343,497 4,940,775 Total current assets
93,652,415 116,031,991 Property and equipment, net
16,915,409 15,768,484 Goodwill 4,436,950 4,436,950 Other intangible
assets, net 3,383,686 3,414,936 Other assets 293,896
301,793 Total assets $ 118,682,356 $
139,954,154
LIABILITIES AND SHAREHOLDERS’
EQUITY Current liabilities: Accounts payable $ 20,570,694 $
20,826,834 Accrued expenses 7,106,050 8,556,620 Accrued wages,
salaries and bonuses 2,683,504 3,965,733 Income taxes payable 1,630
— Current maturities of long-term debt 803,612
1,096,306 Total current liabilities 31,165,490 34,445,493
Credit facility 17,224,197 35,428,597 Deferred income tax
liability, net 2,009,719 1,782,801 Long-term debt, less current
maturities 3,394,116 3,658,391 Other long-term liabilities 40,033
38,055 Shareholders’ equity: Preferred stock, $.01 par
value, 1,000,000 shares authorized — — Common stock, $.01 par
value, 3,000,000 shares authorized, 592,768 shares outstanding at
March 2019 and 615,777 shares outstanding at September 2018 8,561
8,441 Additional paid-in capital 23,148,372 22,069,098 Retained
earnings 66,203,466 63,848,030 Treasury stock at cost
(24,511,598 ) (21,324,752 ) Total shareholders’ equity
64,848,801 64,600,817 Total liabilities
and shareholders’ equity $ 118,682,356 $ 139,954,154
AMCON Distributing Company and
Subsidiaries
Condensed Consolidated Unaudited
Statements of Operations
for the three and six months ended
March 31, 2019 and 2018
For the three months ended March
For the six months ended March 2019 2018
2019 2018 Sales (including excise taxes of $82.9
million and $83.1 million, and $175.9 million and $171.7 million
respectively) $ 310,715,873 $ 295,207,286 $ 655,449,793 $
610,720,495 Cost of sales 290,126,453
278,141,110 614,228,235 575,462,557
Gross profit 20,589,420 17,066,176
41,221,558 35,257,938 Selling,
general and administrative expenses 17,391,681 15,619,420
35,348,896 31,973,028 Depreciation and amortization 641,228
537,903 1,249,236
1,068,908 18,032,909 16,157,323
36,598,132 33,041,936 Operating income
2,556,511 908,853 4,623,426
2,216,002 Other expense (income):
Interest expense 396,576 313,364 719,526 515,555 Other (income),
net (36,280 ) (27,410 ) (39,636 )
(32,543 ) 360,296 285,954
679,890 483,012 Income from operations before
income taxes 2,196,215 622,899 3,943,536 1,732,990 Income tax
expense (benefit) 673,000 284,000
1,175,000 (86,000 ) Net income available to
common shareholders $ 1,523,215 $ 338,899 $ 2,768,536
$ 1,818,990 Basic earnings per share available
to common shareholders $ 2.49 $ 0.49 $ 4.50 $ 2.64 Diluted earnings
per share available to common shareholders $ 2.45 $ 0.49 $ 4.44 $
2.61 Basic weighted average shares outstanding 611,824
689,480 614,874 688,570 Diluted weighted average shares outstanding
620,769 697,406 623,848 697,563 Dividends declared and paid
per common share $ 0.46 $ 0.46 $ 0.64 $ 0.64
AMCON Distributing Company and
Subsidiaries
Condensed Consolidated Unaudited
Statements of Shareholders’ Equity
for the three and six months ended
March 31, 2019 and 2018
Additional
Common Stock Treasury Stock Paid in
Retained Shares Amount Shares
Amount Capital Earnings Total THREE
MONTHS ENDED MARCH 2018 Balance, January 1, 2018 844,089 $
8,441 (153,603 ) $ (13,616,477 ) $ 22,009,620 $ 62,086,133 $
70,487,717 Dividends on common stock, $0.18 per share — — — — —
(128,990 ) (128,990 ) Compensation expense and issuance of stock in
connection with equity-based awards — — — — 26,942 — 26,942
Repurchase of common stock — — (6,482 ) (629,353 ) — — (629,353 )
Net income — — — — —
338,899 338,899 Balance, March 31, 2018
844,089 $ 8,441 (160,085 ) $ (14,245,830 ) $ 22,036,562 $
62,296,042 $ 70,095,215
THREE MONTHS ENDED
MARCH 2019 Balance, January 1, 2019 856,039 $ 8,561 (238,744 )
$ (22,242,837 ) $ 23,110,713 $ 64,796,415 $ 65,672,852 Dividends on
common stock, $0.18 per share — — — — — (116,164 ) (116,164 )
Compensation expense and issuance of stock in connection with
equity-based awards — — — — 37,659 — 37,659 Repurchase of common
stock — — (24,527 ) (2,268,761 ) — — (2,268,761 ) Net income —
— — — — 1,523,215
1,523,215 Balance, March 31, 2019 856,039 $ 8,561
(263,271 ) $ (24,511,598 ) $ 23,148,372 $ 66,203,466 $
64,848,801
Additional Common Stock
Treasury Stock Paid in Retained Shares
Amount Shares Amount Capital
Earnings Total SIX MONTHS ENDED MARCH 2018
Balance, October 1, 2017 831,438 $ 8,314 (153,432 ) $ (13,601,302 )
$ 20,825,919 $ 60,935,911 $ 68,168,842 Dividends on common stock,
$0.64 per share — — — — — (458,859 ) (458,859 ) Compensation
expense and issuance of stock in connection with equity-based
awards 12,651 127 — — 1,210,643 — 1,210,770 Repurchase of common
stock — — (6,653 ) (644,528 ) — — (644,528 ) Net income — —
— — — 1,818,990
1,818,990 Balance, March 31, 2018 844,089 $ 8,441 (160,085 )
$ (14,245,830 ) $ 22,036,562 $ 62,296,042 $ 70,095,215
SIX MONTHS ENDED MARCH 2019 Balance, October
1, 2018 844,089 $ 8,441 (228,312 ) $ (21,324,752 ) $ 22,069,098 $
63,848,030 $ 64,600,817 Dividends on common stock, $0.64 per share
— — — — — (413,100 ) (413,100 ) Compensation expense and issuance
of stock in connection with equity-based awards 11,950 120 — —
1,079,274 — 1,079,394 Repurchase of common stock — — (34,959 )
(3,186,846 ) — — (3,186,846 ) Net income — — —
— — 2,768,536 2,768,536
Balance, March 31, 2019 856,039 $ 8,561 (263,271 ) $ (24,511,598 )
$ 23,148,372 $ 66,203,466 $ 64,848,801
AMCON Distributing Company and
Subsidiaries
Condensed Consolidated Unaudited
Statements of Cash Flows
for the six months ended March 31, 2019
and 2018
March March 2019
2018 CASH FLOWS FROM OPERATING ACTIVITIES: Net income $
2,768,536 $ 1,818,990
Adjustments to reconcile net income from
operations to net cash flows from operating activities:
Depreciation 1,217,986 1,020,783 Amortization 31,250 48,125 Gain on
sale of property and equipment (17,832 ) (300 ) Equity-based
compensation 622,390 642,785 Deferred income taxes 226,918 (423,322
) Provision (recovery) for losses on doubtful accounts 59,000
(77,000 ) Inventory allowance 240,699 (231,625 ) Other 1,978 1,978
Changes in assets and liabilities: Accounts receivable
3,353,602 1,521,705 Inventories 20,978,357 (2,951,171 ) Prepaid and
other current assets (2,402,722 ) 1,216,336 Other assets 7,897
(19,903 ) Accounts payable (467,687 ) 126,012 Accrued expenses and
accrued wages, salaries and bonuses (2,275,795 ) (1,059,839 )
Income taxes payable / receivable 273,742
(368,469 ) Net cash flows from operating activities
24,618,319 1,265,085 CASH FLOWS FROM
INVESTING ACTIVITIES: Purchase of property and equipment (2,159,232
) (1,366,767 ) Proceeds from sales of property and equipment
23,700 300 Net cash flows (used in) investing
activities (2,135,532 ) (1,366,467 ) CASH
FLOWS FROM FINANCING ACTIVITIES: Borrowings under revolving credit
facility 642,850,736 623,945,799 Repayments under revolving credit
facility (661,055,136 ) (622,433,675 ) Principal payments on
long-term debt (556,969 ) (185,753 ) Repurchase of common stock
(3,186,846 ) (644,528 ) Dividends on common stock (413,100 )
(458,859 ) Withholdings on the exercise of equity-based awards
— (79,850 ) Net cash flows from (used in)
financing activities (22,361,315 ) 143,134 Net
change in cash 121,472 41,752 Cash, beginning of period
520,644 523,065 Cash, end of period $ 642,116
$ 564,817 Supplemental disclosure of cash flow
information: Cash paid during the period for interest $ 774,784 $
489,840 Cash paid during the period for income taxes 674,340
705,790 Supplemental disclosure of non-cash information:
Equipment acquisitions classified in accounts payable $ 212,800 $
63,962
Issuance of common stock in connection
with the vesting and exercise of equity-based awards
1,005,792 1,183,091
View source
version on businesswire.com: https://www.businesswire.com/news/home/20190418005734/en/
Christopher H. AtayanAMCON Distributing CompanyPh
402-331-3727
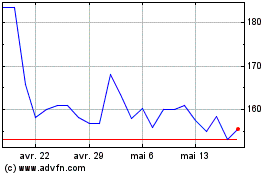
AMCON Distributing (AMEX:DIT)
Graphique Historique de l'Action
De Juin 2024 à Juil 2024

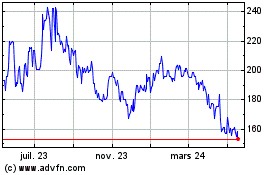
AMCON Distributing (AMEX:DIT)
Graphique Historique de l'Action
De Juil 2023 à Juil 2024
