
UNITED STATES
SECURITIES AND EXCHANGE COMMISSION
Washington, D.C. 20549
FORM N-CSRS
CERTIFIED
SHAREHOLDER REPORT OF REGISTERED
MANAGEMENT INVESTMENT COMPANIES
Investment Company Act file number: 811-21269
Allspring Income Opportunities Fund
(Exact name of registrant as specified in charter)
1415 Vantage
Park Drive, 3rd Floor, Charlotte, NC 28203
(Address of principal executive
offices) (Zip code)
Matthew Prasse
Allspring Funds Management, LLC
1415 Vantage Park Drive, 3rd Floor, Charlotte, NC 28203
(Name and address of agent for service)
Registrant’s telephone number, including area
code: 800-222-8222
Date of fiscal year end:
April 30
Date of reporting period: October 31, 2023
ITEM 1. REPORT TO STOCKHOLDERS
2
Allspring Income Opportunities Fund (EAD)
Semi-Annual Report
October 31, 2023
The views expressed and any forward-looking statements are as of October 31, 2023, unless otherwise noted, and are those of the Fund’s portfolio
managers and/or Allspring Global Investments. Discussions of individual securities or the markets generally are not intended as individual recommendations.
Future events or results may vary significantly from those expressed in any forward-looking statements. The views expressed are subject to change at any time
in response to changing circumstances in the market. Allspring Global Investments disclaims any obligation to publicly update or revise any views expressed
or forward-looking statements.
Allspring Income Opportunities Fund | 1
Letter to shareholders (unaudited)
Andrew Owen
President
Allspring
Funds
Dear Shareholder:
We are pleased to offer you this semi-annual report for the Allspring Income Opportunities Fund for the
six-month period that ended October 31, 2023. Globally, stocks and bonds experienced high levels of volatility during the period. While navigating persistently high inflation and the impact of ongoing aggressive central bank rate hikes, with gradually declining inflation, anticipation rose
over an end to the central bank monetary tightening cycle. For the six-month period, domestic U.S. and global stocks and bonds had mixed results, with U.S. stocks generally faring better than international equities. After suffering deep and broad losses through
2022, bonds now benefit from a base of higher yields that can help generate higher income. But ongoing rate hikes remained a headwind during the six-month period.
For the period, U.S. stocks, based on the S&P 500 Index,1 returned 1.39%. International stocks, as measured by the MSCI ACWI ex USA Index (Net),2 lost 7.11% while the MSCI EM Index (Net) (USD),3 returned -4.78%. Among bond indexes, the Bloomberg U.S. Aggregate Bond Index4 returned
-6.13%, the Bloomberg Global Aggregate ex-USD Index (unhedged)5
returned -7.20%, the Bloomberg Municipal Bond Index6 lost 4.65%, and the ICE BofA U.S. High Yield Index7 returned -0.02%.
Affected by high inflation and central bank rate hikes, markets were volatile.
May was marked by a divergence between expanding activity in services and an overall contraction in
manufacturing activity in the U.S., U.K., and eurozone. Core inflation remained elevated in the U.S. and Europe, despite the ongoing efforts of the Federal Reserve (Fed) and European Central Bank (ECB), which included rate hikes of 0.25% by both in May. Stubborn inflation and the resilient U.S.
labor market led to expectations of further interest rate hikes, overall monthly declines across bond indexes, and mixed results for stocks in May. Investor worries over a U.S. debt ceiling impasse were modest, and market confidence was buoyed by a deal in late May to avert a
potential U.S. debt default.
June featured the Fed’s first pause
on interest rate hikes since March 2022, when it began its aggressive campaign to rein in inflation. However, the Core Consumer Price Index (CPI)8, while continuing to
decline, remained stubbornly high in June at 4.8%, well above the Fed’s 2.0% target rate. With the U.S. unemployment rate still at 3.6%, near a historical low, and U.S.
payrolls growing in June for the 30th consecutive month, expectations of more Fed rate hikes were reinforced.
However, U.S. and global stocks had strong returns in June.
1
The S&P 500 Index consists of 500 stocks chosen for market size, liquidity, and industry group representation. It is a market-value-weighted index with each stock’s weight in the index
proportionate to its market value. You cannot invest directly in an index.
2
The Morgan Stanley Capital International (MSCI) All Country World Index (ACWI) ex USA
Index (Net) is a free-float-adjusted market-capitalization-weighted index that is designed to measure the equity market performance of developed and emerging markets,
excluding the U.S. Source: MSCI. MSCI makes no express or implied warranties or representations and shall have no liability whatsoever with respect to any MSCI data contained herein. The MSCI data may not be further redistributed or used as a basis for other indexes or any securities or financial products. This report is not approved, reviewed, or produced by MSCI. You cannot invest directly in an index.
3
The MSCI Emerging Markets (EM) Index (Net) (USD) is a free-float-adjusted market-capitalization-weighted index that is designed to measure the equity market performance of emerging markets. You cannot invest directly in an index.
4
The Bloomberg U.S. Aggregate Bond Index is a broad-based benchmark that measures the
investment-grade, U.S.-dollar-denominated, fixed-rate taxable bond market, including Treasuries, government-related and corporate securities, mortgage-backed securities
(agency fixed-rate and hybrid adjustable-rate mortgage pass-throughs), asset-backed securities, and commercial mortgage-backed securities. You cannot invest directly in an
index.
5
The Bloomberg Global Aggregate ex-USD Index (unhedged) is an unmanaged index that provides a broad-based measure of the global investment-grade fixed-income markets excluding the U.S.-dollar-denominated debt market. You cannot invest directly in an index.
6
The Bloomberg Municipal Bond Index is an unmanaged index composed of long-term
tax-exempt bonds with a minimum credit rating of Baa. You cannot invest directly in an index.
7
The ICE BofA U.S. High Yield Index is a market-capitalization-weighted index of
domestic and Yankee high yield bonds. The index tracks the performance of high yield securities traded in the U.S. bond market. You cannot invest directly in an index.
Copyright 2023. ICE Data Indices, LLC. All rights reserved.
8
The Core U.S. Consumer Price Index (CPI) is a measure of the average change over time
in the prices paid by urban consumers for a market basket of consumer goods and services excluding energy and food prices. You cannot invest directly in an
index.
2 | Allspring Income Opportunities Fund
Letter to shareholders (unaudited)
“ With strong
second-quarter gross
domestic
product
growth—initially
estimated at 2.4%—and
U.S. annual inflation easing steadily to 3.2%
in July, hopes for a soft
economic landing grew. ”
July was a strong month for stocks. However, bonds had more muted but positive monthly returns overall. Riskier
sectors and regions tended to do well, as investors grew more optimistic regarding economic prospects. With strong second-quarter gross domestic product growth—initially estimated at 2.4%—and U.S. annual inflation easing steadily to 3.2% in
July, hopes for a soft economic landing grew. The Fed, the ECB, and the Bank of England (BoE) all raised their respective key interest rates by 0.25% in July. In the Fed’s case, speculation grew that it could be very close to the end of its tightening cycle. Meanwhile,
China’s economy showed numerous signs of stagnation, bringing fresh concerns regarding global fallout.
Stocks retreated in August while monthly bond returns were flat overall. Increased global market volatility reflected unease over the Chinese property market being stressed along with weak Chinese economic
data. However, speculation grew over a possible end to the Fed’s campaign of interest rate increases or at least a pause in September. U.S. economic data generally remained solid, with resilient job market data and inflation ticking up slightly in
August, as the annual CPI1 rose 3.7%. However, the three-month trend for Core CPI stood at an annualized 2.4%.
Stocks and bonds both had negative overall returns in September as investors reluctantly recited the new chorus
of “higher for longer,” led by the Fed’s determination not to lower interest rates until it knows it has vanquished its pesky opponent, higher-than-targeted inflation. As anticipated, the Fed did pause and held rates steady in September. As of
September, the two primary gauges of U.S. inflation—the annual Core Personal Consumption Expenditures Price Index2 and CPI—both stood
at roughly 4%, twice as high as the Fed’s oft-stated 2% target. The month ended with the prospect of yet another U.S. government shutdown, averted at least temporarily but looming later this fall.
October was a tough month for stocks and bonds. Key global and domestic indexes all were pushed down by rising
geopolitical tensions, particularly the Israel-Hamas conflict, and concerns over the Fed’s “higher for longer” monetary policy. The U.S. 10-year Treasury yield rose above 5% for the first time since 2007. Commodity prices did well as oil prices rallied in
response to the prospect of oil supply disruptions from the Middle East. U.S. annualized third-quarter GDP was estimated at a healthier-than-anticipated 4.9%. China’s GDP indicated surprisingly strong industrial production and retail sales, offset by ongoing weakness in
its real estate sector.
1
The CPI is a measure of the average change over time in the prices paid by urban
consumers for a market basket of consumer goods and services. You cannot invest directly in an index.
2
The Core Personal Consumption Expenditures Price Index (PCE) is a measure of prices that people living in the United States, or those buying on their behalf, pay for goods and services. It is sometimes called the core PCE price index, because two categories that can have price swings – food and energy – are left out to make underlying inflation easier to see. You cannot invest directly in an index.
Allspring Income Opportunities Fund | 3
Letter to shareholders (unaudited)
For further information about your
fund, contact your investment professional, visit our website at allspringglobal.com, or call us directly at 1-800-222-8222.
Don’t
let short-term uncertainty derail long-term investment goals.
Periods
of investment uncertainty can present challenges, but experience has taught us that maintaining long-term investment goals can be an effective way to plan for the future. To help you create a sound strategy based on your personal goals and risk tolerance, Allspring Funds offers more than 100 mutual
funds spanning a wide range of asset classes and investment styles. Although diversification cannot guarantee an investment profit or prevent losses, we believe it can be an effective way to manage investment risk and potentially smooth out overall portfolio
performance. We encourage investors to know their investments and to understand that appropriate levels of risk-taking may unlock opportunities.
Thank you for choosing to invest with Allspring Funds. We appreciate your
confidence in us and remain committed to helping you meet your financial needs.
Sincerely,
Andrew Owen
President
Allspring Funds
4 | Allspring Income Opportunities Fund
Letter to shareholders (unaudited)
| |
• On November 15, 2023, the Fund announced a renewal of its open-market share repurchase program (the “Buyback
Program”). Under the renewed Buyback Program, the Fund may repurchase up to 5%
of its outstanding shares in open market transactions during the period
beginning on January 1, 2024 and ending on December 31, 2024. The Fund’s Board of Trustees has delegated to Allspring Funds Management, LLC, the Fund’s adviser, discretion to administer the Buyback
Program, including the determination of the amount and timing of repurchases in
accordance with the best interests of the Fund and subject to applicable
legal limitations. |
• Effective with the distribution to be declared in November 2023, the Fund’s managed distribution plan provides for the
declaration of monthly distributions to common shareholders of the Fund at an annual
minimum fixed rate of 8.75% based on the Fund’s average monthly
net asset value per share over the prior 12 months. Under the managed distribution plan, monthly distributions may be sourced from income, paid-in capital, and/or capital gains, if any. To the extent that sufficient
investment income is not available on a monthly basis, the Fund may distribute
long-term capital gains and/or return of capital to its shareholders in
order to maintain its managed distribution level. You should not draw any conclusions about the Fund’s investment performance from the amount of the Fund’s distributions or from the terms of the managed
distribution plan. Shareholders may elect to reinvest distributions received pursuant
to the managed distribution plan in the Fund under the existing dividend
reinvestment plan, which is described later in this report. |
Allspring Income Opportunities Fund | 5
Performance highlights (unaudited)
Performance highlights
| |
The Fund seeks a high level of current income. Capital appreciation is a secondary objective. |
| |
Under normal market conditions, the Fund invests at least 80% of its total assets in below-investment-
grade (high yield) debt securities, loans and preferred stocks. These securities are rated Ba or
lower by Moody’s or BB or lower by S&P, or are unrated securities of
comparable quality as determined by the subadviser. |
| |
Allspring Funds Management, LLC |
| |
Allspring Global Investments, LLC |
| |
Chris Lee, CFA, Michael J. Schueller, CFA |
Average annual total returns (%) as of October 31, 20231 |
| |
|
|
|
|
| |
|
|
|
|
| |
|
|
|
|
Based on net asset value (NAV) |
|
|
|
|
ICE BofA U.S. High Yield Constrained Index2
|
|
|
|
|
Figures quoted represent past performance, which is no
guarantee of future results, and do not reflect taxes that a shareholder may pay on an investment in a fund. Investment return and principal value of an investment will fluctuate so that an investor’s shares, when sold, may be worth more or less than their original cost. Current performance
may be lower or higher than the performance data quoted, which assumes the reinvestment of dividends and capital gains. Performance figures of the Fund do
not reflect brokerage commissions that a shareholder would pay on the purchase and sale of shares. If taxes and such brokerage commissions had been
reflected, performance would have been lower. To obtain performance information current to the most recent month-end, please call
1-800-222-8222.
The Fund’s annualized expense ratio for the six months ended October 31, 2023,
was 3.73% which includes 2.72% of interest expense.
| |
| |
Total returns based on market value are calculated assuming a purchase of common stock on the first day and a sale on the last day of the period reported. Total returns
based on NAV are calculated based on the NAV at the beginning of the
period and at the end of the period. Dividends and distributions, if any, are assumed for the purposes of these calculations to be reinvested at prices obtained under the Fund’s Automatic Dividend Reinvestment Plan. |
| |
The ICE BofA U.S. High Yield Constrained Index is a market-value-weighted index of all domestic and Yankee high-yield bonds, including deferred interest bonds and
payment-in-kind securities. Issues included in the index have maturities
of one year or more and have a credit rating lower than BBB-/Baa3 but are not in default. The ICE BofA U.S. High Yield Constrained Index limits any individual issuer to a maximum of 2% benchmark exposure. You cannot invest directly in an index. Copyright 2023. ICE
Data Indices, LLC. All rights reserved. |
CFA® and Chartered Financial Analyst® are trademarks owned by CFA Institute. |
6 | Allspring Income Opportunities Fund
Performance highlights (unaudited)
Growth of $10,000 investment as of October 31, 20231 |
| |
The chart compares the performance of the Fund for the most recent ten years with the ICE BofA U.S. High Yield Constrained Index. The chart assumes a hypothetical
investment of $10,000 investment and reflects all operating expenses of the
Fund. |
Comparison of NAV vs. market value1 |
| |
This chart does not reflect any brokerage commissions charged on the purchase and sale of the Fund’s common stock. Dividends and distributions paid by the Fund are
included in the Fund’s average annual total returns but have the effect of
reducing the Fund’s NAV. |
Allspring Income Opportunities Fund | 7
Performance highlights (unaudited)
Risk summary
This closed-end fund is no longer available as an initial public offering and is only offered
through broker-dealers on the secondary market. A closed-end fund is not required to buy its shares back from investors upon request. Shares of the Fund may trade at either a
premium or discount relative to the Fund’s net asset value, and there can be no assurance that any discount will decrease. The values of, and/or the income generated
by, securities held by the Fund may decline due to general market conditions or other factors, including those directly involving the issuers of such securities. Debt
securities are subject to credit risk and interest rate risk, and high yield securities and unrated securities of similar credit quality have a much greater risk of default
and their values tend to be more volatile than higher-rated securities with similar maturities. The Fund is leveraged through a revolving credit facility and also may incur leverage by issuing preferred shares in the future. The use of leverage results in certain risks including, among others, the likelihood of greater volatility of the net asset value and the market value of common shares. Derivatives involve additional risks including interest rate risk, credit risk, the risk of improper valuation, and the risk of non-correlation to the relevant instruments that they are designed to hedge or closely track.
8 | Allspring Income Opportunities Fund
Performance highlights (unaudited)
MANAGER’S DISCUSSION
Fund overview
The
Fund’s return based on market value was -4.81% for the six-month period that ended October 31, 2023. During the same period, the Fund’s return based on its net
asset value (NAV) was -0.87%. Based on its market value and NAV returns, the Fund underperformed the ICE BofA U.S. High Yield Constrained Index, which returned -0.07% for the
same period.
Market overview
An uptick in interest rate volatility and higher yields weighed on U.S. high yield performance
over the past six months. Conversely, leveraged loans generated steady positive performance. As a result, high yield had a flat total return and leveraged loans produced mid-single-digit returns over the period. Robust economic growth and a
decelerating pace of inflation helped boost corporate fundamentals as companies remained profitable
and generated strong cash flow. Credit rating migration held steady as upgrades were in line with
downgrades. Conversely, tighter monetary policy and higher base rates with the federal funds rate rising 50 basis points (bps; 100 bps equal 1.00%) to 5.5% put increasing pressure on marginal credits—particularly those
with variable-rate bank funding. As a result, default rates pushed higher over the past six months, from 2% to about 2.3% as of October 31, 2023. Commodity-based sectors, such as energy, outperformed over the course of the
year, whereas higher-rated, longer-duration sectors, such as utilities, lagged. However, idiosyncratic dispersion across most sectors increased because of tighter financial conditions.
Ten largest holdings (%) as of October 31, 20231 |
Geo Group, Inc., 12.45%, 3-23-2027 |
|
CoreCivic, Inc., 8.25%, 4-15-2026 |
|
CCO Holdings LLC/CCO Holdings Capital Corp., 4.25%, 1-15-2034 |
|
Enviva Partners LP/Enviva Partners Finance Corp., 6.50%, 1-15-2026 |
|
CCM Merger, Inc., 6.38%, 5-1-2026 |
|
PG&E Corp., 5.25%, 7-1-2030 |
|
Match Group Holdings II LLC, 5.63%, 2-15-2029 |
|
Pattern Energy Operations LP/Pattern Energy Operations, Inc., 4.50%, 8-15-2028 |
|
Encino Acquisition Partners Holdings LLC, 8.50%, 5-1-2028 |
|
Sabre Global, Inc., 11.25%, 12-15-2027 |
|
| |
Figures represent the percentage of the Fund’s net assets. Holdings are subject to change and may have changed since the date specified. |
Performance
The portfolio underperformed the benchmark based on market value and NAV for the six-month
period. In April 2023, the portfolio was overweight gas distribution, electric-generation, and recreation and travel and underweight telecom-wireline, chemicals, and food-wholesale. By rating, the Fund was overweight BBBs and
underweight BBs and CCCs. The Fund was long the 1- to 3-year and 7- to 10-year segments and short the 3- to 7-year segments. The Fund was short duration but long yield and spread against the index.
For the six months that ended October 2023, recreation and travel and pharmaceuticals were the strongest contributing sectors, while
investments and miscellaneous financials and specialty retail were the most detrimental sectors. Encino Acquisition Partners was our best performer, while Enviva and Resolute
Investment Managers (American Beacon) were the worst. Not holding Bausch Health was positive, while not holding Carvana hurt relative performance as it rallied in the index. By rating, our underweight to
higher-quality BBs helped performance while our overweight to BBBs was detrimental. Our overweight to the segment of less than 3 years was a performance driver, while our overweight to 7- to
10-year bonds hurt.
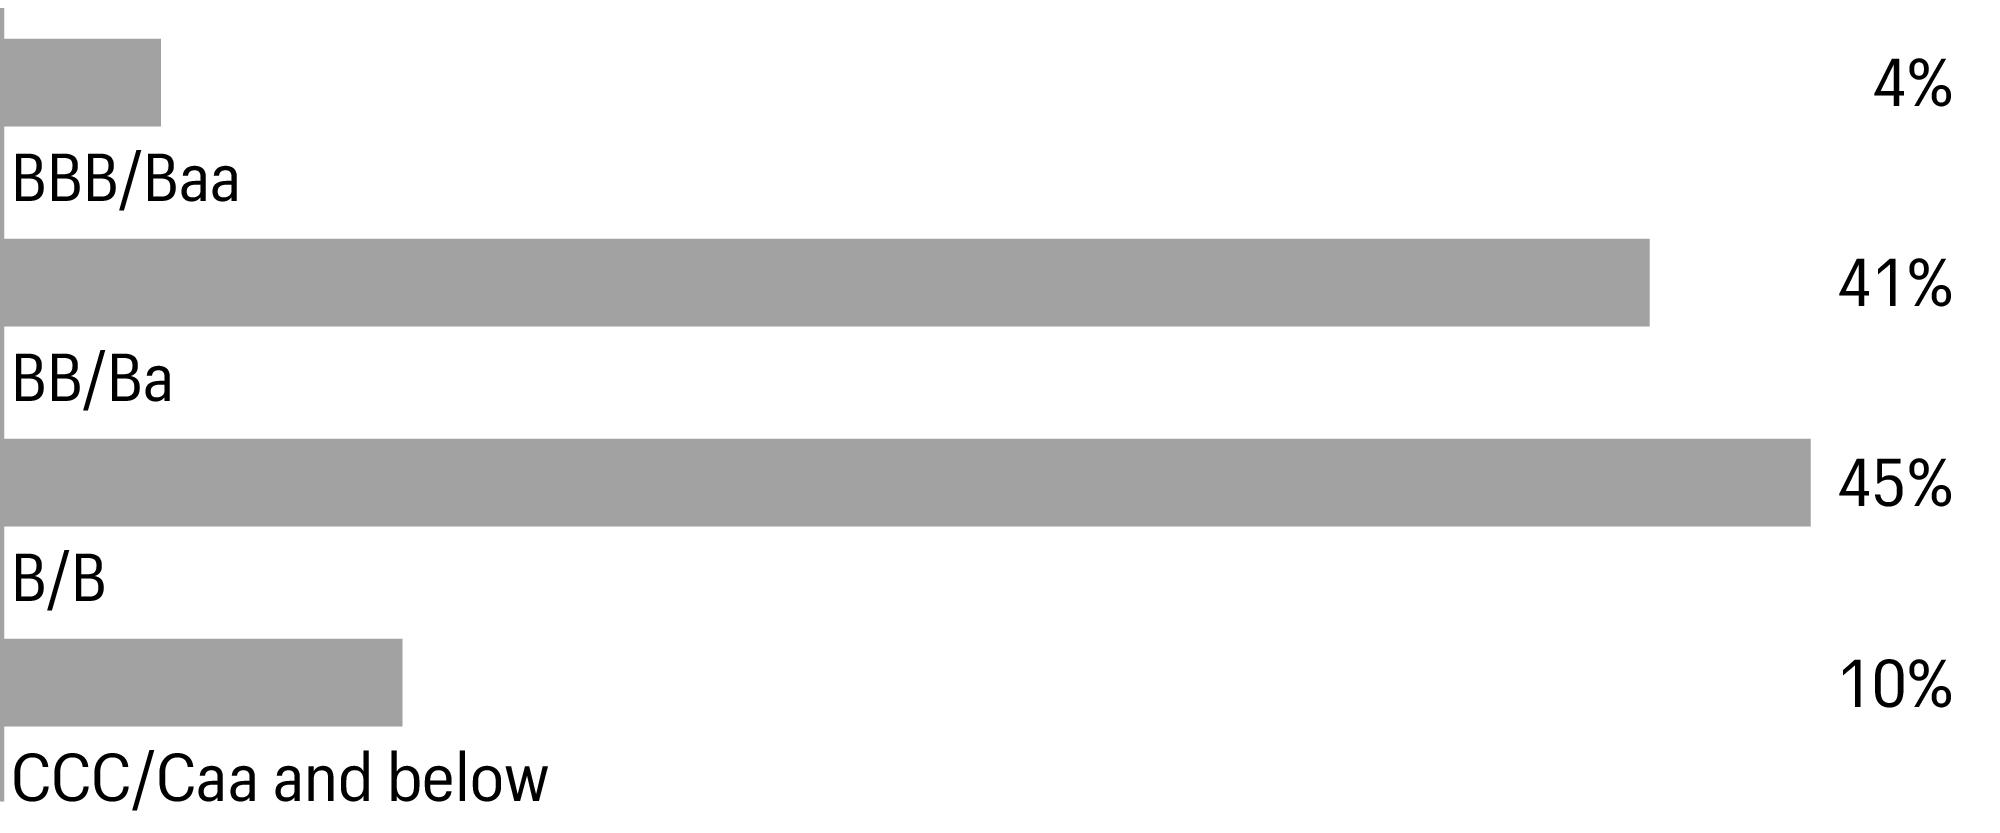
Credit quality as of October 31, 20231 |
| |
The credit quality distribution of portfolio holdings reflected in the chart is based on ratings from Standard & Poor’s, Moody’s Investors Service,
and/or Fitch Ratings Ltd. Credit quality ratings apply to the underlying
holdings of the Fund and not to the Fund itself. The percentages of the
portfolio with the ratings depicted in the chart are calculated based on the
market value of fixed income securities held by the Fund. If a security
was rated by all three rating agencies, the middle rating was utilized. If
rated by two of the three rating agencies, the lower rating was utilized,
and if rated by one of the rating agencies, that rating was utilized.
Standard & Poor’s rates the creditworthiness of bonds, ranging
from AAA (highest) to D (lowest). Ratings from A to CCC may be modified by
the addition of a plus (+) or minus (-) sign to show relative standing within the rating
categories. Standard & Poor’s rates the creditworthiness of
short-term notes from SP-1 (highest) to SP-3 (lowest). Moody’s rates
the creditworthiness of bonds, ranging from Aaa (highest) to C (lowest).
Ratings Aa to B may be modified by the addition of a number 1 (highest) to
3 (lowest) to show relative standing within the ratings categories.
Moody’s rates the creditworthiness of short-term U.S. tax-exempt
municipal securities from MIG 1/VMIG 1 (highest) to SG (lowest). Fitch
rates the creditworthiness of bonds, ranging from AAA (highest) to D
(lowest). Credit quality distribution is subject to change and may have changed
since the date specified. |
At the end of October, we
remained short of the index—overweight 1- to 3-year and underweight the 5-year and longer segment. We favor single Bs over BBs and CCCs. By sector, the Fund is overweight electric generation, gas distribution, and recreation and
travel and underweight telecom-wireline, chemicals, and software/services. Relative to the index, the Fund
is short on duration, has slightly less yield, and is even on spread.
Allspring Income Opportunities Fund | 9
Performance highlights (unaudited)
Effective maturity distribution as of October 31, 20231 |
| |
Figures represent the percentage of the Fund’s fixed-income securities. Allocations are subject to change and may have changed since the date specified. |
Leverage had a negative impact
The Fund’s use of leverage through bank borrowings had a negative impact on the NAV total
return performance during this reporting period. As of October 31, 2023, the Fund had approximately 31% of total assets in leverage.
Market outlook
The
outlook for U.S. high yield and leveraged loans is mixed. With both segments of the market yielding close to 10%, valuations appear attractive. Current yields provide considerable cushion for investors to weather higher price volatility and an
uptick in defaults going forward. In addition, many high yield credits have successfully transitioned to a higher inflation, higher volatility, tighter monetary policy environment. Much success is due to well-funded balance
sheets with low-cost debt. However, broad-based credit fundamentals are slowly eroding as tighter monetary policy and higher interest costs start to bite. Default rates are expected to rise toward 4% to 6% over the next
12 to 24 months as the economy slows to below-trend growth while idiosyncratic dispersion is likely to remain high. Small to midsize borrowers heavily dependent on variable-rate bank debt are particularly vulnerable to
economic shocks in this environment. Successfully navigating the market will be heavily dependent on deft security selection and deep credit analysis.
10 | Allspring Income Opportunities Fund
Portfolio of investments—October 31, 2023 (unaudited)
| |
|
|
|
|
|
| |
|
|
|
|
|
|
Communication services: 0.00% |
|
|
|
|
|
|
Diversified telecommunication services: 0.00% |
|
|
|
|
|
|
| |
|
|
|
|
|
|
| |
|
|
|
|
|
|
Energy equipment & services: 0.30% |
|
|
|
|
|
|
| |
|
|
|
|
|
|
Total common stocks (Cost $534,643) |
|
|
|
|
|
|
| |
|
|
|
|
|
Corporate bonds and notes: 116.19% |
|
|
|
|
|
|
| |
|
|
|
|
|
|
| |
|
|
|
|
|
|
Clear Channel Outdoor Holdings, Inc.144A |
|
|
|
|
|
|
Clear Channel Outdoor Holdings, Inc.144A |
|
|
|
|
|
|
Outfront Media Capital LLC/Outfront Media Capital Corp.144A
|
|
|
|
|
|
|
Outfront Media Capital LLC/Outfront Media Capital Corp.144A
|
|
|
|
|
|
|
| |
|
|
|
|
|
|
| |
|
|
|
|
|
|
| |
|
|
|
|
|
|
| |
|
|
|
|
|
|
Cablevision Lightpath LLC144A |
|
|
|
|
|
|
Cablevision Lightpath LLC144A |
|
|
|
|
|
|
Match Group Holdings II LLC144A |
|
|
|
|
|
|
Uber Technologies, Inc.144A |
|
|
|
|
|
|
Uber Technologies, Inc.144A |
|
|
|
|
|
|
| |
|
|
|
|
|
|
| |
|
|
|
|
|
|
CCO Holdings LLC/CCO Holdings Capital Corp.144A |
|
|
|
|
|
|
CCO Holdings LLC/CCO Holdings Capital Corp.144A |
|
|
|
|
|
|
CCO Holdings LLC/CCO Holdings Capital Corp. |
|
|
|
|
|
|
CCO Holdings LLC/CCO Holdings Capital Corp.144A |
|
|
|
|
|
|
| |
|
|
|
|
|
|
| |
|
|
|
|
|
|
| |
|
|
|
|
|
|
Directv Financing LLC/Directv Financing Co.-Obligor, Inc.144A
|
|
|
|
|
|
|
| |
|
|
|
|
|
|
| |
|
|
|
|
|
|
Gray Television, Inc.144A |
|
|
|
|
|
|
| |
|
|
|
|
|
|
Scripps Escrow II, Inc.144A |
|
|
|
|
|
|
| |
|
|
|
|
|
|
Sirius XM Radio, Inc.144A |
|
|
|
|
|
|
Townsquare Media, Inc.144A |
|
|
|
|
|
|
| |
|
|
|
|
|
|
The accompanying notes are an integral part of these financial statements.
Allspring Income Opportunities Fund | 11
Portfolio of investments—October 31, 2023 (unaudited)
| |
|
|
|
|
|
Telecommunications: 0.83% |
|
|
|
|
|
|
| |
|
|
|
|
|
|
| |
|
|
|
|
|
|
| |
|
|
|
|
|
|
Consumer, cyclical: 20.72% |
|
|
|
|
|
|
| |
|
|
|
|
|
|
Hawaiian Airlines Pass-Through Certificates Series 2013-1 Class A |
|
|
|
|
|
|
Hawaiian Brand Intellectual Property Ltd./HawaiianMiles Loyalty Ltd.144A |
|
|
|
|
|
|
Spirit Loyalty Cayman Ltd./Spirit IP Cayman Ltd.144A |
|
|
|
|
|
|
| |
|
|
|
|
|
|
| |
|
|
|
|
|
|
| |
|
|
|
|
|
|
| |
|
|
|
|
|
|
| |
|
|
|
|
|
|
| |
|
|
|
|
|
|
Auto manufacturers: 1.80% |
|
|
|
|
|
|
| |
|
|
|
|
|
|
| |
|
|
|
|
|
|
Ford Motor Credit Co. LLC |
|
|
|
|
|
|
Ford Motor Credit Co. LLC |
|
|
|
|
|
|
| |
|
|
|
|
|
|
Auto parts & equipment: 0.51% |
|
|
|
|
|
|
| |
|
|
|
|
|
|
Distribution/wholesale: 1.11% |
|
|
|
|
|
|
G-III Apparel Group Ltd.144A |
|
|
|
|
|
|
| |
|
|
|
|
|
|
| |
|
|
|
|
|
|
Churchill Downs, Inc.144A |
|
|
|
|
|
|
Churchill Downs, Inc.144A |
|
|
|
|
|
|
| |
|
|
|
|
|
|
| |
|
|
|
|
|
|
| |
|
|
|
|
|
|
Live Nation Entertainment, Inc.144A |
|
|
|
|
|
|
| |
|
|
|
|
|
|
| |
|
|
|
|
|
|
Taylor Morrison Communities, Inc.144A |
|
|
|
|
|
|
| |
|
|
|
|
|
|
| |
|
|
|
|
|
|
| |
|
|
|
|
|
|
| |
|
|
|
|
|
|
The accompanying notes are an integral part of these financial statements.
12 | Allspring Income Opportunities Fund
Portfolio of investments—October 31, 2023 (unaudited)
| |
|
|
|
|
|
| |
|
|
|
|
|
|
Carnival Holdings Bermuda Ltd.144A |
|
|
|
|
|
|
| |
|
|
|
|
|
|
| |
|
|
|
|
|
|
| |
|
|
|
|
|
|
| |
|
|
|
|
|
|
| |
|
|
|
|
|
|
Bath & Body Works, Inc.144A |
|
|
|
|
|
|
Dave & Buster’s, Inc.144A |
|
|
|
|
|
|
| |
|
|
|
|
|
|
| |
|
|
|
|
|
|
LSF9 Atlantis Holdings LLC/Victra Finance Corp.144A |
|
|
|
|
|
|
Macy’s Retail Holdings LLC144A |
|
|
|
|
|
|
Macy’s Retail Holdings LLC144A |
|
|
|
|
|
|
| |
|
|
|
|
|
|
NMG Holding Co., Inc./Neiman Marcus Group LLC144A |
|
|
|
|
|
|
PetSmart, Inc./PetSmart Finance Corp.144A |
|
|
|
|
|
|
PetSmart, Inc./PetSmart Finance Corp.144A |
|
|
|
|
|
|
| |
|
|
|
|
|
|
Consumer, non-cyclical: 15.72% |
|
|
|
|
|
|
Commercial services: 8.54% |
|
|
|
|
|
|
Allied Universal Holdco LLC/Allied Universal Finance Corp.144A
|
|
|
|
|
|
|
Allied Universal Holdco LLC/Allied Universal Finance Corp.144A
|
|
|
|
|
|
|
| |
|
|
|
|
|
|
MPH Acquisition Holdings LLC144A |
|
|
|
|
|
|
PECF USS Intermediate Holding III Corp.144A |
|
|
|
|
|
|
Prime Security Services Borrower LLC/Prime Finance, Inc.144A
|
|
|
|
|
|
|
| |
|
|
|
|
|
|
| |
|
|
|
|
|
|
Service Corp. International |
|
|
|
|
|
|
| |
|
|
|
|
|
|
| |
|
|
|
|
|
|
| |
|
|
|
|
|
|
| |
|
|
|
|
|
|
| |
|
|
|
|
|
|
| |
|
|
|
|
|
|
Healthcare-services: 5.79% |
|
|
|
|
|
|
Catalent Pharma Solutions, Inc.144A |
|
|
|
|
|
|
CHS/Community Health Systems, Inc.144A |
|
|
|
|
|
|
CHS/Community Health Systems, Inc.144A |
|
|
|
|
|
|
CHS/Community Health Systems, Inc.144A |
|
|
|
|
|
|
| |
|
|
|
|
|
|
Pediatrix Medical Group, Inc.144A |
|
|
|
|
|
|
| |
|
|
|
|
|
|
| |
|
|
|
|
|
|
The accompanying notes are an integral part of these financial statements.
Allspring Income Opportunities Fund | 13
Portfolio of investments—October 31, 2023 (unaudited)
| |
|
|
|
|
|
Healthcare-services(continued) |
|
|
|
|
|
|
| |
|
|
|
|
|
|
Tenet Healthcare Corp.144A |
|
|
|
|
|
|
| |
|
|
|
|
|
|
| |
|
|
|
|
|
|
Energy-alternate sources: 4.20% |
|
|
|
|
|
|
Enviva Partners LP/Enviva Partners Finance Corp.144A |
|
|
|
|
|
|
TerraForm Power Operating LLC144A |
|
|
|
|
|
|
TerraForm Power Operating LLC144A |
|
|
|
|
|
|
| |
|
|
|
|
|
|
| |
|
|
|
|
|
|
Aethon United BR LP/Aethon United Finance Corp.144A |
|
|
|
|
|
|
Encino Acquisition Partners Holdings LLC144A |
|
|
|
|
|
|
Hilcorp Energy I LP/Hilcorp Finance Co.144A |
|
|
|
|
|
|
Hilcorp Energy I LP/Hilcorp Finance Co.144A |
|
|
|
|
|
|
Hilcorp Energy I LP/Hilcorp Finance Co.144A |
|
|
|
|
|
|
Hilcorp Energy I LP/Hilcorp Finance Co.144A |
|
|
|
|
|
|
Hilcorp Energy I LP/Hilcorp Finance Co.144A |
|
|
|
|
|
|
Nabors Industries Ltd.144A |
|
|
|
|
|
|
Nabors Industries, Inc.144A |
|
|
|
|
|
|
| |
|
|
|
|
|
|
| |
|
|
|
|
|
|
| |
|
|
|
|
|
|
Oil & gas services: 2.11% |
|
|
|
|
|
|
| |
|
|
|
|
|
|
Oceaneering International, Inc. |
|
|
|
|
|
|
Oceaneering International, Inc.144A |
|
|
|
|
|
|
| |
|
|
|
|
|
|
| |
|
|
|
|
|
|
| |
|
|
|
|
|
|
CQP Holdco LP/BIP-V Chinook Holdco LLC144A |
|
|
|
|
|
|
| |
|
|
|
|
|
|
| |
|
|
|
|
|
|
| |
|
|
|
|
|
|
EnLink Midstream Partners LP |
|
|
|
|
|
|
EnLink Midstream Partners LP |
|
|
|
|
|
|
Harvest Midstream I LP144A |
|
|
|
|
|
|
Hess Midstream Operations LP144A |
|
|
|
|
|
|
| |
|
|
|
|
|
|
Rockies Express Pipeline LLC144A |
|
|
|
|
|
|
Rockies Express Pipeline LLC144A |
|
|
|
|
|
|
Tallgrass Energy Partners LP/Tallgrass Energy Finance Corp.144A
|
|
|
|
|
|
|
Tallgrass Energy Partners LP/Tallgrass Energy Finance Corp.144A
|
|
|
|
|
|
|
The accompanying notes are an integral part of these financial statements.
14 | Allspring Income Opportunities Fund
Portfolio of investments—October 31, 2023 (unaudited)
| |
|
|
|
|
|
| |
|
|
|
|
|
|
Venture Global Calcasieu Pass LLC144A |
|
|
|
|
|
|
Venture Global LNG, Inc.144A |
|
|
|
|
|
|
| |
|
|
|
|
|
|
| |
|
|
|
|
|
|
Diversified financial services: 6.74% |
|
|
|
|
|
|
| |
|
|
|
|
|
|
| |
|
|
|
|
|
|
Nationstar Mortgage Holdings, Inc.144A |
|
|
|
|
|
|
Nationstar Mortgage Holdings, Inc.144A |
|
|
|
|
|
|
| |
|
|
|
|
|
|
| |
|
|
|
|
|
|
| |
|
|
|
|
|
|
| |
|
|
|
|
|
|
| |
|
|
|
|
|
|
Oppenheimer Holdings, Inc. |
|
|
|
|
|
|
| |
|
|
|
|
|
|
Rocket Mortgage LLC/Rocket Mortgage Co.-Issuer, Inc.144A
|
|
|
|
|
|
|
United Wholesale Mortgage LLC144A |
|
|
|
|
|
|
United Wholesale Mortgage LLC144A |
|
|
|
|
|
|
| |
|
|
|
|
|
|
| |
|
|
|
|
|
|
| |
|
|
|
|
|
|
AssuredPartners, Inc.144A |
|
|
|
|
|
|
BroadStreet Partners, Inc.144A |
|
|
|
|
|
|
HUB International Ltd.144A |
|
|
|
|
|
|
HUB International Ltd.144A |
|
|
|
|
|
|
| |
|
|
|
|
|
|
| |
|
|
|
|
|
|
HAT Holdings I LLC/HAT Holdings II LLC144A |
|
|
|
|
|
|
HAT Holdings I LLC/HAT Holdings II LLC144A |
|
|
|
|
|
|
| |
|
|
|
|
|
|
| |
|
|
|
|
|
|
Ladder Capital Finance Holdings LLLP/Ladder Capital Finance Corp.144A |
|
|
|
|
|
|
Ladder Capital Finance Holdings LLLP/Ladder Capital Finance Corp.144A |
|
|
|
|
|
|
MPT Operating Partnership LP/MPT Finance Corp. |
|
|
|
|
|
|
| |
|
|
|
|
|
|
| |
|
|
|
|
|
|
| |
|
|
|
|
|
|
| |
|
|
|
|
|
|
Starwood Property Trust, Inc.144A |
|
|
|
|
|
|
Starwood Property Trust, Inc. |
|
|
|
|
|
|
| |
|
|
|
|
|
|
The accompanying notes are an integral part of these financial statements.
Allspring Income Opportunities Fund | 15
Portfolio of investments—October 31, 2023 (unaudited)
| |
|
|
|
|
|
| |
|
|
|
|
|
|
| |
|
|
|
|
|
|
Spirit AeroSystems, Inc.144A |
|
|
|
|
|
|
Spirit AeroSystems, Inc.144A |
|
|
|
|
|
|
| |
|
|
|
|
|
|
| |
|
|
|
|
|
|
Building materials: 2.03% |
|
|
|
|
|
|
Camelot Return Merger Sub, Inc.144A |
|
|
|
|
|
|
Emerald Debt Merger Sub LLC144A |
|
|
|
|
|
|
| |
|
|
|
|
|
|
Hand/machine tools: 2.06% |
|
|
|
|
|
|
Werner FinCo LP/Werner FinCo, Inc.144A |
|
|
|
|
|
|
Werner FinCo LP/Werner FinCo, Inc. (PIK at 14.50%)144A¥
|
|
|
|
|
|
|
| |
|
|
|
|
|
|
Machinery-diversified: 1.41% |
|
|
|
|
|
|
Chart Industries, Inc.144A |
|
|
|
|
|
|
Chart Industries, Inc.144A |
|
|
|
|
|
|
TK Elevator U.S. Newco, Inc.144A |
|
|
|
|
|
|
| |
|
|
|
|
|
|
Packaging & containers: 3.42% |
|
|
|
|
|
|
| |
|
|
|
|
|
|
Clearwater Paper Corp.144A |
|
|
|
|
|
|
Clydesdale Acquisition Holdings, Inc.144A |
|
|
|
|
|
|
Owens-Brockway Glass Container, Inc.144A |
|
|
|
|
|
|
| |
|
|
|
|
|
|
Trucking & leasing: 1.43% |
|
|
|
|
|
|
Fortress Transportation & Infrastructure Investors LLC144A
|
|
|
|
|
|
|
Fortress Transportation & Infrastructure Investors LLC144A
|
|
|
|
|
|
|
| |
|
|
|
|
|
|
| |
|
|
|
|
|
|
| |
|
|
|
|
|
|
| |
|
|
|
|
|
|
| |
|
|
|
|
|
|
| |
|
|
|
|
|
|
| |
|
|
|
|
|
|
| |
|
|
|
|
|
|
| |
|
|
|
|
|
|
AthenaHealth Group, Inc.144A |
|
|
|
|
|
|
Cloud Software Group, Inc.144A |
|
|
|
|
|
|
Cloud Software Group, Inc.144A |
|
|
|
|
|
|
SS&C Technologies, Inc.144A |
|
|
|
|
|
|
| |
|
|
|
|
|
|
The accompanying notes are an integral part of these financial statements.
16 | Allspring Income Opportunities Fund
Portfolio of investments—October 31, 2023 (unaudited)
| |
|
|
|
|
|
| |
|
|
|
|
|
|
| |
|
|
|
|
|
|
NextEra Energy Operating Partners LP144A |
|
|
|
|
|
|
NextEra Energy Operating Partners LP144A |
|
|
|
|
|
|
NSG Holdings LLC/NSG Holdings, Inc.144A |
|
|
|
|
|
|
Pattern Energy Operations LP/Pattern Energy Operations, Inc.144A
|
|
|
|
|
|
|
| |
|
|
|
|
|
|
Vistra Corp. (5 Year Treasury Constant Maturity+5.74%)144Aʊ± |
|
|
|
|
|
|
Vistra Operations Co. LLC144A |
|
|
|
|
|
|
Vistra Operations Co. LLC144A |
|
|
|
|
|
|
| |
|
|
|
|
|
|
Total corporate bonds and notes (Cost $513,130,298) |
|
|
|
|
|
|
| |
|
|
|
|
|
|
| |
|
|
|
|
|
|
| |
|
|
|
|
|
|
Clear Channel Outdoor Holdings, Inc. (U.S. SOFR 3 Month+3.50%)± |
|
|
|
|
|
|
| |
|
|
|
|
|
|
Hubbard Radio LLC (1 Month LIBOR+4.25%)± |
|
|
|
|
|
|
Consumer, cyclical: 1.33% |
|
|
|
|
|
|
| |
|
|
|
|
|
|
Mileage Plus Holdings LLC (U.S. SOFR 3 Month+5.25%)± |
|
|
|
|
|
|
SkyMiles IP Ltd. (U.S. SOFR 3 Month+3.75%)± |
|
|
|
|
|
|
| |
|
|
|
|
|
|
| |
|
|
|
|
|
|
Carnival Corp. (U.S. SOFR 1 Month+3.00%)ౠ|
|
|
|
|
|
|
Consumer, non-cyclical: 3.60% |
|
|
|
|
|
|
Commercial services: 3.38% |
|
|
|
|
|
|
Geo Group, Inc. (U.S. SOFR 1 Month+7.13%)± |
|
|
|
|
|
|
MPH Acquisition Holdings LLC (U.S. SOFR 3 Month+4.25%)± |
|
|
|
|
|
|
PECF USS Intermediate Holding III Corp. (U.S. SOFR 3 Month+4.25%)± |
|
|
|
|
|
|
Sotheby’s (U.S. SOFR 3 Month+4.50%)± |
|
|
|
|
|
|
| |
|
|
|
|
|
|
Healthcare-services: 0.22% |
|
|
|
|
|
|
Surgery Center Holdings, Inc. (U.S. SOFR 1 Month+3.75%)± |
|
|
|
|
|
|
| |
|
|
|
|
|
|
| |
|
|
|
|
|
|
GIP II Blue Holding LP (U.S. SOFR 1 Month+4.50%)± |
|
|
|
|
|
|
GIP III Stetson I LP (U.S. SOFR 1 Month+4.25%)± |
|
|
|
|
|
|
M6 ETX Holdings II MidCo LLC (U.S. SOFR 1 Month+4.50%)± |
|
|
|
|
|
|
| |
|
|
|
|
|
|
The accompanying notes are an integral part of these financial statements.
Allspring Income Opportunities Fund | 17
Portfolio of investments—October 31, 2023 (unaudited)
| |
|
|
|
|
|
| |
|
|
|
|
|
|
Diversified financial services: 0.40% |
|
|
|
|
|
|
Resolute Investment Managers, Inc. (3 Month LIBOR+4.25%)± |
|
|
|
|
|
|
Resolute Investment Managers, Inc. (U.S. SOFR 3 Month+8.00%)ౠ|
|
|
|
|
|
|
| |
|
|
|
|
|
|
| |
|
|
|
|
|
|
Asurion LLC (U.S. SOFR 1 Month+3.25%)± |
|
|
|
|
|
|
Asurion LLC (U.S. SOFR 1 Month+5.25%)± |
|
|
|
|
|
|
HUB International Ltd. (U.S. SOFR 3 Month+4.25%)± |
|
|
|
|
|
|
| |
|
|
|
|
|
|
| |
|
|
|
|
|
|
Machinery-diversified: 0.15% |
|
|
|
|
|
|
TK Elevator U.S. Newco, Inc. (6 Month LIBOR+3.50%)± |
|
|
|
|
|
|
Total loans (Cost $41,420,004) |
|
|
|
|
|
|
| |
|
|
|
|
|
| |
|
|
|
|
|
|
Communication services: 0.00% |
|
|
|
|
|
|
Diversified telecommunication services: 0.00% |
|
|
|
|
|
|
Intelsat Jackson Holdings SA Series A Contingent Value
Rights♦† |
|
|
|
|
|
|
Intelsat Jackson Holdings SA Series B Contingent Value
Rights♦† |
|
|
|
|
|
|
| |
|
|
|
|
|
|
| |
|
|
|
|
|
Yankee corporate bonds and notes: 17.55% |
|
|
|
|
|
|
| |
|
|
|
|
|
|
Telecommunications: 0.76% |
|
|
|
|
|
|
| |
|
|
|
|
|
|
Intelsat Jackson Holdings SA♦† |
|
|
|
|
|
|
| |
|
|
|
|
|
|
Consumer, cyclical: 7.28% |
|
|
|
|
|
|
| |
|
|
|
|
|
|
Air Canada Pass-Through Trust Series 2020-1 Class C144A
|
|
|
|
|
|
|
VistaJet Malta Finance PLC/Vista Management Holding, Inc.144A
|
|
|
|
|
|
|
| |
|
|
|
|
|
|
| |
|
|
|
|
|
|
Banijay Entertainment SASU144A |
|
|
|
|
|
|
| |
|
|
|
|
|
|
| |
|
|
|
|
|
|
| |
|
|
|
|
|
|
| |
|
|
|
|
|
|
The accompanying notes are an integral part of these financial statements.
18 | Allspring Income Opportunities Fund
Portfolio of investments—October 31, 2023 (unaudited)
| |
|
|
|
|
|
| |
|
|
|
|
|
|
| |
|
|
|
|
|
|
| |
|
|
|
|
|
|
Royal Caribbean Cruises Ltd.144A |
|
|
|
|
|
|
Royal Caribbean Cruises Ltd.144A |
|
|
|
|
|
|
Royal Caribbean Cruises Ltd.144A |
|
|
|
|
|
|
Royal Caribbean Cruises Ltd.144A |
|
|
|
|
|
|
| |
|
|
|
|
|
|
Consumer, non-cyclical: 0.85% |
|
|
|
|
|
|
| |
|
|
|
|
|
|
Teva Pharmaceutical Finance Netherlands III BV |
|
|
|
|
|
|
Teva Pharmaceutical Finance Netherlands III BV |
|
|
|
|
|
|
| |
|
|
|
|
|
|
| |
|
|
|
|
|
|
| |
|
|
|
|
|
|
Borr IHC Ltd./Borr Finance LLC144A%% |
|
|
|
|
|
|
| |
|
|
|
|
|
|
Northriver Midstream Finance LP144A |
|
|
|
|
|
|
| |
|
|
|
|
|
|
Diversified financial services: 1.83% |
|
|
|
|
|
|
Castlelake Aviation Finance DAC144A |
|
|
|
|
|
|
Macquarie Airfinance Holdings Ltd.144A |
|
|
|
|
|
|
| |
|
|
|
|
|
|
| |
|
|
|
|
|
|
| |
|
|
|
|
|
|
| |
|
|
|
|
|
|
| |
|
|
|
|
|
|
Sensata Technologies BV144A |
|
|
|
|
|
|
Sensata Technologies BV144A |
|
|
|
|
|
|
| |
|
|
|
|
|
|
Packaging & containers: 0.87% |
|
|
|
|
|
|
Ardagh Metal Packaging Finance USA LLC/Ardagh Metal Packaging Finance PLC144A |
|
|
|
|
|
|
Ardagh Metal Packaging Finance USA LLC/Ardagh Metal Packaging Finance PLC144A |
|
|
|
|
|
|
| |
|
|
|
|
|
|
Trucking & leasing: 1.00% |
|
|
|
|
|
|
| |
|
|
|
|
|
|
The accompanying notes are an integral part of these financial statements.
Allspring Income Opportunities Fund | 19
Portfolio of investments—October 31, 2023 (unaudited)
| |
|
|
|
|
|
| |
|
|
|
|
|
|
| |
|
|
|
|
|
|
| |
|
|
|
|
|
|
Total yankee corporate bonds and notes (Cost $74,080,592) |
|
|
|
|
|
|
| |
|
|
|
|
|
Short-term investments: 4.80% |
|
|
|
|
|
|
Investment companies: 4.80% |
|
|
|
|
|
|
Allspring Government Money Market Fund Select Class♠∞## |
|
|
|
|
|
|
Total short-term investments (Cost $19,269,763) |
|
|
|
|
|
|
Total investments in securities (Cost $648,435,300) |
|
|
|
|
|
|
Other assets and liabilities, net |
|
|
|
|
|
|
| |
|
|
|
|
|
|
| |
The security is fair valued in accordance with procedures approved by the Board of Trustees. |
| |
Non-income-earning security |
| |
The security may be resold in transactions exempt from registration, normally to qualified institutional buyers, pursuant to Rule 144A under the Securities Act of
1933. |
| |
The security is purchased on a when-issued basis. |
| |
A payment-in-kind (PIK) security is a security in which the issuer may make interest or dividend payments in cash or additional securities or a combination of both.
The rate shown is the rate in effect at period end. |
| |
Security is perpetual in nature and has no stated maturity date. The date shown reflects the next call date. |
| |
Variable rate investment. The rate shown is the rate in effect at period end. |
| |
Security is valued using significant unobservable inputs. |
| |
The issuer of the security is an affiliated person of the Fund as defined in the Investment Company Act of 1940. |
| |
The rate represents the 7-day annualized yield at period end. |
| |
All or a portion of this security is segregated as collateral for when-issued securities. |
| |
| |
London Interbank Offered Rate |
| |
Real estate investment trust |
| |
Secured Overnight Financing Rate |
Investments in affiliates
An affiliated
investment is an investment in which the Fund owns at least 5% of the outstanding voting shares of the issuer or as a result of other relationships, such as the Fund and the
issuer having the same adviser or investment manager. Transactions with issuers that were affiliates of the Fund at the end of the period were as follows:
| |
Value,
beginning of
period |
|
|
Net
realized
gains
(losses) |
Net
change in
unrealized
gains
(losses) |
|
|
Income
from
affiliated
securities |
| |
|
|
|
|
|
|
|
|
Allspring Government Money Market Fund Select Class |
|
|
|
|
|
|
|
|
The
accompanying notes are an integral part of these financial statements.
20 | Allspring Income Opportunities Fund
Statement of assets and liabilities—October 31, 2023 (unaudited)
Financial statements
Statement of
assets and liabilities
| |
|
Investments in unaffiliated securities, at value (cost $629,165,537) |
|
Investments in affiliated securities, at value (cost $19,269,763) |
|
| |
|
| |
|
Receivable for investments sold |
|
Prepaid expenses and other assets |
|
| |
|
| |
|
Secured borrowing payable |
|
Payable for investments purchased |
|
| |
|
Payable for when-issued transactions |
|
| |
|
Administration fee payable |
|
Accrued expenses and other liabilities |
|
| |
|
|
|
|
| |
|
| |
|
| |
|
| |
|
Net asset value per share |
|
Based on $401,468,631 divided by 59,368,071 shares issued and outstanding (100,000,000 shares
authorized) |
|
The accompanying notes are an integral part of these financial statements.
Allspring Income Opportunities Fund | 21
Statement of operations—six months ended October 31, 2023 (unaudited)
Statement of operations
| |
|
| |
|
Income from affiliated securities |
|
| |
|
| |
|
| |
|
| |
|
| |
|
Custody and accounting fees |
|
| |
|
Shareholder report expenses |
|
Trustees’ fees and expenses |
|
| |
|
| |
|
| |
|
| |
|
| |
|
Realized and unrealized gains (losses) on investments |
|
Net realized losses on investments |
|
Net change in unrealized gains (losses) on investments |
|
Net realized and unrealized gains (losses) on investments |
|
Net decrease in net assets resulting from operations |
|
The accompanying notes are an integral part of these financial statements.
22 | Allspring Income Opportunities Fund
Statement of changes in net assets
Statement of
changes in net assets
| |
Six months ended October 31, 2023 (unaudited) |
Year ended April 30, 2023 |
| |
|
|
|
|
| |
|
|
|
|
Net realized losses on investments |
|
|
|
|
Net change in unrealized gains (losses) on investments |
|
|
|
|
Net decrease in net assets resulting from operations |
|
|
|
|
Distributions to shareholders from |
|
|
|
|
Net investment income and net realized gains |
|
|
|
|
Tax basis return of capital |
|
|
|
|
Total distributions to shareholders |
|
|
|
|
Capital share transactions |
|
|
|
|
Cost of shares repurchased |
|
|
|
|
Total decrease in net assets |
|
|
|
|
| |
|
|
|
|
| |
|
|
|
|
| |
|
|
|
|
The
accompanying notes are an integral part of these financial statements.
Allspring Income Opportunities Fund | 23
Statement of cash flows—six months ended October 31, 2023 (unaudited)
Statement of cash flows
Cash flows from operating activities |
|
Net decrease in net assets resulting from operations |
|
Adjustments to reconcile net decrease in net assets from operations to net cash provided by operating activities |
|
Purchases of long-term securities |
|
Proceeds from the sales of long-term securities |
|
| |
|
Purchases and sales of short-term securities, net |
|
Decrease in receivable for investments sold |
|
Increase in receivable for interest |
|
Decrease in prepaid expenses and other assets |
|
Increase in payable for investments purchased |
|
Decrease in advisory fee payable |
|
Decrease in administration fee payable |
|
Increase in accrued expenses and other liabilities |
|
Net realized losses on unaffiliated securities |
|
Net change in unrealized gains (losses) on unaffiliated securities |
|
Net cash provided by operating activities |
|
Cash flows from financing activities |
|
Cost of shares repurchased |
|
| |
|
Net cash used in financing activities |
|
| |
|
| |
|
| |
|
| |
|
Supplemental cash disclosure |
|
| |
|
The accompanying notes are an integral part of these financial statements.
24 | Allspring Income Opportunities Fund
Financial
highlights
(For a share outstanding throughout each period)
| |
Six months ended
October 31, 2023
(unaudited) |
|
| |
|
|
|
|
|
Net asset value, beginning of period |
|
|
|
|
|
|
| |
|
|
|
|
|
|
Net realized and unrealized gains (losses) on investments |
|
|
|
|
|
|
Total from investment operations |
|
|
|
|
|
|
Distributions to shareholders from |
|
|
|
|
|
|
| |
|
|
|
|
|
|
Tax basis return of capital |
|
|
|
|
|
|
Total distributions to shareholders |
|
|
|
|
|
|
Anti-dilutive effect of shares repurchased |
|
|
|
|
|
|
Net asset value, end of period |
|
|
|
|
|
|
Market value, end of period |
|
|
|
|
|
|
Total return based on market value3 |
|
|
|
|
|
|
Ratios to average net assets (annualized)
|
|
|
|
|
|
|
| |
|
|
|
|
|
|
| |
|
|
|
|
|
|
|
|
|
|
|
|
|
|
| |
|
|
|
|
|
|
| |
|
|
|
|
|
|
Net assets, end of period (000s omitted) |
|
|
|
|
|
|
Borrowings outstanding, end of period (000s omitted) |
|
|
|
|
|
|
Asset coverage per $1,000 of borrowing, end of period |
|
|
|
|
|
|
| |
Ratios include interest expense relating to interest associated with borrowings and/or leverage transactions as follows: |
Six months ended October 31, 2023 (unaudited) |
|
Year ended April 30, 2023 |
|
Year ended April 30, 2022 |
|
Year ended April 30, 2021 |
|
Year ended April 30, 2020 |
|
Year ended April 30, 2019 |
|
| |
Calculated based upon average shares outstanding |
| |
Amount is less than $0.005. |
| |
Total return is calculated assuming a purchase of common stock on the first day and a sale on the last day of the period reported. Dividends and distributions, if any,
are assumed for purposes of these calculations to be reinvested at prices
obtained under the Fund’s Automatic Dividend Reinvestment Plan. Total return does not reflect brokerage commissions that a shareholder would pay on the purchase and sale of shares. |
The accompanying notes are an integral part of these financial statements.
Allspring Income Opportunities Fund | 25
Notes to financial statements (unaudited)
Notes to financial
statements
Allspring Income Opportunities Fund (the “Fund”) was organized as a statutory
trust under the laws of the state of Delaware on December 3, 2002 and is registered as a diversified closed-end management investment company under the Investment Company Act
of 1940, as amended (the “1940 Act”). As an investment company, the Fund follows the accounting and reporting guidance in Financial Accounting Standards Board
(“FASB”) Accounting Standards Codification Topic 946, Financial
Services – Investment Companies.
2.
SIGNIFICANT ACCOUNTING POLICIES
The following significant accounting
policies, which are consistently followed in the preparation of the financial statements of the Fund, are in conformity with U.S. generally accepted accounting principles
which require management to make estimates and assumptions that affect the reported amounts of assets and liabilities, disclosure of contingent assets and liabilities at the
date of the financial statements, and the reported amounts of income and expenses during the reporting period. Actual results could differ from those estimates.
Securities valuation
All investments are valued each business day as of the close of regular trading on the New York Stock Exchange (generally 4 p.m. Eastern Time), although the Fund may deviate from this calculation time under unusual or unexpected circumstances.
Debt securities are valued at the evaluated bid price provided by an independent pricing service (e.g. taking into account various factors, including yields, maturities, or credit ratings) or, if a reliable price is not available, the quoted bid price from an independent broker-dealer.
Equity securities and exchange-traded funds that are listed on a foreign or domestic exchange or
market are valued at the official closing price or, if none, the last sales price.
Investments in registered open-end investment companies (other than those listed on a foreign or domestic exchange or market) are valued at net asset value.
Investments
which are not valued using the methods discussed above are valued at their fair value, as determined in good faith by Allspring Funds Management, LLC (“Allspring Funds
Management”), which was named the valuation designee by the Board of Trustees. As the valuation designee, Allspring Funds Management is responsible for day-to-day
valuation activities for the Allspring Funds. In connection with these responsibilities, Allspring Funds Management has established a Valuation Committee and has delegated to
it the authority to take any actions regarding the valuation of portfolio securities that the Valuation Committee deems necessary or appropriate, including determining the
fair value of portfolio securities. On a quarterly basis, the Board of Trustees receives reports of valuation actions taken by the Valuation Committee. On at least an annual
basis, the Board of Trustees receives an assessment of the adequacy and effectiveness of Allspring Funds Management’s process for determining the fair value of the portfolio of investments.
When-issued transactions
The Fund may purchase securities on a forward commitment or when-issued basis. The Fund records a when-issued transaction on the trade date and will segregate assets in an amount at least equal in value to the Fund’s commitment to purchase when-issued securities. Securities purchased on a when-issued basis are
marked-to-market daily and the Fund begins earning interest on the settlement date. Losses may arise due to changes in the market value of the underlying securities or if the
counterparty does not perform under the contract.
Loans
The Fund may invest in direct debt instruments which are interests in amounts owed to lenders by corporate or
other borrowers. The loans pay interest at rates which are periodically reset by reference to a base lending rate plus a spread. Investments in loans may be in the form of
participations in loans or assignments of all or a portion of loans from third parties. When the Fund purchases participations, it generally has no rights to enforce
compliance with the terms of the loan agreement with the borrower. As a result, the Fund assumes the credit risk of both the borrower and the lender that is selling the
participation. When the Fund purchases assignments from lenders, it acquires direct rights against the borrower on the loan and may enforce compliance by the borrower with the terms of the loan agreement. Loans may include fully funded term loans or unfunded loan commitments, which are contractual obligations for future funding. Unfunded loan commitments represent the remaining obligation of the Fund to the borrower. At any point in time, up to the maturity date of the issue, the borrower may demand the unfunded portion. Unfunded amounts, if any, are marked to market and any unrealized gains or losses are recorded in the Statement of Assets and Liabilities.
Security transactions and income recognition
Securities transactions are recorded on a trade date basis. Realized gains or losses are recorded on the basis of identified
cost.
Interest income is accrued daily and bond discounts are accreted and premiums
are amortized daily. To the extent debt obligations are placed on non-accrual status, any related interest income may be reduced by writing off interest receivables when the
collection of all or a portion of interest has been determined to be doubtful based on consistently applied procedures and the fair value has decreased. If the issuer
subsequently resumes interest payments or when the collectability of interest is reasonably assured, the debt obligation is removed from non-accrual
status.
Dividend income is recognized on the ex-dividend date.
26 | Allspring Income Opportunities Fund
Notes to financial statements (unaudited)
Distributions
received from REIT investments may be characterized as ordinary income, capital gains, or a return of capital to the Fund based on information provided by the REIT. The
proper characterization of REIT distributions is generally not known until after the end of each calendar year. As such, estimates may be used in reporting the character of
income and distributions for financial statement purposes.
Distributions to
shareholders
Under a managed distribution plan, the Fund pays monthly distributions to shareholders
at an annual minimum fixed rate of 8% based on the Fund’s average monthly net asset value per share over the prior 12 months. The monthly distributions may be sourced
from income, paid-in capital, and/or capital gains, if any. To the extent that sufficient investment income is not available on a monthly basis, the Fund may distribute
long-term capital gains and/or return of capital, if any, in order to maintain its managed distribution level.
Distributions to shareholders from net investment income and net realized gains, if any, are
recorded on the ex-dividend date. Such distributions are determined in accordance with income tax regulations and may differ from U.S. generally accepted accounting
principles. Dividend sources are estimated at the time of declaration. The tax character of distributions is determined as of the Fund’s fiscal year end. Therefore, a
portion of the Fund’s distributions made prior to the Fund’s fiscal year end may be categorized as a tax return of capital at year end.
Federal and other taxes
The Fund intends to continue to qualify as a regulated investment company by distributing substantially all of its investment company taxable income and any net realized capital gains (after reduction for capital loss carryforwards) sufficient to relieve it from all, or substantially all, federal income taxes. Accordingly, no provision for federal income taxes was required.
The Fund’s income and federal excise tax returns and all financial records supporting those returns for the prior three fiscal years are subject to examination by the federal and Delaware revenue authorities. Management has analyzed the Fund’s tax positions taken on federal, state, and foreign tax returns, as applicable, for all open tax years
and does not believe that there are any uncertain tax positions that require recognition of a tax liability.
As of October 31, 2023, the aggregate cost of all investments for federal income tax purposes was $654,511,125 and the unrealized gains (losses) consisted of:
As of April 30, 2023, the Fund had capital loss carryforwards which consisted of $39,189,805 in short-term capital losses and $50,280,007 in long-term
capital losses.
3.
FAIR VALUATION MEASUREMENTS
Fair value measurements of investments
are determined within a framework that has established a fair value hierarchy based upon the various data inputs utilized in determining the value of the Fund’s
investments. The three-level hierarchy gives the highest priority to unadjusted quoted prices in active markets for identical assets or liabilities (Level 1) and the lowest
priority to unobservable inputs (Level 3). The Fund’s investments are classified within the fair value hierarchy based on the lowest level of input that is
significant to the fair value measurement. The inputs are summarized into three broad levels as follows:
•Level
1—quoted prices in active markets for identical securities
•Level 2—other significant observable inputs (including quoted prices for similar securities, interest rates, prepayment speeds, credit risk, etc.)
•Level
3—significant unobservable inputs (including the Fund’s own assumptions in determining the fair value of investments)
The inputs or methodologies used for valuing investments in securities are not necessarily an
indication of the risk associated with investing in those securities.
Allspring Income Opportunities Fund | 27
Notes to financial statements (unaudited)
The following is a summary of
the inputs used in valuing the Fund’s assets and liabilities as of October 31, 2023:
| |
|
Other significant
observable inputs
(Level 2) |
Significant
unobservable inputs
(Level 3) |
|
| |
|
|
|
|
| |
|
|
|
|
| |
|
|
|
|
| |
|
|
|
|
| |
|
|
|
|
Corporate bonds and notes |
|
|
|
|
| |
|
|
|
|
| |
|
|
|
|
| |
|
|
|
|
Yankee corporate bonds and notes |
|
|
|
|
| |
|
|
|
|
| |
|
|
|
|
| |
|
|
|
|
Additional sector, industry or geographic detail, if any, is included in the Portfolio of Investments.
At October 31, 2023, the Fund did not have any transfers into/out of Level 3.
4.
TRANSACTIONS WITH AFFILIATES
Advisory fee
Allspring Funds Management, a wholly owned subsidiary of Allspring Global Investments Holdings, LLC, a holding
company indirectly owned by certain private funds of GTCR LLC and Reverence Capital Partners, L.P., is the adviser to the Fund and is entitled to receive a fee at an annual
rate of 0.60% of the Fund’s average daily total assets. Total assets consist of the net assets of the Fund plus borrowings or other leverage for investment purposes to
the extent excluded in calculating net assets.
Allspring Funds Management has retained the services of a subadviser to provide daily portfolio management to the Fund. The fee for subadvisory services is borne by Allspring Funds Management. Allspring Global Investments, LLC, an affiliate of Allspring Funds Management and a wholly owned subsidiary of Allspring Global Investments Holdings, LLC, is the subadviser to the Fund and is entitled to receive a fee from Allspring Funds Management at an annual rate of 0.40% of the Fund’s average daily total assets.
Administration fee
Allspring Funds
Management also serves as the administrator to the Fund, providing the Fund with a wide range of administrative services necessary to the operation of the Fund. Allspring
Funds Management is entitled to receive an annual administration fee from the Fund equal to 0.05% of the Fund’s average daily total assets.
Interfund transactions
The Fund may purchase or sell portfolio investment securities to certain affiliates pursuant to Rule 17a-7 under the 1940 Act and under procedures adopted by the Board of Trustees. The procedures have been designed to ensure that these interfund transactions, which do not incur broker commissions, are effected at current market prices. Pursuant to these procedures, the Fund did not have any interfund transactions during the six months ended October 31, 2023.
5.
CAPITAL SHARE TRANSACTIONS
The Fund has authorized capital of
100,000,000 shares with no par value. For the six months ended October 31, 2023 and year ended April 30, 2023, the Fund did not issue any shares.
Under an open-market share repurchase program (the “Buyback Program”), the Fund is
authorized to repurchase up to 5% of its outstanding shares in open market transactions. The Fund’s Board of Trustees has delegated to Allspring Funds Management full
discretion to administer the Buyback Program including the determination of the amount and timing of repurchases in accordance with the best interests of the Fund and subject
to applicable legal limitations. During the six months ended October 31, 2023, the Fund repurchased 296,286 of its shares on the open market at a total cost of $1,876,495
(weighted average price per share of $6.34). The weighted average discount of these repurchased shares was 45.01%. For the year ended April 30, 2023, the Fund repurchased 581,767 of its shares on the open market at a total cost of $3,838,602.
28 | Allspring Income Opportunities Fund
Notes to financial statements (unaudited)
The Fund has borrowed $189,000,000 through a revolving line of credit administered by a
major financial institution (the “Facility”). The Facility has a commitment amount of up to $194,000,000. The Fund is charged interest at the 1 Month Secured
Overnight Financing Rate (SOFR) plus a spread and a commitment fee based on the unutilized amount of the commitment amount. The financial institution holds a security
interest in all the assets of the Fund as collateral for the borrowing. Based on the nature of the terms of the Facility and comparative market rates, the carrying amount of
the borrowings at October 31, 2023 approximates its fair value. If measured at fair value, the borrowings would be categorized as a Level 2 under the fair value
hierarchy.
During the six months ended October 31, 2023, the Fund had average
borrowings outstanding of $189,000,000 (on an annualized basis) at an average interest rate of 6.03% and recorded interest in the amount of $5,741,422, which represents
2.72% of its average daily net assets (on an annualized basis).
7.
INVESTMENT PORTFOLIO TRANSACTIONS
Purchases and sales of investments,
excluding U.S. government obligations (if any) and short-term securities, for the six months ended October 31, 2023 were $141,288,326 and $124,123,785,
respectively.
Under the Fund’s organizational documents, the officers and Trustees have been granted certain indemnification rights
against certain liabilities that may arise out of performance of their duties to the Fund. The Fund has entered into a separate agreement with each Trustee that
converts indemnification rights currently existing under the Fund’s organizational documents into contractual rights that cannot be changed in the future without
the consent of the Trustee. Additionally, in the normal course of business, the Fund may enter into contracts with service providers that contain a variety of indemnification clauses. The Fund’s maximum exposure under these arrangements is dependent on future claims that may be made against the Fund and, therefore, cannot be estimated.
9.
SUBSEQUENT DISTRIBUTIONS
Under the managed distribution plan, the Fund declared the
following distributions to common shareholders:
These distributions are not reflected in the accompanying financial statements.
Allspring Income Opportunities Fund | 29
Other information (unaudited)
Other information
Proxy voting information
A description of the policies and procedures used to determine how to vote proxies relating to portfolio securities is available without charge, upon request, by calling 1-866-259-3305, visiting our website at allspringglobal.com, or visiting the SEC website at sec.gov. Information regarding how the proxies related to portfolio securities
were voted during the most recent 12-month period ended June 30 is available on the website at allspringglobal.com or by visiting the SEC website at sec.gov.
Annual meeting of shareholders
On August 8, 2023, an Annual Meeting of Shareholders for the Fund was held to consider the following proposal. The results of the proposal are indicated below.
Proposal
1 – Election of trustees:
Quarterly portfolio holdings information
The Fund files its complete schedule of portfolio holdings with the SEC for the first and third
quarters of each fiscal year as an exhibit to its reports on Form N-PORT. Shareholders may view the filed Form N-PORT by visiting the SEC website at sec.gov.
Recent amendments to the Fund’s by-laws
On December 19, 2023, the Board of Trustees of the Fund approved the adoption of Amended and
Restated By-Laws of the Fund (the “By-Laws”). The By-Laws, among other things, contain modified procedural and informational requirements in connection with any
advance notice of shareholder proposals or nominations, including certain information about the proponent and the proposal, or in the case of a Trustee nomination, the
nominee. Any shareholder considering making a Trustee nomination or other proposal should carefully review and comply with those provisions of the By-Laws. Furthermore, in determining whether a particular nominee is qualified to serve as a Trustee, the Board has an interest in the nominee’s background, skills, experience and other attributes in light of the composition of the Board. The By-Laws now include qualifications and requirements for Trustee eligibility. Additionally, the By-Laws have changed the voting standard required for election as a Trustee. The By-Laws now provide that the affirmative vote of a majority of shares outstanding and entitled to vote in an election is required to elect a Trustee. The new voting standard will apply to all future elections of Trustees. The foregoing discussion is only a high-level summary of certain aspects of the By-Laws and is qualified in its entirety by reference to the By-Laws. Shareholders should refer to the By-Laws for more information, which can be found in a Current Report on Form 8-K filed by the Fund with the Securities and Exchange Commission (available at www.sec.gov).
Delaware statutory trust act – control share acquisitions
Because the Fund is organized as a Delaware statutory trust, it is subject to the control share acquisition statute (the “Control Share Statute”) contained
in Subchapter III of the Delaware Statutory Trust Act (the “DSTA”), which became automatically applicable to listed closed-end funds, such as the Fund, upon its effective date of August 1, 2022 (the “Effective Date”).
The Control Share Statute provides for a series of voting power thresholds above which shares are considered control shares. The first such threshold is 10% or more, but less than 15%, of all voting power. Voting power is defined by the Control Share Statute as the power to directly or indirectly exercise or direct the exercise of the voting power of Fund shares in the election of trustees. Whether a voting power threshold is met is determined by aggregating the holdings of the acquirer as well as those of its “associates,” as defined by the Control Share Statute.
Once a threshold is reached, an acquirer has no voting rights under the DSTA or the governing
documents of the Fund with respect to shares acquired in excess of that threshold (i.e., the “control shares”) unless approved by shareholders or exempted by the
Fund’s Board of Trustees. Approval by
30 | Allspring Income Opportunities Fund
Other information (unaudited)
shareholders
requires the affirmative vote of two-thirds of all votes entitled to be cast on the matter, excluding shares held by the acquirer and its associates as well as shares held by
certain insiders of the Fund. The Control Share Statute provides procedures for an acquirer to request a shareholder meeting for the purpose of considering whether voting
rights shall be accorded to control shares. Further approval by the Fund’s shareholders would be required with respect to additional acquisitions of control shares
above the next applicable threshold level. In addition, the Fund’s Board of Trustees is permitted, but not obligated to, exempt specific acquisitions or classes of
acquisitions of control shares, either in advance or retroactively.
The Control
Share Statute does not retroactively apply to acquisitions of shares that occurred prior to the Effective Date. However, such shares will be aggregated with any shares
acquired after the Effective Date for purposes of determining whether a voting power threshold is exceeded, resulting in the newly acquired shares constituting control
shares.
The Control Share Statute requires shareholders to disclose to the Fund any
control share acquisition within 10 days of such acquisition and, upon request, to provide any information that the Fund’s Board of Trustees reasonably believes is
necessary or desirable to determine whether a control share acquisition has occurred.
The foregoing is only a summary of certain aspects of the Control Share Statute. Shareholders should consult their own legal counsel to determine the application of the Control Share Statute with respect to their shares of the Fund and any subsequent acquisitions of shares.
Allspring Income Opportunities Fund | 31
Other information (unaudited)
Board of trustees and
officers
The following table provides basic information about the Board of Trustees
(the “Trustees”) and Officers of the Fund. Each of the Trustees and Officers listed below acts in identical capacities for each fund in the Allspring family of
funds, which consists of 126 mutual funds comprising the Allspring Funds Trust, Allspring Variable Trust, Allspring Master Trust, and four closed-end funds, including the
Fund (collectively the “Fund Complex”). The mailing address of each Trustee and Officer is 1415 Vantage Park Drive, 3rd Floor, Charlotte, NC 28203. The Board of
Trustees is classified into three classes of which one is elected annually. Each Trustee serves a three-year term concurrent with the class from which the Trustee is elected.
Each Officer serves an indefinite term.
Independent Trustees
| |
|
Principal occupations during past five years or
longer |
Current other
public company
or
investment
company
directorships |
Class I - Non-Interested Trustees to serve until 2026 Annual Meeting of
Shareholders |
Isaiah
Harris, Jr.
(Born 1952) |
Trustee,
since 2010;
Audit Committee
Chair,
since 2019 |
Retired. Member of the Advisory Board of CEF of East Central Florida.
Chairman of the Board of CIGNA Corporation from 2009 to
2021, and Director from 2005 to 2008. From 2003 to 2011,
Director of Deluxe Corporation. Prior thereto, President and CEO of
BellSouth Advertising and Publishing Corp. from 2005 to
2007, President and CEO of BellSouth Enterprises from 2004 to
2005 and President of BellSouth Consumer Services from 2000 to 2003.
Emeritus member of the Iowa State University Foundation
Board of Governors. Emeritus Member of the Advisory board of
Iowa State University School of Business. Advisory Board Member, Palm
Harbor Academy (private school). Advisory Board Member,
Fellowship of Christian Athletes. Mr. Harris is a certified public
accountant (inactive status). |
|
David F.
Larcker
(Born 1950) |
|
Distinguished Visiting Fellow at the Hoover Institution since 2022. James
Irvin Miller Professor of Accounting at the Graduate School
of Business (Emeritus), Stanford University, Director of the
Corporate Governance Research Initiative and Senior Faculty of The Rock
Center for Corporate Governance since 2006. From 2005 to
2008, Professor of Accounting at the Graduate School of
Business, Stanford University. Prior thereto, Ernst & Young Professor
of Accounting at The Wharton School, University of Pennsylvania
from 1985 to 2005. |
|
Olivia S.
Mitchell
(Born 1953) |
Trustee,
since 2010;
Nominating and
Governance
Committee Chair,
since 2018 |
International Foundation of Employee Benefit Plans Professor since 1993,
Wharton School of the University of Pennsylvania. Director
of Wharton’s Pension Research Council and Boettner Center on Pensions & Retirement Research, and Research Associate at the National Bureau of Economic
Research. Previously taught at Cornell University from 1978 to 1993.
|
|
Class II - Non-Interested Trustees to serve until 2024 Annual Meeting
of Shareholders |
William R.
Ebsworth
(Born 1957) |
|
Retired. From 1984 to 2013, equities analyst, portfolio manager, research
director and chief investment officer at Fidelity
Management and Research Company in Boston, Tokyo, and Hong
Kong, and retired in 2013 as Chief Investment Officer of Fidelity
Strategic Advisers, Inc. where he led a team of investment
professionals managing client assets. Prior thereto, Board member of Hong Kong Securities Clearing Co., Hong Kong Options Clearing Corp., the Thailand International
Fund, Ltd., Fidelity Investments Life Insurance Company, and Empire
Fidelity Investments Life Insurance Company. Audit
Committee Chair and Investment Committee Chair of the Vincent
Memorial Hospital Foundation (non-profit organization). Mr. Ebsworth is a CFA
charterholder. |
|
Jane A.
Freeman
(Born 1953) |
Trustee,
since 2015;
Chair Liaison,
since 2018 |
Retired. From 2012 to 2014 and 1999 to 2008, Chief Financial Officer of
Scientific Learning Corporation. From 2008 to 2012, Ms.
Freeman provided consulting services related to strategic
business projects. Prior to 1999, Portfolio Manager at Rockefeller &
Co. and Scudder, Stevens & Clark. Board member of the
Harding Loevner Funds from 1996 to 2014, serving as both Lead
Independent Director and chair of the Audit Committee. Board member of
the Russell Exchange Traded Funds Trust from 2011 to 2012
and the chair of the Audit Committee. Ms. Freeman is also an
inactive Chartered Financial Analyst. |
|
32 | Allspring Income Opportunities Fund
Other information (unaudited)
| |
Position held and
length of service* |
Principal occupations during past five years or
longer |
Current other
public company
or
investment
company
directorships |
Class III - Non-Interested Trustees to serve until 2025 Annual Meeting
of Shareholders |
Timothy J.
Penny
(Born 1951) |
Trustee,
since 2010;
Chair,
since 2018 |
President and Chief Executive Officer of Southern Minnesota Initiative
Foundation, a non-profit organization, since 2007. Vice
Chair of the Economic Club of Minnesota, since 2007. Co-Chair of the Committee for a Responsible Federal Budget, since 1995. Member of the Board of Trustees of
NorthStar Education Finance, Inc., a non-profit organization, from
2007-2022. Senior Fellow of the University of Minnesota Humphrey
Institute from 1995 to 2017. |
|
James G.
Polisson
(Born 1959) |
|
Retired. Chief Marketing Officer, Source (ETF) UK Services, Ltd, from
2015 to 2017. From 2012 to 2015, Principal of The Polisson
Group, LLC, a management consulting, corporate advisory and
principal investing company. Chief Executive Officer and Managing
Director at Russell Investments, Global Exchange Traded
Funds from 2010 to 2012. Managing Director of Barclays
Global Investors from 1998 to 2010 and Global Chief Marketing Officer for
iShares and Barclays Global Investors from 2000 to 2010.
Trustee of the San Francisco Mechanics’ Institute, a non- profit organization, from 2013 to 2015. Board member of the Russell Exchange Traded Fund Trust
from 2011 to 2012. Director of Barclays Global Investors Holdings
Deutschland GmbH from 2006 to 2009. Mr. Polisson is an
attorney and has a retired status with the Massachusetts and District of Columbia Bar Associations. |
|
Pamela Wheelock
(Born 1959) |
Trustee,
since January 2020;
previously Trustee from
January 2018 to
July 2019 |
Retired. Executive and Senior Financial leadership positions in the public, private and nonprofit
sectors. Interim President and CEO, McKnight Foundation, 2020. Interim
Commissioner, Minnesota Department of Human Services, 2019.
Chief Operating Officer, Twin Cities Habitat for Humanity,
2017-2019. Vice President for University Services, University of Minnesota, 2012- 2016. Interim President and CEO, Blue Cross and Blue Shield of Minnesota, 2011-2012. Executive
Vice-President and Chief Financial Officer, Minnesota Wild, 2002-2008.
Commissioner, Minnesota Department of Finance, 1999-2002.
Chair of the Board of Directors of Destination Medical Center
Corporation. Board member of the Minnesota Wild Foundation. |
|
| |
Length of service dates reflect the Trustee’s commencement of service with the Trust’s predecessor entities, where applicable. |
Allspring Income Opportunities Fund | 33
Other information (unaudited)
Officers1
| |
Position held and
length of
service |
Principal occupations during past five years or
longer |
| |
|
President and Chief Executive Officer of Allspring Funds Management, LLC
since 2017 and Head of Global Fund Governance of Allspring
Global Investments since 2022. Prior thereto, co-president of Galliard Capital Management, LLC, an affiliate of Allspring Funds Management, LLC, from 2019 to 2022 and Head of Affiliated
Managers, Allspring Global Investments, from 2014 to 2019 and Executive
Vice President responsible for marketing, investments and product
development for Allspring Funds Management, LLC, from 2009 to 2014. |
Jeremy DePalma
(Born 1974) |
Treasurer,
since 2012
(for certain funds in
the Fund Complex);
since 2021 (for
the remaining funds
in the Complex) |
Senior Vice President of Allspring Funds Management, LLC since 2009.
Senior Vice President of Evergreen Investment Management
Company, LLC from 2008 to 2010 and head of the Fund Reporting and Control Team within Fund Administration from 2005 to 2010.
|
Christopher Baker
(Born 1976) |
Chief Compliance
Officer,
since 2022 |
Global Chief Compliance Officer for Allspring Global Investments since
2022. Prior thereto, Chief Compliance Officer for State
Street Global Advisors from 2018 to 2021. Senior Compliance Officer for the State Street divisions of Alternative Investment Solutions, Sector Solutions, and Global Marketing from 2015 to 2018. From 2010 to 2015
Vice President, Global Head of Investment and Marketing Compliance for State
Street Global Advisors. |
Matthew Prasse
(Born 1983) |
Chief Legal Officer,
since 2022;
Secretary,
since 2021 |
Senior Counsel of the Allspring Legal Department since 2021. Senior Counsel of the Wells Fargo Legal Department
from 2018 to 2021. Previously, Counsel for Barings LLC from 2015 to 2018.
Prior to joining Barings, Associate at Morgan, Lewis & Bockius
LLP from 2008 to 2015. |
1 For those Officers with tenures at Allspring Global Investments and/or Allspring Funds Management, LLC that began prior to 2021, such tenures include years of service during which these businesses/entities were known as Wells Fargo Asset Management and Wells Fargo Funds Management, LLC, respectively.
34 | Allspring Income Opportunities Fund
Other information (unaudited)
Board consideration of investment
management and sub-advisory agreements:
Under the Investment Company Act of 1940 (the “1940 Act”), the Board of Trustees (the
“Board”) of the Allspring Income Opportunities Fund (the “Fund”) must determine annually whether to approve the continuation of the Fund’s
investment advisory and sub-advisory agreements. In this regard, at a Board meeting held on May 15-17, 2023 (the “Meeting”), the Board, all the members of which
have no direct or indirect interest in the investment advisory and sub-advisory agreements and are not “interested persons” of the Fund, as defined in the 1940
Act (the “Independent Trustees”), reviewed and approved: (i) an investment advisory agreement with Allspring Funds Management, LLC (“Allspring Funds
Management”); and (ii) an investment sub-advisory agreement with Allspring Global Investments, LLC (the “Sub-Adviser”), an affiliate of Allspring Funds
Management. The investment advisory agreement with Allspring Funds Management and the investment sub-advisory agreement with the Sub-Adviser are collectively referred to as
the “Advisory Agreements.”
At the Meeting, the Board considered the factors and reached the conclusions described below relating to the selection of Allspring Funds Management and the Sub-Adviser and the approval of the Advisory Agreements. Prior to the Meeting, including at a Board meeting held in April 2023, and at the Meeting, the Trustees conferred extensively among themselves and with representatives of Allspring Funds Management about these matters. The Board has adopted a team-based approach, with each team consisting of a sub-set of Trustees, to assist the full Board in the discharge of its duties in reviewing investment performance and other matters throughout the year. The Trustees were assisted in their evaluation of the Advisory Agreements by independent legal counsel, from whom they received separate legal advice and with whom they met separately.
The Board noted that it initially approved the Advisory Agreements at a Board meeting held in May
2021, each for a two-year term, in advance of the sale of Wells Fargo Asset Management to Allspring Global Investments Holdings, LLC,1 a holding company indirectly owned by certain private funds of GTCR LLC and Reverence Capital Partners, L.P. (the “Transaction”). The Trustees also noted that, while they did not specifically consider the continuation of the Advisory Agreements in 2022 as a result of the two-year term that was approved in 2021, the Trustees received and considered certain information at a Board meeting held in April 2022 that was applicable to the Advisory Agreements, including an overview and financial review of the Allspring Global Investments business, information regarding certain ancillary agreements that were approved by the Board at the April 2022 Board meeting, and comparative data regarding Fund fees and expenses.
In providing information to the Board, Allspring Funds Management and the Sub-Adviser were guided by a detailed set of requests for information submitted to them by independent legal counsel on behalf of the Independent Trustees at the start of the Board’s annual contract renewal process earlier in 2023. In considering and approving the Advisory Agreements, the Trustees considered the information they believed relevant, including but not limited to the information discussed below. The Board considered not only the specific information presented in connection with the Meeting, but also the knowledge gained over time through interactions with Allspring Funds Management and the Sub-Adviser about various topics. In this regard, the Board reviewed reports of Allspring Funds Management at each of its quarterly meetings, which included, among other things, portfolio reviews and investment performance reports. In addition, the Board and the teams mentioned above confer with portfolio managers at various times throughout the year. The Board did not identify any particular information or consideration that was all-important or controlling, and each individual Trustee may have attributed different weights to various factors.
After its deliberations, the Board unanimously determined that the compensation payable to Allspring Funds Management and the Sub-Adviser under each of the Advisory Agreements was reasonable, and approved the continuation of the Advisory Agreements for a one-year term. The Board considered the approval of the Advisory Agreements for the Fund as part of its consideration of agreements for funds across the complex, but its approvals were made on a fund-by-fund basis. The following summarizes a number of important, but not necessarily all, factors considered by the Board in support of its approvals.
Nature, extent,
and quality of services
The Board received and considered various information
regarding the nature, extent and quality of services provided to the Fund by Allspring Funds Management and the Sub-Adviser under the Advisory Agreements. This information
included, among other things, a summary of the background and experience of senior management of Allspring Global Investments, of which Allspring Funds Management and the
Sub-Adviser are a part, and a summary of investments made in the Allspring Global Investments business. The Board also considered information about retention arrangements
with respect to key personnel of Allspring Global Investments that were put in place in connection with the Transaction. The Board took into account information about the services that continue to be provided by Wells Fargo & Co. and/or its affiliates (“Wells Fargo”) since the Transaction under a transition services agreement and the anticipated timeline for exiting the transition services agreement. In addition, the Board received and considered information about the full range of services provided to the Fund by Allspring Funds Management and its affiliates.
The Board considered the additional services provided to the Fund due to the fact that the Fund is a closed-end fund, including, but not limited to, leverage management and monitoring, evaluating, and, where appropriate, making recommendations with respect to the Fund’s trading discount, share repurchase program, managed distribution program, and distribution rates, as well as shareholder relations activities.
1
The trade name for the asset management firm that includes Allspring Funds Management
and the Sub-Adviser is “Allspring Global Investments.”
Allspring Income Opportunities Fund | 35
Other information (unaudited)
The Board considered
the qualifications, background, tenure, and responsibilities of each of the portfolio managers primarily responsible for the day-to-day portfolio management of the Fund. The
Board evaluated the ability of Allspring Funds Management and the Sub-Adviser to attract and retain qualified investment professionals, including research, advisory and
supervisory personnel.
The Board further considered the compliance programs and
compliance records of Allspring Funds Management and the Sub-Adviser. The Board received and considered information about Allspring Global Investments’ risk management
functions, which included information about Allspring Funds Management’s and the Sub-Adviser’s business continuity plans and their approaches to data privacy and
cybersecurity. The Board also received and considered information about Allspring Funds Management’s intermediary and vendor oversight program.
Fund investment performance and expenses
The Board considered the investment performance results for the Fund over various time periods
ended December 31, 2022. The Board considered these results in comparison to the investment performance of funds in a Universe that was determined by Broadridge Inc.
(“Broadridge”) to be similar to the Fund (the “Universe”), and in comparison to the Fund’s benchmark index and to other comparative data. The
Board received a description of the methodology used by Broadridge to select the funds in the performance Universe. The Board noted that the investment performance of
the Fund was higher than the average investment performance of the Universe for all periods under review except for the one-year period, which was in range of the average investment performance of the Universe. The Board also noted that the performance of the Fund was higher than its benchmark, the ICE BofA U.S. High Yield Constrained Index, for all periods under review except for the one-year period, which was lower than its benchmark index.
The Board also received and considered information regarding the Fund’s net operating
expense ratio and its various components, including actual management fees, and custodian and other non-management fees. The Board considered this ratio in comparison to the
median ratio of funds in an expense group that was determined by Broadridge to be similar to the Fund (the “Expense Groups”). Broadridge is an independent
provider of investment company data. The Board received a description of the methodology used by Broadridge and Allspring Funds Management to select the funds in the Expense Groups, and an explanation from Broadridge of how funds comprising Broadridge expense groups and their expense ratios may vary from year-to-year. Based on the Broadridge reports, the Board noted that the net operating expense ratio of the Fund was lower than the median net operating expense ratios of the Expense Groups.
The Board took into account the Fund’s investment performance and expense information provided to it among the factors considered in deciding to re-approve the Advisory Agreements.
Investment advisory and sub-advisory fee rates
The Board reviewed and considered the contractual investment advisory fee rate that is payable by the Fund to Allspring Funds Management for investment advisory services (the “Advisory Agreement Rate”), both on a stand-alone basis and on a combined basis with the Fund’s contractual administration fee rate (the “Management Rate”). The Board also reviewed and considered the contractual investment sub-advisory fee rate that is payable by Allspring Funds Management to the Sub-Adviser for investment sub-advisory services (the “Sub-Advisory Agreement Rate”).
Among other information reviewed by the Board was a comparison of the Management Rate of the Fund
with those of other funds in the Expense Groups at a common asset level. The Board noted that the Management Rate of the Fund was lower than the average rates for its Expense
Groups.
The Board also received and considered information about the portion of the
total advisory fee that was retained by Allspring Funds Management after payment of the fee to the Sub-Adviser for sub-advisory services. In assessing the reasonableness of
this amount, the Board received and evaluated information about the nature and extent of responsibilities retained and risks assumed by Allspring Funds Management and not
delegated to or assumed by the Sub-Adviser, and about Allspring Funds Management’s on-going oversight services. Given the affiliation between Allspring Funds Management
and the Sub-Adviser, the Board ascribed limited relevance to the allocation of the advisory fee between them.
Based on its consideration of the factors and information it deemed relevant, including those
described here, the Board determined that the Advisory Agreement Rate and the Sub-Advisory Agreement Rate were reasonable.
Profitability
The Board received and considered information concerning the profitability of Allspring Funds Management, as well as the profitability of Allspring Global Investments, from providing services to the fund complex as a whole. The Board noted that the Sub-Adviser’s profitability information with respect to providing services to the Fund and other funds in the complex was subsumed in the Allspring Global Investments profitability analysis.
Allspring Funds Management reported on the methodologies and estimates used in calculating
profitability, including a description of the methodology used to allocate certain expenses and differences in how Allspring Global Investments calculates its pre-tax profit
metric versus the methodology used when Allspring Funds Management was part of Wells Fargo. It was noted that the impact of such differences had only minor impact on the
financial results presented. Among other things, the Board noted that the levels of profitability reported on a fund-by-fund basis varied widely, depending on factors such as the size, type, and age of fund.
36 | Allspring Income Opportunities Fund
Other information (unaudited)
Based on its review,
the Board did not deem the profits reported by Allspring Funds Management or Allspring Global Investments from services provided to the Fund to be at a level that would
prevent it from approving the continuation of the Advisory Agreements.
Economies of
scale
The Board received and considered information about the potential for
Allspring Funds Management to experience economies of scale in the provision of management services, the difficulties of calculating economies of scale on an individual fund
level, and the extent to which potential scale benefits are shared with Fund shareholders. The Board noted that the Fund is not engaged in a continuous offering that could
help its assets grow, and that, as is typical of closed-end funds, there are no breakpoints in the Management Rate, which was reduced in 2019. Although the Fund would not
share in any potential economies of scale through contractual breakpoints, the Board noted that Allspring Funds Management shares potential economies of scale from its management business in a variety of ways, including through fee waiver and expense reimbursement arrangements, competitive management fee rates set at the outset without regard to breakpoints, and investments in the business intended to enhance services available to shareholders.
The Board concluded that Allspring Funds Management’s arrangements with respect to the Fund
constituted a reasonable approach to sharing potential economies of scale with the Fund and its shareholders. The Board also noted that it would have opportunities to revisit
the Management Rate as part of future contract reviews.
Other benefits to Allspring Funds Management and the Sub-Adviser
The Board received and considered information regarding potential “fall-out” or ancillary benefits received by Allspring Funds Management and its affiliates, including the Sub-Adviser, as a result of their relationships with the Fund. Ancillary benefits could include, among others, benefits directly attributable to other relationships with the Fund and benefits potentially derived from an increase in Allspring Funds Management’s and the Sub-Adviser’s business as a result of their relationships with the Fund. The Board also reviewed information about soft dollar credits earned and utilized by the Sub-Adviser.
Based on
its consideration of the factors and information it deemed relevant, including those described here, the Board did not find that any ancillary benefits received by Allspring
Funds Management and its affiliates, including the Sub-Adviser, were unreasonable.
Conclusion
At the Meeting, after considering the above-described factors and based on its deliberations and its evaluation of the information described above, the Board unanimously determined that the compensation payable to Allspring Funds Management and the Sub-Adviser under each of the Advisory Agreements was reasonable, and approved the continuation of the Advisory Agreements for a one-year term.
Allspring Income Opportunities Fund | 37
Automatic dividend reinvestment plan
Automatic dividend reinvestment
plan
All common shareholders are eligible to participate in the Automatic Dividend
Reinvestment Plan (“the Plan”). Pursuant to the Plan, unless a common shareholder is ineligible or elects otherwise, all cash dividends and capital gains
distributions are automatically reinvested by Computershare Trust Company, N.A., as agent for shareholders in administering the Plan (“Plan Agent”), in additional
common shares of the Fund. Whenever the Fund declares an ordinary income dividend or a capital gain dividend (collectively referred to as “dividends”) payable
either in shares or in cash, nonparticipants in the Plan will receive cash, and participants in the Plan will receive the equivalent in common shares. The shares are acquired
by the Plan Agent for the participant’s account, depending upon the circumstances described below, either (i) through receipt of additional unissued but authorized
common shares from the Fund (“newly issued common shares”) or (ii) by purchase of outstanding common shares on the open-market (open-market purchases) on the NYSE Amex or elsewhere. If, on the payment date for any dividend or distribution, the net asset value per share of the common shares is equal to or less than the market price per common share plus estimated brokerage commissions (“market premium”), the Plan Agent will invest the amount of such dividend or distribution in newly issued shares on behalf of the participant. The number of newly issued common shares to be credited to the participant’s account will be determined by dividing the dollar amount of the dividend by the net asset value per share on the date the shares are issued, provided that the maximum discount from the then current market price per share on the date of issuance may not exceed 5%. If on the dividend payment date the net asset value per share is greater than the market value (“market discount”), the Plan Agent will invest the dividend amount in shares acquired on behalf of the participant in open-market purchases. There will be no brokerage charges with respect to shares issued directly by the Fund as a result of dividends or capital gains distributions payable either in shares or in cash. However, each participant will pay a pro rata share of brokerage commissions incurred with respect to the Plan Agent’s open-market purchases in connection with the reinvestment of dividends. The automatic reinvestment of dividends and distributions will not relieve participants of any federal, state or local income tax that may be payable (or required to be withheld) on such dividends. All correspondence concerning the Plan should be directed to the Plan Agent at P.O. Box 505000, Louisville, Kentucky 40233 or by calling 1-800-730-6001.
38 | Allspring Income Opportunities Fund
Transfer Agent, Registrar, Shareholder
Servicing
Agent & Dividend Disbursing Agent
Computershare Trust Company, N.A.
P.O. Box 505000
Louisville, Kentucky 40233
1-800-730-6001
Website: allspringglobal.com
Allspring Global InvestmentsTM is the trade name for the asset management firms of Allspring Global
Investments Holdings, LLC, a holding company indirectly owned by certain private funds of GTCR LLC and Reverence Capital Partners, L.P. These firms include but are not
limited to Allspring Global Investments, LLC, and Allspring Funds Management, LLC. Certain products managed by Allspring entities are distributed by Allspring Funds
Distributor, LLC (a broker-dealer and Member FINRA/SIPC).
This material is for
general informational and educational purposes only and is NOT intended to provide investment advice or a recommendation of any kind - including a recommendation for any
specific investment, strategy, or plan.
© 2023 Allspring Global Investments
Holdings, LLC. All rights reserved.
ALL-11032023-usjqxiz2 12-23
SAR148 10-23
ITEM 2. CODE OF ETHICS
Not applicable.
ITEM 3. AUDIT COMMITTEE FINANCIAL EXPERT
Not applicable.
ITEM 4. PRINCIPAL ACCOUNTANT FEES
AND SERVICES
Not applicable.
ITEM 5. AUDIT
COMMITTEE OF LISTED REGISTRANTS
Not applicable.
ITEM 6. INVESTMENTS
A Portfolio of Investments for
Allspring Income Opportunities Fund is included as part of the report to shareholders filed under Item 1 of this Form.
ITEM 7. DISCLOSURE OF PROXY
VOTING POLICIES AND PROCEDURES FOR CLOSED-END MANAGEMENT INVESTMENT COMPANIES
Not applicable.
ITEM 8. PORTFOLIO MANAGERS OF CLOSED-END MANAGEMENT INVESTMENT COMPANIES
Not applicable.
ITEM 9. PURCHASES OF EQUITY SECURITIES BY CLOSED-END MANAGEMENT INVESTMENT
COMPANY AND AFFILIATED PURCHASERS
|
|
|
|
|
|
|
|
|
|
|
|
|
|
|
|
|
| |
|
(a) |
|
|
(b) |
|
|
(c) |
|
|
(d) |
|
| Period |
|
Total Number
of Shares
Purchased |
|
|
Average
Price Paid
per Share |
|
|
Total Number of
Shares Purchased as
Part of Publicly
Announced Plans or
Programs |
|
|
Maximum Number
of Shares that May
Yet Be Purchased
Under the Plans or
Programs |
|
| 5/1/2023 to 5/31/2023 |
|
|
0 |
|
|
|
0 |
|
|
|
0 |
|
|
|
2,924,870 |
|
| 6/1/2023 to 6/30/2023 |
|
|
35,284 |
|
|
|
6.27 |
|
|
|
35,284 |
|
|
|
2,889,586 |
|
| 7/1/2023 to 7/31/2023 |
|
|
103,563 |
|
|
|
6.42 |
|
|
|
103,563 |
|
|
|
2,786,023 |
|
| 8/1/2023 to 8/31/2023 |
|
|
108,583 |
|
|
|
6.38 |
|
|
|
108,583 |
|
|
|
2,677,440 |
|
| 9/1/2023 to 9/30/2023 |
|
|
0 |
|
|
|
0 |
|
|
|
0 |
|
|
|
2,677,440 |
|
| 10/1/2023 to 10/31/2023 |
|
|
48,856 |
|
|
|
6.02 |
|
|
|
48,856 |
|
|
|
2,628,584 |
|
| Total |
|
|
296,286 |
|
|
|
6.27 |
|
|
|
296,286 |
|
|
|
2,628,584 |
|
On November 12, 2022, the Fund announced a renewal of its open-market share repurchase program (the “Buyback
Program”). Under the renewed Buyback Program, the Fund may repurchase up to 5% of its outstanding shares in open market transactions during the period beginning on January 1, 2023 and
3
ending on December 31, 2023. The Fund’s Board of Trustees has delegated to Allspring Funds Management, LLC, the Fund’s adviser, discretion to administer the Buyback Program,
including the determination of the amount and timing of repurchases in accordance with the best interests of the Fund and subject to applicable legal limitations.
ITEM 10. SUBMISSION OF MATTERS TO A VOTE OF SECURITY HOLDERS
There have been no material changes to the procedures by which shareholders may recommend nominees to the registrant’s Board of Trustees that have been
implemented since the registrant’s last provided disclosure in response to the requirements of this Item.
ITEM 11. CONTROLS AND PROCEDURES
(a) The President and Treasurer have concluded that the Allspring Income Opportunities Fund (the “Fund”) disclosure controls and procedures
(as defined in Rule 30a-3(c) under the Investment Company Act of 1940) provide reasonable assurances that material information relating to the Fund is made known to them by the appropriate persons
based on their evaluation of these controls and procedures as of a date within 90 days of the filing of this report.
(b) There were no significant
changes in the registrant’s internal control over financial reporting (as defined in Rule 30a-3(d) under the Investment Company Act of 1940) that occurred during the period covered by this
report that materially affected, or is reasonably likely to materially affect, the registrant’s internal control over financial reporting.
ITEM
12. DISCLOSURES OF SECURITIES LENDING ACTIVITES FOR CLOSED-END MANAGEMENT INVESTMENT COMPANIES
Not applicable.
ITEM 13. EXHIBITS
(a)(1) Not applicable.
(a)(2) Certifications
pursuant to Section 302 of the Sarbanes-Oxley Act of 2022.
(a)(3) Not applicable.
(a)(4) Not applicable.
(b) Certifications
pursuant to Section 906 of the Sarbanes-Oxley Act of 2022.
4
SIGNATURES
Pursuant to the requirements of the Securities Exchange Act of 1934 and the Investment Company Act of 1940, the registrant has duly caused this report to be
signed on its behalf by the undersigned, thereunto duly authorized.
|
|
|
| Allspring Income Opportunities Fund |
|
|
| By: |
|
/s/ Andrew Owen |
|
|
Andrew Owen |
|
|
President |
|
| Date: December 21, 2023 |
Pursuant to the requirements of the Securities Exchange Act of 1934 and the Investment Company Act of 1940, this report
has been signed below by the following persons on behalf of the registrant and in the capacities and on the date indicated.
|
|
|
| Allspring Income Opportunities Fund |
|
|
| By: |
|
/s/ Andrew Owen |
|
|
Andrew Owen |
|
|
President |
|
| Date: December 21, 2023 |
|
|
| By: |
|
/s/ Jeremy DePalma |
|
|
Jeremy DePalma |
|
|
Treasurer |
|
| Date: December 21, 2023 |
Exhibit 13(a)(2)

CERTIFICATION
I, Andrew Owen, certify that:
1. I have reviewed this report on
Form N-CSRS of Allspring Income Opportunities Fund.
2. Based on my knowledge, this report does not
contain any untrue statement of a material fact or omit to state a material fact necessary to make the statements made, in light of the circumstances under which such statements were made, not misleading with respect to the period covered by this
report;
3. Based on my knowledge, the financial statements, and other financial information included in this report, fairly present in all material
respects the financial condition, results of operations, changes in net assets, and cash flows (if the financial statements are required to include a statement of cash flows) of the registrant as of, and for, the periods presented in this report;
4. The registrant’s other certifying officers and I are responsible for establishing and maintaining disclosure controls and procedures (as defined
in Rule 30a-3(c) under the Investment Company Act of 1940) and internal control over financial reporting (as defined in Rule 30a-3(d) under the
Investment Company Act of 1940) for the registrant and have:
a) designed such disclosure controls and procedures or caused such disclosure
controls and procedures to be designed under our supervision, to ensure that material information relating to the registrant, including its consolidated subsidiaries, is made known to us by others within those entities, particularly during the
period in which this report is being prepared;
b) designed such internal control over financial reporting, or caused such internal control
over financial reporting to be designed under our supervision, to provide reasonable assurance regarding the reliability of financial reporting and the preparation of financial statements for external purposes in accordance with generally accepted
accounting principles;
c) evaluated the effectiveness of the registrant’s disclosure controls and procedures and presented in this
report our conclusions about the effectiveness of the disclosure controls and procedures, as of a date within 90 days prior to the filing of this report based on such evaluation; and
d) disclosed in this report any change in the registrant’s internal controls over financial reporting that occurred during the period
covered by this report that has materially affected, or is reasonably likely to materially affect, the registrant’s internal control over financial reporting; and
5. The registrant’s other certifying officers and I have disclosed to the registrant’s auditors and the audit committee of the registrant’s
Board of Trustees (or persons performing the equivalent functions):
a) all significant deficiencies and material weaknesses in the design
or operation of internal controls over financial reporting which are reasonably likely to adversely affect the registrant’s ability to record, process, summarize, and report financial information; and
b) any fraud, whether or not material, that involves management or other employees who have a
significant role in the registrant’s internal controls over financial reporting.
|
| Date: December 21, 2023 |
|
| /s/ Andrew Owen |
| Andrew Owen |
| President |
| Allspring Income Opportunities Fund |
CERTIFICATION
I, Jeremy DePalma, certify that:
1. I have reviewed this report
on Form N-CSRS of Allspring Income Opportunities Fund.
2. Based on my knowledge, this report does not
contain any untrue statement of a material fact or omit to state a material fact necessary to make the statements made, in light of the circumstances under which such statements were made, not misleading with respect to the period covered by this
report;
3. Based on my knowledge, the financial statements, and other financial information included in this report, fairly present in all material
respects the financial condition, results of operations, changes in net assets, and cash flows (if the financial statements are required to include a statement of cash flows) of the registrant as of, and for, the periods presented in this report;
4. The registrant’s other certifying officers and I are responsible for establishing and maintaining disclosure controls and procedures (as defined
in Rule 30a-3(c) under the Investment Company Act of 1940) and internal control over financial reporting (as defined in Rule 30a-3(d) under the
Investment Company Act of 1940) for the registrant and have:
a) designed such disclosure controls and procedures or caused such disclosure
controls and procedures to be designed under our supervision, to ensure that material information relating to the registrant, including its consolidated subsidiaries, is made known to us by others within those entities, particularly during the
period in which this report is being prepared;
b) designed such internal control over financial reporting, or caused such internal control
over financial reporting to be designed under our supervision, to provide reasonable assurance regarding the reliability of financial reporting and the preparation of financial statements for external purposes in accordance with generally accepted
accounting principles;
c) evaluated the effectiveness of the registrant’s disclosure controls and procedures and presented in this
report our conclusions about the effectiveness of the disclosure controls and procedures, as of a date within 90 days prior to the filing of this report based on such evaluation; and
d) disclosed in this report any change in the registrant’s internal controls over financial reporting that occurred during the period
covered by this report that has materially affected, or is reasonably likely to materially affect, the registrant’s internal control over financial reporting; and
5. The registrant’s other certifying officers and I have disclosed to the registrant’s auditors and the audit committee of the registrant’s
Board of Trustees (or persons performing the equivalent functions):
a) all significant deficiencies and material weaknesses in the design
or operation of internal controls over financial reporting which are reasonably likely to adversely affect the registrant’s ability to record, process, summarize, and report financial information; and
b) any fraud, whether or not material, that involves management or other employees who have a
significant role in the registrant’s internal controls over financial reporting.
|
| Date: December 21, 2023 |
|
| /s/ Jeremy DePalma |
| Jeremy DePalma |
| Treasurer |
| Allspring Income Opportunities Fund |
Exhibit 13(b)
SECTION 906 CERTIFICATION
Pursuant to 18 U.S.C. § 1350, the undersigned officer of Allspring Income Opportunities Fund, hereby certifies, to the best of his
knowledge, that the registrant’s report on Form N-CSRS for the six months ended October 31, 2023 (the “Report”) fully complies with the requirements of Section 13(a) or
Section 15(d), as applicable, of the Securities Exchange Act of 1934 and that the information contained in the Report fairly presents, in all material respects, the financial condition and results of operations of the registrant.
Date: December 21, 2023
|
|
|
| By: |
|
/s/ Andrew Owen |
|
|
Andrew Owen |
|
|
President |
|
|
Allspring Income Opportunities Fund |
This certification is being furnished to the Securities and Exchange Commission pursuant to Rule 30a-2(b) under the Investment Company Act of 1940, as amended, and 18 U.S.C. Section 1350 and is not being filed as part of the Form N-CSRS with
the Securities and Exchange Commission.
SECTION 906 CERTIFICATION
Pursuant to 18 U.S.C. § 1350, the undersigned officer of Allspring Income Opportunities Fund, hereby certifies, to the best of his
knowledge, that the registrant’s report on Form N-CSRS for the six months ended October 31, 2023 (the “Report”) fully complies with the requirements of Section 13(a) or
Section 15(d), as applicable, of the Securities Exchange Act of 1934 and that the information contained in the Report fairly presents, in all material respects, the financial condition and results of operations of the registrant.
Date: December 21, 2023
|
|
|
| By: |
|
/s/ Jeremy DePalma |
|
|
Jeremy DePalma |
|
|
Treasurer |
|
|
Allspring Income Opportunities Fund |
This certification is being furnished to the Securities and Exchange Commission pursuant to Rule 30a-2(b) under the Investment Company Act of 1940, as amended, and 18 U.S.C. Section 1350 and is not being filed as part of the Form N-CSRS with
the Securities and Exchange Commission.
Allspring Income Opportu... (AMEX:EAD)
Graphique Historique de l'Action
De Déc 2024 à Jan 2025

Allspring Income Opportu... (AMEX:EAD)
Graphique Historique de l'Action
De Jan 2024 à Jan 2025
