 Equity at 1 April 2012                 7,096,914 9,634,231   3,241,170   35,792,148   55,764,463

 Total comprehensive loss for the year:
 Loss for the year                              -         -           - (31,451,398) (31,451,398)
 Exchange difference on                         -         -     975,771            -      975,771
 translation of foreign holding
 Eliminate foreign holding                      -         - (4,216,941)            -  (4,216,941)
 exchange difference
 Total comprehensive loss for the year          -         - (3,241,170) (31,451,398) (34,692,568)

 Shares issued                             20,000   220,000           -            -      240,000
 Share issue costs                              -   (5,282)           -            -      (5,282)

 Equity at 31 March 2013                7,116,914 9,848,949           -    4,340,750   21,306,613

 Total comprehensive loss for the year:
 Loss for the year                              -         -           -  (7,173,703)  (7,173,703)

 Total comprehensive loss for the year          -         -           -  (7,173,703)  (7,173,703)

 Equity at 31 March 2014                7,116,914 9,848,949           -  (2,832,953)   14,132,910

 Company                                              Share       Share     Retained        Total
                                                  capital GBP   premium GBP     losses GBP            GBP
 Equity at 31 March 2012                          7,096,914   9,634,231  (4,243,847)   12,487,298

 Total comprehensive loss for the year:
 Loss for the year                                        -           -    (492,818)    (492,818)

 Total comprehensive loss for the year                    -           -    (492,818)    (492,818)
 Shares issued                                       20,000     220,000            -      240,000
 Share issue costs                                        -     (5,282)            -      (5,282)

 Equity at 31 March 2013                          7,116,914   9,848,949  (4,736,665)   12,229,198

 Total comprehensive loss for the year:
 Loss for the year                                        -           -    (475,676)    (475,676)
 Total comprehensive loss for the year                    -           -    (475,676)    (475,676)

 Equity at 31 March 2014                          7,116,914   9,848,949  (5,212,341)   11,753,522


Statement of cash flows of the group
                                                                         Year ended 31 Year ended 31
                                                                   Notes    March 2014    March 2013
                                                                                     GBP             GBP
Operating activities
                      Loss for the period                                  (7,173,703)  (31,451,398)
                      Adjustments for:
                      Investment income                              6         (2,630)      (36,941)
                      Finance costs                                  7         112,590       115,023
                      Share of loss of associate                                     -     4,572,320
                      Losses on deemed
                      disposals in associate                                         -     6,793,789
                      Loss on reclassification of associate as an
                      investment                                                     -    16,149,722
                      Impairment of investment                      14       5,451,267     3,791,439
                      Exchange difference on investment impairment  14       1,255,280     (321,186)
                      Foreign exchange movement                                  3,741      (11,196)

                                                                             (353,455)     (398,428)
                      Movements in working capital
                      Decrease in receivables                                   23,222        24,753
                      Decrease/(increase) in payables                           15,491      (36,902)

Net cash used in operating activities                                        (314,742)     (410,577)

Investing activities
                      Investment income                                          2,238        36,422
                      Mineral property exploration and evaluation             (65,003)   (1,166,413)
                      Addition to AFS investment in LIM                              -     (950,927)

Net cash used in investing activities                                         (62,765)   (2,080,918)

                      Loan received                                                                -

Net decrease in cash                                                         (377,507)   (2,491,495)
and cash equivalents
Cash and cash equivalents at start of year                                     670,345     3,150,644
Foreign exchange movement                                                      (3,741)        11,196

Cash and cash equivalents at end of year                            17         289,097       670,345


Statement of cash flows of the company
                                                           Notes      Year ended 31 Year ended 31
                                                                         March 2014    March 2013
                                                                                  GBP             GBP
Operating activities
                    Loss for the period                      23           (475,676)     (492,818)
                    Adjustments for:
                    Investment income                                       (2,013)      (27,361)
                    Finance costs                                           112,590       115,023

                                                                          (365,099)     (405,156)
                    Movements in working capital
                    Decrease/(increase) in receivables                       12,309       (2,031)
                    Increase/(decrease) in payables                          15,491      (36,902)

Net cash used in operating activities                                      (337,299)    (444,089)

Investing activities
                    Interest income                                          2,013        27,361
                    Investments and long term loans                        (20,884)   (1,122,585)

Net cash used in investing activities                                      (18,871)   (1,095,224)

Financing activities
                    Inter-company loan received                                   -     1,099,198

Net cash generated from financing activities                                      -     1,099,198

Net decrease in cash and cash equivalents                                  (356,170)     (440,115)

Cash and cash equivalents at start of period                                623,215     1,063,330

Cash and cash equivalents at end of period                                  267,045       623,215


Notes to the Accounts

1 General information

Anglesey Mining plc is domiciled and incorporated in England and Wales under
the Companies Act. The nature of the group's operations and its principal
activities are set out in note 3 and in the strategic report. The registered
office address is as shown on the rear cover.

These financial statements are presented in pounds sterling because that is
the currency of the primary economic environment in which the group has been
operating. Foreign operations are included in accordance with the policies set
out in note 2.

2 Significant accounting policies

Basis of Accounting

The group and company financial statements have been prepared in accordance
with International Financial Reporting Standards (IFRS) as adopted by the
European Union and therefore the group financial statements comply with
Article 4 of the EU IAS Regulation.

The financial statements have been prepared on the historical cost basis
except for the fair valuation of certain financial assets. The principal
accounting policies adopted are set out below.

Going concern

The financial statements are prepared on a going concern basis. The validity
of the going concern basis is dependent on finance being available for the
continuing working capital requirements of the group for the foreseeable
future, being a period of at least twelve months from the date of approval of
the accounts. For the reasons set out in the directors' report, the directors
believe that the going concern basis is appropriate for these accounts.

Basis of consolidation

The consolidated financial statements incorporate the financial statements of
the company and entities controlled by the company (its subsidiaries) made up
to 31 March each year. Control is achieved where the company has the power to
govern the financial and operating policies of an investee entity so as to
obtain benefits from its activities.

On acquisition, the assets and liabilities and contingent liabilities of a
subsidiary are measured at their fair values at the date of acquisition. Any
excess of the cost of acquisition over the fair values of the identifiable net
assets acquired is recognised as goodwill. Any deficiency of the cost of
acquisition below the fair values of the identifiable net assets acquired
(i.e. discount on acquisition) is credited to the income statement in the
period of acquisition. The results of subsidiaries acquired or disposed of
during the year are included in the group income statement from the effective
date of acquisition or up to the effective date of disposal, as appropriate.

Where necessary, adjustments are made to the financial statements of
subsidiaries to bring the accounting policies used into line with those used
by the group. All intra-group transactions, balances, income and expenses are
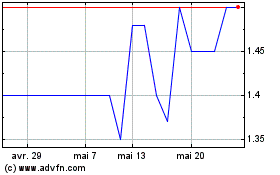
Anglesey Mining (LSE:AYM)
Graphique Historique de l'Action
De Juin 2024 à Juil 2024

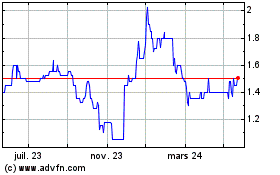
Anglesey Mining (LSE:AYM)
Graphique Historique de l'Action
De Juil 2023 à Juil 2024
