Ceiba Investments Limited Net Asset Value(s) (4606C)
23 Février 2022 - 8:01AM
UK Regulatory
TIDMCBA
RNS Number : 4606C
Ceiba Investments Limited
23 February 2022
23 February 2022
CEIBA INVESTMENTS LIMITED
(the "Company")
(TICKER CBA, ISIN: GG00BFMDJH11)
Legal Entity Identifier : 213800XGY151JV5B1E88
UNAUDITED NET ASSET VALUE PER SHARE AS AT 30 SEPTEMBER 2021
CEIBA Investments Limited, the largest international company
solely dedicated to investing in Cuba, announces that its unaudited
IFRS net asset value per share ("IFRS NAV") as at 30 September 2021
was USD 1.2967 (30 June 2021: USD1.3089).
Applying the GBP:USD exchange rate as at 30 September 2021 of USD1.3484:GBP1.00 (30 June 2021 USD1.3819:GBP1.00), the unaudited IFRS NAV in Sterling was GBP0.9616 (30 June 2021 GBP0.9472) per share .
END OF ANNOUNCEMENT
For further information, please contact:
 Aberdeen Standard Fund Managers Limited         Tel: +44 (0)20 7463
  Sebastiaan Berger / Evan Bruce-Gardyne          6000
 N+1 Singer                                      Tel: +44 (0)20 7496
  James Maxwell / Michael Nothnagel (Corporate    3000
  Finance)
  James Waterlow (Sales)
 JTC Fund Solutions (Guernsey) Limited           Tel: +44 (0)1481 702400
www.ceibainvestments.co.uk
***END***
This information is provided by RNS, the news service of the
London Stock Exchange. RNS is approved by the Financial Conduct
Authority to act as a Primary Information Provider in the United
Kingdom. Terms and conditions relating to the use and distribution
of this information may apply. For further information, please
contact rns@lseg.com or visit www.rns.com.
RNS may use your IP address to confirm compliance with the terms
and conditions, to analyse how you engage with the information
contained in this communication, and to share such analysis on an
anonymised basis with others as part of our commercial services.
For further information about how RNS and the London Stock Exchange
use the personal data you provide us, please see our Privacy
Policy.
END
NAVPPUGUPUPPGAP
(END) Dow Jones Newswires
February 23, 2022 02:01 ET (07:01 GMT)
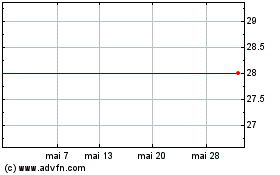
Ceiba Investments (LSE:CBA)
Graphique Historique de l'Action
De Déc 2024 à Jan 2025

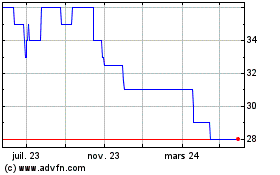
Ceiba Investments (LSE:CBA)
Graphique Historique de l'Action
De Jan 2024 à Jan 2025
