TIDMSVE
RNS Number : 9817L
Starvest PLC
18 May 2022
18 May 2022
Half-year report - six months ended 31 March 2022
Chairman's statement
Over the six months to 31 March 2022, Starvest (the "Company")
benefited somewhat from the resilience of the natural resources
sector against a backdrop of emerging inflation and global unrest
due to the conflict in eastern Europe. Nonetheless, weakness in
Greatland Gold's share price resulted in a decline in portfolio
value and net asset value of 17% and 16%, respectively, over the
six months to 31 March 2022, since the Company's financial
year-end.
Our discount to net asset value remained consistent over the
six-month period to 31 March 2022, being 34% on 30 September 2021
and 33% on 31 March 2022, while commodity prices, including gold
have in general, remain ed relatively high, providing a solid
foundation for our investee companies.
While many sectors have not yet recovered to pre-pandemic
levels, the natural resources sector has made significant gains and
is forecast to continue to do so in an economic recovery. We also
expect large-scale infrastructure and climate-focused projects, at
the forefront of government spending plans, will benefit the
natural resource sector.
As part of routine operations, the Board regularly reviews its
portfolio positions and may make adjustments to its holdings to
take advantage of market conditions. The Board is currently
considering opportunities more likely to better align the Company's
stock price with what it regards as the intrinsic value of the
Company's portfolio.
Continuing to advance its Paterson projects, Greatland Gold
(LON:GGP), which makes up over 90% of our portfolio value,
estimated its Havieron project at 6.5 Moz gold equivalent in an
updated JORC compliant report. Its joint venture partner Newcrest
Mining is continuing with mine development and growth drilling at
Havieron, while Greatland Gold concentrates on early-stage
exploration targets within its other licences.
Ariana Resources (LON:AAU) continues to focus on exploration in
south-eastern Europe with a five-year, US$2.5 million strategic
alliance recently announced with Newmont Corporation through
Ariana's 75%-owned West Tethyan Resources, along with gold and
silver production from its mining operations in Turkey.
Cora Gold (LON:CORA) has completed field work on a definitive
feasibility study for its flagship Sanankoro gold project, the full
report is due for completion in H2 2022. Cora has also started a
7,500m drill programme to continue expansion of the resource at the
Sanankoro project.
Kefi Minerals (LON:KEFI) continues with construction of the Tulu
Kapi gold mine in Ethiopia and remains on target to start full
production in 2022. Kefi has also made significant advances in its
exploration and resource calculations of the Jabil Qitman and
Hawiah project in Saudi Arabia.
Other investee companies continue their efforts as well. Oracle
Power (LON:ORCP) has continued its exploration in Western Australia
as well as expanding into the green energy sectors with a new
hydrogen energy project in Pakistan.
Sunrise Resources (LON:SRES) is advancing its pozzolan-perlite
project in Nevada, USA towards mine permitting, while Alba
(LON:ALBA) is continuing the development of its Welsh gold
deposits.
Despite the inevitable increase in global interest rates to stem
inflationary pressures, we believe that the effects of expansionary
monetary policies, continued fiscal stimulus and geopolitical
tensions favour a positive outlook for gold and precious metals in
the longer term.
Callum N Baxter
Chairman & Chief Executive
18 May 2022
Statement of Comprehensive Income
                                                6 months         6 months       Year ended
                                             to 31 March      to 31 March     30 September
                                                    2022             2021             2021
                                               Unaudited        Unaudited          Audited
                                                     GBP              GBP              GBP
 Administrative expenses                       (155,472)        (147,689)        (290,993)
 (Loss)/gain on disposal of financial
  assets                                        (29,383)           19,313           19,339
 Movement in fair value of financial
  assets through profit and loss             (2,195,966)      (1,088,092)      (3,645,360)
 Investment income                                29,628                -           56,000
                                        ----------------  ---------------  ---------------
 Operating profit                            (2,351,193)      (1,216,468)      (3,861,014)
 Interest receivable                                   -                -                -
                                        ----------------  ---------------  ---------------
 Profit on ordinary activities
  before tax                                 (2,351,193)      (1,216,468)      (3,861,014)
 Tax on (loss) ordinary activities               587,798                -          332,532
                                        ----------------  ---------------  ---------------
 (Loss) attributable to equity
  holders of the parent                      (1,763,395)      (1,216,468)      (3,528,482)
                                        ================  ===============  ===============

  Earnings per share - see note
  3
  Basic                                     (3.04 pence)     (2.11 pence)     (6.11 pence)
  Diluted                                   (3.04 pence)     (2.11 pence)     (6.11 pence)
Statement of Financial Position
                                             6 months       6 months      Year ended
                                             ended 31       ended 31    30 September
                                           March 2022     March 2021            2021
                                            Unaudited      Unaudited         Audited
                                                  GBP            GBP             GBP

 Non-current assets
 Financial assets at fair
  value through profit or
  loss                                     11,625,035     16,596,261      14,038,887
                                        -------------  -------------  --------------
 Total non-current assets                  11,625,035     16,596,261      14,038,887
                                        -------------  -------------  --------------

  Current assets
  Trade and other receivables                  53,615         29,893          63,539
  Cash and cash equivalents                   157,715        125,344          78,276
                                        -------------  -------------  --------------
 Total current assets                         211,330        155,237         141,815
                                        -------------  -------------  --------------

 Current liabilities
  Trade and other payables                   (70,636)       (84,716)        (85,627)
                                        -------------  -------------  --------------
 Total current liabilities                   (70,636)       (84,716)        (85,627)
                                        -------------  -------------  --------------

 Non-current liabilities
 Provision for deferred tax               (1,083,288)    (2,003,618)     (1,671,086)
                                        -------------  -------------  --------------
 Total non-current liabilities            (1,083,288)    (2,003,618)     (1,671,086)
                                        -------------  -------------  --------------

 Net assets                                10,682,441     14,663,164      12,423,989
                                        =============  =============  ==============

   Capital and reserves
   Called up share capital                    581,144        575,740         579,820
   Share premium account                    1,868,696      1,779,414       1,848,173
   Retained earnings                        8,232,601     12,308,010       9,995,996
                                        -------------  -------------  --------------
 Total equity shareholders'
  funds                                    10,682,441     14,663,164      12,423,989
                                        =============  =============  ==============
Statement of Cash Flows
                                               6 months      6 months      Year ended
                                               ended 31      ended 31    30 September
                                             March 2022    March 2021            2021
                                              Unaudited     Unaudited         Audited
                                                    GBP           GBP             GBP

 Cash flows from operating activities
 Operating loss                             (2,351,192)   (1,216,468)     (3,861,014)
 Shares issued in settlement
  of salaries and fees                           21,847             -          72,839
 Movement in fair value of investments        2,195,966     1,088,092       3,645,360
 (Loss)/profit on sale of current
  asset investments                              29,383      (19,313)        (19,339)
 Decrease/(increase) in debtors                   9,923         1,154        (32,493)
 (Decrease) in creditors                       (14,991)       (8,499)         (7,587)
                                           ------------  ------------  --------------
 Net cash used in operating
  activities                                  (109,064)     (155,034)       (202,234)
                                           ------------  ------------  --------------

 Cash flows from investing activities
 Sale of current asset investments              188,503       160,013         160,145
 Net cash generated from investing
  activities                                    188,503       160,013         160,145
                                           ------------  ------------  --------------

 Net increase in cash and cash
  equivalents                                    79,439         4,979        (42,089)
 Cash and cash equivalents at
  beginning of period                            78,276       120,365         120,365
                                           ------------  ------------  --------------
 Cash and cash equivalents at
  end of period                                 157,716       125,344          78,276
                                           ============  ============  ==============
Statement of Changes in Equity
                                                                                      Total Equity attributable to
                                   Share capital  Share premium  Retained earnings            shareholders
                                        GBP            GBP              GBP                       GBP
At 30 September 2020                     575,740      1,779,414         13,524,478                        15,879,632
                                   =============  =============  =================  ================================

Loss for the period                            -              -        (1,216,468)                       (1,216,468)
                                   -------------  -------------  -----------------  --------------------------------
Total recognised income and
 expenses for the period                       -              -        (1,216,468)                       (1,216,468)

Shares issued                                  -              -                  -                                 -
Total contribution by and
distributions to owners                        -              -                  -                                 -

At 31 March 2021                         575,740      1,779,414         12,308,010                        14,663,164
                                   =============  =============  =================  ================================

Loss for the period                            -              -        (3,528,482)                       (3,528,482)
                                   -------------  -------------  -----------------  --------------------------------
Total recognised income and
 expenses for the period                       -              -        (3,528,482)                       (3,528,482)

Shares issued                              4,080         68,759                  -                            72,839
Total contribution by and
 distributions to owners                   4,080         68,759                  -                            72,839

At 30 September 2021                     579,820      1,848,173          9,995,996                        12,423,989
                                   =============  =============  =================  ================================

Loss for the period                            -              -        (1,763,395)                       (1,763,395)
Total recognised income and
 expenses for the period                       -              -        (1,763,395)                       (1,763,395)

Shares issued                              1,324         20,523                  -                            21,847
Total contributions by and
 distributions to owners                   1,324         20,523                  -                            21,847

At 31 March 2022                         581,144      1,868,696          8,232,601                        10,682,441
                                   =============  =============  =================  ================================
Interim report notes
1. Interim report
The information relating to the six-month periods to 31 March
2022 and 31 March 2021 is unaudited.
The information relating to the year ended 30 September 2021 is
extracted from the audited accounts of the Company which have been
filed at Companies House and on which the auditors issued an
unqualified audit report.
2. Basis of preparation
This report has been prepared in accordance with applicable
United Kingdom accounting standards, including Financial Reporting
Standard 102 - 'The Financial Reporting Standard applicable in the
United Kingdom and Republic of Ireland' ('FRS102'), and with the
Companies Act 2006. Although the information included herein does
not constitute statutory accounts within the meaning of section 435
of the Companies Act 2006, the accounting policies that have been
applied are consistent with those adopted for the statutory
accounts for the year ended 30 September 2021.
The Company will report again for the full year to 30 September
2022.
The Company's investments at 31 March 2022 are stated at the
current market value based on market quoted prices at the close of
business on 31 March 2022. The Chairman's statement includes a
valuation based on market quoted prices at the close of business on
31 March 2022.
   3.   Earnings per share

                                             6 months         6 months       Year ended
                                             ended 31         ended 31     30 September
                                           March 2022       March 2021             2021
                                            Unaudited        Unaudited          Audited
                                                  GBP              GBP              GBP

 Loss for the year:                       (1,763,395)      (1,216,468)      (3,528,482)
                                      ---------------  ---------------  ---------------

  Weighted average number of
  Ordinary shares of GBP0.01
  in issue                                 58,080,245       57,573,986       57,755,713
                                      ---------------  ---------------  ---------------

  Earnings per share - basic             (3.04 pence)     (2.11 pence)     (6.11 pence)
  and diluted
                                      ===============  ===============  ===============
Investment portfolio
Starvest now holds trade investments in the companies listed
below; of these the following companies comprised 99% of the
portfolio value as at 31 March 2022:
                                     Exploration for oil in England,
   *    Alba Mineral Resources plc    lead-zinc in Ireland, uranium in
                                      Mauritania and graphite in Greenland
                                      www.albamineralresources.com
                                     Gold-silver production and exploration
   *    Ariana Resources plc          in Turkey, and precious metal exploration
                                      in Eastern Europe
                                      www.arianaresources.com
                                     Gold exploration in West Africa
   *    Cora Gold Limited             www.coragold.com
                                     Gold exploration and development
   *    Greatland Gold plc            in Australia
                                      www.greatlandgold.com
                                     Gold and copper exploration and
   *    Kefi Minerals plc             development in Ethiopia and Saudi
                                      Arabia
                                      www.kefi-minerals.com
                                     Coal development in Pakistan and
   *    iOracle Power plc             gold exploration in Australia
                                      www.oraclepower.co.uk
Other direct and indirect mineral exploration companies:
                                                              Oil and gas exploration in Bulgaria
   *    Block Energy plc (formerly Goldcrest Resources plc)    www.blockenergy.co.uk

                                                              Exploration for industrial minerals
   *    Sunrise Resources plc                                  in United States, Finland, Australia
                                                               and Ireland
                                                               www.sunriseresourcesplc.com
Other investee companies are listed in the Company's 2021 annual
report available on request or from the Company web site -
www.starvest.co.uk
Copies of this interim report are available free of charge by
application in writing to the Company Secretary at the Company's
registered office, Salisbury House, London Wall, London EC2M 5PS,
by email to info@starvest.co.uk or from the Company's website -
www.starvest.co.uk
Enquiries to:
Starvest PLC
Callum Baxter or Gemma Cryan 02077 696 876 or
info@starvest.co.uk
Grant Thornton UK LLP (Nomad)
Colin Aaronson, Harrison Clarke or Ciara Donnelly 02073 835
100
SI Capital Ltd (Broker)
Nick Emerson or Alan Gunn 01483 413 500
This information is provided by RNS, the news service of the
London Stock Exchange. RNS is approved by the Financial Conduct
Authority to act as a Primary Information Provider in the United
Kingdom. Terms and conditions relating to the use and distribution
of this information may apply. For further information, please
contact rns@lseg.com or visit www.rns.com.
RNS may use your IP address to confirm compliance with the terms
and conditions, to analyse how you engage with the information
contained in this communication, and to share such analysis on an
anonymised basis with others as part of our commercial services.
For further information about how RNS and the London Stock Exchange
use the personal data you provide us, please see our Privacy
Policy.
END
IR GPUCUAUPPGWR
(END) Dow Jones Newswires
May 18, 2022 09:08 ET (13:08 GMT)
Starvest (LSE:SVE)
Graphique Historique de l'Action
De Jan 2025 à Fév 2025

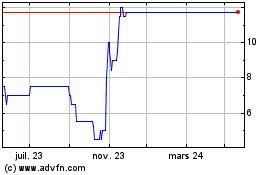
Starvest (LSE:SVE)
Graphique Historique de l'Action
De Fév 2024 à Fév 2025


