SECURITIES AND EXCHANGE
COMMISSION
Washington,
D.C. 20549
FORM 6-K
REPORT OF FOREIGN PRIVATE
ISSUER
PURSUANT TO RULE 13a-16
OR 15d-16 UNDER THE
SECURITIES EXCHANGE ACT
OF 1934
May 22, 2024
Commission File Number:
001-32827
MACRO
BANK INC.
(Translation of registrant’s
name into English)
Avenida Eduardo Madero 1182
Ciudad Autónoma de
Buenos Aires C1106 ACY
Tel: 54 11 5222 6500
(Address of registrant’s
principal executive offices)
Indicate by check mark whether
the registrant files or will file annual reports under cover of Form 20-F or Form 40-F.
Indicate by check mark if the registrant is submitting the Form 6-K
in paper as permitted by Regulation S-T Rule 101(b)(1):
Indicate by check mark if the registrant is submitting the Form 6-K
in paper as permitted by Regulation S-T Rule 101(b)(7):

| BANCO MACRO | |
1Q24 EARNINGS RELEASE |
Index
| 01 |
Summary |
|
| |
|
|
| 02 |
Disclaimer |
|
| |
|
|
| 03 |
Results |
|
| |
|
|
| 04 |
Financial Assets |
|
| |
|
|
| 05 |
Public Sector Assets |
|
| |
|
|
| 06 |
Funding |
|
| |
|
|
| 07 |
Liquid Assets |
|
| |
|
|
| 08 |
Solvency |
|
| |
|
|
| 09 |
Asset Quality |
|
| |
|
|
| 10 |
1Q24 Snapshot |
|
| |
|
|
| 11 |
Relevant and Recent Events |
|
| |
|
|
| 12 |
Regulatory Changes |
|
| |
|
|
| 13 |
CER Exposure and Foreign Currency Position |
|

| BANCO MACRO | |
1Q24 EARNINGS RELEASE |
| BANCO MACRO | |
1Q24 EARNINGS RELEASE |
| BANCO MACRO |
1Q24 EARNINGS RELEASE |
·
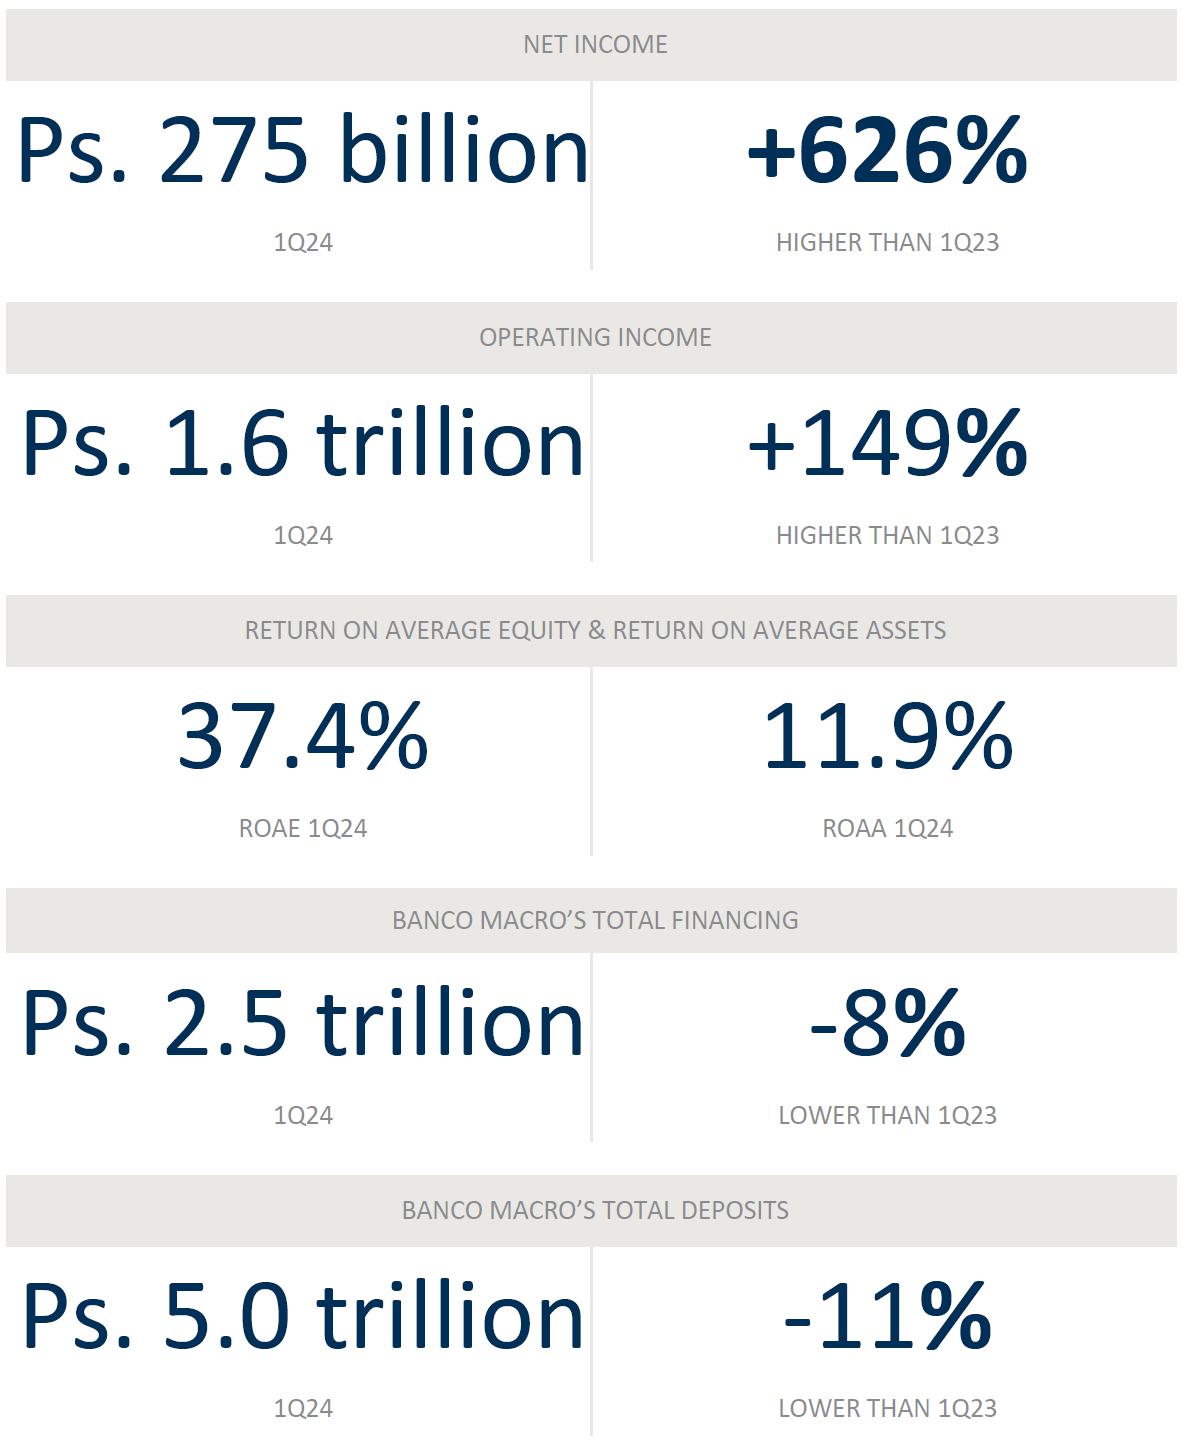
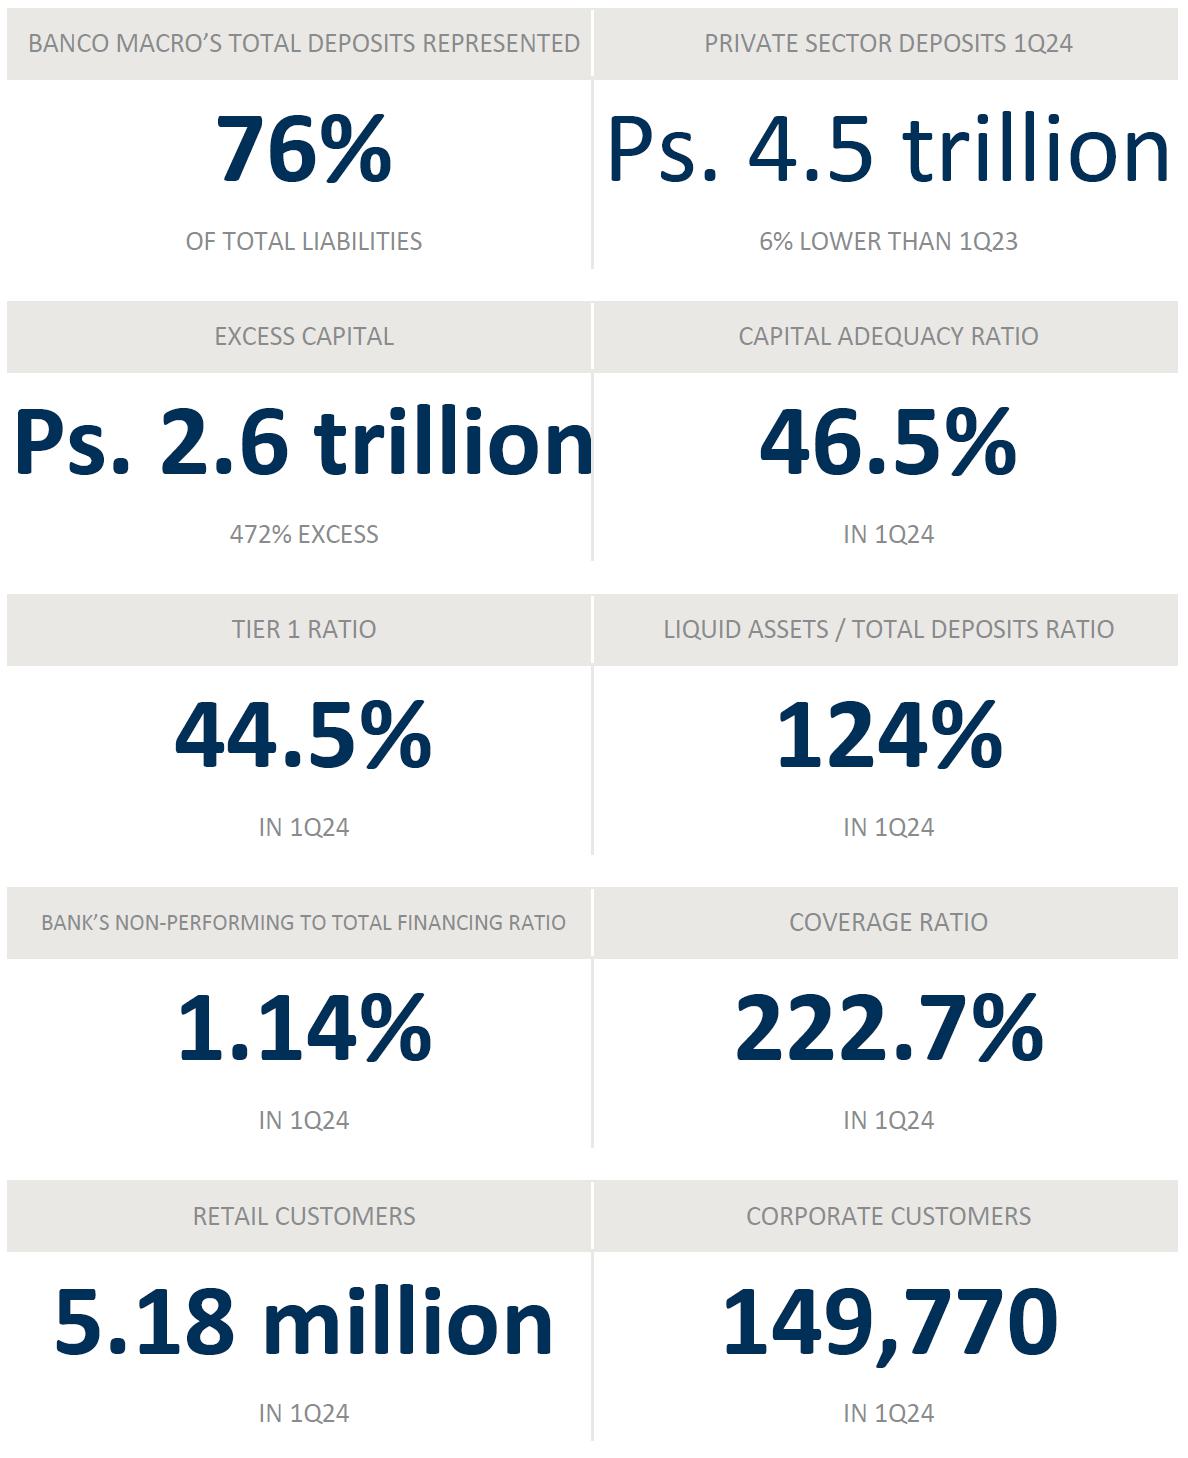
THE BANK’S NET INCOME totaled Ps.275.2 billion in 1Q24. This result was 61%
lower than the Ps.679.3 billion posted in 4Q23 and 626% higher than the Ps.37.9
billion posted in 1Q23. In 1Q24 the annualized return on average equity (“ROAE”)
and the annualized return on average assets (“ROAA”) were 37.4% and 11.9%, respectively.
· In 1Q24, OPERATING INCOME
(before G&A and personnel expenses) totaled Ps.1.62 trillion, 19% or Ps.388 billion lower than in 4Q23 and 149% or Ps.969.3 billion
higher than the same period of last year.
· In 1Q24, OPERATING INCOME
(after G&A and personnel expenses) totaled Ps.1.25 trillion, 20% or Ps.322.7 billion lower than in 4Q23 and 211% or Ps.850.8
billion higher than the same period of last year.
· In 1Q24, BANCO MACRO’S
TOTAL FINANCING decreased 10% or Ps.279.6 billion quarter over quarter (“QoQ”) totaling Ps.2.5 trillion and decreased
8% or Ps.205.9 billion year over year (“YoY”). In 1Q24 peso financing decreased 20% while USD financing increased 75%.
· In 1Q24, BANCO MACRO’S
TOTAL DEPOSITS decreased 1% or Ps.74.3 billion QoQ and 11% or Ps.644 billion YoY, totaling Ps.5 trillion and representing 76% of
the Bank’s total liabilities. Private sector deposits decreased 6% or Ps.291.2 billion QoQ. In 1Q24, Peso deposits increased, 10%
while USD deposits decreased 32%.
·
Banco Macro continued showing a strong solvency ratio, with an EXCESS CAPITAL of Ps.2.6
trillion, 46.5% Capital Adequacy Ratio – Basel III and 44.5 % Tier 1 Ratio. In addition,
the Bank’s LIQUID ASSETS remained at an adequate level, reaching 124% of its
total deposits in 1Q24.
· In 1Q24, the Bank’s
NON-PERFORMING TO TOTAL FINANCING RATIO was 1.14% and the COVERAGE RATIO reached 222.7%.
· As of 1Q24, through its
517 branches and 9.166 employees Banco Macro serves 5.18 million retail customers (2.19 million digital customers)
across 23 of the 24 Provinces in Argentina and over 149,770 corporate customers.

As of December 2023,
Banco Macro consolidated includes Banco Macro + subsidiaries + Banco BMA (formerly Banco Itaú Argentina)
| BANCO MACRO |
1Q24 EARNINGS RELEASE |
This press release
includes forward-looking statements. We have based these forward-looking statements largely on our current beliefs, expectations and
projections about future events and financial trends affecting our business. Many important factors could cause our actual results to
differ substantially from those anticipated in our forward-looking statements, including, among other things: inflation; changes in interest
rates and the cost of deposits; government regulation; adverse legal or regulatory disputes or proceedings; credit and other risks of
lending, such as increases in defaults by borrowers; fluctuations and declines in the value of Argentine public debt; competition in
banking and financial services; deterioration in regional and national business and economic conditions in Argentina; and fluctuations
in the exchange rate of the peso.
The words “believe,”
“may,” “will,” “aim,” “estimate,” “continue,” “anticipate,” “intend,”
“expect” and similar words are intended to identify forward-looking statements. Forward-looking statements include information
concerning our possible or assumed future results of operations, business strategies, financing plans, competitive position, industry
environment, potential growth opportunities, the effects of future regulation and the effects of competition. Forward-looking statements
speak only as of the date they were made, and we undertake no obligation to update publicly or to revise any forward-looking statements
after we distribute this press release because of new information, future events or other factors. In light of the risks and uncertainties
described above, the forward-looking events and circumstances discussed in this press release might not occur and are not guarantees
of future performance.
This report is
a summary analysis of Banco Macro's financial condition and results of operations as of and for the period indicated. For a correct
interpretation, this report must be read in conjunction with all other material periodically filed with the Comisión Nacional
de Valores (www.cnv.gob.ar), the Securities and Exchange Commission (www.sec.gov), Bolsas y mercados Argentinos (www.byma.com.ar) and
the New York Stock Exchange (www.nyse.com). In addition, the Central Bank (www.bcra.gov.ar) may publish information related to Banco
Macro as of a date subsequent to the last date for which the Bank has published information.
Readers of this
report must note that this is a translation made from an original version written and expressed in Spanish. Consequently, any matters
of interpretation should be referred to the original version in Spanish.
This Earnings Release
has been prepared in accordance with the accounting framework established by the Central Bank of Argentina (“BCRA”), based
on International Financial Reporting Standards (“I.F.R.S.”) and the resolutions adopted by the International Accouting Standards
Board (“I.A.S.B”) and by the Federación Argentina de Consejos Profesionales de Ciencias Económicas (“F.A.C.P.E.”).
As of January 2020 the Bank started reporting with the application of (i) Expected losses of IFRS 9 “Financial Instruments”
and (ii) IAS 29 “Financial Reporting in Hyperinflationary Economies”. Data and figures shown in this Earnings
Release may differ from the ones shown in the 20-F annual report. As of fiscal year 2021, the monetary result accrued by items of a monetary
nature measured at fair value with changes in Other Comprehensive Income (OCI), is recorded in the Result form the Net Monetary Position
integrating the Net Result of the period in accordance with Communication “A” 7211 of the Central Bank of Argentina. Previous
quarters of 20223 have been restated in accordance with said Communication in order to make a comparison possible
| BANCO MACRO |
1Q24 EARNINGS RELEASE |
1Q24 Earnings Release Conference Call
Friday, May 24, 2024
Time:
12:00 a.m. Eastern Time
01:00 p.m. Buenos Aires Time
To participate, please dial:
Argentina Toll Free:
(011) 3984 5677
Participants Dial In (Toll Free):
+1 (844) 450 3847
Participants International Dial In:
+1 (412) 317 6370
Conference ID: Banco Macro
Webcast: click here
Webcast Replay: click here
Available from 05/24/2024 through 06/7/2024
IR Contacts in Buenos Aires:
Jorge Scarinci
Chief Financial Officer
Nicolás A. Torres
Investor Relations
Phone: (54 11) 5222 6682
E-mail: investorelations@macro.com.ar
Visit our website at:
www.macro.com.ar/relaciones-inversores
| BANCO MACRO |
1Q24 EARNINGS RELEASE |
As of
December 2023, Banco Macro consolidated includes Banco Macro + subsidiaries + Banco BMA (formerly Banco Itaú Argentina)
Earnings per
outstanding share were Ps.430.74 in 1Q24, 61% lower than in 4Q23 but 627% higher than the result posted a year ago.
| EARNINGS PER SHARE | |
MACRO Consolidated | | |
Change | |
| In MILLION $ (Measuring Unit Current at EOP) | |
1Q23 | | |
2Q23 | | |
3Q23 | | |
4Q23 | | |
1Q24 | | |
QoQ | | |
YoY | |
| Net income -Parent Company- (M $) | |
| 37,921 | | |
| 138,379 | | |
| 17,458 | | |
| 697,255 | | |
| 275,235 | | |
| -61 | % | |
| 626 | % |
| Average # of shares outstanding (M) | |
| 639 | | |
| 639 | | |
| 639 | | |
| 639 | | |
| 639 | | |
| 0 | % | |
| 0 | % |
| Book value per avg. Outstanding share ($) | |
| 3,841 | | |
| 3,643 | | |
| 3,665 | | |
| 4,851 | | |
| 5,259 | | |
| 8 | % | |
| 37 | % |
| Shares Outstanding (M) | |
| 639 | | |
| 639 | | |
| 639 | | |
| 639 | | |
| 639 | | |
| 0 | % | |
| 0 | % |
| Earnings per avg. outstanding share ($) | |
| 59.22 | | |
| 216.56 | | |
| 27.32 | | |
| 1,091.17 | | |
| 430.74 | | |
| -61 | % | |
| 627 | % |
| EOP FX (Pesos per USD) | |
| 208.9883 | | |
| 256.6750 | | |
| 350.0083 | | |
| 808.4833 | | |
| 857.4167 | | |
| 6 | % | |
| 310 | % |
| Book value per avg. issued ADS (USD) | |
| 183.79 | | |
| 141.93 | | |
| 104.71 | | |
| 60.00 | | |
| 61.34 | | |
| 2 | % | |
| -67 | % |
| Earnings per avg. outstanding ADS (USD) | |
| 2.83 | | |
| 8.44 | | |
| 0.78 | | |
| 13.50 | | |
| 5.02 | | |
| -63 | % | |
| 77 | % |
Banco Macro’s
1Q24 net income of Ps.275.2 billion was 61% or Ps.422 billion lower than the previous quarter and 626% or Ps.237.3 billion higher
YoY mainly due to the mark to market of Government Securities (financial assets at fair value through profit or loss). This result represented
an annualized ROAE and ROAA of 37.4% and 11.9% respectively. Total comprehensive income for the quarter totaled Ps.260.5 billion, 66%
lower than the result posted in the previous quarter.
Net operating
income (before G&A and personnel expenses) was Ps.1.62 trillion in 1Q24, 19% or Ps.388 billion lower compared to 4Q23. On a yearly
basis, Net Operating Income (before G&A and personnel expenses) increased 149% or Ps.969.3 billion.
In 1Q24, Provision
for loan losses totaled Ps.18.9 billion, 32% or Ps.8.7 billion lower than in 4Q23. On a yearly basis provision for loan losses increased
40% or Ps.5.4 billion.
Operating income
(after G&A and personnel expenses) was Ps.1.25 trillion in 1Q24, 20% or Ps.322.7 billion lower than in 4Q23 and 211% or Ps.850.8
billion higher than a year ago.
| It is important
to emphasize that this result was obtained with a leverage of only 3x assets to equity ratio. |  |
| BANCO MACRO |
1Q24 EARNINGS RELEASE |
| INCOME STATEMENT | |
MACRO Consolidated | | |
Change | |
| In MILLION $ (Measuring Unit Current at EOP) | |
1Q23 | | |
2Q23 | | |
3Q23 | | |
4Q23 | | |
1Q24 | | |
QoQ | | |
YoY | |
| Net Interest Income | |
| 378,801 | | |
| 338,239 | | |
| 261,918 | | |
| 278,516 | | |
| 167,515 | | |
| -40 | % | |
| -56 | % |
| Net fee income | |
| 85,455 | | |
| 82,535 | | |
| 82,488 | | |
| 84,256 | | |
| 74,061 | | |
| -12 | % | |
| -13 | % |
| Net Interest Income + Net Fee Income | |
| 464,256 | | |
| 420,774 | | |
| 344,406 | | |
| 362,772 | | |
| 241,576 | | |
| -33 | % | |
| -48 | % |
| Net Income from financial instruments at fair value through P&L | |
| 35,664 | | |
| 162,583 | | |
| -84,503 | | |
| 1,357,364 | | |
| 1,272,438 | | |
| -6 | % | |
| 3468 | % |
| Income from assets at amortized cost | |
| - | | |
| - | | |
| 319 | | |
| 200 | | |
| 21 | | |
| 0 | % | |
| 0 | % |
| Differences in quoted prices of gold and foreign currency | |
| 142,244 | | |
| 237,601 | | |
| 553,341 | | |
| 277,087 | | |
| 80,592 | | |
| -71 | % | |
| -43 | % |
| Other operating income | |
| 22,170 | | |
| 23,975 | | |
| 26,223 | | |
| 38,150 | | |
| 44,350 | | |
| 16 | % | |
| 100 | % |
| Provision for loan losses | |
| 13,492 | | |
| 17,296 | | |
| 11,305 | | |
| 27,569 | | |
| 18,857 | | |
| -32 | % | |
| 40 | % |
| Net Operating Income | |
| 650,842 | | |
| 827,637 | | |
| 828,481 | | |
| 2,008,004 | | |
| 1,620,120 | | |
| -19 | % | |
| 149 | % |
| Employee benefits | |
| 91,026 | | |
| 96,158 | | |
| 100,219 | | |
| 134,878 | | |
| 133,392 | | |
| -1 | % | |
| 47 | % |
| Administrative expenses | |
| 45,189 | | |
| 53,873 | | |
| 53,635 | | |
| 96,306 | | |
| 68,910 | | |
| -28 | % | |
| 52 | % |
| Depreciation and impairment of assets | |
| 18,981 | | |
| 19,364 | | |
| 19,185 | | |
| 30,560 | | |
| 24,284 | | |
| -21 | % | |
| 28 | % |
| Other operating expenses | |
| 92,454 | | |
| 115,885 | | |
| 109,226 | | |
| 169,603 | | |
| 139,584 | | |
| -18 | % | |
| 51 | % |
| Operating Income | |
| 403,192 | | |
| 542,357 | | |
| 546,216 | | |
| 1,576,657 | | |
| 1,253,950 | | |
| -20 | % | |
| 211 | % |
| Result from associates & joint ventures | |
| -851 | | |
| -597 | | |
| -165 | | |
| 237,238 | | |
| -214 | | |
| - | | |
| - | |
| Result from net monetary postion | |
| -342,825 | | |
| -342,898 | | |
| -501,839 | | |
| -797,250 | | |
| -888,994 | | |
| 12 | % | |
| 159 | % |
| Result before taxes from continuing operations | |
| 59,516 | | |
| 198,862 | | |
| 44,212 | | |
| 1,016,645 | | |
| 364,742 | | |
| -64 | % | |
| 513 | % |
| Income tax | |
| 21,595 | | |
| 60,483 | | |
| 26,754 | | |
| 319,390 | | |
| 89,507 | | |
| -72 | % | |
| 314 | % |
| Net income from continuing operations | |
| 37,921 | | |
| 138,379 | | |
| 17,458 | | |
| 697,255 | | |
| 275,235 | | |
| -61 | % | |
| 626 | % |
| | |
| | | |
| - | | |
| - | | |
| | | |
| | | |
| | | |
| | |
| Net Income of the period | |
| 37,921 | | |
| 138,379 | | |
| 17,458 | | |
| 697,255 | | |
| 275,235 | | |
| -61 | % | |
| 626 | % |
| Net income of the period attributable to parent company | |
| 37,869 | | |
| 138,284 | | |
| 17,396 | | |
| 696,933 | | |
| 275,419 | | |
| -60 | % | |
| 627 | % |
| Net income of the period attributable to minority interest | |
| 52 | | |
| 95 | | |
| 62 | | |
| 322 | | |
| -184 | | |
| -157 | % | |
| - | |
| Other Comprehensive Income | |
| -3,224 | | |
| 6,744 | | |
| -3,294 | | |
| 60,678 | | |
| -14,706 | | |
| - | | |
| - | |
| Foreign currency translation differences in financial statements conversion | |
| -822 | | |
| -192 | | |
| 298 | | |
| 15,513 | | |
| -14,063 | | |
| - | | |
| - | |
| Profits or losses from financial assets measured at fair value through other comprehensive income (FVOCI) (IFRS 9(4.1.2)(a) | |
| -2,402 | | |
| 6,936 | | |
| -3,592 | | |
| 45,165 | | |
| -643 | | |
| - | | |
| - | |
| TOTAL COMPREHENSIVE INCOME FOR THE PERIOD | |
| 34,697 | | |
| 145,123 | | |
| 14,164 | | |
| 757,933 | | |
| 260,529 | | |
| -66 | % | |
| 651 | % |
| Total Comprehensive Income attributable to parent Company | |
| 34,645 | | |
| 145,028 | | |
| 14,102 | | |
| 757,611 | | |
| 260,713 | | |
| -66 | % | |
| 653 | % |
| Total Comprehensive Income attributable to non-controlling interests | |
| 52 | | |
| 95 | | |
| 62 | | |
| 322 | | |
| -184 | | |
| -157 | % | |
| - | |
The Bank’s
1Q24 net interest income totaled Ps.167.5 billion, 40% or Ps.111 billion lower than in 4Q23 and 56% or Ps.211.3 billion lower YoY.
Interest income decreased 18% while interest expenses decreased 7%.
| BANCO MACRO |
1Q24 EARNINGS RELEASE |
In 1Q24 interest
income totaled Ps714.8 billion, 18% or Ps.154.5 billion lower than in 4Q23 and 19% or Ps.172 billion lower than in 1Q23.
Income from
interest on loans and other financing totaled Ps.462 billion, 18% or Ps102.8 billion lower compared with the previous quarter mainly
due to a 16% decrease in the average volume of private sector loans and a 118 basis points decease in the average lending rate. On a
yearly basis Income from interest on loans increased 39% or Ps.129.8 billion.
In 1Q24, income
from government and private securities decreased 42% or Ps.68.3 billion QoQ (due to the unwinding of our Leliq portfolio) and decreased
82% or Ps.429.33 billion compared with the same period of last year. This result is explained 68% by income from government and private
securities through other comprehensive income (Other government securities) and the remaining 32% is explained by income from government
and private securities in pesos at amortized cost.
In 1Q24, income
from Repos totaled Ps.151.9 billion, 19% or Ps.24.3 billion higher than the previous quarter and 482% or Ps.125.8 billion higher
than a year ago.
In 1Q43 FX income
totaled Ps.80.6 billion,71% or Ps.196.5 billion lower than the previous quarter and 43% or Ps.61.6 billion lower than a year ago.
FX income gain was due to the 6.1% argentine peso depreciation against the US dollar and the Bank’s long dollar position during
the quarter. It is important to notice that the Bank’s long dollar position decreased 96% during the quarter.
| FX INCOME | |
MACRO Consolidated | | |
Variation | |
| In MILLION $ (Measuring Unit Current at EOP) | |
1Q23 | | |
4Q23 | | |
1Q24 | | |
QoQ | | |
YoY | |
| (1) Differences in quoted prices of gold and foreign currency | |
| 142,244 | | |
| 277,087 | | |
| 80,592 | | |
| -71 | % | |
| -43 | % |
| Translation of FX assets and liabilities to Pesos | |
| 141,393 | | |
| 275,980 | | |
| 80,391 | | |
| -71 | % | |
| -43 | % |
| Income from foreign currency exchange | |
| 851 | | |
| 1,107 | | |
| 201 | | |
| -82 | % | |
| -76 | % |
| (2) Net Income from financial assets and liabilities at fair value through P&L | |
| 754 | | |
| 23,363 | | |
| 5,165 | | |
| -78 | % | |
| 585 | % |
| Income from investment in derivative financing instruments | |
| 754 | | |
| 23,363 | | |
| 5,165 | | |
| -78 | % | |
| 585 | % |
| (1) +(2) Total Result from Differences in quoted prices of gold and foreign currency | |
| 142,998 | | |
| 300,450 | | |
| 85,757 | | |
| -71 | % | |
| -40 | % |
| BANCO MACRO |
1Q24 EARNINGS RELEASE |
| INTEREST INCOME | |
MACRO Consolidated | | |
Change | |
| In MILLION $ (Measuring Unit Current at EOP) | |
1Q23 | | |
2Q23 | | |
3Q23 | | |
4Q23 | | |
1Q24 | | |
QoQ | | |
YoY | |
| Interest on Cash and due from Banks | |
| 2,135 | | |
| 2,357 | | |
| 2,953 | | |
| 2,938 | | |
| 3,135 | | |
| 7 | % | |
| 47 | % |
| Interest from government securities | |
| 524,026 | | |
| 518,059 | | |
| 480,857 | | |
| 162,143 | | |
| 94,022 | | |
| -42 | % | |
| -82 | % |
| Interest from private securities | |
| 381 | | |
| 281 | | |
| 193 | | |
| 1,244 | | |
| 1,050 | | |
| -16 | % | |
| 176 | % |
| Interest on loans and other financing | |
| | | |
| | | |
| | | |
| | | |
| | | |
| | | |
| | |
| To the financial sector | |
| 413 | | |
| 775 | | |
| 1,321 | | |
| 2,468 | | |
| 1,027 | | |
| -58 | % | |
| 149 | % |
| To the public non financial sector | |
| 1,501 | | |
| 10,122 | | |
| 9,320 | | |
| 8,064 | | |
| 1,666 | | |
| -79 | % | |
| 11 | % |
| Interest on overdrafts | |
| 36,222 | | |
| 50,041 | | |
| 63,546 | | |
| 115,119 | | |
| 71,365 | | |
| -38 | % | |
| 97 | % |
| Interest on documents | |
| 35,223 | | |
| 43,583 | | |
| 65,561 | | |
| 93,445 | | |
| 56,909 | | |
| -39 | % | |
| 62 | % |
| Interest on mortgages loans | |
| 42,682 | | |
| 53,543 | | |
| 50,679 | | |
| 74,171 | | |
| 108,751 | | |
| 47 | % | |
| 155 | % |
| Interest on pledged loans | |
| 3,110 | | |
| 3,514 | | |
| 3,964 | | |
| 4,434 | | |
| 3,143 | | |
| -29 | % | |
| 1 | % |
| Interest on personal loans | |
| 100,643 | | |
| 95,216 | | |
| 88,773 | | |
| 85,783 | | |
| 69,749 | | |
| -19 | % | |
| -31 | % |
| Interest on credit cards loans | |
| 70,542 | | |
| 73,310 | | |
| 74,478 | | |
| 83,491 | | |
| 64,917 | | |
| -22 | % | |
| -8 | % |
| Interest on financial leases | |
| 447 | | |
| 378 | | |
| 845 | | |
| 3,553 | | |
| 3,510 | | |
| -1 | % | |
| 685 | % |
| Interest on other loans | |
| 43,315 | | |
| 53,681 | | |
| 67,541 | | |
| 104,764 | | |
| 83,613 | | |
| -20 | % | |
| 93 | % |
| Interest on Repos | |
| 0 | | |
| | | |
| | | |
| | | |
| | | |
| | | |
| | |
| From the BCRA | |
| 26,036 | | |
| 57,510 | | |
| 87,304 | | |
| 126,637 | | |
| 151,842 | | |
| 20 | % | |
| 483 | % |
| Other financial institutions | |
| 62 | | |
| 0 | | |
| 39 | | |
| 982 | | |
| 65 | | |
| - | | |
| 5 | % |
| Total Interest income | |
| 886,738 | | |
| 962,370 | | |
| 997,374 | | |
| 869,236 | | |
| 714,764 | | |
| -18 | % | |
| -19 | % |
| Income from Interest on loans | |
| 332,184 | | |
| 373,266 | | |
| 415,387 | | |
| 564,760 | | |
| 461,957 | | |
| -18 | % | |
| 39 | % |
The Bank’s
1Q24 interest expense totaled Ps.547.3 billion, decreasing 7% or Ps.43.5 billion compared to the previous quarter and 8% (Ps.39.3
billion) higher compared to 1Q23.
In 1Q24, interest
on deposits represented 96% of the Bank’s total interest expense, decreasing 8% or Ps.46.5 billion QoQ, due to a 970 basis
points decrease in the average rate paid on deposits while the average volume of deposits from the private sector increased 5%. On a
yearly basis, interest on deposits increased 6% or Ps.31.5billion.
| INTEREST EXPENSE | |
MACRO Consolidated | | |
Change | |
| In MILLION $ (Measuring Unit Current at EOP) | |
1Q23 | | |
2Q23 | | |
3Q23 | | |
4Q23 | | |
1Q24 | | |
QoQ | | |
YoY | |
| Deposits | |
| | | |
| | | |
| | | |
| | | |
| | | |
| | | |
| | |
| Interest on checking accounts | |
| 22,924 | | |
| 42,034 | | |
| 49,320 | | |
| 54,310 | | |
| 64,109 | | |
| 18 | % | |
| 180 | % |
| Interest on saving accounts | |
| 4,969 | | |
| 6,709 | | |
| 6,366 | | |
| 9,429 | | |
| 13,088 | | |
| 39 | % | |
| 163 | % |
| Interest on time deposits | |
| 467,690 | | |
| 559,647 | | |
| 665,900 | | |
| 509,882 | | |
| 449,935 | | |
| -12 | % | |
| -4 | % |
| Interest on other financing from BCRA and financial
inst. | |
| 824 | | |
| 691 | | |
| 550 | | |
| 1,043 | | |
| 2,137 | | |
| 105 | % | |
| 159 | % |
| Repos | |
| | | |
| | | |
| | | |
| | | |
| | | |
| | | |
| | |
| Other financial institutions | |
| 4,811 | | |
| 7,101 | | |
| 5,012 | | |
| 4,111 | | |
| 4,109 | | |
| 0 | % | |
| -15 | % |
| Interest on corporate bonds | |
| 62 | | |
| 61 | | |
| 66 | | |
| 2,477 | | |
| 4,746 | | |
| 92 | % | |
| 7555 | % |
| Interest on subordinated bonds | |
| 5,211 | | |
| 5,078 | | |
| 5,487 | | |
| 5,726 | | |
| 6,035 | | |
| 5 | % | |
| 16 | % |
| Interest on other financial liabilities | |
| 1,446 | | |
| 2,810 | | |
| 2,755 | | |
| 3,742 | | |
| 3,090 | | |
| -17 | % | |
| 114 | % |
| Total financial expense | |
| 507,937 | | |
| 624,131 | | |
| 735,456 | | |
| 590,720 | | |
| 547,249 | | |
| -7 | % | |
| 8 | % |
| Expenses from interest on deposits | |
| 495,583 | | |
| 608,390 | | |
| 721,586 | | |
| 573,621 | | |
| 527,132 | | |
| -8 | % | |
| 6 | % |
| BANCO MACRO |
1Q24 EARNINGS RELEASE |
In 1Q24, the Bank’s net interest margin
(including FX) was 26%, lower than the 33.8% posted in 4Q23 and the 33.6% posted in 1Q23.
| 1Q24
NET INTEREST MARGIN* |
17.6%
|
LOWER
THAN THE 26.1% POSTED IN 4Q23 AND LOWER THAN THE 24.4% IN 1Q23 |
| 1Q24 NET
INTEREST MARGIN PESOS |
20.6% |
LOWER
THAN THE 28.1% POSTED IN 4Q23 AND LOWER THAN THE 26.8% IN 1Q23 |
| 1Q234NET
INTEREST MARGIN USD |
7.5% |
LOWER
THAN THE 15.3% POSTED IN 4Q23 AND HIGHER THAN THE 6.7% IN 1Q23 |
* EXCLUDING FX GAINS
ASSETS
& LIABILITIES
PERFORMANCE (AR$) | |
MACRO
Consolidated | |
| In MILLION $ | |
1Q23 | | |
4Q23 | | |
1Q24 | |
| (Measuring Unit Current at EOP) | |
AVERAGE | | |
REAL INT | | |
NOMINAL | | |
AVERAGE | | |
REAL INT | | |
NOMINAL | | |
AVERAGE | | |
REAL INT | | |
NOMINAL | |
| Yields & rates in annualized nominal % | |
BALANCE | | |
RATE | | |
INT
RATE | | |
BALANCE | | |
RATE | | |
INT
RATE | | |
BALANCE | | |
RATE | | |
INT
RATE | |
| Interest-earning assets | |
| | | |
| | | |
| | | |
| | | |
| | | |
| | | |
| | | |
| | | |
| | |
| Loans & Other Financing | |
| | | |
| | | |
| | | |
| | | |
| | | |
| | | |
| | | |
| | | |
| | |
| Public
Sector | |
| 10,310 | | |
| -15.5 | % | |
| 59.0 | % | |
| 29,472 | | |
| -33.0 | % | |
| 108.6 | % | |
| 7,272 | | |
| -37.6 | % | |
| 92.1 | % |
| Financial
Sector | |
| 4,138 | | |
| -25.9 | % | |
| 39.4 | % | |
| 17,790 | | |
| -50.3 | % | |
| 54.7 | % | |
| 13,315 | | |
| -57.7 | % | |
| 30.2 | % |
| Private
Sector | |
| 2,450,418 | | |
| -18.8 | % | |
| 52.7 | % | |
| 2,542,513 | | |
| -40.9 | % | |
| 84.1 | % | |
| 1,916,282 | | |
| -37.3 | % | |
| 92.9 | % |
| Other debt securities | |
| | | |
| | | |
| | | |
| | | |
| | | |
| | | |
| | | |
| | | |
| | |
| Central
Bank Securities (Leliqs) | |
| 2,266,694 | | |
| -6.3 | % | |
| 76.2 | % | |
| 330,214 | | |
| -26.0 | % | |
| 130.6 | % | |
| 0 | | |
| 0.0 | % | |
| 0.0 | % |
| Government
& Private Securities | |
| 680,464 | | |
| -16.1 | % | |
| 57.8 | % | |
| 286,568 | | |
| -44.5 | % | |
| 72.7 | % | |
| 423,066 | | |
| -39.9 | % | |
| 84.9 | % |
| Repos | |
| 148,576 | | |
| -9.0 | % | |
| 71.2 | % | |
| 385,326 | | |
| -25.7 | % | |
| 131.4 | % | |
| 599,248 | | |
| -34.3 | % | |
| 102.0 | % |
| Total interest-earning assets | |
| 5,560,600 | | |
| -13.1 | % | |
| 63.4 | % | |
| 3,591,883 | | |
| -38.2 | % | |
| 92.6 | % | |
| 2,959,183 | | |
| -36.9 | % | |
| 94.0 | % |
| | |
| | | |
| | | |
| | | |
| | | |
| | | |
| | | |
| | | |
| | | |
| | |
| Fin. Assets through P&L and
equity inv. | |
| 87,634 | | |
| -35.4 | % | |
| 21.5 | % | |
| 23,852 | | |
| 200.6 | % | |
| 836.0 | % | |
| 1,962,707 | | |
| 5.3 | % | |
| 224.0 | % |
| Other Non interest-earning
assets | |
| 561,646 | | |
| | | |
| | | |
| 741,409 | | |
| | | |
| | | |
| 558,592 | | |
| | | |
| | |
| Total Non interest-earning
assets | |
| 649,280 | | |
| | | |
| | | |
| 765,261 | | |
| | | |
| | | |
| 2,521,299 | | |
| | | |
| | |
| Total Average Assets | |
| 6,209,880 | | |
| | | |
| | | |
| 4,357,144 | | |
| | | |
| | | |
| 5,480,482 | | |
| | | |
| | |
| | |
| | | |
| | | |
| | | |
| | | |
| | | |
| | | |
| | | |
| | | |
| | |
| Interest-bearing liabilities | |
| | | |
| | | |
| | | |
| | | |
| | | |
| | | |
| | | |
| | | |
| | |
| Deposits | |
| | | |
| | | |
| | | |
| | | |
| | | |
| | | |
| | | |
| | | |
| | |
| Public
Sector | |
| 262,065 | | |
| -14.7 | % | |
| 60.4 | % | |
| 166,285 | | |
| -35.3 | % | |
| 101.4 | % | |
| 241,012 | | |
| -38.4 | % | |
| 89.6 | % |
| Private
Sector | |
| 3,578,302 | | |
| -19.4 | % | |
| 51.7 | % | |
| 2,505,946 | | |
| -40.9 | % | |
| 84.1 | % | |
| 2,444,959 | | |
| -42.2 | % | |
| 77.9 | % |
| BCRA and other financial institutions | |
| 2,033 | | |
| 40.4 | % | |
| 164.2 | % | |
| 3,086 | | |
| -29.4 | % | |
| 119.8 | % | |
| 4,860 | | |
| -9.3 | % | |
| 179.0 | % |
| Corporate bonds | |
| 0 | | |
| 0.0 | % | |
| 0.0 | % | |
| 5,640 | | |
| -24.5 | % | |
| 135.2 | % | |
| 8,069 | | |
| -3.2 | % | |
| 197.8 | % |
| Repos | |
| 30,473 | | |
| -12.8 | % | |
| 64.0 | % | |
| -15,023 | | |
| -102.8 | % | |
| -108.6 | % | |
| 19,621 | | |
| -40.1 | % | |
| 84.2 | % |
| Other financial liabilities | |
| 471439 | | |
| -0.463 | | |
| 0.011 | | |
| 595806 | | |
| -0.672 | | |
| 0.023 | | |
| 524592 | | |
| -0.668 | | |
| 0.021 | |
| Total int.-bearing liabilities | |
| 4,344,312 | | |
| -21.9 | % | |
| 46.9 | % | |
| 3,261,740 | | |
| -45.1 | % | |
| 71.0 | % | |
| 3,243,113 | | |
| -45.7 | % | |
| 67.0 | % |
| | |
| | | |
| | | |
| | | |
| | | |
| | | |
| | | |
| | | |
| | | |
| | |
| Total non int.-bearing liabilities | |
| 1,156,987 | | |
| | | |
| | | |
| 1,250,165 | | |
| | | |
| | | |
| 1,209,769 | | |
| | | |
| | |
| | |
| | | |
| | | |
| | | |
| | | |
| | | |
| | | |
| | | |
| | | |
| | |
| Total Average Liabilities | |
| 5,501,299 | | |
| | | |
| | | |
| 4,511,905 | | |
| | | |
| | | |
| 4,452,882 | | |
| | | |
| | |
| | |
| | | |
| | | |
| | | |
| | | |
| | | |
| | | |
| | | |
| | | |
| | |
| Assets Performance | |
| | | |
| 869,305 | | |
| | | |
| | | |
| 838,012 | | |
| | | |
| | | |
| 691,365 | | |
| | |
| Liabilities Performance | |
| | | |
| 502,447 | | |
| | | |
| | | |
| 583,944 | | |
| | | |
| | | |
| 540,033 | | |
| | |
| Net Interest Income | |
| | | |
| 366,858 | | |
| | | |
| | | |
| 254,068 | | |
| | | |
| | | |
| 151,332 | | |
| | |
| Total interest-earning assets | |
| | | |
| 5,560,600 | | |
| | | |
| | | |
| 3,591,883 | | |
| | | |
| | | |
| 2,959,183 | | |
| | |
| Net Interest Margin (NIM) | |
| | | |
| 26.8 | % | |
| | | |
| | | |
| 28.1 | % | |
| | | |
| | | |
| 20.6 | % | |
| | |
| BANCO MACRO |
1Q24 EARNINGS RELEASE |
ASSETS &
LIABILITIES
PERFORMANCE USD | |
MACRO
Consolidated | |
| In MILLION $ | |
1Q23 | | |
4Q23 | | |
1Q24 | |
| (Measuring Unit Current at EOP) | |
AVERAGE | | |
REAL INT | | |
NOMINAL | | |
AVERAGE | | |
REAL INT | | |
NOMINAL | | |
AVERAGE | | |
REAL INT | | |
NOMINAL | |
| Yields & rates in annualized nominal
% | |
BALANCE | | |
RATE | | |
INT
RATE | | |
BALANCE | | |
RATE | | |
INT
RATE | | |
BALANCE | | |
RATE | | |
INT
RATE | |
| Interest-earning assets | |
| | | |
| | | |
| | | |
| | | |
| | | |
| | | |
| | | |
| | | |
| | |
| Cash and Deposits
in Banks | |
| 356,234 | | |
| -5.9 | % | |
| 2.4 | % | |
| 308,343 | | |
| 106.6 | % | |
| 3.8 | % | |
| 399,785 | | |
| -58.3 | % | |
| 3.2 | % |
| Loans & Other Financing | |
| | | |
| | | |
| | | |
| | | |
| | | |
| | | |
| | | |
| | | |
| | |
| Financial
Sector | |
| 658 | | |
| -1.8 | % | |
| 6.8 | % | |
| 6,191 | | |
| 100.6 | % | |
| 0.8 | % | |
| 255 | | |
| -41.7 | % | |
| 44.2 | % |
| Private Sector | |
| 174,386 | | |
| 21.3 | % | |
| 31.9 | % | |
| 188,132 | | |
| 208.6 | % | |
| 55.1 | % | |
| 381,142 | | |
| -51.4 | % | |
| 20.2 | % |
| Other debt securities | |
| | | |
| | | |
| | | |
| | | |
| | | |
| | | |
| | | |
| | | |
| | |
| Central
Bank | |
| 143,703 | | |
| 0 | | |
| 0 | | |
| 75335 | | |
| 0 | | |
| 0 | | |
| 19884 | | |
| 0 | | |
| 0 | |
| Government
& Private Securities | |
| 52,901 | | |
| 3.0 | % | |
| 12.0 | % | |
| 51,219 | | |
| 132.2 | % | |
| 16.7 | % | |
| 61,479 | | |
| -56.7 | % | |
| 7.0 | % |
| Total interest-earning assets | |
| 727,882 | | |
| 0.8 | % | |
| 9.7 | % | |
| 635,749 | | |
| 137.8 | % | |
| 19.5 | % | |
| 862,545 | | |
| -55.2 | % | |
| 10.9 | % |
| | |
| | | |
| | | |
| | | |
| | | |
| | | |
| | | |
| | | |
| | | |
| | |
| Fin. Assets through P&L and
equity inv. | |
| 855,340 | | |
| 6.2 | % | |
| 15.5 | % | |
| 2,124,428 | | |
| 585.3 | % | |
| 244.4 | % | |
| 1,306,440 | | |
| -36.3 | % | |
| 57.5 | % |
| Other Non interest-earning
assets | |
| 1,320,657 | | |
| | | |
| | | |
| 1,500,938 | | |
| | | |
| | | |
| 1,654,935 | | |
| | | |
| | |
| Total Non interest earning
assets | |
| 2,175,997 | | |
| | | |
| | | |
| 3,625,366 | | |
| | | |
| | | |
| 2,961,375 | | |
| | | |
| | |
| Total Average Assets | |
| 2,903,879 | | |
| | | |
| | | |
| 4,261,115 | | |
| | | |
| | | |
| 3,823,920 | | |
| | | |
| | |
| | |
| | | |
| | | |
| | | |
| | | |
| | | |
| | | |
| | | |
| | | |
| | |
| Interest-bearing liabilities | |
| | | |
| | | |
| | | |
| | | |
| | | |
| | | |
| | | |
| | | |
| | |
| Deposits | |
| | | |
| | | |
| | | |
| | | |
| | | |
| | | |
| | | |
| | | |
| | |
| Public
Sector | |
| 20,974 | | |
| -8.0 | % | |
| 0.1 | % | |
| 7,140 | | |
| 99.2 | % | |
| 0.1 | % | |
| 6,741 | | |
| -59.5 | % | |
| 0.1 | % |
| Private
Sector | |
| 473,868 | | |
| -8.1 | % | |
| 0.0 | % | |
| 504,525 | | |
| 99.0 | % | |
| 0.0 | % | |
| 712,809 | | |
| -59.6 | % | |
| 0.0 | % |
| BCRA and other financial institutions | |
| 12,920 | | |
| -3.5 | % | |
| 5.0 | % | |
| 18,160 | | |
| 117.9 | % | |
| 9.5 | % | |
| 16,043 | | |
| -56.3 | % | |
| 8.1 | % |
| Issued corporate bonds | |
| 12,330 | | |
| -6.2 | % | |
| 2.0 | % | |
| 38,651 | | |
| 110.3 | % | |
| 5.7 | % | |
| 62,930 | | |
| -57.6 | % | |
| 5.0 | % |
| Subordinated bonds | |
| 327,296 | | |
| -2.1 | % | |
| 6.5 | % | |
| 323,986 | | |
| 112.9 | % | |
| 7.0 | % | |
| 381,664 | | |
| -57.0 | % | |
| 6.4 | % |
| Total int.-bearing liabilities | |
| 847,388 | | |
| -5.7 | % | |
| 2.6 | % | |
| 892,462 | | |
| 105.0 | % | |
| 3.0 | % | |
| 1,180,187 | | |
| -58.6 | % | |
| 2.5 | % |
| | |
| | | |
| | | |
| | | |
| | | |
| | | |
| | | |
| | | |
| | | |
| | |
| Total non int.-bearing liabilities | |
| 411,371 | | |
| | | |
| | | |
| 613,192 | | |
| | | |
| | | |
| 719,071 | | |
| | | |
| | |
| | |
| | | |
| | | |
| | | |
| | | |
| | | |
| | | |
| | | |
| | | |
| | |
| Total Average liabilities | |
| 1,258,759 | | |
| | | |
| | | |
| 1,505,654 | | |
| | | |
| | | |
| 1,899,258 | | |
| | | |
| | |
| | |
| | | |
| | | |
| | | |
| | | |
| | | |
| | | |
| | | |
| | | |
| | |
| Assets Performance | |
| | | |
| 17,433 | | |
| | | |
| | | |
| 31,224 | | |
| | | |
| | | |
| 23,399 | | |
| | |
| Liabilities Performance | |
| | | |
| 5,490 | | |
| | | |
| | | |
| 6,776 | | |
| | | |
| | | |
| 7,216 | | |
| | |
| Net Interest Income | |
| | | |
| 11,943 | | |
| | | |
| | | |
| 24,448 | | |
| | | |
| | | |
| 16,183 | | |
| | |
| Total interest-earning assets | |
| | | |
| 727,882 | | |
| | | |
| | | |
| 635,749 | | |
| | | |
| | | |
| 862,545 | | |
| | |
| Net Interest Margin (NIM) | |
| | | |
| 6.7 | % | |
| | | |
| | | |
| 15.3 | % | |
| | | |
| | | |
| 7.5 | % | |
| | |
In 1Q24 Banco Macro’s net fee income
totaled Ps.74.1 billion, 12% or Ps.10.2 billion lower than in 4Q23 and was 13% or Ps.11.4 billion lower than the same period of last
year.
In the quarter, fee income totaled Ps.84.2
billion, 12% or Ps.11 billion lower than in 4Q23. In the quarter fees charged on deposit accounts decreased 13% or Ps.4.2 billion, credit
card fees decreased 14% or Ps.2.8 billion and Mutual funds and securities fees decreased 31% or Ps.1.3 billion. On a yearly basis, fee
income decreased 11% or Ps.10 billion.
In the quarter, total fee expense decreased
7% or Ps.820 million. On a yearly basis, fee expenses increased 16% or Ps.1.4 billion.
| BANCO MACRO |
1Q24 EARNINGS RELEASE |
| NET FEE INCOME | |
MACRO
Consolidated | | |
Change | |
| In MILLION $ (Measuring Unit Current at
EOP) | |
1Q23 | | |
2Q23 | | |
3Q23 | | |
4Q23 | | |
1Q24 | | |
QoQ | | |
YoY | |
| Fees charged on deposit accounts | |
| 34,893 | | |
| 34,068 | | |
| 32,990 | | |
| 33,182 | | |
| 28,945 | | |
| -13 | % | |
| -17 | % |
| Credit card fees | |
| 20,583 | | |
| 19,233 | | |
| 18,391 | | |
| 19,810 | | |
| 17,044 | | |
| -14 | % | |
| -17 | % |
| Corporate services fees | |
| 13,665 | | |
| 13,360 | | |
| 14,016 | | |
| 13,859 | | |
| 13,715 | | |
| -1 | % | |
| 0 | % |
| Debit card fees | |
| 4,272 | | |
| 3,904 | | |
| 5,893 | | |
| 6,633 | | |
| 5,589 | | |
| -16 | % | |
| 31 | % |
| ATM transaction fees | |
| 6,383 | | |
| 5,508 | | |
| 5,378 | | |
| 5,110 | | |
| 5,115 | | |
| 0 | % | |
| -20 | % |
| Insurance fees | |
| 5,078 | | |
| 4,748 | | |
| 4,420 | | |
| 4,268 | | |
| 3,629 | | |
| -15 | % | |
| -29 | % |
| Credit related fees | |
| 2,209 | | |
| 2,634 | | |
| 2,227 | | |
| 3,351 | | |
| 3,604 | | |
| 8 | % | |
| 63 | % |
| Financial agent fees (provinces) | |
| 4,628 | | |
| 5,212 | | |
| 4,977 | | |
| 4,556 | | |
| 3,474 | | |
| -24 | % | |
| -25 | % |
| Mutual funds & securities fees | |
| 2,232 | | |
| 2,583 | | |
| 3,130 | | |
| 4,248 | | |
| 2,936 | | |
| -31 | % | |
| 32 | % |
| AFIP & Collection services | |
| 225 | | |
| 184 | | |
| 176 | | |
| 156 | | |
| 125 | | |
| -20 | % | |
| -44 | % |
| ANSES fees | |
| 55 | | |
| 46 | | |
| 47 | | |
| 33 | | |
| 15 | | |
| -55 | % | |
| -73 | % |
| Total fee income | |
| 94,223 | | |
| 91,480 | | |
| 91,645 | | |
| 95,206 | | |
| 84,191 | | |
| -12 | % | |
| -11 | % |
| | |
| | | |
| | | |
| | | |
| | | |
| | | |
| | | |
| | |
| Total fee expense | |
| 8,768 | | |
| 8,945 | | |
| 9,157 | | |
| 10,950 | | |
| 10,130 | | |
| -7 | % | |
| 16 | % |
| | |
| | | |
| | | |
| | | |
| | | |
| | | |
| | | |
| | |
| Net fee income | |
| 85,455 | | |
| 82,535 | | |
| 82,488 | | |
| 84,256 | | |
| 74,061 | | |
| -12 | % | |
| -13 | % |
In 1Q43 Net Income from financial assets and
liabilities at fair value through profit or loss totaled a Ps.1.27 trillion gain, decreasing 6% or Ps.84.9 billion in the quarter.
This gain was mainly due to the mark to market of some government securities (CER inflation adjusted bonds) (Ps.1.28 trillion).
| On a yearly basis Net Income from financial assets and liabilities at fair value through profit or loss increased Ps.1.24 trillion. |  |
NET INCOME FROM FINANCIAL ASSETS AND LIABILITIES
AT FAIR VALUE THROUGH PROFIT OR LOSS | |
MACRO Consolidated | | |
Change | |
| In MILLION $ (Measuring Unit Current at EOP) | |
1Q23 | | |
2Q23 | | |
3Q23 | | |
4Q23 | | |
1Q24 | | |
QoQ | | |
YoY | |
| Profit or loss from government securities | |
| 50,067 | | |
| 137,694 | | |
| -141,234 | | |
| 1,266,336 | | |
| 1,279,205 | | |
| 1 | % | |
| 2455 | % |
| Profit or loss from private securities | |
| -11,849 | | |
| 25,065 | | |
| 37,242 | | |
| 54,781 | | |
| 6,579 | | |
| -88 | % | |
| -156 | % |
| Profit or loss from investment in derivative financing
instruments | |
| 754 | | |
| 1,311 | | |
| 1,921 | | |
| 23,363 | | |
| 5,165 | | |
| -78 | % | |
| 585 | % |
| Profit or loss from other financial assets | |
| 66 | | |
| 474 | | |
| -2,433 | | |
| 3,708 | | |
| 3,165 | | |
| -15 | % | |
| 4695 | % |
| Profit or loss from investment in equity instruments | |
| 197 | | |
| -119 | | |
| 4,163 | | |
| 1,046 | | |
| 435 | | |
| -58 | % | |
| 121 | % |
| Profit or loss from the sale of financial assets at fair value | |
| -1,954 | | |
| 5,772 | | |
| 16,846 | | |
| 9,736 | | |
| -14,503 | | |
| - | | |
| - | |
| Income from financial assets at fair value through profit or loss | |
| 37,281 | | |
| 170,197 | | |
| -83,495 | | |
| 1,358,970 | | |
| 1,280,046 | | |
| -6 | % | |
| 3334 | % |
| | |
| | | |
| | | |
| | | |
| | | |
| | | |
| | | |
| | |
| Profit or loss from derivative financing instruments | |
| -1,617 | | |
| -7,614 | | |
| -1,008 | | |
| -1,606 | | |
| -7,608 | | |
| - | | |
| - | |
| Income from financial liabilities at fair value through profit or loss | |
| -1,617 | | |
| -7,614 | | |
| -1,008 | | |
| -1,606 | | |
| -7,608 | | |
| - | | |
| - | |
| | |
| | | |
| | | |
| | | |
| | | |
| | | |
| | | |
| | |
NET INCOME FROM FINANCIAL ASSETS AT FAIR
VALUE THROUGH PROFIT OR LOSS | |
| 35,664 | | |
| 162,583 | | |
| -84,503 | | |
| 1,357,364 | | |
| 1,272,438 | | |
| -6 | % | |
| 3468 | % |
| BANCO MACRO |
1Q24 EARNINGS RELEASE |
In the quarter, Other Operating Income
totaled Ps.44.4 billion, 16% or Ps.6.2 billion higher than in 4Q23 (Other adjustments and interest from other receivables increased 5.2
billion while Other adjustments and interest from receivables increased 54% or Ps.5 billion).On a yearly basis, Other Operating Income
increased 100% or Ps.22.2 billion.
| OTHER OPERATING INCOME | |
MACRO Consolidated | | |
Change | |
| In MILLION $ (Measuring Unit Current at EOP) | |
1Q23 | | |
2Q23 | | |
3Q23 | | |
4Q23 | | |
1Q24 | | |
QoQ | | |
YoY | |
| Credit and debit cards | |
| 2,465 | | |
| 2,929 | | |
| 3,649 | | |
| 4,629 | | |
| 3,796 | | |
| -18 | % | |
| 54 | % |
| Lease of safe deposit boxes | |
| 2,711 | | |
| 2,549 | | |
| 2,438 | | |
| 2,805 | | |
| 2,606 | | |
| -7 | % | |
| -4 | % |
| Other service related fees | |
| 6,884 | | |
| 7,605 | | |
| 9,656 | | |
| 11,344 | | |
| 12,841 | | |
| 13 | % | |
| 87 | % |
| Other adjustments and interest from other receivables | |
| 5,696 | | |
| 6,037 | | |
| 6,869 | | |
| 9,296 | | |
| 14,321 | | |
| 54 | % | |
| 151 | % |
| Initial recognition of loans | |
| - | | |
| - | | |
| - | | |
| - | | |
| 5,162 | | |
| - | | |
| - | |
| Sale of property, plant and equipment | |
| 23 | | |
| 180 | | |
| -5 | | |
| 53 | | |
| 1 | | |
| -98 | % | |
| - | |
| Others | |
| 4,391 | | |
| 4,675 | | |
| 3,616 | | |
| 10,023 | | |
| 5,623 | | |
| -44 | % | |
| 28 | % |
| Other Operating Income | |
| 22,170 | | |
| 23,975 | | |
| 26,223 | | |
| 38,150 | | |
| 44,350 | | |
| 16 | % | |
| 100 | % |
In 1Q24 Banco Macro’s administrative
expenses plus employee benefits totaled Ps.202.3 billion, 12% or Ps.28.9 billion lower than the previous quarter, due to lower employee
benefits (-1%) and lower (+28%) administrative expenses. On a yearly basis, administrative expenses plus employee benefits increased
49% or Ps.66.1 billion.
Employee benefits decreased 1% or Ps.1.5
billion QoQ, social security contributions and compensation and bonuses decreased 7% or Ps.1.6 billion while Compensation and bonuses
decreased 7% or Ps.1.3 billion. On a yearly basis, Employee benefits increased 47% or Ps.42.4 billion.
In 1Q24, administrative expenses decreased
28% or Ps.27.4 billion, due to lower Directors and auditors fees(-60%), lower other professional fees (-37%) lower advertisement and
publicity fees (-43%) and lower other administrative expenses (-16%). On a yearly basis administrative expenses increased 52% or Ps.23.7
billion.
In 1Q24, the efficiency ratio reached
14.7%, improving significantly from the 18.6% posted in 4Q23 and much better than the 25.5% posted a year ago. In 1Q24 expenses (employee
benefits + G&A expenses + depreciation and impairment of assets) decreased 13%, while income (net interest income + net fee income
+ differences in quoted prices of gold and foreign currency + other operating income + net income from financial assets at fair value
through profit or loss – (Turnover Tax + Insurance on deposits)) decreased 11% compared to 4Q23.
| BANCO MACRO |
1Q24 EARNINGS RELEASE |
| PERSONNEL & ADMINISTRATIVE EXPENSES | |
MACRO Consolidated | | |
Change | |
| In MILLION $ (Measuring Unit Current at EOP) | |
1Q23 | | |
2Q23 | | |
3Q23 | | |
4Q23 | | |
1Q24 | | |
QoQ | | |
YoY | |
| Employee benefits | |
| 91,026 | | |
| 96,158 | | |
| 100,219 | | |
| 134,878 | | |
| 133,392 | | |
| -1 | % | |
| 47 | % |
| Remunerations | |
| 61,357 | | |
| 65,900 | | |
| 69,341 | | |
| 89,747 | | |
| 91,400 | | |
| 2 | % | |
| 49 | % |
| Social Security Contributions | |
| 15,605 | | |
| 15,907 | | |
| 17,202 | | |
| 23,505 | | |
| 21,913 | | |
| -7 | % | |
| 40 | % |
| Compensation and bonuses | |
| 11,012 | | |
| 11,112 | | |
| 10,379 | | |
| 18,067 | | |
| 16,820 | | |
| -7 | % | |
| 53 | % |
| Employee services | |
| 3,052 | | |
| 3,239 | | |
| 3,297 | | |
| 3,559 | | |
| 3,259 | | |
| -8 | % | |
| 7 | % |
| Administrative Expenses | |
| 45,189 | | |
| 53,873 | | |
| 53,635 | | |
| 96,306 | | |
| 68,910 | | |
| -28 | % | |
| 52 | % |
| Taxes | |
| 7,672 | | |
| 8,343 | | |
| 11,194 | | |
| 13,640 | | |
| 11,788 | | |
| -14 | % | |
| 54 | % |
| Maintenance, conservation fees | |
| 6,996 | | |
| 7,510 | | |
| 7,508 | | |
| 10,497 | | |
| 9,673 | | |
| -8 | % | |
| 38 | % |
| Directors & statutory auditors fees | |
| 1,824 | | |
| 6,100 | | |
| 3,076 | | |
| 29,825 | | |
| 12,035 | | |
| -60 | % | |
| 560 | % |
| Security services | |
| 4,322 | | |
| 4,314 | | |
| 4,544 | | |
| 4,862 | | |
| 4,013 | | |
| -17 | % | |
| -7 | % |
| Electricity & Communications | |
| 4,132 | | |
| 3,995 | | |
| 3,923 | | |
| 3,712 | | |
| 5,106 | | |
| 38 | % | |
| 24 | % |
| Other professional fees | |
| 4,894 | | |
| 5,401 | | |
| 5,849 | | |
| 8,984 | | |
| 5,666 | | |
| -37 | % | |
| 16 | % |
| Rental agreements | |
| 177 | | |
| 228 | | |
| 160 | | |
| 148 | | |
| 433 | | |
| 193 | % | |
| 145 | % |
| Advertising & publicity | |
| 1,848 | | |
| 3,012 | | |
| 4,309 | | |
| 4,920 | | |
| 2,783 | | |
| -43 | % | |
| 51 | % |
| Personnel allowances | |
| 931 | | |
| 988 | | |
| 1,057 | | |
| 1,314 | | |
| 755 | | |
| -43 | % | |
| -19 | % |
| Stationary & Office Supplies | |
| 405 | | |
| 354 | | |
| 372 | | |
| 491 | | |
| 362 | | |
| -26 | % | |
| -11 | % |
| Insurance | |
| 374 | | |
| 463 | | |
| 471 | | |
| 477 | | |
| 337 | | |
| -29 | % | |
| -10 | % |
| Hired administrative services | |
| 324 | | |
| 1,398 | | |
| 924 | | |
| 1,941 | | |
| 2,872 | | |
| 48 | % | |
| 786 | % |
| Other | |
| 11,290 | | |
| 11,767 | | |
| 10,248 | | |
| 15,495 | | |
| 13,087 | | |
| -16 | % | |
| 16 | % |
| Total Administrative Expenses | |
| 136,215 | | |
| 150,031 | | |
| 153,854 | | |
| 231,184 | | |
| 202,302 | | |
| -12 | % | |
| 49 | % |
| | |
| | | |
| | | |
| | | |
| | | |
| | | |
| | | |
| | |
| Total Employees | |
| 7,756 | | |
| 7,797 | | |
| 7,765 | | |
| 9,192 | | |
| 9,166 | | |
| | | |
| | |
| Branches | |
| 463 | | |
| 462 | | |
| 461 | | |
| 519 | | |
| 517 | | |
| | | |
| | |
| Efficiency ratio | |
| 25.5 | % | |
| 21.7 | % | |
| 22.4 | % | |
| 13.6 | % | |
| 14.7 | % | |
| | | |
| | |
| | |
| | | |
| | | |
| | | |
| | | |
| | | |
| | | |
| | |
| Accumulated efficiency ratio | |
| 25.5 | % | |
| 23.4 | % | |
| 23.0 | % | |
| 18.6 | % | |
| 14.7 | % | |
| | | |
| | |
In 1Q24, Other Operating Expenses totaled
Ps.139.6 billion, decreasing 18% or Ps.30 billion QoQ, due to lower turnover tax (13% or Ps.13.5 billion), lower initial loan recognition
charges (Ps.9 billion) and lower Other expenses (12% or Ps.5.4 billion). On a yearly basis, Other Operating Expenses increased 51% or
Ps.47.1 billion.
| OTHER OPERATING EXPENSES | |
MACRO Consolidated | | |
Change | |
| In MILLION $ (Measuring Unit Current at EOP) | |
1Q23 | | |
2Q23 | | |
3Q23 | | |
4Q23 | | |
1Q24 | | |
QoQ | | |
YoY | |
| Turnover Tax | |
| 54,278 | | |
| 63,790 | | |
| 63,942 | | |
| 106,298 | | |
| 92,800 | | |
| -13 | % | |
| 71 | % |
| Other provision charges | |
| 2,568 | | |
| 3,026 | | |
| 2,047.00 | | |
| 5,738 | | |
| 3,720 | | |
| -35 | % | |
| 45 | % |
| Deposit Guarantee Fund Contributions | |
| 2,352 | | |
| 2,187 | | |
| 2,237 | | |
| 1,879 | | |
| 1,687 | | |
| -10 | % | |
| -28 | % |
| Donations | |
| 801 | | |
| 619 | | |
| 213 | | |
| 282 | | |
| 530 | | |
| 88 | % | |
| -34 | % |
| Insurance claims | |
| 890 | | |
| 893 | | |
| 900 | | |
| 1,213 | | |
| 1,128 | | |
| -7 | % | |
| 27 | % |
| Initial loan recognition | |
| 846 | | |
| 11,337 | | |
| 1,289 | | |
| 9,028 | | |
| - | | |
| -100 | % | |
| 100 | % |
| Others | |
| 30,719 | | |
| 34,032 | | |
| 38,597 | | |
| 45,149 | | |
| 39,716 | | |
| -12 | % | |
| 29 | % |
| Other Operating Expenses | |
| 92,454 | | |
| 115,885 | | |
| 109,226 | | |
| 169,603 | | |
| 139,584 | | |
| -18 | % | |
| 51 | % |
| BANCO MACRO |
1Q24 EARNINGS RELEASE |
In 1Q24, the result from the net monetary
position totaled a Ps.889 billion loss, 12% or Ps.91 billion higher than the loss posted in 4Q23 and 159% or Ps.546.2 billion higher
than the loss posted one year ago. This result is a consequence of a higher net monetary position (+84%) which was partially
offset by lower inflation during the quarter(167 b.p. below 4Q23 level, down to 51.6% from 53.3% in 4Q23).
| OPERATING RESULT | |
MACRO consolidated | | |
Change | |
| In MILLION $ (Measuring Unit Current at EOP) | |
1Q23 | | |
2Q23 | | |
3Q23 | | |
4Q23 | | |
1Q24 | | |
QoQ | | |
YoY | |
| Operating Result (exc. Loss from net monetary position) | |
| 403,192 | | |
| 542,357 | | |
| 546,216 | | |
| 1,576,657 | | |
| 1,253,950 | | |
| -20 | % | |
| 211 | % |
| Result from net monetary position (i.e. inflation adjustment) | |
| -342,825 | | |
| -342,898 | | |
| -501,839 | | |
| -797,250 | | |
| -888,994 | | |
| 12 | % | |
| 159 | % |
| Operating Result (Inc. Loss from net monetary position) | |
| 60,367 | | |
| 199,459 | | |
| 44,377 | | |
| 779,407 | | |
| 364,956 | | |
| -53 | % | |
| 505 | % |
In 1Q24, Banco Macro's effective income tax
rate was 24.5%, lower than the 31.4% registered in 4Q23.
| For more information,
please see note 21 “Income Tax” of our Financial Statements. |
 |
| BANCO MACRO |
1Q24 EARNINGS RELEASE |
Loans and other financing
The volume of financing (including loans,
financial trust and leasing portfolio) totaled Ps.2.5 triillion, decreasing 10% or Ps.279.6 billion QoQ and decreasing 8% or Ps.205.9
billion YoY. In 1Q24 Private sector loans decreased 10% or Ps.279.8 billion. On a yearly basis Private sector loans decreased 8% or Ps.215.7
billion.
Within commercial loans, Overdrafts stand
out with a 21% or Ps.92.6 billion decrease, Documents decreased 2% or Ps.10 billion while Others increased 2% or Ps.9.3
billion.
Within consumer lending, personal loans
decreased 12% or Ps.44.8 billion while credit card loans decreased 18% or Ps.132.1 billion.
Within private sector financing, peso
financing decreased 20% or Ps.513.9 billion, while US dollar financing increased 75% or USD 254 million.
As of 1Q24, Banco Macro’s market share
over private sector loans was 9.4%.
| LOANS AND OTHER FINANCING | |
MACRO Consilidated | | |
Change | |
| In MILLION $ (Measuring Unit Current at EOP) | |
1Q23 | | |
2Q23 | | |
3Q23 | | |
4Q23 | | |
1Q24 | | |
QoQ | | |
YoY | |
| Public Sector | |
| 5,468 | | |
| 58,171 | | |
| 7,346 | | |
| 7,152 | | |
| 2,817 | | |
| -61 | % | |
| -48 | % |
| Finacial Sector | |
| 7,202 | | |
| 6,607 | | |
| 33,789 | | |
| 15,109 | | |
| 19,637 | | |
| 30 | % | |
| 173 | % |
| Financial Sector | |
| 7,250 | | |
| 6,666 | | |
| 33,843 | | |
| 15,144 | | |
| 19,659 | | |
| 30 | % | |
| 171 | % |
| Less: Expected Credit Losses | |
| -48 | | |
| -59 | | |
| -54 | | |
| -35 | | |
| -22 | | |
| -37 | % | |
| -54 | % |
| Private Sector | |
| 2,693,826 | | |
| 2,733,995 | | |
| 2,639,619 | | |
| 2,757,967 | | |
| 2,478,131 | | |
| -10 | % | |
| -8 | % |
| Overdrafts | |
| 208,656 | | |
| 276,170 | | |
| 262,354 | | |
| 436,518 | | |
| 343,943 | | |
| -21 | % | |
| 65 | % |
| Discounted documents | |
| 389,554 | | |
| 432,414 | | |
| 502,585 | | |
| 512,966 | | |
| 502,960 | | |
| -2 | % | |
| 29 | % |
| Mortgage loans | |
| 276,994 | | |
| 273,534 | | |
| 253,024 | | |
| 253,600 | | |
| 245,941 | | |
| -3 | % | |
| -11 | % |
| Pledged loans | |
| 42,545 | | |
| 42,867 | | |
| 43,551 | | |
| 42,647 | | |
| 32,928 | | |
| -23 | % | |
| -23 | % |
| Personal loans | |
| 623,668 | | |
| 549,091 | | |
| 461,065 | | |
| 361,214 | | |
| 316,391 | | |
| -12 | % | |
| -49 | % |
| Credit Card loans | |
| 838,490 | | |
| 826,147 | | |
| 793,305 | | |
| 735,017 | | |
| 602,881 | | |
| -18 | % | |
| -28 | % |
| Leasing | |
| 5,217 | | |
| 4,499 | | |
| 3,374 | | |
| 14,387 | | |
| 10,057 | | |
| -30 | % | |
| 93 | % |
| Others | |
| 363,039 | | |
| 385,009 | | |
| 370,772 | | |
| 482,925 | | |
| 492,211 | | |
| 2 | % | |
| 36 | % |
| Less: Expected Credit Losses | |
| -54,337 | | |
| -55,736 | | |
| -50,411 | | |
| -81,307 | | |
| -69,181 | | |
| -15 | % | |
| 27 | % |
| Total loans and other financing | |
| 2,706,496 | | |
| 2,798,773 | | |
| 2,680,754 | | |
| 2,780,228 | | |
| 2,500,585 | | |
| -10 | % | |
| -8 | % |
| | |
| | | |
| | | |
| | | |
| | | |
| | | |
| | | |
| | |
| Total loans in Pesos | |
| 2,504,688 | | |
| 2,613,790 | | |
| 2,501,555 | | |
| 2,507,337 | | |
| 1,993,425 | | |
| -20 | % | |
| -20 | % |
| | |
| | | |
| | | |
| | | |
| | | |
| | | |
| | | |
| | |
| Total loans in foreign currency | |
| 201,808 | | |
| 184,983 | | |
| 179,199 | | |
| 272,891 | | |
| 507,160 | | |
| 86 | % | |
| 151 | % |
| | |
| | | |
| | | |
| | | |
| | | |
| | | |
| | | |
| | |
| EOP FX (Pesos per USD) | |
| 208.9883 | | |
| 256.6750 | | |
| 350.0083 | | |
| 808.4833 | | |
| 857.4167 | | |
| 6 | % | |
| 310 | % |
| | |
| | | |
| | | |
| | | |
| | | |
| | | |
| | | |
| | |
| Total loans in foreign currency (USD) | |
| 966 | | |
| 721 | | |
| 512 | | |
| 338 | | |
| 591 | | |
| 75 | % | |
| -39 | % |
| USD financing / Financing to the private sector | |
| 7 | % | |
| 7 | % | |
| 7 | % | |
| 10 | % | |
| 20 | % | |
| | | |
| | |
| BANCO MACRO |
1Q24
EARNINGS RELEASE |
In 1Q24, the Bank’s
public sector assets (excluding Central Bank notes) to total assets ratio was 47.3%, higher than the 31% registered in the previous
quarter, and higher than the 17% posted in 1Q23. Other government securities increased 50% (CER inflation linked bonds) which were partially
offset by a decrease in Dual Bond holdings.
| In
1Q24, a 50% or Ps.1.58 trillion increase in Government Securities stands out. |
 |
| PUBLIC
SECTOR ASSETS | |
MACRO
Consolidated | |
Change | |
| In
MILLION $ (Measuring Unit Current at EOP) | |
| 1Q23 | |
| 2Q23 | |
| 3Q23 | |
| 4Q23 | |
| 1Q24 | |
| QoQ | | |
YoY | |
| Leliqs | |
| 2,497,487 | |
| 1,919,463 | |
| 983,024 | |
| - | |
| - | |
| - | | |
-100 | % |
| Other | |
| 1,600,837 | |
| 2,177,464 | |
| 2,147,586 | |
| 3,149,227 | |
| 4,732,151 | |
| 50 | % | |
196 | % |
| Government securities | |
| 4,098,324 | |
| 4,096,927 | |
| 3,130,610 | |
| 3,149,227 | |
| 4,732,151 | |
| 50 | % | |
15 | % |
| Provincial loans | |
| 3,626 | |
| 55,585 | |
| 5,027 | |
| 4,882 | |
| 952 | |
| -80 | % | |
-74 | % |
| Loans | |
| 3,626 | |
| 55,585 | |
| 5,027 | |
| 4,882 | |
| 952 | |
| -80 | % | |
-74 | % |
| | |
| | |
| | |
| | |
| | |
| | |
| | | |
| |
| TOTAL PUBLIC SECTOR ASSETS | |
| 4,101,950 | |
| 4,152,512 | |
| 3,135,637 | |
| 3,154,109 | |
| 4,733,103 | |
| 50 | % | |
15 | % |
| | |
| | |
| | |
| | |
| | |
| | |
| | | |
| |
| TOTAL PUBLIC SECTOR ASSETS
(net of LEBAC/NOBAC/LELIQ) | |
| 1,604,463 | |
| 2,233,049 | |
| 2,152,613 | |
| 3,154,109 | |
| 4,733,103 | |
| 50 | % | |
195 | % |
| | |
| | |
| | |
| | |
| | |
| | |
| | | |
| |
| TOTAL PUBLIC SECTOR ASSETS
(net of LEBAC/NOBAC/LELIQ)/TOTAL ASSETS | |
| 17.0 | % |
| 22.4 | % |
| 25.0 | % |
| 31.0 | % |
| 47.3 | % |
| | | |
| |
| BANCO MACRO |
1Q24
EARNINGS RELEASE |
Deposits
Banco Macro’s
deposit base totaled Ps.5 trillion in 1Q24, decreasing 1% or Ps.74.3 billion QoQ and an 11% or Ps.644 billion decrease YoY and representing
76% of the Bank’s total liabilities.
On a quarterly
basis private sector deposits decreased 6% or Ps.291.2 billion while public sector deposits decreased 83% or Ps.234.2 billion.
The decrease in
private sector deposits was led by demand deposits, which decreased 26% or Ps.777.3 billion, while time deposits increased 27%
or Ps.422.6 billion QoQ.
Within private
sector deposits, peso deposits increased 10% or Ps.365.2 billion, while US dollar deposits decreased 32% or USD 622 million.
As of 1Q24, Banco
Macro´s market share over private sector deposits was 7.5%.
| DEPOSITS | |
MACRO
Consolidated | |
Change | |
| In MILLION $ (Measuring
Unit Current at EOP) | |
| 1Q23 | |
| 2Q23 | |
| 3Q23 | |
| 4Q23 | |
| 1Q24 | |
| QoQ | | |
YoY | |
| Public sector | |
| 430,767 | |
| 415,060 | |
| 413,026 | |
| 283,686 | |
| 517,846 | |
| 83 | % | |
20 | % |
| | |
| | |
| | |
| | |
| | |
| | |
| | | |
| |
| Financial sector | |
| 7,412 | |
| 9,214 | |
| 8,024 | |
| 30,606 | |
| 13,371 | |
| -56 | % | |
80 | % |
| | |
| | |
| | |
| | |
| | |
| | |
| | | |
| |
| Private sector | |
| 5,241,536 | |
| 5,538,160 | |
| 4,248,617 | |
| 4,795,731 | |
| 4,504,544 | |
| -6 | % | |
-14 | % |
| Checking accounts | |
| 649,635 | |
| 605,034 | |
| 584,674 | |
| 772,698 | |
| 541,276 | |
| -30 | % | |
-17 | % |
| Savings accounts | |
| 1,640,953 | |
| 1,887,931 | |
| 1,503,265 | |
| 2,168,236 | |
| 1,622,337 | |
| -25 | % | |
-1 | % |
| Time deposits | |
| 2,869,724 | |
| 2,933,859 | |
| 2,064,094 | |
| 1,589,204 | |
| 2,011,772 | |
| 27 | % | |
-30 | % |
| Investment accounts | |
| 6,776 | |
| 40,066 | |
| 15,165 | |
| 189,853 | |
| 262,273 | |
| 38 | % | |
3771 | % |
| Other | |
| 74,448 | |
| 71,270 | |
| 81,419 | |
| 75,740 | |
| 66,886 | |
| | | |
| |
| Total | |
| 5,679,715 | |
| 5,962,434 | |
| 4,669,667 | |
| 5,110,023 | |
| 5,035,761 | |
| -1 | % | |
-11 | % |
| | |
| | |
| | |
| | |
| | |
| | |
| | | |
| |
| Pesos | |
| 4,885,753 | |
| 5,218,833 | |
| 3,941,234 | |
| 3,558,225 | |
| 3,923,408 | |
| 10 | % | |
-20 | % |
| Foreign Currency (in Pesos) | |
| 793,962 | |
| 743,601 | |
| 728,433 | |
| 1,551,798 | |
| 1,112,353 | |
| -28 | % | |
40 | % |
| | |
| | |
| | |
| | |
| | |
| | |
| | | |
| |
| EOP FX (Pesos per USD) | |
| 208.9883 | |
| 256.6750 | |
| 350.0083 | |
| 808.4833 | |
| 857.4167 | |
| 6 | % | |
310 | % |
| Foreign Currency (USD) | |
| 3,799 | |
| 2,897 | |
| 2,081 | |
| 1,919 | |
| 1,297 | |
| -32 | % | |
-66 | % |
| | |
| | |
| | |
| | |
| | |
| | |
| | | |
| |
| USD Deposits / Total Deposits | |
| 14 | % |
| 12 | % |
| 16 | % |
| 30 | % |
| 22 | % |
| | | |
| |
Banco Macro’s
transactional deposits represent approximately 46% of its total deposit base as of 1Q24. These accounts are low cost and are not
sensitive to interest rate increases.
| BANCO MACRO |
1Q24
EARNINGS RELEASE |
Other sources of
funds
In 1Q24, the total
amount of other sources of funds increased 2% or Ps.84.3 billion compared to 4Q23 mainly due to a 8% or Ps.260.7 billion increase
in Shareholders’ equity generated by the positive net income registered during the peiod. On a yearly basis, other sources
of funds increased 35% or Ps.981.2 billion.
| OTHER SOURCES OF FUNDS | |
MACRO
Consolidated | | |
Change | |
| In MILLION $ (Measuring Unit Current
at EOP) | |
1Q23 | | |
2Q23 | | |
3Q23 | | |
4Q23 | | |
1Q24 | | |
QoQ | | |
YoY | |
| Central Bank of Argentina | |
| 190 | | |
| 167 | | |
| 126 | | |
| 131 | | |
| 62 | | |
| -53 | % | |
| -67 | % |
| Banks and international institutions | |
| 17,142 | | |
| 10,654 | | |
| 12,061 | | |
| 23,079 | | |
| 18,551 | | |
| -20 | % | |
| 8 | % |
| Financing received from Argentine financial institutions | |
| 151 | | |
| 1,528 | | |
| 612 | | |
| 6,810 | | |
| 1,130 | | |
| -83 | % | |
| 648 | % |
| Subordinated corporate bonds | |
| 335,094 | | |
| 326,821 | | |
| 335,807 | | |
| 497,665 | | |
| 353,563 | | |
| -29 | % | |
| 6 | % |
| Corporate bonds | |
| 12,747 | | |
| 10,246 | | |
| 12,675 | | |
| 89,251 | | |
| 67,179 | | |
| -25 | % | |
| 427 | % |
| Shareholders' equity | |
| 2,454,052 | | |
| 2,327,687 | | |
| 2,341,790 | | |
| 3,099,400 | | |
| 3,360,113 | | |
| 8 | % | |
| 37 | % |
| Total other source of funds | |
| 2,819,376 | | |
| 2,677,103 | | |
| 2,703,071 | | |
| 3,716,336 | | |
| 3,800,598 | | |
| 2 | % | |
| 35 | % |

| BANCO MACRO |
1Q24
EARNINGS RELEASE |
In 1Q24, the
Bank’s liquid assets amounted to Ps.6.25 trillion, showing a 4% or Ps.9239.7 billion increase QoQ, and a 14% or Ps.755.7 billion
increase on a yearly basis.
| In 1Q24 Other Government securities increased 50% or Ps.1.58 trillion while Net Repos
decreased 70% or Ps.650 billion. |  |
| In 1Q24, Banco Macro’s liquid assets to total deposits ratio reached
124%. | |
| LIQUID ASSETS | |
MACRO
Consolidated | | |
Change | |
| In
MILLION $ (Measuring Unit Current at EOP) | |
1Q23 | | |
2Q23 | | |
3Q23 | | |
4Q23 | | |
1Q24 | | |
QoQ | | |
YoY | |
| Cash | |
| 1,154,332 | | |
| 1,039,322 | | |
| 1,040,143 | | |
| 1,824,171 | | |
| 1,149,472 | | |
| -37 | % | |
| 0 | % |
| Guarantees for compensating chambers | |
| 99,460 | | |
| 79,392 | | |
| 76,467 | | |
| 103,281 | | |
| 99,616 | | |
| -4 | % | |
| 0 | % |
| Call | |
| 2,327.00 | | |
| 251.00 | | |
| - | | |
| 8,188 | | |
| -8,461.00 | | |
| - | | |
| - | |
| Leliq own portfolio | |
| 2,497,487 | | |
| 1,919,463 | | |
| 983,024 | | |
| - | | |
| - | | |
| - | | |
| -100 | % |
| Net Repos | |
| 140,114 | | |
| 423,397 | | |
| 355,015 | | |
| 925,673 | | |
| 277,483 | | |
| -70 | % | |
| - | |
| Other government & private securities | |
| 1,600,837 | | |
| 2,177,464 | | |
| 2,147,586 | | |
| 3,149,227 | | |
| 4,732,151 | | |
| 50 | % | |
| 196 | % |
| Total | |
| 5,494,557 | | |
| 5,639,289 | | |
| 4,602,235 | | |
| 6,010,540 | | |
| 6,250,261 | | |
| 4 | % | |
| 14 | % |
| | |
| | | |
| | | |
| | | |
| | | |
| | | |
| | | |
| | |
| Liquid assets to total deposits | |
| 97 | % | |
| 95 | % | |
| 99 | % | |
| 118 | % | |
| 124 | % | |
| | | |
| | |
| BANCO MACRO |
1Q24
EARNINGS RELEASE |
Banco Macro continued
showing high solvency levels in 1Q24 with an integrated capital (RPC) of Ps.3.2 trillion over a total capital requirement of Ps.548.9billion.
Banco Macro’s excess capital in 1Q24 was 472% or Ps.2.59 trillion.
The Capital
Adequacy Ratio (as a percentage of risk-weighted assets- RWA) was 46.5% in 1Q24; TIER1 Ratio stood at 44.5%.
| The
Bank’s aim is to make THE BEST USE OF THIS EXCESS
CAPITAL. |
 |
| MINIMUM
CAPITAL REQUIREMENT | |
MACRO
Consolidated | | |
Change | |
| In MILLION $ | |
1Q23 | | |
2Q23 | | |
3Q23 | | |
4Q23 | | |
1Q24 | | |
QoQ | | |
YoY | |
| Credit risk requirement | |
| 73,119 | | |
| 92,213 | | |
| 124,155 | | |
| 250,774 | | |
| 312,304 | | |
| 25 | % | |
| 327 | % |
| Market risk requirement | |
| 11,531 | | |
| 25,821 | | |
| 19,898 | | |
| 38,335 | | |
| 39,647 | | |
| 3 | % | |
| 244 | % |
| Operational risk requirement | |
| 38,935 | | |
| 48,802 | | |
| 71,224 | | |
| 114,388 | | |
| 196,966 | | |
| 72 | % | |
| 406 | % |
| Total capital requirements | |
| 123,585 | | |
| 166,836 | | |
| 215,276 | | |
| 403,497 | | |
| 548,917 | | |
| 36 | % | |
| 344 | % |
| | |
| | | |
| | | |
| | | |
| | | |
| | | |
| | | |
| | |
| Ordinary Capital Level 1 (COn1) | |
| 627,056 | | |
| 717,831 | | |
| 979,304 | | |
| 1,745,360 | | |
| 3,184,428 | | |
| 82 | % | |
| 408 | % |
| Deductible concepts Level 1 (COn1) | |
| -33,553 | | |
| -41,726 | | |
| -59,469 | | |
| -121,538 | | |
| -180,391 | | |
| 48 | % | |
| 438 | % |
| Capital Level 2 (COn2) | |
| 50,063 | | |
| 61,480 | | |
| 83,763 | | |
| 128,995 | | |
| 136,797 | | |
| 6 | % | |
| 173 | % |
| Integrated capital - RPC (i) | |
| 643,566 | | |
| 737,585 | | |
| 1,003,598 | | |
| 1,752,832 | | |
| 3,140,849 | | |
| 79 | % | |
| 388 | % |
| | |
| | | |
| | | |
| | | |
| | | |
| | | |
| | | |
| | |
| Excess capital | |
| 519,981 | | |
| 570,749 | | |
| 788,322 | | |
| 1,349,335 | | |
| 2,591,932 | | |
| 92 | % | |
| 398 | % |
| | |
| | | |
| | | |
| | | |
| | | |
| | | |
| | | |
| | |
| Risk-weighted assets - RWA (ii) | |
| 1,518,189 | | |
| 2,051,880 | | |
| 2,645,752 | | |
| 4,952,407 | | |
| 6,747,756 | | |
| 36 | % | |
| 344 | % |
| | |
| | | |
| | | |
| | | |
| | | |
| | | |
| | | |
| | |
| Regulatory Capital ratio [(i)/(ii)] | |
| 42.4 | % | |
| 35.9 | % | |
| 37.9 | % | |
| 35.4 | % | |
| 46.5 | % | |
| | | |
| | |
| | |
| | | |
| | | |
| | | |
| | | |
| | | |
| | | |
| | |
| Ratio TIER 1 [Capital Level 1/RWA] | |
| 39.1 | % | |
| 33.0 | % | |
| 34.8 | % | |
| 32.8 | % | |
| 44.5 | % | |
| | | |
| | |
RWA - (ii): Risk
Weighted Assets, considering total capital requirements.
| BANCO MACRO |
1Q24
EARNINGS RELEASE |
In 1Q24, Banco
Macro’s non-performing to total financing ratio (under Central Bank rules) reached a level of 1.14%, down from 1.29% in 4Q23,
from the 1.41% posted in 1Q23.
Consumer portfolio
non-performing loans deteriorated 12 b.p. (up to 1.47% from 1.35%) while Commercial portfolio non-performing loans improved
49 b.p. in 1Q24 (down to 0.72% from 1.2%).
The coverage
ratio (measured as total allowances under Expected Credit Losses over Non Performing loans under Central Bank rules) reached 222.7%
in 1Q24. Write-offs over total loans totaled 0.06%.
The Bank is committed
to continue working in this area to maintain excellent asset quality standards.
| ASSET QUALITY | |
MACRO
Consolidated | | |
Change | |
| In MILLION $ (Measuring Unit Current
at EOP) | |
1Q23 | | |
2Q23 | | |
3Q23 | | |
4Q23 | | |
1Q24 | | |
QoQ | | |
YoY | |
| Commercial portfolio | |
| 531,924 | | |
| 681,922 | | |
| 706,309 | | |
| 1,372,953 | | |
| 1,248,032 | | |
| -9 | % | |
| 135 | % |
| Non-performing | |
| 9,204 | | |
| 8,041 | | |
| 8,067 | | |
| 16,539 | | |
| 8,972 | | |
| -46 | % | |
| -3 | % |
| Consumer portfolio | |
| 2,290,952 | | |
| 2,271,503 | | |
| 2,131,273 | | |
| 1,919,565 | | |
| 1,600,661 | | |
| -17 | % | |
| -30 | % |
| Non-performing | |
| 30,723 | | |
| 32,410 | | |
| 31,442 | | |
| 25,900 | | |
| 23,486 | | |
| -9 | % | |
| -24 | % |
| Total portfolio | |
| 2,822,876 | | |
| 2,953,425 | | |
| 2,837,582 | | |
| 3,292,518 | | |
| 2,848,693 | | |
| -13 | % | |
| 1 | % |
| Non-performing | |
| 39,927 | | |
| 40,451 | | |
| 39,509 | | |
| 42,439 | | |
| 32,458 | | |
| -24 | % | |
| -19 | % |
| Commercial non-perfoming ratio | |
| 1.73 | % | |
| 1.18 | % | |
| 1.14 | % | |
| 1.20 | % | |
| 0.72 | % | |
| | | |
| | |
| Consumer non-perfoming ratio | |
| 1.34 | % | |
| 1.43 | % | |
| 1.48 | % | |
| 1.35 | % | |
| 1.47 | % | |
| | | |
| | |
| | |
| | | |
| | | |
| | | |
| | | |
| | | |
| | | |
| | |
| Total non-performing/ Total portfolio | |
| 1.41 | % | |
| 1.37 | % | |
| 1.39 | % | |
| 1.29 | % | |
| 1.14 | % | |
| | | |
| | |
| Total allowances | |
| 57,979 | | |
| 59,079 | | |
| 52,915 | | |
| 85,266 | | |
| 72,285 | | |
| -15 | % | |
| 25 | % |
| Coverage ratio w/allowances | |
| 145.21 | % | |
| 146.05 | % | |
| 133.93 | % | |
| 200.91 | % | |
| 222.70 | % | |
| | | |
| | |
| Write Offs | |
| 1,776 | | |
| 5,515 | | |
| 2,301 | | |
| 2,552 | | |
| 1,831 | | |
| -28 | % | |
| 3 | % |
| Write Offs/ Total portfolio | |
| 0.06 | % | |
| 0.19 | % | |
| 0.08 | % | |
| 0.08 | % | |
| 0.06 | % | |
| | | |
| | |
Expected Credit Losses (E.C.L) (I.F.R.S.9)
The Bank records
an allowance for expected credit losses for all loans and other debt financial assets not held at fair value through profit or loss,
together with loan commitments and financial guarantee contracts, in this section all referred to as ‘financial instruments’.
Equity instruments are not subject to impairment under IFRS 9. The ECL allowance is based on the credit losses expected to arise over
the life of the asset (the lifetime expected credit loss), unless there has been no significant increase in credit risk since origination,
in which case, the allowance is based on the 12 months expected credit loss.(For further information please see our 2023 20-F)
| BANCO MACRO |
1Q24 EARNINGS
RELEASE |
In AR$ Million.
Figures of previous quarters have been restated to reflect the accumulated effect of the inflation adjustment for each period through
March 31, 2024
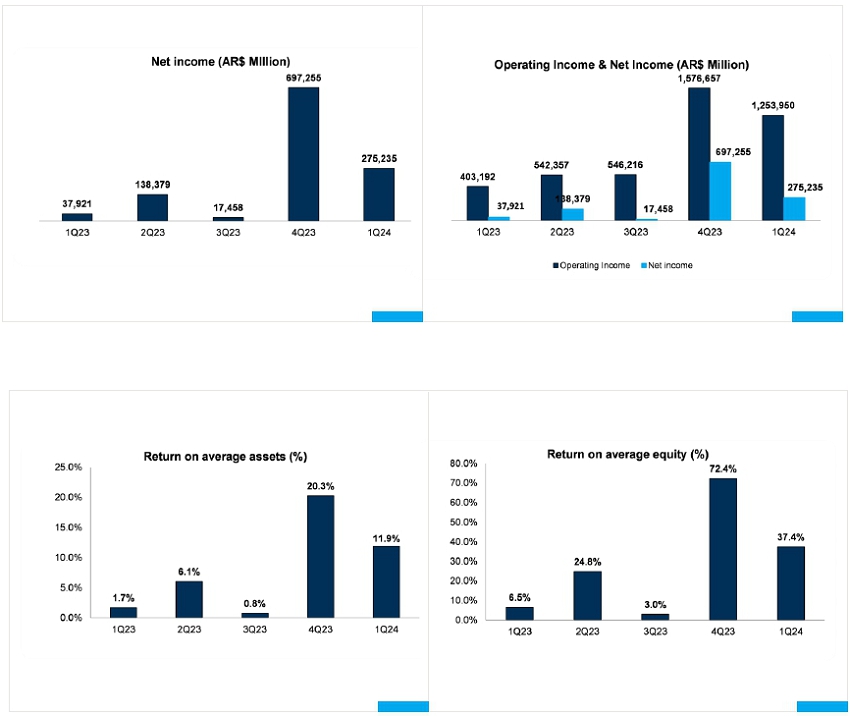
| BANCO MACRO |
1Q24 EARNINGS RELEASE |

| BANCO MACRO |
1Q24 EARNINGS RELEASE |
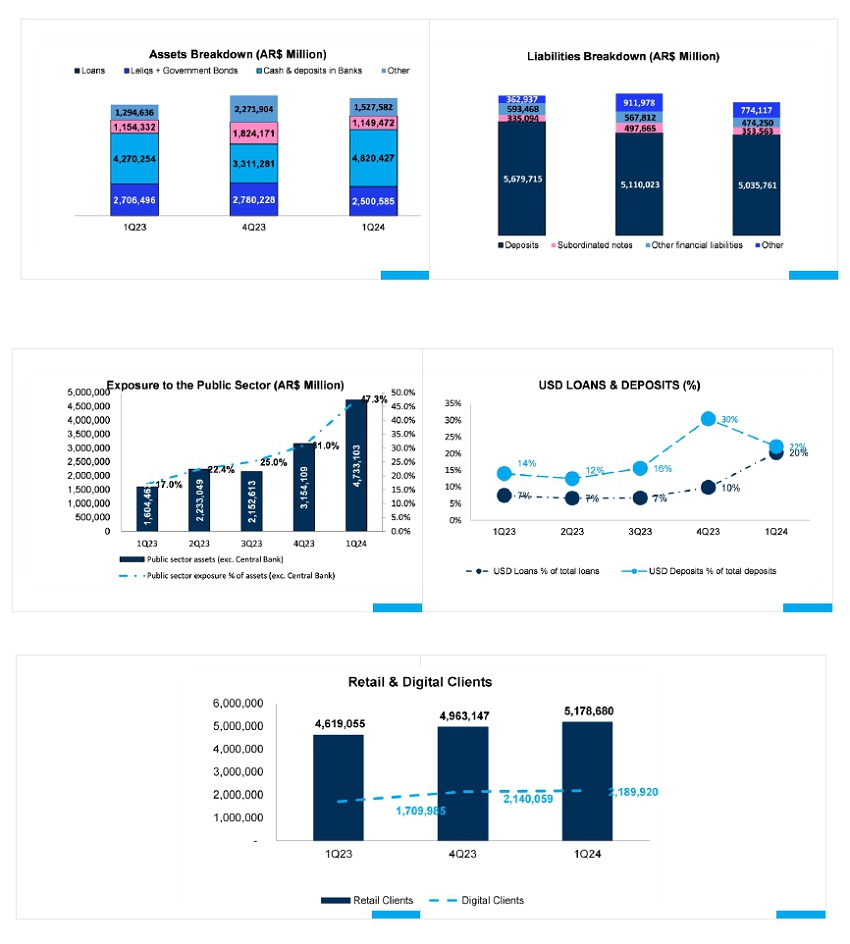
| BANCO MACRO |
1Q24 EARNINGS RELEASE |
| Relevant and
Recent Events |
.11 |
 |
·
Interest Payment Series F Dollar denominated Notes
On
April 30th, 2024 the Bank paid semiannual interest on Series F dollar denominated notes in the amount
of USD 1,321,370.
·
Interest Payment Series A Subordinated Notes
On
May 4th, 2024 the Bank paid semiannual interest on Series A subordinated notes in the amount of USD 13,286,000.
·
Principal and Interest Payment Series E Dollar denominated Notes
On
May 2nd, 2024 the Bank paid principal and interest on Class E dollar denominated notes in the amount
of USD 17,060,781 |
 |
·
Ordinary and Special Shareholders’ meeting. Dividend payment schedule
On April 12, 2024 the Shareholders’ Meeting held resolved to separate a portion of the Optional Reserve Fund for Future Profit
Distributions, in order to pay a cash or in kind dividend, in the latter case valued at market price, or in any combination of both options,
in the amount of Ps.294,130,167,680 (amount expressed in constant currency as of 31 December 2023), which expressed in constant
currency as of 29 February 2024 amounts to Ps.401,735,819,252 and represents AR$ 628.2880750164 per share, subject to prior authorization
from the Banco Central de la República Argentina (BCRA). The above stated amount is subject to a 7% tax withholding under section
97 of the Income Tax Law as revised in 2019.
On May 6, 2024 the Superintendencia de Entidades Financieras y Cambiarias of the Central Bank of the Republic of Argentina informed
us that it has decided to authorize Banco Macro S.A. to distribute profits for an aggregate amount of Ps.294,130,168,000, in cash or
in kind, as requested by the Bank, which distribution shall be carried out in the terms provided by the standard set by Distribution
of Results. Pursuant to Communication "A" 7984, such amount shall be paid in constant currency of the payment date/s, after
re-expression of the relevant payable amount by applying the most recently published rate before the date on which each of the above-mentioned
instalments is made available according to the payment schedule duly fixed by the Board.
On May 14, 2024 the Board of Banco Macro S.A. resolved to apply the amount of Ps.294,130,167,680 to the payment of a cash
dividend in 3 equal and consecutive monthly instalments. The amount of each one of such instalments shall be paid in constant currency,
using the most recently published consumer price index (CPI) as determined by Instituto Nacional de Estadísticas y Censos (INDEC)
to the date each instalment is made available to the shareholders. |
| BANCO MACRO |
1Q24 EARNINGS RELEASE |
| Year 2024 | |
Instalment
# | | |
Available on (date) | |
Amount (i) | |
| | 1 | | |
May 22nd | |
$ | 98,043,389,226.67 | |
| | 2 | | |
June 26th | |
$ | 98,043,389,226.67 | |
| | 3 | | |
July 22nd | |
$ | 98,043,389,226.67 | |
(i)
The amount shall be expressed in constant currency to the date of the resolution that determines the availability of such instalments.
Each time the Board resolves to make available a dividend instalment, it shall issue the relevant notice of payment, containing the following
information: i) the amount to be made available to the shareholders; ii) the amount per share; and iii) whether the dividend to be paid
is subject to any kind of tax withholding.
In addition, please be advised that pursuant to Communication “A” 7997 of the
Central Bank of the Republic of Argentina, in connection with the option to be granted to the non-resident shareholders to apply the
funds derived from the dividends received to the acquisition of BOPREALs, the Bank shall inform such possibility at the time of issuing
the relevant notice of payment of each dividend instalment.
The amount to be paid as dividend is subject to a 7% tax withholding under
section 97 of the Argentine Income Tax Law as revised in 2019 and, in the case of non-resident shareholders who choose to acquire BOPREALs,
an additional 17.5% tax withholding shall apply as Tax for an Inclusive and Solidarity-based Argentina (PAÍS) pursuant to Decree
No. 385/2024.
Simultaneously with this notice, we published the notice of payment of the first dividend installment.
On May 6,
2024 the Special Shareholders’ meeting approved the following: (i) the Preliminary Merger Agreement entered into on
March 6th 2024 by and between Banco Macro S.A. and Banco BMA S.A.U., pursuant to which the company named in the first place shall
absorb the second one, with retroactive effect to January 1st 2024; (ii) the special consolidated financial statements of merger
of Banco Macro S.A. and Banco BMA S.A.U. as of 31 December 2023, based on the information contained in the individual financial
statements of each company to the same date, as duly submitted to the Central Bank of the Republic of Argentina, the Argentine Securities
Exchange Commission (Comisión Nacional de Valores) and Bolsas y Mercados S.A.; and (iii) to omit reading the above mentioned
documents since they have been made available to the shareholders duly in advance and are copied on the relevant corporate books.
Pending
the authorizations by the Central Bank of the Republic of Argentina and the Argentine Securities Exchange Commission, the resolutions
adopted at the present Shareholders’ Meeting shall be subject to the granting of such authorizations.
| BANCO MACRO |
1Q24 EARNINGS RELEASE |
|
·
Floor on deposit rates
On
March 11, 2024, through Communication “A” 7978 the Central Bank of Argentina decided to remove floors on deposit
rates, therefore Banks can freely determine what they pay for time deposits.
·
Monetary Policy Rate
·
On April 25, 2024: The Central Bank of Argentina decided to cut the monetary policy rate by 10 percentage points. Repo
rate was cut from 70% to 60% APR.
·
On May 2, 2024. The Central Bank of Argentina decided to cut the monetary policy rate by 10 percentage points. Repo rate
was cut from 60% to 50% APR.
·
On May 14, 2024: The Central Bank of Argentina decided to cut the monetary policy rate by 10 percentage points. Repo
rate was cut from 50% to 40% APR.
|
|
·
Minimum Reserve Requirements
On
May 2, 2024, The Central Bank of Argentina through Communication “A” 8000 decided to increase reserve requirements
for securities guaranteed loans effective as of May 15.
·
Up to 29 days: 15%
·
More than 30 days: 10%
At
the same time the Central Bank of Argentina decided to increase reserve requirements for Money Market funds to 15%
|
| BANCO MACRO |
1Q24 EARNINGS RELEASE |
| CER
Exposure and Foreign Currency Position |
.13 |
| CER EXPOSURE | |
MACRO Consolidated | |
Change | |
| In MILLION $ (Measuring Unit Current at EOP) | |
1Q23 | |
2Q23 | |
3Q23 | |
4Q23 | |
1Q24 | |
QoQ | | |
YoY | |
| CER adjustable ASSETS | |
| |
| |
| |
| |
| |
| | |
| |
| | |
| |
| |
| |
| |
| |
| | |
| |
| Government Securities | |
134,691 | |
196,299 | |
137,943 | |
372,417 | |
4,467,255 | |
1100 | % | |
3217 | % |
| | |
| |
| |
| |
| |
| |
| | |
| |
| Loans (*) | |
204,857 | |
206,298 | |
188,513 | |
188,306 | |
202,407 | |
7 | % | |
-1 | % |
| Private sector loans | |
31,415 | |
29,944 | |
27,815 | |
29,549 | |
21,793 | |
-26 | % | |
-31 | % |
| Mortgage loans (UVA adjusted) | |
173,271 | |
176,174 | |
160,547 | |
158,663 | |
180,611 | |
14 | % | |
4 | % |
| Other loans | |
171 | |
180 | |
151 | |
94 | |
3 | |
-97 | % | |
-98 | % |
| Total CER adjustable assets | |
339,548 | |
402,597 | |
326,456 | |
560,723 | |
4,669,662 | |
733 | % | |
1275 | % |
| | |
| |
| |
| |
| |
| |
| |
| | |
| CER adjustable LIABILITIES | |
| |
| |
| |
| |
| |
| |
| | |
| Deposits (*) | |
32,592 | |
22,823 | |
11,159 | |
52,317 | |
37,918 | |
-28 | % |
| 16 | % |
| UVA Unemployment fund | |
21,579 | |
23,521 | |
22,822 | |
18,953 | |
19,122 | |
1 | % |
| -11 | % |
| Total CER adjustable liabilities | |
54,171 | |
46,344 | |
33,981 | |
71,270 | |
57,040 | |
-20 | % |
| 5 | % |
| | |
| |
| |
| |
| |
| |
| |
| | |
| NET CER EXPOSURE | |
285,377 | |
356,253 | |
292,475 | |
489,453 | |
4,612,622 | |
842 | % |
| 1516 | % |
(*) Includes Loans
&Time Deposits CER adjustable (UVAs)
| FOREIGN CURRENCY POSITION | |
MACRO Consolidated | |
Change | |
| In MILLION $ (Measuring Unit Current at EOP) | |
1Q23 | |
2Q23 | |
3Q23 | |
4Q23 | |
1Q24 | |
QoQ | |
|
YoY | |
| Cash and deposits in Banks | |
935,863 | |
866,679 | |
889,643 | |
1,698,725 | |
992,394 | |
-42 | % |
|
6 | % |
| Cash | |
32,532 | |
158,906 | |
166,824 | |
511,973 | |
252,960 | |
-51 | % |
|
678 | % |
| Central Bank of Argentina | |
589,073 | |
392,900 | |
442,144 | |
747,594 | |
381,503 | |
-49 | % |
|
-35 | % |
| Other financial institutions local and abroad | |
314,205 | |
314,419 | |
280,620 | |
439,074 | |
357,436 | |
-19 | % |
|
14 | % |
| Others | |
53 | |
453 | |
55 | |
85 | |
493 | |
480 | % |
|
830 | % |
| Financial instruments at fair value through P&L | |
1,078,843 | |
1,811,082 | |
1,861,087 | |
2,634,253 | |
122,006 | |
-95 | % |
|
-89 | % |
| Other financial assets | |
81,810 | |
82,584 | |
78,627 | |
120,057 | |
104,394 | |
-13 | % |
|
28 | % |
| Loans and other financing | |
201,808 | |
184,983 | |
179,199 | |
272,891 | |
507,160 | |
86 | % |
|
151 | % |
| Non financial private sector & foreign residents | |
201,808 | |
184,983 | |
179,199 | |
272,891 | |
507,160 | |
86 | % |
|
151 | % |
| Other debt securities | |
154,906 | |
324,339 | |
117,790 | |
134,407 | |
63,578 | |
-53 | % |
|
-59 | % |
| Guarantees received | |
22,765 | |
29,391 | |
33,859 | |
84,550 | |
24,429 | |
-71 | % |
|
7 | % |
| Investment in equity instruments | |
761 | |
562 | |
1,036 | |
520 | |
374 | |
-28 | % |
|
-51 | % |
| Total Assets | |
2,476,756 | |
3,299,619 | |
3,161,241 | |
4,945,404 | |
1,814,333 | |
-63 | % |
|
-27 | % |
| Deposits | |
793,962 | |
743,601 | |
728,433 | |
1,551,798 | |
1,112,353 | |
-28 | % |
|
40 | % |
| Non financial public sector | |
31,275 | |
30,615 | |
28,428 | |
52,057 | |
20,913 | |
-60 | % |
|
-33 | % |
| Financial sector | |
6,404 | |
7,069 | |
7,150 | |
10,774 | |
7,536 | |
-30 | % |
|
18 | % |
| Non financial private sector & foreign residents | |
756,282 | |
705,917 | |
692,855 | |
1,488,966 | |
1,083,903 | |
-27 | % |
|
43 | % |
| Financial liabiities at fair value through P&L | |
9,607 | |
4,502 | |
24,485 | |
20,951 | |
14,204 | |
-32 | % |
|
48 | % |
| Other liabilities from financial intermediation | |
80,988 | |
83,342 | |
90,368 | |
130,959 | |
146,918 | |
12 | % |
|
81 | % |
| Financing from the Central Bank and other fin. Inst | |
17,284 | |
10,929 | |
12,249 | |
23,310 | |
18,829 | |
-19 | % |
|
9 | % |
| Issued corporate bonds | |
12,747 | |
10,246 | |
12,675 | |
81,650 | |
58,645 | |
-28 | % |
|
360 | % |
| Subordinated corporate bonds | |
335,094 | |
326,821 | |
335,807 | |
497,665 | |
353,563 | |
-29 | % |
|
6 | % |
| Other non financial liabilities | |
513 | |
2,691 | |
2,797 | |
6,864 | |
4,240 | |
-38 | % |
|
727 | % |
| Total Liabilities | |
1,250,194 | |
1,182,132 | |
1,206,814 | |
2,313,196 | |
1,713,878 | |
-26 | % |
|
37 | % |
| | |
| |
| |
| |
| |
| |
| |
|
| |
| NET FX POSITION (Pesos) | |
1,226,562 | |
2,117,487 | |
1,954,427 | |
2,632,208 | |
100,455 | |
-96 | % |
|
-92 | % |
| EOP FX (Pesos per USD) | |
208.9883 | |
256.6750 | |
350.0083 | |
808.4833 | |
857.4167 | |
6 | % |
|
310 | % |
| NET FX POSITION (USD) | |
5,869 | |
8,250 | |
5,584 | |
3,256 | |
117 | |
-96 | % |
|
-98 | % |
| BANCO MACRO |
1Q24 EARNINGS RELEASE |
| QUARTERLY
BALANCE SHEET | |
MACRO
Consolidated | |
Change | |
| In MILLION $ (Measuring Unit Current at EOP) | |
1Q23 | |
2Q23 | |
3Q23 | |
4Q23 | |
1Q24 | |
QoQ | |
YoY | |
| ASSETS | |
| |
| |
| |
| |
| |
| |
| |
| Cash and deposits
in Banks | |
1,154,332 | |
1,039,322 | |
1,040,143 | |
1,824,171 | |
1,149,472 | |
-37 | % |
0 | % |
| Cash | |
136,492 | |
248,274 | |
249,587 | |
602,481 | |
340,204 | |
-44 | % |
149 | % |
| Central
Bank of Argentina | |
703,068 | |
476,148 | |
509,868 | |
782,287 | |
451,327 | |
-42 | % |
-36 | % |
| Other
local & foreign entities | |
314,719 | |
314,446 | |
280,633 | |
439,317 | |
357,446 | |
-19 | % |
14 | % |
| Other | |
53 | |
454 | |
55 | |
86 | |
495 | |
476 | % |
834 | % |
| Debt securities at fair value
through profit & loss | |
1,113,034 | |
1,838,452 | |
1,879,200 | |
2,656,588 | |
4,332,995 | |
63 | % |
289 | % |
| Derivatives | |
2 | |
828 | |
1,787 | |
19,928 | |
57,581 | |
-100 | % |
2878950 | % |
| Repo Transactions | |
151,727 | |
423,902 | |
365,746 | |
933,358 | |
279,193 | |
-70 | % |
84 | % |
| Other financial assets | |
319,949 | |
430,158 | |
434,602 | |
305,338 | |
228,231 | |
-25 | % |
-29 | % |
| Loans & other receivables | |
2,706,496 | |
2,798,773 | |
2,680,754 | |
2,780,228 | |
2,500,585 | |
-10 | % |
-8 | % |
| Non
Financial Public Sector | |
5,468 | |
58,171 | |
7,346 | |
7,152 | |
2,817 | |
-61 | % |
-48 | % |
| Financial
Sector | |
7,202 | |
6,607 | |
33,789 | |
15,109 | |
19,637 | |
30 | % |
173 | % |
| Non
Financial private sector and foreign | |
2,693,826 | |
2,733,995 | |
2,639,619 | |
2,757,967 | |
2,478,131 | |
-10 | % |
-8 | % |
| Other debt securities | |
3,157,220 | |
2,627,645 | |
1,403,986 | |
654,693 | |
487,432 | |
-26 | % |
-85 | % |
| Financial assets in guarantee | |
145,445 | |
133,831 | |
135,253 | |
201,494 | |
170,195 | |
-16 | % |
17 | % |
| Income tax assets | |
0 | |
0 | |
0 | |
1,331 | |
1,033 | |
| |
| |
| Investments in equity instruments | |
4,161 | |
4,439 | |
5,521 | |
4,873 | |
3,318 | |
-32 | % |
-20 | % |
| Investments in other companies
(subsidiaries and joint ventures) | |
5,786 | |
3,507 | |
3,342 | |
2,555 | |
2,163 | |
-15 | % |
-63 | % |
| Property, plant and equipment | |
482,610 | |
482,098 | |
483,998 | |
540,968 | |
542,983 | |
0 | % |
13 | % |
| Intangible assets | |
84,588 | |
84,626 | |
83,124 | |
113,975 | |
110,471 | |
-3 | % |
31 | % |
| Deferred income tax assets | |
345 | |
486 | |
849 | |
1,509 | |
1,263 | |
-16 | % |
266 | % |
| Other non financial assets | |
59,179 | |
56,913 | |
61,236 | |
83,062 | |
67,602 | |
-19 | % |
14 | % |
| Non-current
assets held for sale | |
40,844 | |
40,844 | |
39,211 | |
63,513 | |
63,549 | |
0 | % |
56 | % |
| TOTAL
ASSETS | |
9,425,718 | |
9,965,824 | |
8,618,752 | |
10,187,584 | |
9,998,066 | |
-2 | % |
6 | % |
| | |
| |
| |
| |
| |
| |
| |
| |
| LIABILITIES | |
| |
| |
| |
| |
| |
| |
| |
| Deposits | |
5,679,715 | |
5,962,434 | |
4,669,667 | |
5,110,023 | |
5,035,761 | |
-1 | % |
-11 | % |
| Non
Financial Public Sector | |
430,767 | |
415,060 | |
413,026 | |
283,686 | |
517,846 | |
83 | % |
20 | % |
| Financial
Sector | |
7,412 | |
9,214 | |
8,024 | |
30,606 | |
13,371 | |
-56 | % |
80 | % |
| Non
Financial private sector and foreign | |
5,241,536 | |
5,538,160 | |
4,248,617 | |
4,795,731 | |
4,504,544 | |
-6 | % |
-14 | % |
| Liabilities at fair value through
profit & loss | |
9,607 | |
4,502 | |
24,485 | |
20,962 | |
19,867 | |
-5 | % |
107 | % |
| Derivatives | |
389 | |
35 | |
92 | |
4,303 | |
5,950 | |
38 | % |
1430 | % |
| Repo Transactions | |
17,402 | |
22,840 | |
90,167 | |
35,785 | |
20,857 | |
- | |
-86 | % |
| Other financial liabilities | |
593,468 | |
737,331 | |
746,104 | |
567,812 | |
474,250 | |
-16 | % |
-20 | % |
| Financing received from Central
Bank and Other Financial Institutions | |
17,482 | |
12,349 | |
12,799 | |
30,020 | |
19,743 | |
-34 | % |
13 | % |
| Issued Corporate Bonds | |
12,747 | |
10,246 | |
12,675 | |
89,251 | |
67,179 | |
-25 | % |
427 | % |
| Current income tax liabilities | |
44,155 | |
71,109 | |
58,187 | |
324,295 | |
319,764 | |
-1 | % |
624 | % |
| Subordinated corporate bonds | |
335,094 | |
326,821 | |
335,807 | |
497,665 | |
353,563 | |
-29 | % |
6 | % |
| Provisions | |
12,280 | |
11,374 | |
9,157 | |
13,257 | |
11,757 | |
-11 | % |
-4 | % |
| Deferred income tax liabilities | |
64,198 | |
61,947 | |
58,658 | |
69,354 | |
59,921 | |
-14 | % |
-7 | % |
| Other non
financial liabilities | |
184,677 | |
416,827 | |
258,780 | |
324,751 | |
249,079 | |
-23 | % |
35 | % |
| TOTAL
LIABILITIES | |
6,971,214 | |
7,637,815 | |
6,276,578 | |
7,087,478 | |
6,637,691 | |
-6 | % |
-5 | % |
| | |
| |
| |
| |
| |
| |
| |
| |
| SHAREHOLDERS' EQUITY | |
| |
| |
| |
| |
| |
| |
| |
| Capital Stock | |
639 | |
639 | |
639 | |
639 | |
639 | |
0 | % |
0 | % |
| Issued Shares premium | |
12,430 | |
12,430 | |
12,430 | |
12,430 | |
12,430 | |
0 | % |
0 | % |
| Adjustment to Shareholders' Equity | |
866,849 | |
866,849 | |
866,849 | |
866,849 | |
866,849 | |
0 | % |
0 | % |
| Reserves | |
1,335,485 | |
1,267,024 | |
1,267,024 | |
1,267,024 | |
1,267,024 | |
0 | % |
-5 | % |
| Retained earnings | |
203,857 | |
925 | |
925 | |
925 | |
891,406 | |
96268 | % |
337 | % |
| Other accumulated comprehensive
income | |
-3,077 | |
3,668 | |
375 | |
61,051 | |
46,345 | |
-24 | % |
- | |
| Net income
for the period / fiscal year | |
37,869 | |
176,152 | |
193,548 | |
890,482 | |
275,420 | |
-69 | % |
627 | % |
| Shareholders'
Equity attributable to parent company | |
2,454,052 | |
2,327,687 | |
2,341,790 | |
3,099,400 | |
3,360,113 | |
8 | % |
37 | % |
| | |
| |
| |
| |
| |
| |
| |
| |
| Shareholders'
Equity attributable to non controlling interest | |
452 | |
322 | |
384 | |
706 | |
262 | |
-63 | % |
-42 | % |
| TOTAL
SHAREHOLDERS' EQUITY | |
2,454,504 | |
2,328,009 | |
2,342,174 | |
3,100,106 | |
3,360,375 | |
8 | % |
37 | % |
| BANCO MACRO |
1Q24 EARNINGS RELEASE |
| INCOME STATEMENT | |
MACRO
Consolidated | |
Change | |
| In MILLION
$ (Measuring Unit Current at EOP) | |
1Q23 | |
2Q23 | |
3Q23 | |
4Q23 | |
1Q24 | |
QoQ | |
YoY | |
| Interest Income | |
886,738 | |
962,370 | |
997,374 | |
869,236 | |
714,764 | |
-18 | % |
-19 | % |
| Interest Expense | |
507,937 | |
624,131 | |
735,456 | |
590,720 | |
547,249 | |
-7 | % |
8 | % |
| Net Interest Income | |
378,801 | |
338,239 | |
261,918 | |
278,516 | |
167,515 | |
-40 | % |
-56 | % |
| Fee income | |
94,223 | |
91,480 | |
91,645 | |
95,206 | |
84,191 | |
-12 | % |
-11 | % |
| Fee expense | |
8,768 | |
8,945 | |
9,157 | |
10,950 | |
10,130 | |
-7 | % |
16 | % |
| Net Fee Income | |
85,455 | |
82,535 | |
82,488 | |
84,256 | |
74,061 | |
-12 | % |
-13 | % |
| Subtotal (Net Interest Income
+ Net Fee Income) | |
464,256 | |
420,774 | |
344,406 | |
362,772 | |
241,576 | |
-33 | % |
-48 | % |
| Net Income from financial
instruments at Fair Value Through Profit & Loss | |
35,664 | |
162,583 | |
-84,503 | |
1,357,364 | |
1,272,438 | |
- | |
3468 | % |
| Result from assets at amortised
cost | |
- | |
- | |
319 | |
200 | |
21 | |
- | |
- | |
| Difference in quoted prices of
gold and foreign currency | |
142,244 | |
237,601 | |
553,341 | |
277,087 | |
80,592 | |
-71 | % |
-43 | % |
| Other operating income | |
22,170 | |
23,975 | |
26,223 | |
38,150 | |
44,350 | |
16 | % |
100 | % |
| Provision for loan losses | |
13,492 | |
17,296 | |
11,305 | |
27,569 | |
18,857 | |
-32 | % |
40 | % |
| Net Operating Income | |
650,842 | |
827,637 | |
828,481 | |
2,008,004 | |
1,620,120 | |
-19 | % |
149 | % |
| Personnel expenses | |
91,026 | |
96,158 | |
100,219 | |
134,878 | |
133,392 | |
-1 | % |
47 | % |
| Administrative expenses | |
45,189 | |
53,873 | |
53,635 | |
96,306 | |
68,910 | |
-28 | % |
52 | % |
| Depreciation and impairment of
assets | |
18,981 | |
19,364 | |
19,185 | |
30,560 | |
24,284 | |
-21 | % |
28 | % |
| Other operating expenses | |
92,454 | |
115,885 | |
109,226 | |
169,603 | |
139,584 | |
-18 | % |
51 | % |
| Operating Income | |
403,192 | |
542,357 | |
546,216 | |
1,576,657 | |
1,253,950 | |
-20 | % |
211 | % |
| Income from associates and joint
ventures | |
-851 | |
-597 | |
-165 | |
237,238 | |
-214 | |
- | |
- | |
| Result from net monetary position | |
-342,825 | |
-342,898 | |
-501,839 | |
-797,250 | |
-888,994 | |
- | |
- | |
| Net Income before income
tax on cont. operations | |
59,516 | |
198,862 | |
44,212 | |
1,016,645 | |
364,742 | |
-64 | % |
513 | % |
| Income tax on continuing operations | |
21,595 | |
60,483 | |
26,754 | |
319,390 | |
89,507 | |
-72 | % |
314 | % |
| Net Income from continuing
operations | |
37,921 | |
138,379 | |
17,458 | |
697,255 | |
275,235 | |
-61 | % |
626 | % |
| | |
| |
| |
| |
| |
| |
| |
| |
| Net Income for the period | |
37,921 | |
138,379 | |
17,458 | |
697,255 | |
275,235 | |
-61 | % |
626 | % |
| Net Income of the period
attributable to parent company | |
37,869 | |
138,284 | |
17,396 | |
696,933 | |
275,419 | |
-60 | % |
627 | % |
| Net income of the period
attributable to non-controlling interests | |
52 | |
95 | |
62 | |
322 | |
-184 | |
- | |
- | |
| | |
| |
| |
| |
| |
| |
| |
| |
| Other Comprehensive Income | |
-3,224 | |
6,744 | |
-3,294 | |
60,678 | |
-14,706 | |
- | |
- | |
| Foreign currency translation
differences in financial statements conversion | |
-822 | |
-192 | |
298 | |
15,513 | |
-14,063 | |
- | |
- | |
| Profits or losses from financial
assets measured at fair value through other comprehensive income (FVOCI) (IFRS 9(4.1.2)(a) | |
-2,402 | |
6,936 | |
-3,592 | |
45,165 | |
-643 | |
- | |
- | |
| | |
| |
| |
| |
| |
| |
| |
| |
| TOTAL COMPREHENSIVE INCOME
FOR THE PERIOD | |
34,697 | |
145,123 | |
14,164 | |
757,933 | |
260,529 | |
-66 | % |
651 | % |
| Total Comprehensive Income
attributable to parent Company | |
34,645 | |
145,028 | |
14,102 | |
757,611 | |
260,713 | |
-66 | % |
653 | % |
| Total Comprehensive Income
attributable to non-controlling interests | |
52 | |
95 | |
62 | |
322 | |
-184 | |
- | |
- | |
| BANCO MACRO |
1Q24 EARNINGS RELEASE |
| QUARTERLY ANNUALIZED RATIOS | |
MACRO Consolidated | |
| | |
1Q23 | | |
2Q23 | | |
3Q23 | | |
4Q23 | | |
1Q24 | |
| Profitability & performance | |
| | |
| | |
| | |
| | |
| |
| Net interest margin | |
33.6 | % | |
38.3 | % | |
58.7 | % | |
52.1 | % | |
26.0 | % |
| Net interest margin adjusted (exc. FX) | |
24.4 | % | |
22.5 | % | |
18.8 | % | |
26.1 | % | |
17.6 | % |
| Net fee income ratio | |
8.4 | % | |
5.2 | % | |
5.5 | % | |
0.7 | % | |
1.5 | % |
| Efficiency ratio | |
25.5 | % | |
21.7 | % | |
22.4 | % | |
13.6 | % | |
14.7 | % |
| Net fee income as % of A&G Expenses | |
32.9 | % | |
23.9 | % | |
24.6 | % | |
5.4 | % | |
10.6 | % |
| Return on average assets | |
1.7 | % | |
6.1 | % | |
0.8 | % | |
32.1 | % | |
11.9 | % |
| Return on average equity | |
6.5 | % | |
24.8 | % | |
3.0 | % | |
106.3 | % | |
37.4 | % |
| Liquidity | |
| | |
| | |
| | |
| | |
| |
| Loans as a percentage of total deposits | |
47.7 | % | |
46.9 | % | |
57.4 | % | |
54.4 | % | |
49.7 | % |
| Liquid assets as a percentage of total deposits | |
97.0 | % | |
95.0 | % | |
99.0 | % | |
118.0 | % | |
124.0 | % |
| Capital | |
| | |
| | |
| | |
| | |
| |
| Total equity as a percentage of total assets | |
26.0 | % | |
23.4 | % | |
27.2 | % | |
30.4 | % | |
33.6 | % |
| Regulatory capital as % of APR | |
42.4 | % | |
36.0 | % | |
37.9 | % | |
35.4 | % | |
46.6 | % |
| Asset Quality | |
| | |
| | |
| | |
| | |
| |
| Allowances over total loans | |
2.1 | % | |
2.1 | % | |
2.0 | % | |
3.1 | % | |
2.9 | % |
| Non-performing financing as a percentage of total financing | |
1.4 | % | |
1.4 | % | |
1.4 | % | |
1.3 | % | |
1.1 | % |
| Coverage ratio w/allowances | |
145.2 | % | |
146.1 | % | |
133.9 | % | |
200.9 | % | |
222.7 | % |
| Cost of Risk | |
2.1 | % | |
2.7 | % | |
1.7 | % | |
3.9 | % | |
3.3 | % |
| ACCUMULATED ANNUALIZED RATIOS | |
MACRO Consolidated | |
| | |
1Q23 | | |
2Q23 | | |
3Q23 | | |
4Q23 | | |
1Q24 | |
| Profitability & performance | |
| | |
| | |
| | |
| | |
| |
| Net interest margin | |
33.6 | % | |
35.9 | % | |
43.0 | % | |
44.8 | % | |
26.0 | % |
| Net interest margin adjusted (exc. FX) | |
24.4 | % | |
23.5 | % | |
22.0 | % | |
22.8 | % | |
17.6 | % |
| Net fee income ratio | |
8.4 | % | |
6.6 | % | |
6.2 | % | |
3.6 | % | |
1.5 | % |
| Efficiency ratio | |
25.5 | % | |
23.4 | % | |
23.0 | % | |
18.6 | % | |
14.7 | % |
| Net fee income as % of A&G Expenses | |
32.9 | % | |
28.2 | % | |
26.9 | % | |
19.5 | % | |
10.6 | % |
| Return on average assets | |
1.7 | % | |
3.9 | % | |
2.8 | % | |
9.9 | % | |
11.9 | % |
| Return on average equity | |
6.5 | % | |
15.5 | % | |
11.3 | % | |
37.5 | % | |
37.4 | % |
| Liquidity | |
| | |
| | |
| | |
| | |
| |
| Loans as a percentage of total deposits | |
47.7 | % | |
46.9 | % | |
57.4 | % | |
54.4 | % | |
49.7 | % |
| Liquid assets as a percentage of total deposits | |
97.0 | % | |
95.0 | % | |
99.0 | % | |
118.0 | % | |
124.0 | % |
| Capital | |
| | |
| | |
| | |
| | |
| |
| Total equity as a percentage of total assets | |
26.0 | % | |
23.4 | % | |
27.2 | % | |
30.4 | % | |
33.6 | % |
| Regulatory capital as % of APR | |
42.4 | % | |
36.0 | % | |
37.9 | % | |
35.4 | % | |
46.6 | % |
| Asset Quality | |
| | |
| | |
| | |
| | |
| |
| Allowances over total loans | |
2.1 | % | |
2.1 | % | |
2.0 | % | |
3.1 | % | |
2.9 | % |
| Non-performing financing as a percentage of total financing | |
1.4 | % | |
1.4 | % | |
1.4 | % | |
1.3 | % | |
1.1 | % |
| Coverage ratio w/allowances | |
145.2 | % | |
146.1 | % | |
133.9 | % | |
200.9 | % | |
222.7 | % |
| Cost of Risk | |
2.1 | % | |
2.4 | % | |
2.1 | % | |
2.6 | % | |
3.3 | % |

SIGNATURE
Pursuant to the requirements of the Securities Exchange Act of 1934,
the Registrant has duly caused this report to be signed on its behalf by the undersigned, thereto duly authorized.
Date: May 22, 2024
| |
MACRO BANK INC. |
| |
|
|
| |
By: |
/s/ Jorge
Francisco Scarinci |
| |
Name: Jorge Francisco Scarinci |
| |
Title: Chief Financial Officer |
Banco Macro (NYSE:BMA)
Graphique Historique de l'Action
De Mai 2024 à Juin 2024

Banco Macro (NYSE:BMA)
Graphique Historique de l'Action
De Juin 2023 à Juin 2024
