false
0001842022
0001842022
2024-02-16
2024-02-16
iso4217:USD
xbrli:shares
iso4217:USD
xbrli:shares
UNITED STATES
SECURITIES AND EXCHANGE COMMISSION
Washington, D.C. 20549
FORM 8-K
CURRENT REPORT
Pursuant to Section 13 or 15(d) of the Securities
Exchange Act of 1934
Date of Report (Date of earliest event reported):
February 16, 2024

Commission File Number: 1-40392
DT Midstream, Inc.
| Delaware |
38-2663964 |
(State or other jurisdiction of
incorporation or organization) |
(I.R.S Employer
Identification No.) |
Registrant's address of principal executive offices:
500 Woodward Ave., Suite 2900, Detroit, Michigan 48226-1279
Registrant’s telephone number, including
area code: (313) 402-8532
Check the appropriate box below if the Form 8-K filing is intended
to simultaneously satisfy the filing obligation of the registrant under any of the following provisions:
| ☐ |
Written communications pursuant to Rule 425 under the Securities Act (17 CFR 230.425) |
| ☐ |
Soliciting material pursuant to Rule 14a-12 under the Exchange Act (17 CFR 240.14a-12) |
| ☐ |
Pre-commencement communications pursuant to Rule 14d-2(b) under the Exchange Act (17 CFR 240.14d-2(b)) |
| ☐ |
Pre-commencement communications pursuant to Rule 13e-4(c) under the Exchange Act (17 CFR 240.13e-4(c)) |
Securities registered pursuant to Section 12(b) of the Act:
| Title of Each Class |
|
Trading Symbol(s) |
|
Name of Exchange on which Registered |
| Common stock, par value $0.01 |
|
DTM |
|
New York Stock Exchange |
Indicate by check mark whether the registrant is an emerging growth
company as defined in Rule 405 under the Securities Act (17 CFR 230.405) or Rule 12b-2 under Exchange Act (17 CFR 240.12b-2).
Emerging growth company ☐
If an emerging growth company, indicate by check mark if the registrant
has elected not to use the extended transition period for complying with any new or revised financial accounting standards provided pursuant
to Section 13(a) of the Exchange Act. ☐
| Item 2.02. | Results of Operations and Financial Condition. |
DT Midstream, Inc. (“DT Midstream”) is furnishing
the Securities and Exchange Commission with its earnings release issued February 16, 2024, announcing financial results for the year ended
December 31, 2023. A copy of the earnings release, including supplemental financial information, is furnished as Exhibit 99.1 and incorporated
by reference.
| Item 7.01. | Regulation FD Disclosure. |
In DT Midstream’s earnings
release issued on February 16, 2024, DT Midstream also announced that its Board of Directors has declared a quarterly cash dividend of
$0.735 per share of common stock. The dividend is payable to DT Midstream’s stockholders of record as of March 18, 2024, and is
expected to be paid on April 15, 2024.
DT Midstream is furnishing
the SEC with its slide presentation issued February 16, 2024. A copy of the slide presentation is furnished as Exhibit 99.2 and incorporated
herein by reference.
In accordance with General
Instruction B.2 of Form 8-K, the information in this Current Report on Form 8-K, including Exhibits 99.1 and 99.2, shall not be deemed
"filed" for the purposes of Section 18 of the Securities Exchange Act of 1934, as amended, or otherwise subject to the liabilities
of that section, nor shall they be deemed incorporated by reference in any filing under the Securities Act of 1933, as amended, except
as shall be expressly set forth in such a filing.
| Item 9.01 | Financial Statements and Exhibits. |
Forward-Looking Statements:
This Current Report on Form 8-K contains forward-looking
statements that are subject to various assumptions, risks and uncertainties. It should be read in conjunction with the “Forward-Looking Statements” section in DT Midstream’s Form 10-K (which section is incorporated by reference
herein), and in conjunction with other SEC reports filed by DT Midstream that discuss important factors that could cause DT Midstream’s
actual results to differ materially. DT Midstream expressly disclaims any current intention to update any forward-looking statements contained
in this report as a result of new information or future events or developments.
SIGNATURE
Pursuant to the requirements of the Securities
Exchange Act of 1934, the registrant has duly caused this report to be signed on its behalf by the undersigned hereunto duly authorized.
Date: February 16, 2024
| |
DT MIDSTREAM, INC.
(Registrant) |
| |
by |
| |
|
/s/ Jeffrey Jewell |
| |
|
Name: Jeffrey Jewell |
| |
|
Title: Chief Financial Officer |
Exhibit
99.1

DT Midstream Reports Strong Fourth Quarter 2023 Results; Raises
Dividend and 2024 Adjusted EBITDA Guidance
| • | Full year 2023 Adjusted EBITDA of
$924 million represents a 10% increase over the prior year |
| • | Increased dividend by 7% |
| • | Increased 2024 Adjusted EBITDA guidance |
| • | Provided 2025 Adjusted EBITDA early outlook |
DETROIT, Feb. 16, 2024 – DT Midstream, Inc. (NYSE: DTM)
today announced fourth quarter 2023 reported net income of $121 million, or $1.24 per diluted share. For the fourth quarter of 2023, Operating
Earnings were $121 million, or $1.24 per diluted share. Adjusted EBITDA for the quarter was $239 million.
Reconciliations of Operating Earnings and Adjusted EBITDA (non-GAAP
measures) to reported net income are included at the end of this news release.
“As a result of a great team effort, we delivered excellent
results in 2023, exceeding our guidance. I want to thank each employee for their contribution,” said David Slater, President and
CEO. “We successfully executed on the largest construction program in our history last year, completing key expansions ahead of
schedule and on budget. These projects will deliver strong growth over the next two years.”
Slater noted the following significant business updates:
| • | Increased 2024 Adjusted EBITDA guidance range to $930 to $980 million |
| • | Provided 2025 Adjusted EBITDA early outlook range of $980 million to $1.04
billion, representing 6% annual growth from 2024 |
| • | Increased dividend by 7% from fourth quarter 2023 to $0.735 per share, to
be paid on April 15, 2024 to stockholders of record on March 18, 2024 |
“Our strong financial results for 2023, combined with
our strong organic backlog, advantaged asset positions, and flexible balance sheet give us high confidence in meeting our goals for this
year and beyond,” said Jeff Jewell, Executive Vice President and CFO.
The company has scheduled a conference call to discuss results
for 8:30 a.m. ET (7:30 a.m. CT) today. Investors, the news media and the public may listen to a live internet broadcast of the call at
this link. The participant toll-free telephone dial-in number in the U.S. and Canada is 888.330.2022,
and the toll number is 646.960.0690; the passcode is 8347152. International access numbers are available here.
The webcast will be archived on the DT Midstream website at investor.dtmidstream.com.
# # #
About DT Midstream
DT Midstream (NYSE: DTM) is an owner, operator and developer of natural
gas interstate and intrastate pipelines, storage and gathering systems, compression, treatment and surface facilities. The company transports
clean natural gas for utilities, power plants, marketers, large industrial customers and energy producers across the Southern, Northeastern
and Midwestern United States and Canada. The Detroit-based company offers a comprehensive, wellhead-to-market array of services, including
natural gas transportation, storage and gathering. DT Midstream is transitioning towards net zero greenhouse gas emissions by 2050, including
a plan of achieving 30% of its carbon emissions reduction by 2030. For more information, please visit the DT Midstream website at www.dtmidstream.com.
Why DT Midstream Uses Operating Earnings, Adjusted EBITDA
and Distributable Cash Flow
Use of Operating Earnings Information – Operating Earnings exclude
non-recurring items, certain mark-to-market adjustments and discontinued operations. DT Midstream management believes that Operating Earnings
provide a more meaningful representation of the company’s earnings from ongoing operations and uses Operating Earnings as the primary
performance measurement for external communications with analysts and investors. Internally, DT Midstream uses Operating Earnings to measure
performance against budget and to report to the Board of Directors.
Adjusted EBITDA is defined as GAAP net income attributable to
DT Midstream before expenses for interest, taxes, depreciation and amortization, and loss from financing activities, further adjusted
to include the proportional share of net income from equity method investees (excluding interest, taxes, depreciation and amortization),
and to exclude certain items the company considers non-routine. DT Midstream believes Adjusted EBITDA is useful to the company and external
users of DT Midstream’s financial statements in understanding operating results and the ongoing performance of the underlying business
because it allows management and investors to have a better understanding of actual operating performance unaffected by the impact of
interest, taxes, depreciation, amortization and non-routine charges noted in the table below. We believe the presentation of Adjusted
EBITDA is meaningful to investors because it is frequently used by analysts, investors and other interested parties in the midstream
industry to evaluate a company’s operating performance without regard to items excluded from the calculation of such measure, which
can vary substantially from company to company depending on accounting methods, book value of assets, capital structure and the method
by which assets were acquired, among other factors. DT Midstream uses Adjusted EBITDA to assess the company’s performance by reportable
segment and as a basis for strategic planning and forecasting.
Distributable Cash Flow (DCF) is calculated by deducting earnings from
equity method investees, depreciation and amortization attributable to noncontrolling interests, cash interest expense, maintenance capital
investment (as defined below), and cash taxes from, and adding interest expense, income tax expense, depreciation and amortization, certain
items we consider non-routine and dividends and distributions from equity method investees to, Net Income Attributable to DT Midstream.
Maintenance capital investment is defined as the total capital expenditures used to maintain or preserve assets or fulfill contractual
obligations that do not generate incremental earnings. We believe DCF is a meaningful performance measurement because it is useful to
us and external users of our financial statements in estimating the ability of our assets to generate cash earnings after servicing our
debt, paying cash taxes and making maintenance capital investments, which could be used for discretionary purposes such as common stock
dividends, retirement of debt or expansion capital expenditures.
In this release, DT Midstream provides 2024 and 2025 Adjusted EBITDA
guidance. The reconciliation of net income to Adjusted EBITDA as projected for full-year 2024 and 2025 is not provided. DT Midstream does
not forecast net income as it cannot, without unreasonable efforts, estimate or predict with certainty the components of net income. These
components, net of tax, may include, but are not limited to, impairments of assets and other charges, divestiture costs, acquisition costs,
or changes in accounting principles. All of these components could significantly impact such financial measures. At this time, DT Midstream
is not able to estimate the aggregate impact, if any, of these items on future period reported earnings. Accordingly, DT Midstream is
not able to provide a corresponding GAAP equivalent for Adjusted EBITDA.
Forward-looking Statements
This release contains statements which, to the extent they are not
statements of historical or present fact, constitute “forward-looking statements” under the securities laws. These forward-looking
statements are intended to provide management’s current expectations or plans for our future operating and financial performance,
business prospects, outcomes of regulatory proceedings, market conditions, and other matters, based on what we believe to be reasonable
assumptions and on information currently available to us.
Forward-looking statements can be identified by the use of words such
as “believe,” “expect,” “expectations,” “plans,” “strategy,” “prospects,”
“estimate,” “project,” “target,” “anticipate,” “will,” “should,”
“see,” “guidance,” “outlook,” “confident” and other words of similar meaning. The absence
of such words, expressions or statements, however, does not mean that the statements are not forward-looking. In particular, express or
implied statements relating to future earnings, cash flow, results of operations, uses of cash, tax rates and other measures of financial
performance, future actions, conditions or events, potential future plans, strategies or transactions of DT Midstream, and other statements
that are not historical facts, are forward-looking statements.
Forward-looking statements are not guarantees of future results and
conditions, but rather are subject to numerous assumptions, risks, and uncertainties that may cause actual future results to be materially
different from those contemplated, projected, estimated, or budgeted. Many factors may impact forward-looking statements of DT Midstream
including, but not limited to, the following: changes in general economic conditions, including increases in interest rates and associated
Federal Reserve policies, a potential economic recession, and the impact of inflation on our business; industry changes, including the
impact of consolidations, alternative energy sources, technological advances, infrastructure constraints and changes in competition; global
supply chain disruptions; actions taken by third-party operators, processors, transporters and gatherers; changes in expected production
from Southwestern Energy and other third parties in our areas of operation; demand for natural gas gathering, transmission, storage, transportation
and water services; the availability and price of natural gas to the consumer compared to the price of alternative and competing fuels;
our ability to successfully and timely implement our business plan; our ability to complete organic growth projects on time and on budget;
our ability to finance, complete, or successfully integrate acquisitions; the price and availability of debt and equity financing; restrictions
in our existing and any future credit facilities and indentures;
the effectiveness of the Company’s information technology
and operational technology systems and practices to detect and defend against evolving cyber attacks on United States critical
infrastructure; changing laws regarding cybersecurity and data privacy, and any cybersecurity threat or event; operating hazards,
environmental risks, and other risks incidental to gathering, storing and transporting natural gas; geologic and reservoir risks and
considerations; natural disasters, adverse weather conditions, casualty losses and other matters beyond our control; the impact of
outbreaks of illnesses, epidemics and pandemics, and any related economic effects; the impacts of geopolitical events, including the
conflicts in Ukraine and the Middle East; labor relations and markets, including the ability to attract, hire and retain key
employee and contract personnel; large customer defaults; changes in tax status, as well as changes in tax rates and regulations;
the effects and associated cost of compliance with existing and future laws and governmental regulations, such as the Inflation
Reduction Act; changes in environmental laws, regulations or enforcement policies, including laws and regulations relating to
climate change and greenhouse gas emissions; ability to develop low carbon business opportunities and deploy greenhouse gas reducing
technologies; changes in insurance markets impacting costs and the level and types of coverage available; the timing and extent of
changes in commodity prices; the success of our risk management strategies; the suspension, reduction or termination of our
customers’ obligations under our commercial agreements; disruptions due to equipment interruption or failure at our
facilities, or third-party facilities on which our business is dependent; the effects of future litigation; and the risks described
in our Annual Report on Form 10-K for the year ended December 31, 2023 and our reports and registration statements filed from time
to time with the SEC.
The above list of factors is not exhaustive. New factors emerge from
time to time. We cannot predict what factors may arise or how such factors may cause actual results to vary materially from those stated
in forward-looking statements, see the discussion under the section entitled “Risk Factors” in our Annual Report for the year
ended December 31, 2023, filed with the SEC on Form 10-K and any other reports filed with the SEC. Given the uncertainties and risk factors
that could cause our actual results to differ materially from those contained in any forward-looking statement, you should not put undue
reliance on any forward-looking statements.
Any forward-looking statements speak only as of the date on which such
statements are made. We are under no obligation to, and expressly disclaim any obligation to, update or alter our forward-looking statements,
whether as a result of new information, subsequent events or otherwise.
Investor Relations
Todd Lohrmann, DT Midstream, 313.774.2424
investor_relations@dtmidstream.com
|
DT Midstream, Inc.
Reconciliation of Reported to Operating Earnings (non-GAAP, unaudited)
|
| |
|
|
|
|
|
|
|
|
|
|
|
|
|
|
|
|
| |
|
Three Months Ended |
| |
|
December 31, |
|
September 30, |
| |
|
2023 |
|
2023 |
| |
|
Reported Earnings |
|
Pre-tax Adjustments |
|
Income Taxes (1) |
|
Operating Earnings |
|
Reported Earnings |
|
Pre-tax Adjustments |
|
Income Taxes (1) |
|
Operating Earnings |
| |
|
(millions) |
| |
Adjustments |
|
|
$ — |
|
$ — |
|
|
|
|
|
$ — |
|
$ — |
|
|
| |
Net Income Attributable to DT Midstream |
$ 121 |
|
$ — |
|
$ — |
|
$ 121 |
|
$ 91 |
|
$ — |
|
$ — |
|
$ 91 |
| |
|
|
|
|
|
|
|
|
|
|
|
|
|
|
|
|
| |
|
Year Ended |
| |
|
December 31, |
|
December 31, |
| |
|
2023 |
|
2022 |
| |
|
Reported Earnings |
|
Pre-tax Adjustments |
|
Income Taxes (1) |
|
Operating Earnings |
|
Reported Earnings |
|
Pre-tax Adjustments |
|
Income Taxes (1) |
|
Operating Earnings |
| |
|
(millions) |
| |
State income tax adjustment |
|
|
$ — |
|
$ — |
|
|
|
|
|
$ — |
|
$ (25) |
A |
|
| |
Equity method investee goodwill impairment |
|
|
— |
|
— |
|
|
|
|
|
7 |
B |
(1) |
|
|
| |
Gain on sale |
|
|
— |
|
— |
|
|
|
|
|
(17) |
C |
5 |
|
|
| |
Net Income Attributable to DT Midstream |
$ 384 |
|
$ — |
|
$ — |
|
$ 384 |
|
$ 370 |
|
$ (10) |
|
$ (21) |
|
$ 339 |
| |
|
|
|
|
|
|
|
|
|
|
|
|
|
|
|
|
| (1) |
Excluding tax related adjustments, the amount of income taxes was calculated based on a combined federal and state income tax rate, considering the applicable jurisdictions of the respective segments and deductibility of specific operating adjustments |
| Adjustments Key |
|
|
|
|
|
|
|
|
|
|
|
|
|
|
|
| A |
State tax rate reduction impact to deferred income tax expense due to enacted tax legislation |
| B |
Equity method investee goodwill impairment — recorded in Earnings from equity method investees |
| C |
Gain on sale of certain assets in the Utica shale region — recorded in Assets (gains) losses and impairments, net |
| |
|
|
|
|
|
|
|
|
|
|
|
|
|
|
|
|
|
DT Midstream, Inc.
Reconciliation of Reported to Operating Earnings per diluted share
(2) (non-GAAP, unaudited)
|
| |
|
|
|
|
|
|
|
|
|
|
|
|
|
|
|
|
| |
|
Three Months Ended |
| |
|
December 31, |
|
September 30, |
| |
|
2023 |
|
2023 |
| |
|
Reported Earnings |
|
Pre-tax Adjustments |
|
Income Taxes (1) |
|
Operating Earnings |
|
Reported Earnings |
|
Pre-tax Adjustments |
|
Income Taxes (1) |
|
Operating Earnings |
| |
|
(per share) |
| |
Adjustments |
|
|
$ — |
|
$ — |
|
|
|
|
|
$ — |
|
$ — |
|
|
| |
Net Income Attributable to DT Midstream |
$ 1.24 |
|
$ — |
|
$ — |
|
$ 1.24 |
|
$ 0.94 |
|
$ — |
|
$ — |
|
$ 0.94 |
| |
|
|
|
|
|
|
|
|
|
|
|
|
|
|
|
|
| |
|
|
|
|
|
|
|
|
|
|
|
|
|
|
|
|
| |
|
Year Ended |
| |
|
December 31, |
|
December 31, |
| |
|
2023 |
|
2022 |
| |
|
Reported Earnings |
|
Pre-tax Adjustments |
|
Income Taxes (1) |
|
Operating Earnings |
|
Reported Earnings |
|
Pre-tax Adjustments |
|
Income Taxes (1) |
|
Operating Earnings |
| |
|
(per share) |
| |
State income tax adjustment |
|
|
$ — |
|
$ — |
|
|
|
|
|
$ — |
|
$ (0.26) |
A |
|
| |
Equity method investee goodwill impairment |
|
|
— |
|
— |
|
|
|
|
|
0.08 |
B |
(0.03) |
|
|
| |
Gain on sale |
|
|
— |
|
— |
|
|
|
|
|
(0.17) |
C |
0.05 |
|
|
| |
Net Income Attributable to DT Midstream |
$ 3.94 |
|
$ — |
|
$ — |
|
$ 3.94 |
|
$ 3.81 |
|
$ (0.09) |
|
$ (0.24) |
|
$ 3.48 |
| |
|
|
|
|
|
|
|
|
|
|
|
|
|
|
|
|
| (1) |
Excluding tax related adjustments, the amount of income taxes was calculated based on a combined federal and state income tax rate, considering the applicable jurisdictions of the respective segments and deductibility of specific operating adjustments |
| (2) |
Per share amounts are divided by Weighted Average Common Shares Outstanding — Diluted, as noted on the Consolidated Statements of Operations |
| Adjustments Key |
|
|
|
|
|
|
|
|
|
|
|
|
|
|
|
| A |
State tax rate reduction impact to deferred income tax expense due to enacted tax legislation |
| B |
Equity method investee goodwill impairment — recorded in Earnings from equity method investees |
| C |
Gain on sale of certain assets in the Utica shale region — recorded in Assets (gains) losses and impairments, net |
| |
|
|
|
|
|
|
|
|
|
|
|
|
|
|
|
|
| |
|
|
|
|
|
|
|
|
|
|
|
|
|
|
|
|
|
DT Midstream, Inc.
Reconciliation of Net Income Attributable to DT Midstream to Adjusted
EBITDA (non-GAAP, unaudited)
|
| |
|
|
|
|
|
|
|
|
| |
|
Three Months Ended |
Year Ended |
| |
|
December 31, |
|
September 30, |
|
December 31, |
|
December 31, |
| |
|
2023 |
|
2023 |
|
2023 |
|
2022 |
| |
Consolidated |
(millions) |
| |
Net Income Attributable to DT Midstream |
$ 121 |
|
$ 91 |
|
$ 384 |
|
$ 370 |
| |
Plus: Interest expense |
39 |
|
38 |
|
150 |
|
137 |
| |
Plus: Income tax expense |
2 |
|
33 |
|
104 |
|
100 |
| |
Plus: Depreciation and amortization |
49 |
|
46 |
|
182 |
|
170 |
| |
Plus: Loss from financing activities |
— |
|
— |
|
— |
|
13 |
| |
Plus: EBITDA from equity method investees (1) |
74 |
|
70 |
|
286 |
|
217 |
| |
Plus: Adjustments for non-routine items (2) |
— |
|
— |
|
— |
|
(10) |
| |
Less: Interest income |
— |
|
— |
|
(1) |
|
(3) |
| |
Less: Earnings from equity method investees |
(45) |
|
(41) |
|
(177) |
|
(150) |
| |
Less: Depreciation and amortization attributable to noncontrolling interests |
(1) |
|
(1) |
|
(4) |
|
(3) |
| |
Adjusted EBITDA |
$ 239 |
|
$ 236 |
|
$ 924 |
|
$ 841 |
| |
|
|
|
|
|
|
|
|
| (1) |
Includes share of our equity method investees’ earnings before interest, taxes, depreciation and amortization, which we refer to as “EBITDA.” A reconciliation of earnings from equity method investees to EBITDA from equity method investees follows: |
| |
|
Three Months Ended |
Year Ended |
| |
|
December 31, |
|
September 30, |
|
December 31, |
|
December 31, |
| |
|
2023 |
|
2023 |
|
2023 |
|
2022 |
| |
|
(millions) |
| |
Earnings from equity methods investees |
$ 45 |
|
$ 41 |
|
$ 177 |
|
$ 150 |
| |
Plus: Depreciation and amortization attributable to equity method investees |
21 |
|
20 |
|
82 |
|
56 |
| |
Plus: Interest expense attributable to equity method investees |
8 |
|
9 |
|
27 |
|
11 |
| |
EBITDA from equity method investees |
$ 74 |
|
$ 70 |
|
$ 286 |
|
$ 217 |
| |
|
|
|
|
|
|
|
|
| (2) |
Adjusted EBITDA calculation excludes certain items we consider non-routine. For the year ended December 31, 2022, adjustments for non-routine items included a $17 million gain on sale of certain assets in the Utica shale region, partially offset by an equity method investee goodwill impairment of $7 million. |
| |
|
|
|
|
|
|
|
|
| |
|
|
|
|
|
|
|
|
|
DT Midstream, Inc.
Reconciliation of Net Income Attributable to DT Midstream to Adjusted
EBITDA
Pipeline Segment (non-GAAP, unaudited)
|
| |
|
|
|
|
|
|
|
|
| |
|
Three Months Ended |
Year Ended |
| |
|
December 31, |
|
September 30, |
|
December 31, |
|
December 31, |
| |
|
2023 |
|
2023 |
|
2023 |
|
2022 |
| |
Pipeline |
(millions) |
| |
Net Income Attributable to DT Midstream |
$ 93 |
|
$ 64 |
|
$ 278 |
|
$ 228 |
| |
Plus: Interest expense |
13 |
|
13 |
|
55 |
|
57 |
| |
Plus: Income tax expense |
3 |
|
23 |
|
75 |
|
62 |
| |
Plus: Depreciation and amortization |
19 |
|
17 |
|
69 |
|
63 |
| |
Plus: Loss from financing activities |
— |
|
— |
|
— |
|
6 |
| |
Plus: EBITDA from equity method investees (1) |
74 |
|
70 |
|
286 |
|
217 |
| |
Plus: Adjustments for non-routine items (2) |
— |
|
— |
|
— |
|
$ 7 |
| |
Less: Interest income |
— |
|
— |
|
(1) |
|
(1) |
| |
Less: Earnings from equity method investees |
(45) |
|
(41) |
|
(177) |
|
(150) |
| |
Less: Depreciation and amortization attributable to noncontrolling interests |
(1) |
|
(1) |
|
(4) |
|
(3) |
| |
Adjusted EBITDA |
$ 156 |
|
$ 145 |
|
$ 581 |
|
$ 486 |
| |
|
|
|
|
|
|
|
|
| (1) |
Includes share of our equity method investees’ earnings before interest, taxes, depreciation and amortization, which we refer to as “EBITDA.” A reconciliation of earnings from equity method investees to EBITDA from equity method investees follows: |
| |
|
Three Months Ended |
Year Ended |
| |
|
December 31, |
|
September 30, |
|
December 31, |
|
December 31, |
| |
|
2023 |
|
2023 |
|
2023 |
|
2022 |
| |
|
(millions) |
| |
Earnings from equity methods investees |
$ 45 |
|
$ 41 |
|
$ 177 |
|
$ 150 |
| |
Plus: Depreciation and amortization attributable to equity method investees |
21 |
|
20 |
|
82 |
|
56 |
| |
Plus: Interest expense attributable to equity method investees |
8 |
|
$ 9 |
|
27 |
|
11 |
| |
EBITDA from equity method investees |
$ 74 |
|
$ 70 |
|
$ 286 |
|
$ 217 |
| |
|
|
|
|
|
|
|
|
| (2) |
Adjusted EBITDA calculation excludes certain items we consider non-routine. For the year ended December 31, 2022, adjustments for non-routine items included an equity method investee goodwill impairment of $7 million. |
| |
|
|
|
|
|
|
|
|
| |
|
|
|
|
|
|
|
|
|
DT Midstream, Inc.
Reconciliation of Net Income Attributable to DT Midstream to Adjusted
EBITDA
Gathering Segment (non-GAAP, unaudited)
|
| |
|
|
|
|
|
|
|
|
| |
|
Three Months Ended |
Year Ended |
| |
|
December 31, |
|
September 30, |
|
December 31, |
|
December 31, |
| |
|
2023 |
|
2023 |
|
2023 |
|
2022 |
| |
Gathering |
(millions) |
| |
Net Income Attributable to DT Midstream |
$ 28 |
|
$ 27 |
|
$ 106 |
|
$ 142 |
| |
Plus: Interest expense |
26 |
|
25 |
|
95 |
|
80 |
| |
Plus: Income tax expense |
(1) |
|
10 |
|
29 |
|
38 |
| |
Plus: Depreciation and amortization |
30 |
|
29 |
|
113 |
|
107 |
| |
Plus: Loss from financing activities |
— |
|
— |
|
— |
|
7 |
| |
Plus: Adjustments for non-routine items (1) |
— |
|
— |
|
— |
|
(17) |
| |
Less: Interest income |
— |
|
— |
|
— |
|
(2) |
| |
Adjusted EBITDA |
$ 83 |
|
$ 91 |
|
$ 343 |
|
$ 355 |
| |
|
|
|
|
|
|
|
|
| (1) |
Adjusted EBITDA calculation excludes certain items we consider non-routine. For the year ended December 31, 2022, adjustments for non-routine items included a $17 million gain on sale of certain assets in the Utica shale region. |
| |
|
|
|
|
|
|
|
|
| |
|
|
|
|
|
|
|
|
|
DT Midstream, Inc.
Reconciliation of Net Income Attributable to DT Midstream to Distributable
Cash Flow (non-GAAP, unaudited)
|
| |
|
|
|
|
|
|
|
|
| |
|
Three Months Ended |
Year Ended |
| |
|
December 31, |
|
September 30, |
|
December 31, |
|
December 31, |
| |
|
2023 |
|
2023 |
|
2023 |
|
2022 |
| |
|
(millions) |
| |
Net Income Attributable to DT Midstream |
$ 121 |
|
$ 91 |
|
$ 384 |
|
$ 370 |
| |
Plus: Interest expense |
39 |
|
38 |
|
150 |
|
137 |
| |
Plus: Income tax expense |
2 |
|
33 |
|
104 |
|
100 |
| |
Plus: Depreciation and amortization |
49 |
|
46 |
|
182 |
|
170 |
| |
Plus: Loss from financing activities |
— |
|
— |
|
— |
|
13 |
| |
Plus: Adjustments for non-routine items (1) |
— |
|
— |
|
(371) |
|
(17) |
| |
Less: Earnings from equity method investees |
(45) |
|
(41) |
|
(177) |
|
(150) |
| |
Less: Depreciation and amortization attributable to noncontrolling interests |
(1) |
|
(1) |
|
(4) |
|
(3) |
| |
Plus: Dividends and distributions from equity method investees |
66 |
|
48 |
|
623 |
|
198 |
| |
Less: Cash interest expense |
(64) |
|
(7) |
|
(140) |
|
(125) |
| |
Less: Cash taxes |
(1) |
|
(3) |
|
(22) |
|
(24) |
| |
Less: Maintenance capital investment (2) |
(7) |
|
(11) |
|
(29) |
|
(22) |
| |
Distributable Cash Flow |
$ 159 |
|
$ 193 |
|
$ 700 |
|
$ 647 |
| |
|
|
|
|
|
|
|
|
| (1) |
Distributable Cash Flow calculation excludes certain items we consider non-routine. For the year ended December 31, 2023, adjustments for non-routine items included the $371 million NEXUS financing distribution. For the year ended December 31, 2022, adjustments for non-routine items included a $17 million gain on sale of certain assets in the Utica shale region. |
| (2) |
Maintenance capital investment is defined as the total capital expenditures used to maintain or preserve assets or fulfill contractual obligations that do not generate incremental earnings. |
| |
|
|
|
|
|
|
|
|
| |
|
|
|
|
|
|
|
|
# # #
Exhibit 99.2

Fourth Quarter 2023 Earnings Call
February 16, 2024
Ammons compressor station Appalachia Gathering System phase 2 expansion
DT Midstream

Safe Harbor Statement
This presentation contains statements which, to the extent they
are not statements of historical or present fact, constitute
"forward looking statements" under the securities laws. These
forward looking statements are intended to provide management's
current expectations or plans for our future operating and
financial performance, business prospects, outcomes of regulatory
proceedings, market conditions, and other matters, based on what
we believe to be reasonable assumptions and on information
currently available to us. Forward-looking statements can be
identified by the use of words such as "believe," "expect,"
"expectations," "plans," "strategy," "prospects," "estimate,"
"project," "target," "anticipate," "will," "should," "see,"
"guidance," "outlook," "confident" and other words of similar
meaning. The absence of such words, expressions or statements,
however, does not mean that the statements are not
forward-looking. In particular, express or implied statements
relating to future earnings, cash flow, results of operations,
uses of cash, tax rates and other measures of financial
performance, future actions, conditions or events, potential
future plans, strategies or transactions of DT Midstream, and
other statements that are not historical facts, are forward
looking statements.
Forward-looking statements are not guarantees of future results
and conditions, but rather are subject to numerous assumptions,
risks, and uncertainties that may cause actual future results to
be materially different from those contemplated, projected,
estimated, or budgeted. Many factors may impact forward looking
statements of DT Midstream including, but not limited to, the
following: changes in general economic conditions, including
increases in interest rates and associated Federal Reserve
policies, a potential economic recession, and the impact of
inflation on our business; industry changes, including the impact
of consolidations, alternative energy sources, technological
advances, infrastructure constraints and changes in competition;
global supply chain disruptions; actions taken by third party
operators, processors, transporters and gatherers; changes in
expected production from Southwestern Energy and other third
parties in our areas of operation; demand for natural gas
gathering, transmission, storage, transportation and water
services; the availability and price of natural gas to the
consumer compared to the price of alternative and competing
fuels; our ability to successfully and timely implement our
business plan; our ability to complete organic growth projects on
time and on budget; our ability to finance, complete, or
successfully integrate acquisitions; the price and availability
of debt and equity financing; restrictions in our existing and
any future credit facilities and indentures; the effectiveness of
the Company's information technology and operational technology
systems and practices to detect and defend against evolving cyber
attacks on United States critical infrastructure; changing laws
regarding cybersecurity and data privacy, and any cybersecurity
threat or event; operating hazards, environmental risks, and
other risks incidental to gathering, storing and transporting
natural gas; geologic and reservoir risks and considerations;
natural disasters, adverse weather conditions, casualty losses
and other matters beyond our control; the impact of outbreaks of
illnesses, epidemics and pandemics, and any related economic
effects; the impacts of geopolitical events, including the
conflicts in Ukraine and the Middle East; labor relations an d
markets, including the ability to attract, hire and retain key
employee and contract personnel; large customer defaults; changes
in tax status, as well as changes in tax rates and regulations;
the effects and associated cost of compliance with existing and
future laws and governmental regulations, such as the Inflation
Reduction Act; changes in environmental laws, regulations or
enforcement policies, including laws and regulations relating to
climate change and greenhouse gas emissions; ability to develop
low carbon business opportunities and deploy greenhouse gas
reducing technologies; changes in insurance markets impacting
costs and the level and types of coverage available; the timing
and extent of changes in commodity prices; the success of our
risk management strategies ; the suspension, reduction or
termination of our customers' obligations under our commercial
agreements; disruptions due to equipment interruption or failure
at our facilities, or third party facilities on which our
business is dependent; the effects of future litigation; and the
risks described in our Annual Report on Form 10 K for the year
ended December 31, 2023 and our reports and registration
statements filed from time to time with the SEC.
The above list of factors is not exhaustive. New factors emerge
from time to time. We cannot predict what factors may arise or
how such factors may cause actual results to vary materially from
those stated in forward looking statements, see the discussion
under the section entitled "Risk Factors" in our Annual Report
for the year ended December 31, 2023, filed with the SEC on Form
10 K and any other reports filed with the SEC. Given the
uncertainties and risk factors that could cause our actual
results to differ materially from those contained in any forward
-looking statement, you should not put undue reliance on any
forward-looking statements.
Any forward-looking statements speak only as of the date on which
such statements are made. We are under no obligation to, and
expressly disclaim any obligation to, update or alter our
forward-looking statements, whether as a result of new
information, subsequent events or otherwise. DT Midstream
2

DT Midstream Investment Thesis
Pure play natural gas midstream portfolio
~65% pipeline segment1; highest in sector2 ~9-year contract tenor3 No commodity exposure Integrated wellhead
to market service
Premium shareholder returns Distinctive Adjusted EBITDA4 growth
of 10%5 Consistent dividend growth of 7%6 Targeting 5-7%
long-term Adjusted EBITDA and dividend growth Strong organic
growth Sizeable project backlog Funded within cash flow
Expandable assets serving growing LNG export demand Executing on
tangible energy transition projects Balance sheet strength
Line-of-sight to investment grade credit rating in 2024 Reducing
leverage No debt maturities for four years7 Annual debt reduction
at Millennium and Vector DT Midstream
1. Represents percentage of fourth quarter 2023 Adjusted EBITDA.
2. Natural gas pipeline percentage of overall Adjusted EBITDA;
compared to US-based midstream peers (AM, ENLC, EPD, ET, ETRN,
KMI, MPLX, OKE, TRGP, WES, WMB). 3. Overall portfolio weighted
average contract tenor. 4. Definition and reconciliation of
Adjusted EBITDA (non-GAAP) to net income included in the
appendix. 5. Represents annual growth rate from 2022 to 2023. 6.
Represents compounded annual growth rate from 2021 (first
dividend declared) to 2024. 7. Excludes revolving
credit facility
3

2023 Year in Review
Delivering on our commitments and building for the future
Delivered strong growth and financial results exceeding guidance
Executed growth investments ahead of schedule and on budget
Positioned assets to ramp into growing gas demand Advanced energy
transition platform DT Midstream
4

2023 Year in Review: Financial Results Strong financial performance across key metrics
Distinctive growth $924 million Adjusted EBITDA1 10% YoY and
exceeded guidance midpoint Growing return of capital 7% annual
dividend growth2 2.6x dividend coverage ratio3 Irreplaceable
natural gas pipeline portfolio 65% pipeline segment contribution4
Highest in sector5 Efficient capital deployment $677 million
growth capital invested6 7% compared to guidance midpoint Strong
balance sheet 3.6x / 4.1x on-balance sheet / proportional
leverage 0.3x reduction in on-balance sheet debt since 2021
DT Midstream
1. Definition and reconciliation of Adjusted EBITDA (non-GAAP) to
net income included in the appendix. 2. Represents compounded
annual growth rate from 2021 - 2023. 3. Dividend coverage ratio
for year ended 2023. 4. Represents percentage of fourth quarter
2023 Adjusted EBITDA. 5. Compared to US-based midstream peers
(AM, ENLC, EPD, ET, ETRN, KMI, MPLX, OKE, TRGP, WES, WMB). 6.
Growth capital reflects total DT Midstream capital spend of $750
million less cash contributions from customers of $73 million
5

2023 Year in Review: Completed Growth Investments Organic growth projects placed in-service early and on
budget
Market Project Key accomplishment
First-mover advantage Gulf Coast / LNG LEAP phase 1 & 2
expansions (in-service early) +700 MMcf/d of capacity Positioned
for demand ramp Gulf Coast / LNG Blue Union expansion +400 MMcf/d
treating capacity New growth platform Midwest Ohio Utica
(in-service early) Initial trunkline in-service Unlocking
Appalachia growth Midwest / Northeast Appalachia Gathering System
phase 2 expansion +150 MMcf/d in system mainline capacity
Increased critical egress capacity Midwest NEXUS hydraulic capacity optimization +80 MMcf/d of capacity
DT Midstream
6

2023 Year in Review: Executing on Organic Growth
Executed new commercial agreements to serve key demand markets
Northeast Appalachia Gathering System phase 3: Incremental 60
MMcf/d mainline capacity Tioga Gathering: Incremental 70 MMcf/d
capacity Ohio Utica Gathering System: >200 MMcf/d gathering
backbone, supporting emerging resource play New projects added in
Q4 2023 Gulf Coast Blue Union well pad expansion: New gathering
pipelines with incremental fixed surcharge Blue Union Carthage
area connection: 400 MMcf/d supply interconnect LEAP Gillis
Access interconnect: 1 Bcf/d interconnect
with Gillis Access project
DT Midstream
7

Delivering Distinctive and Predictable Growth
Track record of strong growth
Historical Adjusted EBITDA1 (Millions) 9% CAGR $720 2020 $778 2021 $841 2022 $924 2023
Relative Growth 2020-2023 Adjusted EBITDA CAGR2 9% DT Midstream 4% Peer average3
Well positioned assets and take-or-pay contract structures consistently deliver best-in-class results
DT Midstream
1. Definition and reconciliation of Adjusted EBITDA (non-GAAP) to
net income included in the appendix 2. 2023 Adjusted EBITDA based
on analyst estimate consensus for peers 3. Peer average of gas
focused peers (AM, ENLC, ETRN, KMI, TRP, WMB)
8
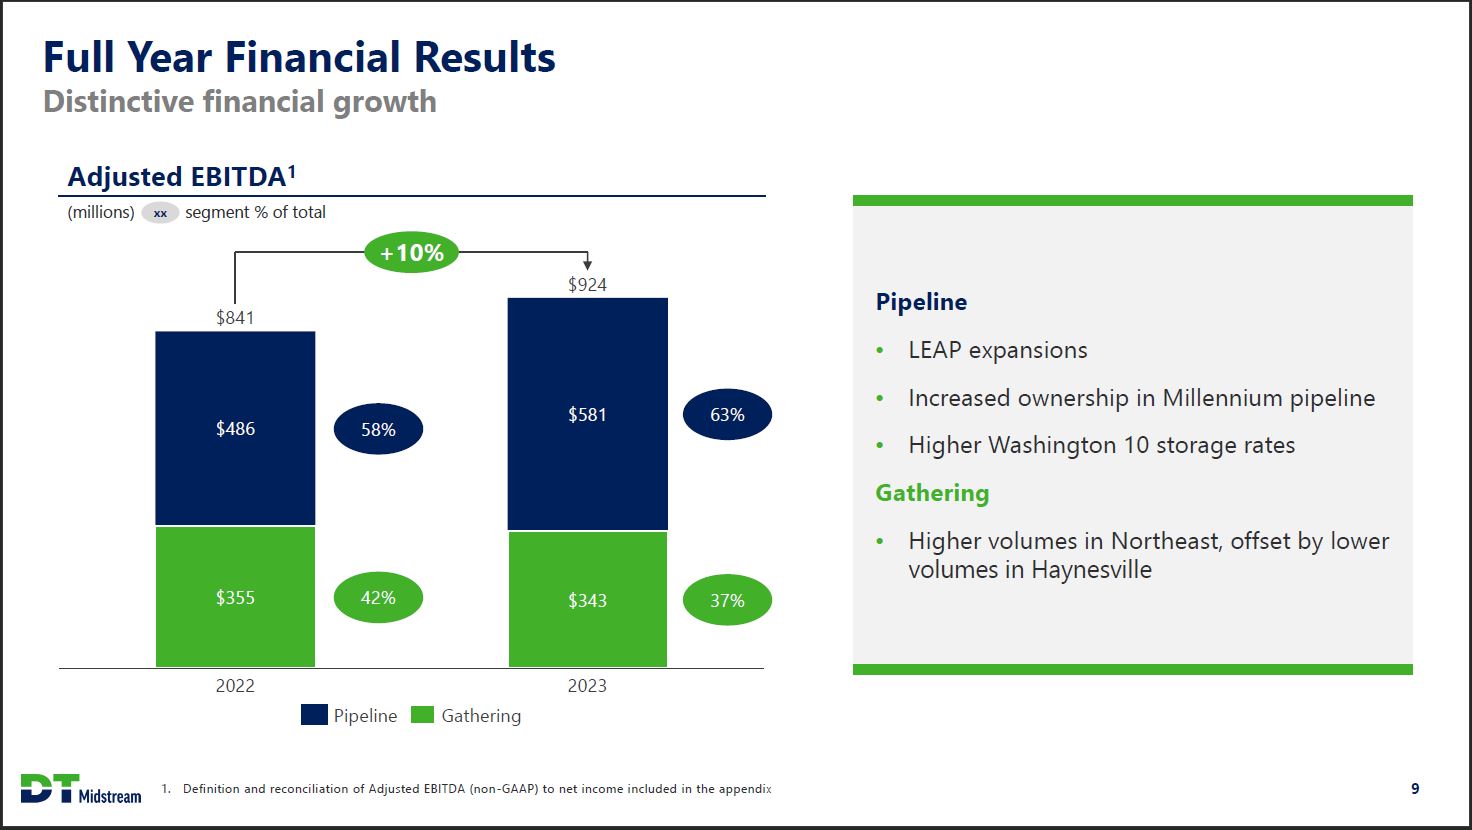
Full Year Financial Results
Distinctive financial growth
Adjusted EBITDA1 (millions) xx segment % of total
+10%
$814 $486 58% $355 42% 2022 $924 $581 63% $343 37% 2023
Pipeline Gathering
Pipeline
LEAP expansions Increased ownership in Millennium pipeline Higher Washington 10 storage rates
Gathering
Higher volumes in Northeast, offset by lower volumes in Haynesville
DT Midstream
1. Definition and reconciliation of Adjusted EBITDA (non-GAAP) to
net income included in the appendix
9

Continuing Our Track Record of Distinctive Growth
Targeting long-term Adjusted EBITDA growth of 5-7%
Adjusted EBITDA1 (millions)
+6%
$930 - $980 2024 guidance
$980 - $1,040 2025 early outlook
5-7% long-term growth rate
Differentiated growth drivers
$1.3 billion organic growth project backlog Tangible energy transition projects Fully funded with long-term,
contract-backed free cash flows No commodity exposure
DT Midstream
1. Definition and reconciliation of Adjusted EBITDA (non-GAAP) to
net income included in the appendix
10

Committed Growth Investment Summary
Continue to advance short-cycle growth investments
Project Expected in-service dates
Pipeline
Haynesville LEAP pipeline expansion - phase 2 In-service
Haynesville LEAP Gillis Access interconnect Q2 2024
Haynesville LEAP pipeline expansion - phase 3 Q3 2024
Gathering
Appalachia Gathering System expansion - phase 2 In-service
Haynesville Blue Union expansion In-service
Ohio Utica Gathering System - initial development Q1 2024
Haynesville Blue Union Carthage area connection Q2 2024
Appalachia Tioga Gathering expansion (New) Q2 2025
Appalachia Gathering System expansion - phase 3 (New) Q2 2025
Haynesville Blue Union well pad expansion (New) Q2 2025
In-flight project updates
LEAP phase 3 is currently ahead of schedule All other growth
investments on track and on budget
DT Midstream
11

2024 Growth Capex
Flexible capital budget, fully funded within cash flows
Growth capex (millions)
~$100 Committed growth capex (prior disclosure)
~$35 Deferral from 2023 to 2024
$95 - $125 New growth projects added in Q4 2023
Cash flow after dividends $70 - $115 Highly probable (pre-FID1 projects)
Fully funded within cash flows $300 - $375 2024 guidance2
Flexible, short-cycle, capital investments
New, highly accretive gathering expansions in both regions Highly
probable projects expected to reach final investment decision
later this year Any excess cash flow will be deployed toward debt
reduction DT Midstream
1. Final investment decision 2. Guidance range is net of a ~$20
million customer contribution
12

Disciplined Capital Investment
Self-funding highly accretive organic growth projects
Growth capex
(millions) Committed Pre-FID
2023 original guidance $677 2023 actuals1
$300 - $375 2024 guidance2
~$50 2025
Flexible, short-cycle, capital investments
Total committed capex of ~$300 million over 2024/2025 Advancing
numerous accretive organic projects towards final investment
decisions Currently expect a similar overall level of growth
investment in 2025 as in 2024 DT Midstream
1. 2023 growth capex reflects total DT Midstream capital spend of
$750 million less cash contributions from customers of $73
million 2. Guidance range is net of a ~$20 million customer
contribution
13

Sizeable Organic Project Backlog
Balanced opportunity set across all business segments
Pipeline
Project Contribution Status
LEAP phase 1 expansion Aug. 2023 In-service
LEAP phase 2 expansion Dec. 2023 In-service
LEAP Gillis Access interconnect Q2 2024 In development
LEAP phase 3 expansion Q3 2024 In development
LEAP phase 4+ expansion 2025/26 Pre-FID
NEXUS / Generation Pipeline interconnection 2026 Pre-FID
Vector expansion 2026 Pre-FID
Stonewall expansion 2027 Pre-FID
NEXUS expansion 2027/28 Pre-FID
Millennium expansion 2028 Pre-FID
Energy Transition
Project Contribution Status
Louisiana CCS phase 1 2H 2026 Pre-FID
Low carbon fuels 2025/26 Pre-FID
Louisiana CCS phase 2 2027 Pre-FID
Gathering
Project Contribution Status
Blue Union gathering / treating expansion Dec. 2023 In-service
Appalachia Gathering System expansion - phase 2 Jan. 2024
In-service Ohio Utica - initial development Q1 2024 Partial
in-service Blue Union Carthage area connection Q2 2024 In
development Tioga Gathering expansion Q2 2025 In development Blue
Union well pad expansion Q2 2025 In development Appalachia
Gathering System expansion - phase 3 Q2 2025 In development Blue
Union well pad expansion 2026 Pre-FID Ohio Utica buildout 2025/26
Pre-FID
Tioga buildout 2026/27 Pre-FID
2024 - 2027 growth capex by segment
60% 20% 20% > $1.3 billion organic growth project backlog at 5-8x build multiples
DT Midstream
14

Dividend Growth
Consistent return of capital via dividend increases
Annualized dividend
(per share)
7% CAGR
2.40 2021 actual
2.56 2022 actual
2.76 2023 actual
+7% 2.94 20241
Financial policy is to provide a growing and durable dividend
Plan to grow dividend 5-7% annually, in-line with Adjusted
EBITDA2 Maintain a dividend coverage ratio3 above our 2.0x floor
DT Midstream
1. Annualized Q1 2024 board approved dividend ($0.735/share) 2.
Definition and reconciliation of Adjusted EBITDA (non-GAAP) to
net income included in the appendix 3. The dividend coverage
ratio represents Distributable Cash Flow divided by annualized
approved quarterly dividend. Definition and reconciliation of
Distributable Cash Flow (non-GAAP) to net income included in the
appendix
15

2024/2025 Guidance Summary
(millions, except EPS) Guidance
2024 Adjusted EBITDA1 $930 - $980
2024 Operating Earnings2 $335 - $375
2024 Operating EPS2 $3.43 - $3.83
2024 Distributable Cash Flow3 $640 - $700
2024 Capital Expenditures4 $330 - $415
Growth Capital $300 - $375
Maintenance Capital $30 - $40
2025 Adjusted EBITDA (early outlook) $980 - $1,040
DT Midstream
1. Definition and reconciliation of Adjusted EBITDA (non-GAAP) to
net income included in the appendix 2. Definition and
reconciliation of Operating Earnings and Operating Earnings per
Share (non-GAAP) to reported earnings included in this appendix;
EPS calculation based on average share count of approximately 97
million shares outstanding - diluted 3. Definition and
reconciliation of Distributable Cash Flow (non-GAAP) to net
income included in the appendix 4. Includes contribution to
equity method investees; guidance range is net of a ~$20 million
customer
contribution
16

Pure Play Natural Gas Midstream Portfolio
Integrated pipeline platform in leading gas basins serving
growing markets Pipelines connect world-class basins to
high-quality markets ~900 miles of FERC-regulated interstate
pipelines that have interconnections with multiple interstate
pipelines and LDCs
~700 miles of intrastate pipelines
94 Bcf of gas storage capacity
Gathering assets feed our pipelines
Dry gas gathering assets serving growing gas production in the
premier, low-cost production areas of the Marcellus / Utica and
Haynesville ~800 miles of pipe, 119 compressor units with 258,000
horsepower and ~2.6 Bcf/d of treating capacity Michigan System
Ontario, Canada
Michigan Washington 10 Storage Complex Bluestone Gathering
Lateral Pipeline New York Vector Pipeline Generation Pipeline
UTICA SHALE Tioga Gathering System Susquehanna Gathering System
Millennium Pipeline New Jersey
HAYNESVILLE SHALE NEXUS Gas Transmission Pipeline MARCELLUS SHALE
Pennsylvania Birdsboro Pipeline Blue Union Gathering System Ohio
Ohio Utica System Texas LEAP Gathering Lateral Pipeline Stonewall
Gas Gathering Lateral Pipeline Appalachia Gathering System
Maryland
Louisiana Kentucky West Virginia Virginia
DT Midstream assets LNG facilities
Operational
Under development
DT Midstream
17

Diversified Asset Base Anchored by Strong Pipeline Segment
Highest natural gas pipeline asset contribution in sector1
Business mix
(% of total 2023 Adjusted EBITDA2)
Gathering 37%
Ohio Utica <1% Tioga <1% AGS 11% Blue Union 14% Susquehanna 12%
Pipeline 63%
Millennium 13% NEXUS 11% LEAP 11% Stonewall 8% Bluestone 8%
W10 Storage 5% Vector 5% Birdsboro 1% Michigan 1%
Gathering assets integrate with pipelines
Highly contracted asset portfolio supports stable cash flows
Average portfolio contracted tenor of ~9 years3
Pipeline assets contracted long-term with take-or-pay contracts
Gathering assets contracted long-term
Significant minimum volume commitments (MVCs)
Acreage dedications
Rate escalators tied to inflation
DT Midstream
1. Compared to US-based midstream peers (AM, ENLC, EPD, ET, ETRN,
KMI, MPLX, OKE, TRGP, WES, WMB) 2. Definition and reconciliation
of Adjusted EBITDA (non-GAAP) to net income included in the
appendix 3. Overall portfolio weighted average contract tenor
18

High Quality Cash Flows and Customers
Cash flows are underpinned by take-or-pay contracts and high
credit quality customers Total revenue contribution
(% of 2023 contribution1)
~90% demand / MVC or flowing gas2
Customer credit
(% of 2023 contribution)
~85% Investment grade and "Rising star3"
Non-investment grade with credit support
DT Midstream
1. Reflects non-GAAP financial metric based on total revenue
contribution of company assets, including DTM's proportionate
interest in joint ventures 2. Flowing gas represents proved
developed producing reserves (PDPs) 3. Includes Southwestern
Energy; expected to be investment grade post merger with
Chesapeake Energy
19

Positioned to Serve In-flight LNG Export Demand
LNG growth of ~7 Bcf/d within LEAP's corridor is not subject to DOE permit approvals
Forecasted US LNG export capacity growth1
(bcf/d)
~16 Bcf/d
12.9 2023
17.3 4.4 12.9 2025
21.5 8.6 12.9 2027
25.8 1.4 0.5 11.0 12.9 2029
28.5 4.1 0.5 11.0 12.9 2031
Operational Under construction (DOE approved) Pre-FID (DOE approved) Pre-FID (awaiting DOE approval)
LNG demand that LEAP can serve
LNG project Bcf/d DOE approval2
Operational
Sabine Pass 4.2
Cameron 2.1
Calcasieu Pass 1.4
Corpus Christi 2.1
Freeport 2.1
Cove Point 0.7
Elba Island 0.3
Total 12.9
Under construction
Golden Pass 2.5
Plaquemines phase 1 2.8
Port Arthur phase 1 1.9
Corpus Christi Stage 3 1.4
Rio Grande Trains 1-3 2.4
Total 11.0
LNG project Bcf/d DOE approval2
Pre-FID
Driftwood LNG 3.8
Cameron LNG Train 4 0.9
CP2 LNG 4.0
Calcasieu Pass design increase 0.1
Magnolia LNG 1.2
Commonwealth LNG 1.2
Lake Charles 2.3
Sabine Pass Stage 5 2.6
Plaquemines Design increase 0.5
Port Arthur phase 2 1.9
Freeport Train 4 0.7
Delfin FLNG 1.8
Corpus Christi Train 8-9 0.4
Total 21.4
~7 Bcf/d of LNG demand growth that LEAP can serve is currently under construction
DT Midstream
1. Source: Wood Mackenzie North America Gas Investment Horizon
Outlook - October 2023; DOE dockets 2. Depending on when facility
first exports, a DOE permit extension may be required
20

New Haynesville Takeaway Capacity is Needed to Meet LNG Demand
LEAP offers lower-risk, capital efficient expansion opportunity,
proving timely access to LNG demand Forecasted Louisiana Gulf
Coast area LNG capacity growth1 vs announced Haynesville takeaway
expansions2
(Cumulative growth from 2023, bcf/d)
Capacity shortage risk
12 10 8 6 4 2 0
2023 2024 2025 2026 2027 2028 2029 2030 2031
Significant long-term expansion opportunity
Golden Pass Calcasieu Pass Announced takeaway Plaquemines Delfin
Announced takeaway with potential delay Port Arthur Sabine Pass
DT Midstream
1. Source: Wood Mackenzie North America Gas Investment Horizon
Outlook - October 2023; does not incorporate the announced
in-service delay of Golden Pass 2. Announced pipeline expansions
include LEAP phase 3, Energy Transfer Gulf Run, Momentum NG3, and
Williams LEG
21

Increasing LEAP Expansion Potential
Market fundamentals driving greater demand for Haynesville to
Gulf Coast pipeline capacity Phase 3 LEAP expansion on track and
on budget to increase capacity from 1.7 Bcf/d to 1.9 Bcf/d All
pipeline crossings completed early Project includes a combination
of looping and compression Expansion is underpinned by a
take-or-pay contract In active discussions for additional
expansions Capital efficient, lower-risk expansions provide
timely access to growing LNG demand Targeting 200 - 400 MMcf/d
for phase 4 expansion Increasing LEAP expansion potential to ~4
Bcf/d Louisiana
Texas
Gillis Hub
Lake Charles LNG
Port Arthur Sabine Pass LNG Cameron LNG CP2 Henry Hub Plaquemines
Golden Pass LNG Calcasieu Pass
Delfin LNG
LEAP capacity (Bcf/d)
In-service
Original 1.0
Phase 1 expansion 0.3 Aug. 2023
Phase 2 expansion 0.4 Jan. 2024
Phase 3 expansion 0.2 Q3 2024
Phase 4 expansion (pre-FID) 0.2 - 0.4 2025/2026
Total 2.1 - 2.3
Expansion potential ~4
DTM assets LNG facilities
DTM trading plants Operational
Electric compression Under development
DT Midstream
22

Louisiana Carbon Capture and Sequestration
Disciplined approach to CCS project
Illustrative Carbon Capture and Sequestration process
Natural gas treating facility Equipment captures CO2 from treating plants
CO2
Dedicated CO2 pipeline transports supercritical phase CO2 to storage site
Permanent sequestration
Phase 1 Phase 2
Scope Capture equipment, CO2 pipeline, compression, storage Capture equipment, CO2 pipeline, compression,
storage
Volume (Million metric tonnes per annum) 0.4 0.5
Capex (Millions) $115 - $145 (over 2024 to 2026) $110 - $140 (over 2026/27)
Build Multiple 5-8x 4-6x
Expected in-service 2H 2026 2027
DT Midstream
23

Louisiana Carbon Capture and Sequestration
Disciplined approach to CCS project
Project timeline
Capital deployment
Q4 2022 Class VI well permit filing Conducted 3D seismic survey
Q2 2023 Class V test well permit filing 1H 2024 Class V test well
permit approved Drill Class V test well Current stage Evaluate
Class V test well results
2H 2024 Final investment decision
YE 2024 Expected Class VI well permit approval
2H 2026 Expected phase 1 project in-service
Minimizing capital spend until we reach a final investment decision
Methodical project development approach
Disciplined storage site selection and stakeholder engagement
Proximity to CO2 source
Favorable geology for permanent sequestration
Early engagement of local community and Louisiana DNR on key development activities
Extensive storage site de-risking
Engaged with 3rd party experts in local geology
Evaluated existing well core and log data
Conducted 3D seismic surveys
Stratigraphic test well drilling currently underway
Leveraging over 50 years of storage and pipeline development and operations experience
DT Midstream
24

Strong balance sheet, free of near-term debt maturities
Expecting investment grade credit rating in 2024
Debt maturity profile
($ billions) Long-term debt Undrawn revolver capacity Drawn revolver balance
No significant maturities for 4 years
2024
2025
2026
$1.0 $0.8 $0.2 2027
$0.4 2028
$1.1 2029
2030
$1.0 2031
$0.6 2032
~$0.9 billion liquidity
3.6x / 4.1x on-balance sheet / proportional leverage1
BBB- / BB+ senior secured / unsecured issuer rating
Positive outlook Fitch ratings
DT Midstream
1. Net debt to trailing twelve months Adjusted EBITDA as of
December 31, 2023
25

Appendix
DT Midstream
26

Ohio Utica System Initial Trunkline Construction Completed
Overall construction progressing ahead of schedule
Vector Pipeline Washington 10 Storage Complex
Michigan Direct access to premium markets Pennsylvania
NEXUS Pipeline
Kensington
Ohio
DTM initial focus area Berne
Seneca West Virginia
Third-party processing plant
Utica Combo play
Initial project build
Emerging associated gas resource development area
Initial gathering backbone buildout of >200 MMcf/d capacity
Expected DTM investment1 of ~$100 million for 2023-2024
~5x build multiple at full run-rate
Trunkline construction completed in December 2023; initial volume
expected in Q1 2024 Customer is a large-cap investment-grade
producer that has an advantaged cost structure via sizeable
minerals ownership within ~430k total net acres Strong commercial
structure
Long-term contract, dedication, and minimum volume commitment
that protects project economics Volume expected to ramp over 18
to 24 months Opportunity for significant future development
Potential large-scale, multi-year natural gas gathering buildout
Integration with DTM downstream assets (e.g., NEXUS, Vector, and
W10 Storage), providing access to premium markets
DT Midstream
1. DTM's investment is net of customer contribution
27

DTM Assets are Strategically Connected to Growing Demand LEAP
offers 3.5 Bcf/d of direct connectivity to LNG markets Carthage
Hub Louisiana
DTM assets Third Party Pipelines
DTM treating plants ANR
LNG facilities Cameron
Operational Columbia Gulf
Under Construction (DOE Approved Creole Trail
Pre-FID (DOE Approved) TETCO
Pre-FID (Awaiting DOE Approval) Tenn Gas
Transco
Venture Global
Targa
Texas Mississippi
Gillis Hub
Port Arthur Golden Pass LNG Sabine Pass LNG Commonwealth LNG
Calcasieu Pass CP2 Cameron LNG Driftwood LNG Magnolia LNG Lake
Charles LNG Henry Hub Plaquemines Delfin LNG
Adding new connectivity to Haynesville system to support existing
DOE approved LNG projects Current interconnect capacity of 2.5
Bcf/d to operating LNG terminals Building new 1 Bcf/d
interconnect with Gillis Access project LEAP interconnects
Capacity (Bcf/d) LNG terminal / market Transco 0.5 Industrial /
LNG corridor Cameron 0.25 Cameron LNG
Creole Trail 1.0 Sabine Pass LNG
Texas Eastern 0.75 Calcasieu Pass LNG
Targa 0.1 Industrial
Total 2.6 Bcf/d
TC Energy Gillis Access (Q2 2024) 1.0 Industrial / LNG corridor
Total future 3.6 Bcf/d
DT Midstream
28

Strong Long-term Production Outlook in Both Basins
Haynesville and Appalachia production are expected to experience
significant growth over the next decade
Historical production
(bcf/d) Haynesville Appalachia
60 50 40 30 20 10 0
2018 2019 2020 2021 2022 2023 2024
DUC inventory1
Haynesville 415 667 735
Appalachia 641 852 768
Production forecast
(bcf/d) Haynesville Appalachia
+ 18 bcf/d
49 15 34 2023
67 27 40 2033
DT Midstream
1. Drilled but uncompleted (DUC) wells data reflects year end
inventory. Sources: EIA, S&P Global Commodity Insights, & Wood
Mackenzie North America Gas Investment Horizon Outlook - October
2023
29

Executing a Leading ESG Program MSCI ESG RATINGS AA CCC B BB BBB
A AA AAA Second highest MSCI rating among midstream peers
Environmental
Continuing to advance CCS opportunity in Louisiana Advancing
hydrogen development opportunities with strategic partnership
Transitioning to net zero GHG emissions by 2050, including a 30%
reduction by 2030 Social
83% improvement in total recordable safety incident rate since 2020 Doubled the percentage of ethnically
diverse leadership Community giving and volunteer hours per employee is leading among midstream peers
Governance
Independent and diverse board Long-term incentive plans tied to
total shareholder return Second highest possible governance
rating (AA) from MSCI DT Midstream
The use by DT Midstream of any MSCI ESG Research LLC or its
affiliates ("MSCI") data, and the use of MSCI logos, trademarks,
service marks or index names herein, do not constitute a
sponsorship, endorsement, recommendation, or promotion of DT
Midstream by MSCI. MSCI services and data are the property of
MSCI or its information providers, and are provided 'as-is' and
without warranty. MSCI names and logos are trademarks or service
marks of MSCI. Link to full report: Corporate Sustainability
Report 2023
30

Full-Year Financial Results
(millions, except EPS) 2022 2023 Change
Adjusted EBITDA1 $841 $924 10%
Pipeline segment $486 $581 20%
Gathering segment $355 $343 (3%)
Operating Earnings2 $339 $384 13%
Operating EPS2 $3.48 $3.94 13%
Distributable Cash Flow3 $647 $700 8%
Growth Capital4 $873 $6775 22%
Maintenance Capital $22 $29
DT Midstream
1. Definition and reconciliation of Adjusted EBITDA (non-GAAP) to
net income included in this appendix 2. Definition and
reconciliation of Operating Earnings and Operating Earnings per
Share (non-GAAP) to reported earnings included in the appendix;
EPS calculation based on average share count of approximately 97
million shares outstanding - diluted 3. Definition and
reconciliation of Distributable Cash Flow (non-GAAP) to net
income included in this appendix 4. Includes contribution to
equity method investees. 5. Growth capital reflects total DT
Midstream capital
spend of $750 million less cash contributions from customers of $73 million
31

Quarterly Financial Results
(millions, except EPS) Q3 2023 Q4 2023
Adjusted EBITDA1 $236 $239
Pipeline segment $145 $156
Gathering segment $91 $83
Operating Earnings2 $91 $121
Operating EPS2 $0.94 $1.24
Distributable Cash Flow3 $193 $159
Growth Capital4 $1565 $1055
Maintenance Capital $11 $7
DT Midstream
1. Definition and reconciliation of Adjusted EBITDA (non-GAAP) to
net income included in this appendix 2. Definition and
reconciliation of Operating Earnings and Operating Earnings per
Share (non-GAAP) to reported earnings included in the appendix;
EPS calculation based on average share count of approximately 97
million shares outstanding - diluted 3. Definition and
reconciliation of Distributable Cash Flow (non-GAAP) to net
income included in this appendix 4. Includes contribution to
equity method investees. 5. Growth capital reflects total DT
Midstream capital
spend of $190 million less cash contribution from customer of $34 million in Q3 2023 and total capital spend
of $144 million less cash contributions from customers of $39 million in Q4 2023
32

Fourth Quarter 2023 Financial Results
Adjusted EBITDA1
(millions) xx segment % of total
$236 $145 61% $91 39% Q3 2023
$239 $156 65% $83 35% Q4 2023
Gathering Pipeline
Pipeline
Full quarter of LEAP phase 1 expansion in-service
Higher revenue on pipeline joint ventures and Washington 10 storage
Gathering
~$6 million environmental reserve adjustment in Q3 2023
Higher volumes in Northeast, offset by lower volumes in Haynesville
DT Midstream
1. Definition and reconciliation of Adjusted EBITDA (non-GAAP) to
net income included in this appendix
33

Gathering Volume Summary
Haynesville throughput
(bcf/d) Blue Union Gathering
Q1 2023 1.63
Q2 2023 1.53
Q3 2023 1.60
Q4 2023 1.56
Impact of producer activity deferrals in Q4 2023
Northeast throughput
(bcf/d) Susquehanna Gathering Appalachia Gathering Tioga Gathering
Q1 2023 1.36
Q2 2023 1.39
Q3 2023 1.39
Q4 2023 1.53
Strong seasonal volume ramp on Appalachia Gathering in Q4 2023
DT Midstream
34

Balanced Partnership Governance Structures
Joint Venture Asset Ownership Operator Original Developer Independently Managed Owner Managed
MILLENNIUM PIPELINE COMPANY, L.L.C.
NEXUS SM GAS TRANSMISSION
Vector Pipeline
DT Midstream Stonewall
DT Midstream 52.5%
TC Energy 47.5%
DT Midstream 50%
Enbridge 50%
DT Midstream 40%
Enbridge 60%
DT Midstream 85%
Antero Midstream 15%
Balanced and equitable partnership agreements
Independent management teams for FERC assets
Seconded DTM employees in leadership roles
Retained ability to assume operatorships as needed
Shared corporate services provided as needed
Balanced voting rights
DT Midstream
35

Joint Venture Debt Details
Annual debt paydowns at Millennium and Vector
DTM proportionate share
Asset (DTM ownership %) End of year debt balances
2023 2024 2025
NEXUS Pipeline (50%) $371 $371 $371
Millennium Pipeline (52.5%) $144 $129 $114
Vector Pipeline (40%) $31 $29 $26
Interest expense
2023 2024 2025
$14 $21 $21
$13 $11 $9
$2 $2 $2
Weighted average interest rate1 5.68% 5.80% 6.11%
Maturity Bullets, 2028 through 2035 Fully amortized by 2032 Fully amortized by 2034
DT Midstream
1. Weighted average interest rate as of December 31, 2023
36

Non-GAAP Definitions
Adjusted EBITDA and Distributable Cash Flow (DCF) are non-GAAP
measures Adjusted EBITDA is defined as GAAP net income
attributable to DT Midstream before expenses for interest, taxes,
depreciation and amortization, and loss from financing
activities, further adjusted to include our proportional share of
net income from our equity method investees (excluding interest,
taxes, depreciation and amortization), and to exclude certain
items we consider non-routine. We believe Adjusted EBITDA is
useful to us and external users of our financial statements in
understanding our operating results and the ongoing performance
of our underlying business because it allows our management and
investors to have a better understanding of our actual operating
performance unaffected by the impact of interest, taxes,
depreciation, amortization and non-routine charges noted in the
table below. We believe the presentation of Adjusted EBITDA is
meaningful to investors because it is frequently used by
analysts, investors and other interested parties in our industry
to evaluate a company's operating performance without regard to
items excluded from the calculation of such measure, which can
vary substantially from company to company depending on
accounting methods, book value of assets, capital structure and
the method by which assets were acquired, among other factors. We
use Adjusted EBITDA to assess our performance by reportable
segment and as a basis for strategic planning and forecasting.
Distributable Cash Flow (DCF) is calculated by deducting earnings
from equity method investees, depreciation and amortization
attributable to noncontrolling interests, cash interest expense,
maintenance capital investment (as defined below), and cash taxes
from, and adding interest expense, income tax expense,
depreciation and amortization, certain items we consider
non-routine and dividends and distributions from equity method
investees to, Net Income Attributable to DT Midstream.
Maintenance capital investment is defined as the total capital
expenditures used to maintain or preserve assets or fulfill
contractual obligations that do not generate incremental
earnings. We believe DCF is a meaningful performance measurement
because it is useful to us and external users of our financial
statements in estimating the ability of our assets to generate
cash earnings after servicing our debt, paying cash taxes and
making maintenance capital investments, which could be used for
discretionary purposes such as common stock dividends, retirement
of debt or expansion capital expenditures.
Adjusted EBITDA and DCF are not measures calculated in accordance
with GAAP and should be viewed as a supplement to and not a
substitute for the results of operations presented in accordance
with GAAP. There are significant limitations to using Adjusted
EBITDA and DCF as a measure of performance, including the
inability to analyze the effect of certain recurring and
non-recurring items that materially affect our net income or
loss. Additionally, because Adjusted EBITDA and DCF exclude some,
but not all, items that affect net income and are defined
differently by different companies in our industry, Adjusted
EBITDA and DCF do not intend to represent net income attributable
to DT Midstream, the most comparable GAAP measure, as an
indicator of operating performance and are not necessarily
comparable to similarly titled measures reported by other
companies.
Reconciliation of net income attributable to DT Midstream to
Adjusted EBITDA or DCF as projected for full-year 2023 is not
provided. We do not forecast net income as we cannot, without
unreasonable efforts, estimate or predict with certainty the
components of net income. These components, net of tax, may
include, but are not limited to, impairments of assets and other
charges, divestiture costs, acquisition costs, or changes in
accounting principles. All of these components could
significantly impact such financial measures. At this time,
management is not able to estimate the aggregate impact, if any,
of these items on future period reported earnings. Accordingly,
we are not able to provide a corresponding GAAP equivalent for
Adjusted EBITDA or DCF.
DT Midstream
37

Non-GAAP Definitions
Operating Earnings and Operating Earnings per share are non-GAAP
measures Use of Operating Earnings Information - Operating
Earnings exclude non-recurring items, certain mark-to-market
adjustments and discontinued operations. DT Midstream management
believes that Operating Earnings provide a more meaningful
representation of the company's earnings from ongoing operations
and uses Operating Earnings as the primary performance
measurement for external communications with analysts and
investors. Internally, DT Midstream uses Operating Earnings to
measure performance against budget and to report to the Board of
Directors.
In this presentation, DT Midstream provides guidance for future
period Operating Earnings. It is likely that certain items that
impact the company's future period reported results will be
excluded from operating results. A reconciliation to the
comparable future period reported earnings is not provided
because it is not possible to provide a reliable forecast of
specific line items (i.e., future non-recurring items, certain
mark-to-market adjustments and discontinued operations). These
items may fluctuate significantly from period to period and may
have a significant impact on reported earnings. DT Midstream
38

Non-GAAP Reconciliations
Reconciliation of Reported to Operating Earnings
Three Months Ended
December 31, 2023 September 30,2023
Reported Earnings Pre-tax Adjustments Income Taxes (1) Operating Earnings Reported Earnings Pre-tax
Adjustments Income Taxes (1) Operating Earnings
(millions)
Adjustments $ - $ - $ - $ -
Net Income Attributable to DT Midstream $ 121 $ - $ - $ 121 $ 91 $ - $ - $ 91
Year Ended
December 31, 2023 December 31, 2022
Reported Earnings Pre-tax Adjustments Income Taxes (1) Operating Earnings Reported Earnings Pre-tax
Adjustments Income Taxes (1) Operating Earnings
(millions)
State income tax adjustment $ - $ - $ - $ (25) A
Equity method investee goodwill impairment - - 7 B (1)
Gain on sale - - (17) C 5
Net Income Attributes to DT Midstream $ 384 $ - $ - $ 384 $ 370 $ (10) $ (21) $ 339
(1) Excluding tax related adjustments, the amount of income taxes
was calculated based on a combined federal and state income tax
rate, considering the applicable jurisdictions of the respective
segments and deductibility of specific operating adjustments
Adjustments Key
A State tax rate reduction impact to deferred income tax expense
due to enacted tax legislation B Equity method investee goodwill
impairment - recorded in Earnings from equity method investees C
Gain on sale of certain assets in the Utica shale region -
recorded in Assets (gains) losses and impairments, net.
DT Midstream
39

Non-GAAP Reconciliations
Reconciliation of Reported to Operating Earnings per diluted share(2)
Three Months Ended
December 31, 2023 September 30, 2023
Reported Earnings Pre-tax Adjustments Income Taxes (1) Operating Earnings Reported Earnings Pre-tax
Adjustments Income Taxes (1) Operating Earnings
(per share)
Adjustments $ - $ - $ - $ -
Net Income Attributable to DT Midstream $ 1.24 $ - $ - $ 1.24 $ 0.94 $ - $ - $ 0.94
Year Ended
December 31, 2023 December 31, 2022
Reported Earnings Pre-tax Adjustments Income Taxes (1) Operating Earnings Reported Earnings Pre-tax
Adjustments Income Taxes (1) Operating Earnings
(per share)
State income tax adjustment $ - $ - $ - $ (0.26) A
Equity method investee goodwill impairment - - 0.08 B (0.03)
Gain on sale - - (0.17) C 0.05
Net Income Attributes to DT Midstream $ 3.94 $ - $ - $ - $ 3.94 $ 3.81 $ (0.09) $ (0.24) $ 3.48
(1) Excluding tax related adjustments, the amount of income taxes
was calculated based on a combined federal and state income tax
rate, considering the applicable jurisdictions of the respective
segments and deductibility of specific operating adjustments (2)
Per share amounts are divided by Weighted Average Common Shares
Outstanding - Diluted, as noted on the
Consolidated Statements of Operations
Adjustments Key
A State tax rate reduction impact to deferred income tax expense
due to enacted tax legislation B Equity method investee goodwill
impairment - recorded in Earnings from equity method investees C
Gain on sale of certain assets in the Utica shale region -
recorded in Assets (gains) losses and impairments, net.
DT Midstream
40

Non-GAAP Reconciliations
Reconciliation of Net Income Attributable to DT Midstream to Adjusted EBITDA
Three Months Ended Year Ended
December 31, 2023 September 30, 2023 December 31, 2023 December 31, 2022
Consolidated (millions)
Net Income Attributable to DT Midstream $ 121 $ 91 $ 384 $ 370
Plus: Interest expense $ 39 $ 38 $ 150 $ 137
Plus: Income tax expense 2 33 104 100
Plus: Depreciation and amortization 49 46 182 170
Plus: Loss from financing activities - - - 13
Plus: EBITDA from equity method investees (1) 74 70 286 217
Plus: Adjustments for non-routine items (2) - - - (10)
Less: Interest income - - (1) (3)
Less: Earnings from equity method investees (45) (41) (177) (150)
Less: Depreciation and amortization attributable to noncontrolling interests (1) (1) (4) (3)
Adjusted EBITDA $ 239 $ 236 $ 924 $ 841
(1) Includes share of our equity method investees' earnings
before interest, taxes, depreciation and amortization, which we
refer to as "EBITDA." A reconciliation of earnings from earnings
from equity method investees to EBITDA from equity method
investees follows: Three Months Ended Year Ended
December 31, 2023 September 30, 2023 December 31, 2023 December 31, 2022
(millions)
Earnings from equity methods investees $ 45 $ 41 $ 177 $ 150
Plus: Depreciation and amortization attributable to equity method investees 21 20 82 56
Plus: Interest expense attributable to equity method investees 8 9 27 11
EBITDA from equity method investees $ 74 $ 70 $ 286 $ 217
(2) Adjusted EBITDA calculation excludes certain items we
consider non-routine. For the year ended December 31, 2022,
adjustments for non-routine items included a $17 million gain on
sale of certain assets in the Utica shale region, partially
offset by an equity method investee goodwill impairment of $7
million. DT Midstream
41

Non-GAAP Reconciliations
Reconciliation of Net Income Attributable to DT Midstream to Adjusted EBITDA Pipeline Segment
Three Months Ended Year Ended
December 31, 2023 September 30, 2023 December 31, 2023 December 31, 2022
Pipeline (millions)
Net Income Attributable to DT Midstream $ 93 $ 64 $ 278 $ 228
Plus: Interest expense 13 13 55 57
Plus: Income tax expense 3 23 75 62
Plus: Depreciation and amortization 19 17 69 63
Plus: Loss from financing activities - - - 6
Plus: EBITDA from equity method investees (1) 74 70 286 217
Plus: Adjustments for non-routine items (2) - - - 7
Less: Interest income - - (1) (1)
Less: Earnings from equity method investees (45) (41) (177) (150)
Less: Depreciation and amortization attributable to noncontrolling interests (1) (1) (4) (3)
Adjusted EBITDA $ 156 $ 145 $ 581 $ 486
(1) Includes share of our equity method investees' earnings
before interest, taxes, depreciation and amortization, which we
refer to as "EBITDA." A reconciliation of earnings from earnings
from equity method investees to EBITDA from equity method
investees follows: Three Months Ended Year Ended
December 31, 2023 September 30, 2023 December 31, 2023 December 31, 2022
(millions)
Earnings from equity methods investees $ 45 $ 41 $ 177 $ 150
Plus: Depreciation and amortization attributable to equity method investees 21 20 82 56
Plus: Interest expense attributable to equity method investees 8 9 27 11
EBITDA from equity method investees $ 74 $ 70 $ 286 $ 217
(2) Adjusted EBITDA calculation excludes certain items we
consider non-routine. For the year ended December 31, 2022,
adjustments for non-routine items included a $17 million gain on
sale of certain assets in the Utica shale region, partially
offset by an equity method investee goodwill impairment of $7
million. DT Midstream
42

Non-GAAP Reconciliations
Reconciliation of Net Income Attributable to DT Midstream to Adjusted EBITDA Gathering Segment
Three Months Ended Year Ended
December 31, 2023 September 30 ,2023 December 31, 2023 December 31, 2022
Gathering (millions)
Net Income Attributable to DT Midstream $ 28 $ 27 $ 106 $ 142
Plus: Interest expense 26 25 95 80
Plus: Income tax expense (1) 10 29 38
Plus: Depreciation and amortization 30 29 113 107
Plus: Loss from financing activities - - - 7
Plus: Adjustments for non-routine items (1) - - - (17)
Less: Interest income - - - (2)
Adjusted EBITDA $ 83 $ 91 $ 343 $ 355
(1) Adjusted EBITDA calculation excludes certain items we
consider non-routine. For the year ended December 31, 2022,
adjustments for non-routine items included a $17 million gain on
sale of certain assets in the Utica shale region DT Midstream
43

Non-GAAP Reconciliations
Reconciliation of Net Income Attributable to DT Midstream to Distributable Cash Flow
Three Months Ended Year Ended
December 31, 2023 September 30, 2023 December 31, 2023 December 31, 2022
(millions)
Net Income Attributable to DT Midstream $ 121 $ 91 $ 384 $ 370
Plus: Interest expense 39 38 150 137
Plus: Income tax expense 2 33 104 100
Plus: Depreciation and amortization 49 46 182 170
Plus: Loss from financing activities - - - 13
Plus: Adjustments for non-routine items (1) - - (371) (17)
Less: Earnings from equity method investees (45) (41) (177) (150)
Less: Depreciation and amortization attributable to noncontrolling interests (1) (1) (4) (3)
Plus: Dividends and distributions from equity method investees 66 48 623 198
Less: Cash interest expense (64) (7) (140) (125)
Less: Cash taxes (1) (3) (22) (24)
Less: Maintenance capital investment(2) (7) (11) (29) (22)
Distributable Cash Flow $ 159 $ 193 $ 700 $ 647
(1) Distributable Cash Flow calculation excludes certain items we
consider non-routine. For the year ended December 31, 2023,
adjustments for non-routine items included the $371 million NEXUS
financing distribution. For the year ended December 31, 2022,
adjustments for non-routine items included a $17 million gain on
sale of certain assets in the Utica shale region (2) Maintenance
capital investment is defined as the total capital expenditures
used to maintain or preserve
assets or fulfill contractual obligations that do not generate incremental earnings.
44

Non-GAAP Reconciliations
Reconciliation of Net Income Attributable to DT Midstream to Adjusted EBITDA
Year Ended
December 31, 2021 December 31, 2020
Net Income Attributable to DT Midstream $ 307 $ 312
Plus: Interest expense 112 113
Plus: Income tax expense 104 116
Plus: Depreciation and amortization 166 152
Plus: EBITDA from equity method investees (1) 184 164
Plus: Adjustments for non-routine items (2) 39 (16)
Less: Interest income (4) (9)
Less: Earnings from equity method investees (126) (108)
Less: Depreciation and amortization attributable to noncontrolling interests (4) (4)
Adjusted EBITDA $ 778 $ 720
Includes share of our equity method investees' earnings before
interest taxes, depreciation and amortization, which we refer to
as "EBITDA." A reconciliation of earnings from equity method
investees to EBITDA from equity method investees follows: Year
Ended
December 31, 2021 December 31, 2020
Earnings from equity methods investees $ 126 $ 108
Plus: Depreciation and amortization attributable to equity method investees 48 46
Plus: Interest expense attributable to equity method investees 10 10
EBITDA from equity method investees $ 184 $ 164
(2) Adjusted EBITDA calculation excludes certain items we
consider non-routine. For the year ended December 31, 2021,
adjustments for non-routine items included (i) $19 million loss
on notes receivable and (ii) $20 million of separation related
transaction costs. For the year ended December 31, 2020,
adjustments for non-routine items included (i) $20 million
post-acquisition settlement, partially offset by (ii) $4 million
of separation related transaction costs. DT Midstream
45
v3.24.0.1
Cover
|
Feb. 16, 2024 |
| Cover [Abstract] |
|
| Document Type |
8-K
|
| Amendment Flag |
false
|
| Document Period End Date |
Feb. 16, 2024
|
| Entity File Number |
1-40392
|
| Entity Registrant Name |
DT Midstream, Inc
|
| Entity Central Index Key |
0001842022
|
| Entity Tax Identification Number |
38-2663964
|
| Entity Incorporation, State or Country Code |
DE
|
| Entity Address, Address Line One |
500 Woodward Ave.
|
| Entity Address, Address Line Two |
Suite 2900
|
| Entity Address, City or Town |
Detroit
|
| Entity Address, State or Province |
MI
|
| Entity Address, Postal Zip Code |
48226-1279
|
| City Area Code |
(313)
|
| Local Phone Number |
402-8532
|
| Written Communications |
false
|
| Soliciting Material |
false
|
| Pre-commencement Tender Offer |
false
|
| Pre-commencement Issuer Tender Offer |
false
|
| Title of 12(b) Security |
Common stock, par value $0.01
|
| Trading Symbol |
DTM
|
| Security Exchange Name |
NYSE
|
| Entity Emerging Growth Company |
false
|
| X |
- DefinitionBoolean flag that is true when the XBRL content amends previously-filed or accepted submission.
| Name: |
dei_AmendmentFlag |
| Namespace Prefix: |
dei_ |
| Data Type: |
xbrli:booleanItemType |
| Balance Type: |
na |
| Period Type: |
duration |
|
| X |
- DefinitionFor the EDGAR submission types of Form 8-K: the date of the report, the date of the earliest event reported; for the EDGAR submission types of Form N-1A: the filing date; for all other submission types: the end of the reporting or transition period. The format of the date is YYYY-MM-DD.
| Name: |
dei_DocumentPeriodEndDate |
| Namespace Prefix: |
dei_ |
| Data Type: |
xbrli:dateItemType |
| Balance Type: |
na |
| Period Type: |
duration |
|
| X |
- DefinitionThe type of document being provided (such as 10-K, 10-Q, 485BPOS, etc). The document type is limited to the same value as the supporting SEC submission type, or the word 'Other'.
| Name: |
dei_DocumentType |
| Namespace Prefix: |
dei_ |
| Data Type: |
dei:submissionTypeItemType |
| Balance Type: |
na |
| Period Type: |
duration |
|
| X |
- DefinitionAddress Line 1 such as Attn, Building Name, Street Name
| Name: |
dei_EntityAddressAddressLine1 |
| Namespace Prefix: |
dei_ |
| Data Type: |
xbrli:normalizedStringItemType |
| Balance Type: |
na |
| Period Type: |
duration |
|
| X |
- DefinitionAddress Line 2 such as Street or Suite number
| Name: |
dei_EntityAddressAddressLine2 |
| Namespace Prefix: |
dei_ |
| Data Type: |
xbrli:normalizedStringItemType |
| Balance Type: |
na |
| Period Type: |
duration |
|
| X |
- Definition
+ References
+ Details
| Name: |
dei_EntityAddressCityOrTown |
| Namespace Prefix: |
dei_ |
| Data Type: |
xbrli:normalizedStringItemType |
| Balance Type: |
na |
| Period Type: |
duration |
|
| X |
- DefinitionCode for the postal or zip code
| Name: |
dei_EntityAddressPostalZipCode |
| Namespace Prefix: |
dei_ |
| Data Type: |
xbrli:normalizedStringItemType |
| Balance Type: |
na |
| Period Type: |
duration |
|
| X |
- DefinitionName of the state or province.
| Name: |
dei_EntityAddressStateOrProvince |
| Namespace Prefix: |
dei_ |
| Data Type: |
dei:stateOrProvinceItemType |
| Balance Type: |
na |
| Period Type: |
duration |
|
| X |
- DefinitionA unique 10-digit SEC-issued value to identify entities that have filed disclosures with the SEC. It is commonly abbreviated as CIK. Reference 1: http://www.xbrl.org/2003/role/presentationRef
-Publisher SEC
-Name Exchange Act
-Number 240
-Section 12
-Subsection b-2
| Name: |
dei_EntityCentralIndexKey |
| Namespace Prefix: |
dei_ |
| Data Type: |
dei:centralIndexKeyItemType |
| Balance Type: |
na |
| Period Type: |
duration |
|
| X |
- DefinitionIndicate if registrant meets the emerging growth company criteria. Reference 1: http://www.xbrl.org/2003/role/presentationRef
-Publisher SEC
-Name Exchange Act
-Number 240
-Section 12
-Subsection b-2
| Name: |
dei_EntityEmergingGrowthCompany |
| Namespace Prefix: |
dei_ |
| Data Type: |
xbrli:booleanItemType |
| Balance Type: |
na |
| Period Type: |
duration |
|
| X |
- DefinitionCommission file number. The field allows up to 17 characters. The prefix may contain 1-3 digits, the sequence number may contain 1-8 digits, the optional suffix may contain 1-4 characters, and the fields are separated with a hyphen.
| Name: |
dei_EntityFileNumber |
| Namespace Prefix: |
dei_ |
| Data Type: |
dei:fileNumberItemType |
| Balance Type: |
na |
| Period Type: |
duration |
|
| X |
- DefinitionTwo-character EDGAR code representing the state or country of incorporation.
| Name: |
dei_EntityIncorporationStateCountryCode |
| Namespace Prefix: |
dei_ |
| Data Type: |
dei:edgarStateCountryItemType |
| Balance Type: |
na |
| Period Type: |
duration |
|
| X |
- DefinitionThe exact name of the entity filing the report as specified in its charter, which is required by forms filed with the SEC. Reference 1: http://www.xbrl.org/2003/role/presentationRef
-Publisher SEC
-Name Exchange Act
-Number 240
-Section 12
-Subsection b-2
| Name: |
dei_EntityRegistrantName |
| Namespace Prefix: |
dei_ |
| Data Type: |
xbrli:normalizedStringItemType |
| Balance Type: |
na |
| Period Type: |
duration |
|
| X |
- DefinitionThe Tax Identification Number (TIN), also known as an Employer Identification Number (EIN), is a unique 9-digit value assigned by the IRS. Reference 1: http://www.xbrl.org/2003/role/presentationRef
-Publisher SEC
-Name Exchange Act
-Number 240
-Section 12
-Subsection b-2
| Name: |
dei_EntityTaxIdentificationNumber |
| Namespace Prefix: |
dei_ |
| Data Type: |
dei:employerIdItemType |
| Balance Type: |
na |
| Period Type: |
duration |
|
| X |
- DefinitionLocal phone number for entity.
| Name: |
dei_LocalPhoneNumber |
| Namespace Prefix: |
dei_ |
| Data Type: |
xbrli:normalizedStringItemType |
| Balance Type: |
na |
| Period Type: |
duration |
|
| X |
- DefinitionBoolean flag that is true when the Form 8-K filing is intended to satisfy the filing obligation of the registrant as pre-commencement communications pursuant to Rule 13e-4(c) under the Exchange Act. Reference 1: http://www.xbrl.org/2003/role/presentationRef
-Publisher SEC
-Name Exchange Act
-Number 240
-Section 13e
-Subsection 4c
| Name: |
dei_PreCommencementIssuerTenderOffer |
| Namespace Prefix: |
dei_ |
| Data Type: |
xbrli:booleanItemType |
| Balance Type: |
na |
| Period Type: |
duration |
|
| X |
- DefinitionBoolean flag that is true when the Form 8-K filing is intended to satisfy the filing obligation of the registrant as pre-commencement communications pursuant to Rule 14d-2(b) under the Exchange Act. Reference 1: http://www.xbrl.org/2003/role/presentationRef
-Publisher SEC
-Name Exchange Act
-Number 240
-Section 14d
-Subsection 2b
| Name: |
dei_PreCommencementTenderOffer |
| Namespace Prefix: |
dei_ |
| Data Type: |
xbrli:booleanItemType |
| Balance Type: |
na |
| Period Type: |
duration |
|
| X |
- DefinitionTitle of a 12(b) registered security. Reference 1: http://www.xbrl.org/2003/role/presentationRef
-Publisher SEC
-Name Exchange Act
-Number 240
-Section 12
-Subsection b
| Name: |
dei_Security12bTitle |
| Namespace Prefix: |
dei_ |
| Data Type: |
dei:securityTitleItemType |
| Balance Type: |
na |
| Period Type: |
duration |
|
| X |
- DefinitionName of the Exchange on which a security is registered. Reference 1: http://www.xbrl.org/2003/role/presentationRef
-Publisher SEC
-Name Exchange Act
-Number 240
-Section 12
-Subsection d1-1
| Name: |
dei_SecurityExchangeName |
| Namespace Prefix: |
dei_ |
| Data Type: |
dei:edgarExchangeCodeItemType |
| Balance Type: |
na |
| Period Type: |
duration |
|
| X |
- DefinitionBoolean flag that is true when the Form 8-K filing is intended to satisfy the filing obligation of the registrant as soliciting material pursuant to Rule 14a-12 under the Exchange Act. Reference 1: http://www.xbrl.org/2003/role/presentationRef
-Publisher SEC
-Name Exchange Act
-Section 14a
-Number 240
-Subsection 12
| Name: |
dei_SolicitingMaterial |
| Namespace Prefix: |
dei_ |
| Data Type: |
xbrli:booleanItemType |
| Balance Type: |
na |
| Period Type: |
duration |
|
| X |
- DefinitionTrading symbol of an instrument as listed on an exchange.
| Name: |
dei_TradingSymbol |
| Namespace Prefix: |
dei_ |
| Data Type: |
dei:tradingSymbolItemType |
| Balance Type: |
na |
| Period Type: |
duration |
|
| X |
- DefinitionBoolean flag that is true when the Form 8-K filing is intended to satisfy the filing obligation of the registrant as written communications pursuant to Rule 425 under the Securities Act. Reference 1: http://www.xbrl.org/2003/role/presentationRef
-Publisher SEC
-Name Securities Act
-Number 230
-Section 425
| Name: |
dei_WrittenCommunications |
| Namespace Prefix: |
dei_ |
| Data Type: |
xbrli:booleanItemType |
| Balance Type: |
na |
| Period Type: |
duration |
|
DT Midstream (NYSE:DTM)
Graphique Historique de l'Action
De Jan 2025 à Fév 2025

DT Midstream (NYSE:DTM)
Graphique Historique de l'Action
De Fév 2024 à Fév 2025

