Form NPORT-P - Monthly Portfolio Investments Report on Form N-PORT (Public)
29 Novembre 2023 - 5:23PM
Edgar (US Regulatory)
The
Gabelli
Utility
Trust
Schedule
of
Investments
—
September
30,
2023
(Unaudited)
Shares
Market
Value
COMMON
STOCKS
—
85.7%
ENERGY
AND
UTILITIES
—
71.7%
Alternative
Energy
—
1.0%
2,950
Brookfield
Renewable
Corp.,
Cl. A
......
$
70,623
3,300
Clearway
Energy
Inc.,
Cl. C
..........
69,828
6,100
Eos
Energy
Enterprises
Inc.†
.........
13,115
2,700
Landis+Gyr
Group
AG
..............
195,564
46,250
NextEra
Energy
Partners
LP
..........
1,373,625
12,500
Ormat
Technologies
Inc.
............
874,000
600
Orsted
AS
......................
32,754
180
SolarEdge
Technologies
Inc.†
.........
23,312
6,000
Vestas
Wind
Systems
A/S†
..........
128,906
2,781,727
Diversified
Industrial
—
0.9%
2,000
Alstom
SA
......................
47,788
17,294
AZZ
Inc.
........................
788,261
17,000
Bouygues
SA
....................
595,633
300
Chart
Industries
Inc.†
..............
50,736
10,000
General
Electric
Co.
................
1,105,500
200
Sulzer
AG
.......................
19,151
2,607,069
Electric
Integrated
—
39.7%
23,000
ALLETE
Inc.
.....................
1,214,400
78,250
Alliant
Energy
Corp.
...............
3,791,213
17,150
Ameren
Corp.
....................
1,283,334
50,950
American
Electric
Power
Co.
Inc.
......
3,832,459
1,800
Atlantica
Sustainable
Infrastructure
plc
..
34,380
64,000
Avangrid
Inc.
....................
1,930,880
50,000
Avista
Corp.
.....................
1,618,500
400
Badger
Meter
Inc.
.................
57,548
33,000
Black
Hills
Corp.
..................
1,669,470
7,500
CenterPoint
Energy
Inc.
.............
201,375
80,300
CMS
Energy
Corp.
................
4,264,733
46,500
Dominion
Energy
Inc.
..............
2,077,155
16,800
DTE
Energy
Co.
..................
1,667,904
72,700
Duke
Energy
Corp.
................
6,416,502
65,000
Edison
International
...............
4,113,850
7,000
Emera
Inc.
......................
244,388
4,200
Entergy
Corp.
....................
388,500
140,500
Evergy
Inc.
......................
7,123,350
114,700
Eversource
Energy
................
6,669,805
100,200
FirstEnergy
Corp.
.................
3,424,836
74,500
Hawaiian
Electric
Industries
Inc.
.......
917,095
3,700
IDACORP
Inc.
....................
346,505
58,000
MGE
Energy
Inc.
..................
3,973,580
196,500
NextEra
Energy
Inc.
................
11,257,485
48,000
NiSource
Inc.
....................
1,184,640
72,500
Northwestern
Energy
Group
Inc.
.......
3,484,350
180,000
OGE
Energy
Corp.
.................
5,999,400
59,700
Otter
Tail
Corp.
...................
4,532,424
55,000
PG&E
Corp.†
....................
887,150
Shares
Market
Value
1,100
Pinnacle
West
Capital
Corp.
..........
$
81,048
83,500
PNM
Resources
Inc.
...............
3,724,935
58,250
Portland
General
Electric
Co.
.........
2,357,960
21,700
PPL
Corp.
......................
511,252
31,450
Public
Service
Enterprise
Group
Inc.
....
1,789,820
1,600
Sempra
........................
108,848
3,600
The
Southern
Co.
.................
232,992
17,000
Unitil
Corp.
......................
726,070
123,200
WEC
Energy
Group
Inc.
.............
9,923,760
142,850
Xcel
Energy
Inc.
..................
8,173,877
112,237,773
Electric
Transmission
and
Distribution
—
3.1%
31,500
Consolidated
Edison
Inc.
............
2,694,195
20,700
Constellation
Energy
Corp.
...........
2,257,956
66,100
Exelon
Corp.
.....................
2,497,919
110,000
Iberdrola
SA
.....................
1,232,172
300
The
Timken
Co.
...................
22,047
8,704,289
Energy
and
Utilities:
Natural
Resources
—
0.0%
1,080
Occidental
Petroleum
Corp.
..........
70,070
Energy
and
Utilities:
Services
—
0.0%
5,695
RPC
Inc.
.......................
50,913
Environmental
Services
—
0.3%
800
Fluidra
SA
......................
16,383
200
Tetra
Tech
Inc.
...................
30,406
27,712
Veolia
Environnement
SA
............
803,658
850,447
Equipment
and
Supplies
—
0.9%
5,000
Capstone
Green
Energy
Corp.†
........
3,545
3,655
Graham
Corp.†
...................
60,673
10,000
MDU
Resources
Group
Inc.
..........
195,800
27,700
Mueller
Industries
Inc.
..............
2,081,932
1,100
Valmont
Industries
Inc.
.............
264,231
2,606,181
Global
Utilities
—
2.6%
8,000
Chubu
Electric
Power
Co.
Inc.
........
102,088
7,595
EDP
-
Energias
de
Portugal
SA
........
31,605
117,000
Electric
Power
Development
Co.
Ltd.
....
1,893,108
34,000
Endesa
SA
......................
692,869
300,000
Enel
SpA
.......................
1,845,959
560,000
Hera
SpA
.......................
1,533,435
15,000
Hokkaido
Electric
Power
Co.
Inc.
......
65,464
13,000
Hokuriku
Electric
Power
Co.†
.........
70,115
220,000
Huaneng
Power
International
Inc.,
Cl. H†
.
106,756
40,000
Korea
Electric
Power
Corp.,
ADR†
......
257,600
22,000
Kyushu
Electric
Power
Co.
Inc.†
.......
143,595
10,000
Shikoku
Electric
Power
Co.
Inc.
.......
68,489
7,500
The
Chugoku
Electric
Power
Co.
Inc.
....
46,177
The
Gabelli
Utility
Trust
Schedule
of
Investments
(Continued)
—
September
30,
2023
(Unaudited)
Shares
Market
Value
COMMON
STOCKS
(Continued)
ENERGY
AND
UTILITIES
(Continued)
Global
Utilities
(Continued)
25,000
The
Kansai
Electric
Power
Co.
Inc.
.....
$
347,548
11,000
Tohoku
Electric
Power
Co.
Inc.
........
71,223
7,276,031
Merchant
Energy
—
1.3%
240,000
The
AES
Corp.
...................
3,648,000
Natural
Gas
Integrated
—
6.3%
8,000
DT
Midstream
Inc.
................
423,360
85,000
Energy
Transfer
LP
................
1,192,550
105,000
Kinder
Morgan
Inc.
................
1,740,900
105,000
National
Fuel
Gas
Co.
..............
5,450,550
142,000
ONEOK
Inc.
.....................
9,007,060
17,814,420
Natural
Gas
Utilities
—
6.4%
25,500
Atmos
Energy
Corp.
...............
2,701,215
9,000
Chesapeake
Utilities
Corp.
...........
879,750
13,200
Engie
SA
.......................
202,777
69,000
National
Grid
plc,
ADR
..............
4,183,470
30,300
ONE
Gas
Inc.
....................
2,068,884
42,000
RGC
Resources
Inc.
...............
726,600
118,915
Southwest
Gas
Holdings
Inc.
.........
7,183,655
1,200
Spire
Inc.
.......................
67,896
600
UGI
Corp.
.......................
13,800
18,028,047
Natural
Resources
—
1.8%
57,370
Cameco
Corp.
....................
2,274,147
30,000
Compania
de
Minas
Buenaventura
SAA,
ADR
.........................
255,600
19,800
Exxon
Mobil
Corp.
................
2,328,084
2,200
Hess
Corp.
......................
336,600
5,194,431
Oil
—
0.1%
310
Chevron
Corp.
...................
52,272
4,500
Devon
Energy
Corp.
...............
214,650
266,922
Services
—
2.0%
22,000
ABB
Ltd.,
ADR
...................
782,980
15,000
Dril-Quip
Inc.†
...................
422,550
99,500
Enbridge
Inc.
....................
3,302,405
33,000
Halliburton
Co.
...................
1,336,500
5,844,435
Water
—
5.3%
26,000
American
States
Water
Co.
...........
2,045,680
22,400
American
Water
Works
Co.
Inc.
.......
2,773,792
23,000
Artesian
Resources
Corp.,
Cl. A
.......
965,770
33,200
California
Water
Service
Group
........
1,570,692
Shares
Market
Value
26,400
Essential
Utilities
Inc.
..............
$
906,312
6,700
Middlesex
Water
Co.
...............
443,875
143,000
Severn
Trent
plc
..................
4,126,317
29,000
SJW
Group
.....................
1,743,190
9,400
The
York
Water
Co.
................
352,406
4,100
Zurn
Elkay
Water
Solutions
Corp.
......
114,882
15,042,916
TOTAL
ENERGY
AND
UTILITIES
......
203,023,671
COMMUNICATIONS
—
10.5%
Cable
and
Satellite
—
2.9%
5,000
Altice
USA
Inc.,
Cl. A†
..............
16,350
2,500
Charter
Communications
Inc.,
Cl. A†
....
1,099,550
20,400
Cogeco
Inc.
.....................
740,002
60,000
DISH
Network
Corp.,
Cl. A†
..........
351,600
18,200
EchoStar
Corp.,
Cl. A†
..............
304,850
250,000
ITV
plc
.........................
215,409
62,000
Liberty
Global
plc,
Cl. A†
............
1,061,440
122,000
Liberty
Global
plc,
Cl. C†
............
2,264,320
90,000
Liberty
Latin
America
Ltd.,
Cl. A†
......
734,400
5,947
Liberty
Latin
America
Ltd.,
Cl. C†
......
48,528
20,000
Rogers
Communications
Inc.,
Cl. B
.....
767,800
32,200
Telenet
Group
Holding
NV
...........
721,040
8,325,289
Communications
Equipment
—
0.1%
8,000
Furukawa
Electric
Co.
Ltd.
...........
127,516
Telecommunications
—
5.4%
36,000
AT&T
Inc.
.......................
540,720
12,000
BCE
Inc.,
New
York
................
458,040
6,047
BCE
Inc.,
Toronto
.................
230,839
100,000
BT
Group
plc,
Cl. A
................
142,386
7,000
Cogeco
Communications
Inc.
.........
324,013
115,000
Deutsche
Telekom
AG
..............
2,415,626
60,000
Deutsche
Telekom
AG,
ADR
..........
1,257,600
21,250
Eurotelesites
AG†
.................
93,012
200
Hutchison
Telecommunications
Hong
Kong
Holdings
Ltd.
..................
27
1,750,000
Nippon
Telegraph
&
Telephone
Corp.
....
2,068,054
158,000
Orange
Belgium
SA†
...............
2,295,205
6,000
Orange
SA,
ADR
..................
68,940
59,000
Orascom
Financial
Holding
SAE†
......
550
10,000
Orascom
Investment
Holding,
GDR†
....
140
30,000
Pharol
SGPS
SA†
.................
1,326
8,500
Proximus
SA
....................
69,179
2,000
PT
Indosat
Tbk
...................
1,271
130,000
Sistema
PJSC
FC,
GDR†(a)
..........
65,000
1,350
Tele2
AB,
Cl. B
...................
10,340
220,000
Telefonica
Deutschland
Holding
AG
.....
394,248
250,000
Telefonica
SA,
ADR
................
1,017,500
85,000
Telekom
Austria
AG
................
593,117
The
Gabelli
Utility
Trust
Schedule
of
Investments
(Continued)
—
September
30,
2023
(Unaudited)
Shares
Market
Value
COMMON
STOCKS
(Continued)
COMMUNICATIONS
(Continued)
Telecommunications
(Continued)
25,000
Telephone
and
Data
Systems
Inc.
......
$
457,750
30,000
Telesat
Corp.†
...................
429,000
5,700
T-Mobile
US
Inc.†
.................
798,285
10,000
VEON
Ltd.,
ADR†
.................
195,000
40,500
Verizon
Communications
Inc.
.........
1,312,605
15,239,773
Wireless
Communications
—
2.1%
5,000
America
Movil
SAB
de
CV,
ADR
.......
86,600
15,500
Anterix
Inc.†
.....................
486,390
103,000
Millicom
International
Cellular
SA,
SDR†
.
1,600,308
1,154
Mobile
TeleSystems
PJSC(a)
.........
165
7,250
Mobile
TeleSystems
PJSC,
ADR†(a)
....
4,423
1,200
Operadora
De
Sites
Mexicanos
SAB
de
CV
991
1,814
SK
Telecom
Co.
Ltd.,
ADR
...........
38,928
400
SmarTone
Telecommunications
Holdings
Ltd.
.........................
202
60,000
Turkcell
Iletisim
Hizmetleri
A/S,
ADR†
...
283,800
32,500
United
States
Cellular
Corp.†
.........
1,396,525
224,000
Vodafone
Group
plc,
ADR
...........
2,123,520
6,021,852
TOTAL
COMMUNICATIONS
.........
29,714,430
OTHER
—
3.2%
Automotive
—
0.1%
45,000
Iveco
Group
NV†
.................
421,621
Building
and
Construction
—
0.1%
2,900
Knife
River
Corp.†
.................
141,607
Diversified
Industrial
—
0.2%
1,200
Accelleron
Industries
AG,
ADR
........
30,974
250
Arcosa
Inc.
......................
17,975
290
ITT
Inc.
........................
28,394
3,820
L.B.
Foster
Co.,
Cl. A†
..............
72,236
500
Matthews
International
Corp.,
Cl. A
.....
19,455
13,500
Trinity
Industries
Inc.
...............
328,725
497,759
Electronics
—
0.5%
1,200
Allient
Inc.
......................
37,104
200
Hubbell
Inc.
.....................
62,682
2,200
Keysight
Technologies
Inc.†
..........
291,082
567
Resideo
Technologies
Inc.†
..........
8,958
14,000
Sony
Group
Corp.,
ADR
.............
1,153,740
1,553,566
Equipment
and
Supplies
—
0.3%
17,500
CIRCOR
International
Inc.†
..........
975,625
Shares
Market
Value
Financial
Services
—
0.1%
150,000
GAM
Holding
AG†
.................
$
74,152
8,000
Kinnevik
AB,
Cl. A†
................
80,692
8,000
Kinnevik
AB,
Cl. B†
................
79,959
234,803
Machinery
—
1.0%
200,000
CNH
Industrial
NV
.................
2,420,000
1,975
Flowserve
Corp.
..................
78,546
571
Medmix
AG
.....................
14,503
2,965
Mueller
Water
Products
Inc.,
Cl. A
.....
37,596
1,830
Xylem
Inc.
......................
166,585
2,717,230
Specialty
Chemicals
—
0.1%
200
Air
Products
and
Chemicals
Inc.
.......
56,680
300
Linde
plc
.......................
111,705
168,385
Transportation
—
0.8%
21,000
GATX
Corp.
.....................
2,285,430
TOTAL
OTHER
.................
8,996,026
INDEPENDENT
POWER
PRODUCERS
AND
ENERGY
TRADERS
—
0.3%
Electric
Integrated
—
0.3%
20,000
NRG
Energy
Inc.
..................
770,400
TOTAL
COMMON
STOCKS
.........
242,504,527
MANDATORY
CONVERTIBLE
SECURITIES(b)
—
0.3%
ENERGY
AND
UTILITIES
—
0.3%
Natural
Gas
Utilities
—
0.3%
17,400
Spire
Inc.,
Ser.
A,
7.500%,
03/01/24
...............
741,553
WARRANTS
—
0.0%
ENERGY
AND
UTILITIES
—
0.0%
Services
—
0.0%
1,425
Weatherford
International
plc,
expire
12/13/23†
.....................
3,420
OTHER
—
0.0%
Financial
Services
—
0.0%
7,500
SDCL
EDGE
Acquisition
Corp.,
expire
12/31/28†
.....................
942
TOTAL
WARRANTS
..............
4,362
The
Gabelli
Utility
Trust
Schedule
of
Investments
(Continued)
—
September
30,
2023
(Unaudited)
Principal
Amount
Market
Value
U.S.
GOVERNMENT
OBLIGATIONS
—
14.0%
$
40,020,000
U.S.
Treasury
Bills,
4.993%
to
5.463%††,
10/19/23
to
02/22/24
......................
$
39,645,209
TOTAL
INVESTMENTS
—
100.0%
....
(Cost
$270,357,384)
.............
$
282,895,651
(a)
Security
is
valued
using
significant
unobservable
inputs
and
is
classified
as
Level
3
in
the
fair
value
hierarchy.
(b)
Mandatory
convertible
securities
are
required
to
be
converted
on
the
dates
listed;
they
generally
may
be
converted
prior
to
these
dates
at
the
option
of
the
holder.
†
Non-income
producing
security.
††
Represents
annualized
yields
at
dates
of
purchase.
ADR
American
Depositary
Receipt
GDR
Global
Depositary
Receipt
SDR
Swedish
Depositary
Receipt
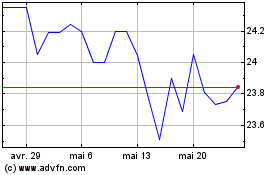
Gabelli Utility (NYSE:GUT-C)
Graphique Historique de l'Action
De Avr 2024 à Mai 2024

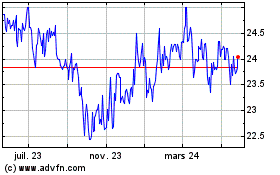
Gabelli Utility (NYSE:GUT-C)
Graphique Historique de l'Action
De Mai 2023 à Mai 2024
