UNITED STATES
SECURITIES AND EXCHANGE COMMISSION
Washington, D.C. 20549
FORM 6-K
REPORT OF FOREIGN PRIVATE ISSUER
PURSUANT TO RULE 13A-16 OR 15D-16 OF
THE SECURITIES EXCHANGE ACT OF 1934
For the month of May 2024
Commission File Number: 001-34244
HUDBAY MINERALS INC.
(Translation of registrant’s name into English)
25 York Street, Suite 800
Toronto, Ontario
M5J 2V5, Canada
(Address of principal executive offices)
Indicate by check mark whether the registrant files or will file annual reports under cover of Form 20-F or Form 40-F.
Form 20-F [ ] Form 40-F [X]
Indicate by check mark if the registrant is submitting the Form 6-K in paper as permitted by Regulation S-T Rule 101(b)(1): [ ]
Indicate by check mark if the registrant is submitting the Form 6-K in paper as permitted by Regulation S-T Rule 101(b)(7): [ ]
Indicate by check mark whether the registrant by furnishing the information contained in this Form is also thereby furnishing the information to the Commission pursuant to Rule 12g3-2(b) under the Securities Exchange Act of 1934.
Yes [ ] No [X]
If “Yes” is marked, indicate below the file number assigned to the registrant in connection with Rule 12g3-2(b): 82- _____________________________
EXPLANATORY NOTE
On May 14, 2024, Hudbay Minerals Inc. (“Hudbay”) filed on the Canadian Securities Administrators’ System for Electronic Document Analysis and Retrieval (SEDAR) website at www.sedarplus.ca the following documents: (1) Unaudited Condensed Consolidated Interim Financial Statements for the period ended March 31, 2024, (2) Management's Discussion and Analysis of Results of Operations and Financial Condition for the period ended March 31, 2024, (3) News Release dated May 14, 2024, (4) Form 52-109F2 Certification of Interim Filings Full Certificate - CEO, (5) Form 52-109F2 Certification of Interim Filings Full Certificate - CFO.
Copies of the filings are attached to this Form 6-K and incorporated herein by reference, as follows:
-
Exhibit 99.1 — Unaudited Condensed Consolidated Interim Financial Statements for the period ended March 31, 2024
-
Exhibit 99.2 — Management's Discussion and Analysis for the period ended March 31, 2024
-
Exhibit 99.3 — News Release dated May 14, 2024
-
Exhibit 99.4 — Form 52-109F2 Certification of Interim Filings Full Certificate - CEO
-
Exhibit 99.5 — Form 52-109F2 Certification of Interim Filings Full Certificate - CFO
2
SIGNATURE
Pursuant to the requirements of the Securities Exchange Act of 1934, the registrant has duly caused this report to be signed on its behalf by the undersigned, thereunto duly authorized.
| |
HUDBAY MINERALS INC. |
| |
(registrant) |
| |
|
|
| |
By: |
/s/ Eugene Lei |
| |
Name: |
Eugene Lei |
| |
Title: |
Chief Financial Officer |
Date: May 14, 2024
3
EXHIBIT INDEX
The following exhibits are furnished as part of this Form 6-K:
4
Unaudited Condensed Consolidated Interim Financial Statements
(In US dollars)
HUDBAY MINERALS INC.
For the three months ended March 31, 2024 and 2023
HUDBAY MINERALS INC.
Condensed Consolidated Interim Balance Sheets
(Unaudited and in thousands of US dollars) |
| |
| |
|
|
Mar. 31, |
|
|
Dec. 31, |
|
| |
Note |
|
2024 |
|
|
2023 |
|
| Assets |
|
|
|
|
|
|
|
| Current assets |
|
|
|
|
|
|
|
| Cash and cash equivalents |
|
$ |
284,385 |
|
$ |
249,794 |
|
| Trade and other receivables |
7 |
|
197,732 |
|
|
203,429 |
|
| Inventories |
8 |
|
201,965 |
|
|
207,334 |
|
| Prepaid expenses and other current assets |
|
|
14,138 |
|
|
6,289 |
|
| Other financial assets |
9 |
|
1,678 |
|
|
4,102 |
|
| Taxes receivable |
|
|
578 |
|
|
2,300 |
|
| |
|
|
700,476 |
|
|
673,248 |
|
| Receivable |
7 |
|
12,010 |
|
|
12,157 |
|
| Inventories |
8 |
|
16,321 |
|
|
24,450 |
|
| Other financial assets |
9 |
|
6,846 |
|
|
7,089 |
|
| Intangibles and other assets |
10 |
|
50,780 |
|
|
52,453 |
|
| Property, plant and equipment |
11 |
|
4,231,536 |
|
|
4,316,006 |
|
| Deferred tax assets |
|
|
139,830 |
|
|
151,946 |
|
| Goodwill |
|
|
73,484 |
|
|
75,285 |
|
| |
|
$ |
5,231,283 |
|
$ |
5,312,634 |
|
| Liabilities |
|
|
|
|
|
|
|
| Current liabilities |
|
|
|
|
|
|
|
| Trade and other payables |
|
$ |
238,977 |
|
$ |
239,149 |
|
| Taxes payable |
|
|
39,941 |
|
|
53,441 |
|
| Other liabilities |
12 |
|
34,685 |
|
|
30,035 |
|
| Other financial liabilities |
13 |
|
43,775 |
|
|
42,235 |
|
| Gold prepayment liability |
14 |
|
37,945 |
|
|
55,901 |
|
| Lease liabilities |
15 |
|
31,920 |
|
|
28,902 |
|
| Deferred revenue |
17 |
|
72,383 |
|
|
87,672 |
|
| |
|
|
499,626 |
|
|
537,335 |
|
| Other financial liabilities |
13 |
|
58,835 |
|
|
51,720 |
|
| Lease liabilities |
15 |
|
60,236 |
|
|
61,433 |
|
| Long-term debt |
16 |
|
1,278,587 |
|
|
1,287,536 |
|
| Deferred revenue |
17 |
|
329,142 |
|
|
330,848 |
|
| Pension obligations |
|
|
5,786 |
|
|
6,010 |
|
| Other employee benefits |
|
|
97,863 |
|
|
101,849 |
|
| Environmental and other provisions |
18 |
|
301,342 |
|
|
321,912 |
|
| Deferred tax liabilities |
|
|
388,833 |
|
|
407,152 |
|
| |
|
|
3,020,250 |
|
|
3,105,795 |
|
| Equity |
|
|
|
|
|
|
|
| Share capital |
20b |
|
2,241,841 |
|
|
2,240,233 |
|
| Reserves |
|
|
19,523 |
|
|
30,177 |
|
| Retained earnings |
|
|
(153,832 |
) |
|
(173,599 |
) |
| Equity attributable to owners of the Company |
|
|
2,107,532 |
|
|
2,096,811 |
|
| Non-controlling interest |
|
|
103,501 |
|
|
110,028 |
|
| |
|
$ |
5,231,283 |
|
$ |
5,312,634 |
|
HUDBAY MINERALS INC.
Condensed Consolidated Interim Statement of Earnings
(Unaudited and in thousands of US dollars, except per share amounts) |
| |
| |
Note |
|
|
Three months ended March 31, |
|
| |
|
2024 |
|
|
2023 |
|
| Revenue |
6a |
|
$ |
524,989 |
|
$ |
295,219 |
|
| Cost of sales |
|
|
|
|
|
|
|
|
| Mine operating costs |
|
|
|
263,762 |
|
|
161,284 |
|
| Depreciation and amortization |
6b |
|
|
109,273 |
|
|
67,422 |
|
| |
|
|
|
373,035 |
|
|
228,706 |
|
| Gross profit |
|
|
|
151,954 |
|
|
66,513 |
|
| Selling and administrative expenses |
|
|
|
16,607 |
|
|
9,146 |
|
| Exploration expenses |
|
|
|
12,593 |
|
|
8,242 |
|
| Other expenses |
6c |
|
|
16,260 |
|
|
4,959 |
|
| Re-evaluation adjustment - environmental provision |
18 |
|
|
(5,269 |
) |
|
(8,240 |
) |
| Results from operating activities |
|
|
|
111,763 |
|
|
52,406 |
|
| Net interest expense on long term debt |
6d |
|
|
19,208 |
|
|
17,007 |
|
| Accretion on streaming arrangements |
6d |
|
|
6,176 |
|
|
6,501 |
|
| Change in fair value of financial instruments |
6d |
|
|
6,954 |
|
|
5,597 |
|
| Other net finance costs |
6d |
|
|
11,675 |
|
|
5,871 |
|
| Net finance expense |
|
|
|
44,013 |
|
|
34,976 |
|
| Earnings before tax |
|
|
|
67,750 |
|
|
17,430 |
|
| Tax expense |
19 |
|
|
49,215 |
|
|
11,973 |
|
| Net earnings for the period |
|
|
$ |
18,535 |
|
$ |
5,457 |
|
| |
|
|
|
|
|
|
|
|
| Attributable to: |
|
|
|
|
|
|
|
|
| Owners of the Company |
|
|
$ |
22,358 |
|
$ |
5,457 |
|
| Non-controlling interest |
|
|
|
(3,823 |
) |
|
- |
|
| Net earnings for the period |
|
|
$ |
18,535 |
|
$ |
5,457 |
|
| |
|
|
|
|
|
|
|
|
| Net earnings per share |
|
|
|
|
|
|
|
|
| Basic and diluted |
|
|
$ |
0.05 |
|
$ |
0.02 |
|
| |
|
|
|
|
|
|
|
|
| Weighted average number of common shares outstanding: |
|
|
|
|
|
|
|
|
| Basic |
21 |
|
|
350,781,240 |
|
|
262,030,805 |
|
| Diluted |
21 |
|
|
350,970,348 |
|
|
262,324,929 |
|
HUDBAY MINERALS INC.
Condensed Consolidated Interim Statements of Comprehensive Income (Loss)
(Unaudited and in thousands of US dollars) |
| |
| |
|
Three months ended March 31, |
|
| |
|
2024 |
|
|
2023 |
|
| Net earnings for the period |
$ |
18,535 |
|
$ |
5,457 |
|
| |
|
|
|
|
|
|
| Other comprehensive income: |
|
|
|
|
|
|
| Item that will be reclassified subsequently to net earnings: |
|
|
|
|
|
|
| Recognized directly in equity: |
|
|
|
|
|
|
| Net (loss) gain on translation of foreign currency balances |
|
(16,821 |
) |
|
136 |
|
| |
|
(16,821 |
) |
|
136 |
|
| |
|
|
|
|
|
|
| Items that will not be reclassified subsequently to net earnings: |
|
|
|
|
|
|
| Recognized directly in equity: |
|
|
|
|
|
|
| Gold prepayment revaluation |
|
(15 |
) |
|
15 |
|
| Tax effect |
|
4 |
|
|
(4 |
) |
| Remeasurement - actuarial loss (gain) |
|
3,575 |
|
|
(1,245 |
) |
| Tax effect |
|
19 |
|
|
(270 |
) |
| |
|
3,583 |
|
|
(1,504 |
) |
| |
|
|
|
|
|
|
| Other comprehensive loss net of tax, for the period |
|
(13,238 |
) |
|
(1,368 |
) |
| |
|
|
|
|
|
|
| Attributable to: |
|
|
|
|
|
|
| Owners of the Company |
$ |
11,824 |
|
$ |
4,089 |
|
| Non-controlling interest |
|
(6,527 |
) |
|
- |
|
| Total comprehensive income for the period |
$ |
5,297 |
|
$ |
4,089 |
|
HUDBAY MINERALS INC.
Condensed Consolidated Interim Statements of Cash Flows
(Unaudited and in thousands of US dollars) |
| |
| |
|
|
Three months ended March 31, |
|
| |
2024 |
|
|
2023 |
|
| Cash generated from operating activities: |
|
|
|
|
|
|
|
| Net earnings for the period |
|
$ |
18,535 |
|
$ |
5,457 |
|
| Tax expense |
19 |
|
49,215 |
|
|
11,973 |
|
| Items not affecting cash: |
|
|
|
|
|
|
|
| Depreciation and amortization |
6b |
|
109,759 |
|
|
67,752 |
|
| Share-based compensation expense |
|
|
5,858 |
|
|
1,195 |
|
| Net finance expense |
6d |
|
44,013 |
|
|
34,976 |
|
| Amortization of deferred revenue and variable consideration |
6a |
|
(23,171 |
) |
|
(15,857 |
) |
| Pension and other employee benefit payments, net of accruals |
|
|
3,227 |
|
|
3,074 |
|
| Amortization of community agreements |
|
|
3,021 |
|
|
1,610 |
|
| Re-evaluation adjustment - environmental obligation |
18 |
|
(5,269 |
) |
|
(8,240 |
) |
| Decommissioning and restoration payments |
|
|
(148 |
) |
|
(904 |
) |
| Other |
24a |
|
6,319 |
|
|
(6,470 |
) |
| Taxes paid |
|
|
(63,820 |
) |
|
(8,958 |
) |
| Operating cash flow before change in non-cash working capital |
|
|
147,539 |
|
|
85,608 |
|
| Change in non-cash working capital |
24b |
|
(7,863 |
) |
|
(14,329 |
) |
| |
|
|
139,676 |
|
|
71,279 |
|
| Cash used in investing activities: |
|
|
|
|
|
|
| Acquisition of property, plant and equipment |
|
|
(62,371 |
) |
|
(64,952 |
) |
| Community agreements |
|
|
(1,379 |
) |
|
(1,912 |
) |
| Grants received |
11 |
|
2,400 |
|
|
- |
|
| Net sale of investments |
|
|
- |
|
|
53 |
|
| Change in restricted cash |
|
|
- |
|
|
138 |
|
| Interest received |
|
|
2,430 |
|
|
1,597 |
|
| |
|
|
(58,920 |
) |
|
(65,076 |
) |
| Cash (used in) generated from financing activities: |
|
|
|
|
|
|
| Proceeds from revolving credit facility |
|
|
- |
|
|
40,000 |
|
| Repayment of revolving credit facility |
16b |
|
(10,000 |
) |
|
- |
|
| Interest paid on long-term debt |
|
|
(903 |
) |
|
- |
|
| Financing costs |
|
|
(5,330 |
) |
|
(3,133 |
) |
| Lease payments |
15 |
|
(7,749 |
) |
|
(5,364 |
) |
| Equipment financing payments |
|
|
(850 |
) |
|
- |
|
| Gold prepayment repayments |
14 |
|
(21,433 |
) |
|
(6,428 |
) |
| Net proceeds from exercise of stock options and warrants |
|
|
1,256 |
|
|
78 |
|
| Dividends paid |
20b |
|
(2,591 |
) |
|
(1,908 |
) |
| |
|
|
(47,600 |
) |
|
23,245 |
|
| Effect of movement in exchange rates on cash |
|
|
1,435 |
|
|
450 |
|
| Net increase in cash and cash equivalents |
|
|
34,591 |
|
|
29,898 |
|
| Cash and cash equivalents, beginning of the period |
|
|
249,794 |
|
|
225,665 |
|
| Cash and cash equivalents, end of the period |
|
$ |
284,385 |
|
$ |
255,563 |
|
HUDBAY MINERALS INC.
Condensed Consolidated Interim Statements of Changes in Equity
(Unaudited and in thousands of US dollars) |
| |
| |
|
Share capital
(note 20) |
|
|
Other capital
reserves |
|
|
Foreign currency
translation reserve |
|
|
Remeasurement
reserve |
|
|
Retained
earnings |
|
|
Total |
|
|
Non-
controlling
interest |
|
|
Total equity |
|
| Balance, January 1, 2023 |
$ |
1,780,774 |
|
$ |
58,503 |
|
$ |
(14,759 |
) |
$ |
(17,206 |
) |
$ |
(235,503 |
) |
$ |
1,571,809 |
|
$ |
- |
|
$ |
1,571,809 |
|
| Net earnings |
|
- |
|
|
- |
|
|
- |
|
|
- |
|
|
5,457 |
|
|
5,457 |
|
|
- |
|
|
5,457 |
|
| Other comprehensive income (loss) |
|
- |
|
|
- |
|
|
136 |
|
|
(1,504 |
) |
|
- |
|
|
(1,368 |
) |
|
- |
|
|
(1,368 |
) |
| Total comprehensive income (loss) |
|
- |
|
|
- |
|
|
136 |
|
|
(1,504 |
) |
|
5,457 |
|
|
4,089 |
|
|
- |
|
|
4,089 |
|
| Contributions by and distributions to owners: |
|
|
|
|
|
|
|
|
|
|
|
|
|
|
|
|
|
|
|
|
|
|
|
|
| Dividends (note 20b) |
|
- |
|
|
- |
|
|
- |
|
|
- |
|
|
(1,908 |
) |
|
(1,908 |
) |
|
- |
|
|
(1,908 |
) |
| Stock options |
|
- |
|
|
453 |
|
|
- |
|
|
- |
|
|
- |
|
|
453 |
|
|
- |
|
|
453 |
|
| Issuance of shares related to stock options exercised |
|
118 |
|
|
(40 |
) |
|
- |
|
|
- |
|
|
- |
|
|
78 |
|
|
- |
|
|
78 |
|
| Total contributions by and distributions to owners |
|
118 |
|
|
413 |
|
|
- |
|
|
- |
|
|
(1,908 |
) |
|
(1,377 |
) |
|
- |
|
|
(1,377 |
) |
| |
|
|
|
|
|
|
|
|
|
|
|
|
|
|
|
|
|
|
|
|
|
|
|
|
| Balance, March 31, 2023 |
$ |
1,780,892 |
|
$ |
58,916 |
|
$ |
(14,623 |
) |
$ |
(18,710 |
) |
$ |
(231,954 |
) |
$ |
1,574,521 |
|
$ |
- |
|
$ |
1,574,521 |
|
| Net earnings |
|
- |
|
|
- |
|
|
- |
|
|
- |
|
|
60,910 |
|
|
60,910 |
|
|
3,176 |
|
|
64,086 |
|
| Other comprehensive income (loss) |
|
- |
|
|
- |
|
|
9,215 |
|
|
(6,969 |
) |
|
- |
|
|
2,246 |
|
|
(124 |
) |
|
2,122 |
|
| Total comprehensive income (loss) |
|
- |
|
|
- |
|
|
9,215 |
|
|
(6,969 |
) |
|
60,910 |
|
|
63,156 |
|
|
3,052 |
|
|
66,208 |
|
| Contributions by and distributions to owners: |
|
|
|
|
|
|
|
|
|
|
|
|
|
|
|
|
|
|
|
|
|
|
|
|
| Dividends (note 20b) |
|
- |
|
|
- |
|
|
- |
|
|
- |
|
|
(2,555 |
) |
|
(2,555 |
) |
|
- |
|
|
(2,555 |
) |
| Shares issued on acquisition of Copper Mountain, net of share issuance costs (note 4) |
|
436,499 |
|
|
- |
|
|
- |
|
|
- |
|
|
- |
|
|
436,499 |
|
|
106,976 |
|
|
543,475 |
|
| Shares and warrants issued on acquisition of Rockcliff (note 5) |
|
12,503 |
|
|
725 |
|
|
- |
|
|
- |
|
|
- |
|
|
13,228 |
|
|
- |
|
|
13,228 |
|
| Flow-through shares issued, net of share issuance costs (note 20b) |
|
10,166 |
|
|
- |
|
|
- |
|
|
- |
|
|
- |
|
|
10,166 |
|
|
- |
|
|
10,166 |
|
| Stock options |
|
- |
|
|
1,684 |
|
|
- |
|
|
- |
|
|
- |
|
|
1,684 |
|
|
- |
|
|
1,684 |
|
| Issuance of shares related to stock options exercised |
|
173 |
|
|
(61 |
) |
|
- |
|
|
- |
|
|
- |
|
|
112 |
|
|
- |
|
|
112 |
|
| Total contributions by and distributions to owners |
|
459,341 |
|
|
2,348 |
|
|
- |
|
|
- |
|
|
(2,555 |
) |
|
459,134 |
|
|
106,976 |
|
|
566,110 |
|
| |
|
|
|
|
|
|
|
|
|
|
|
|
|
|
|
|
|
|
|
|
|
|
|
|
| Balance, December 31, 2023 |
$ |
2,240,233 |
|
$ |
61,264 |
|
$ |
(5,408 |
) |
$ |
(25,679 |
) |
$ |
(173,599 |
) |
$ |
2,096,811 |
|
$ |
110,028 |
|
$ |
2,206,839 |
|
HUDBAY MINERALS INC.
Condensed Consolidated Interim Statements of Changes in Equity
(Unaudited and in thousands of US dollars) |
| |
| |
|
Share capital
(note 20) |
|
|
Other capital
reserves |
|
|
Foreign currency
translation reserve |
|
|
Remeasurement
reserve |
|
|
Retained
earnings |
|
|
Total |
|
|
Non-
controlling
interest |
|
|
Total equity |
|
| Balance, January 1, 2024 |
$ |
2,240,233 |
|
$ |
61,264 |
|
$ |
(5,408 |
) |
$ |
(25,679 |
) |
$ |
(173,599 |
) |
$ |
2,096,811 |
|
$ |
110,028 |
|
$ |
2,206,839 |
|
| Net earnings |
|
- |
|
|
- |
|
|
- |
|
|
- |
|
|
22,358 |
|
|
22,358 |
|
|
(3,823 |
) |
|
18,535 |
|
| Other comprehensive (loss) income |
|
- |
|
|
- |
|
|
(14,117 |
) |
|
3,583 |
|
|
- |
|
|
(10,534 |
) |
|
(2,704 |
) |
|
(13,238 |
) |
| Total comprehensive (loss) income |
|
- |
|
|
- |
|
|
(14,117 |
) |
|
3,583 |
|
|
22,358 |
|
|
11,824 |
|
|
(6,527 |
) |
|
5,297 |
|
| Contributions by and distributions to owners: |
|
|
|
|
|
|
|
|
|
|
|
|
|
|
|
|
|
|
|
|
|
|
|
|
| Dividends (note 20b) |
|
- |
|
|
- |
|
|
- |
|
|
- |
|
|
(2,591 |
) |
|
(2,591 |
) |
|
- |
|
|
(2,591 |
) |
| Stock options |
|
- |
|
|
223 |
|
|
- |
|
|
- |
|
|
- |
|
|
223 |
|
|
- |
|
|
223 |
|
| Issuance of shares related to stock options and warrants exercised |
|
1,608 |
|
|
(343 |
) |
|
- |
|
|
- |
|
|
- |
|
|
1,265 |
|
|
- |
|
|
1,265 |
|
| Total contributions by and distributions to owners |
|
1,608 |
|
|
(120 |
) |
|
- |
|
|
- |
|
|
(2,591 |
) |
|
(1,103 |
) |
|
- |
|
|
(1,103 |
) |
| |
|
|
|
|
|
|
|
|
|
|
|
|
|
|
|
|
|
|
|
|
|
|
|
|
| Balance, March 31, 2024 |
$ |
2,241,841 |
|
$ |
61,144 |
|
$ |
(19,525 |
) |
$ |
(22,096 |
) |
$ |
(153,832 |
) |
$ |
2,107,532 |
|
$ |
103,501 |
|
$ |
2,211,033 |
|
1. Reporting entity
Hudbay Minerals Inc. ("HMI" or the "Company") is a company existing under the Canada Business Corporations Act. The address of the Company's principal executive office is 25 York Street, Suite 800, Toronto, Ontario. The unaudited condensed consolidated interim financial statements ("financial statements") of the Company for the three months ended March 31, 2024 and 2023 represent the financial position and the financial performance of the Company and its subsidiaries (together referred to as "Hudbay").
Wholly owned subsidiaries as at March 31, 2024 included HudBay Peru Inc., HudBay Peru S.A.C. ("Hudbay Peru"), HudBay (BVI) Inc., Hudbay Arizona Inc., Copper World, Inc. ("Copper World") and Mason Resources (US) Inc. ("Mason"). On January 1, 2024, the Company amalgamated with Copper Mountain Mining Inc., Hudbay British Columbia Inc. and Rockcliff Metals Corp. ("Rockcliff") and continued carrying on business as Hudbay Minerals Inc. Following the amalgamation, the Company directly holds a 75% interest in Copper Mountain Mine (BC) Ltd. ("CMBC") and is the direct holder of all of Rockcliff's mineral properties. Mitsubishi Materials Corporation ("MMC"), an arms-length party, owns the remaining 25% interest in CMBC.
Hudbay is a diversified mining company with long-life assets in North and South America. Hudbay's operations in Cusco (Peru) produce copper with gold, silver and molybdenum by-products. Hudbay's operations in Manitoba (Canada) produce gold with copper, zinc and silver by-products. Hudbay's operations in British Columbia (Canada) produce copper with gold and silver by-products. Hudbay has a development pipeline that includes copper development projects in Arizona and Nevada (United States), and a focused growth strategy on exploration, development, operation, and optimization of properties that Hudbay already controls, as well as other mineral assets that Hudbay may acquire that fit the Company's strategic criteria. The Company is governed by the Canada Business Corporations Act and its shares are listed under the symbol "HBM" on the Toronto Stock Exchange, New York Stock Exchange and Bolsa de Valores de Lima.
2. Basis of preparation
(a) Statement of compliance:
These interim financial statements have been prepared in accordance with IAS 34, Interim Financial Reporting as issued by the International Accounting Standards Board ("IASB") and do not include all of the information required for full annual financial statements by International Financial Reporting Standards ("IFRS") as issued by the IASB.
These interim financial statements should be read in conjunction with the Company's audited consolidated financial statements for the year ended December 31, 2023 which includes information necessary or useful to understanding the Company's business and financial statement presentation. In particular, the Company's material accounting policies are presented as note 3 in the Company's audited consolidated financial statements for the year ended December 31, 2023 and have been consistently applied in the preparation of these interim financial statements, in addition to the new standard noted below.
The Board of Directors approved these interim financial statements on May 13, 2024.
(b) Use of judgements and estimates:
The preparation of the interim financial statements in conformity with IFRS requires Hudbay to make judgements, estimates and assumptions, in applying accounting policies that affect reported amounts of assets and liabilities and disclosure of contingent assets and liabilities at the date of the interim financial statements, as well as reported amounts of revenue and expenses during the reporting period. Actual results may differ from these judgements, estimates and assumptions. The interim financial statements reflect the judgements and estimates outlined by Hudbay in its audited consolidated financial statements for the year ended December 31, 2023.
3. New standards
New standards and interpretations adopted
Amendment to IAS 1 - Presentation of Financial Statements
The amendments to IAS 1 clarify that only covenants with which an entity is required to comply on or before the reporting date affect the classification of a liability as current or non-current. In addition, an entity has to disclose information in the notes that enables users of financial statements to understand the risk that non-current liabilities with covenants could become repayable within twelve months. Classification is unaffected by the expectations that the entity will exercise its right to defer settlement of a liability. Lastly, the amendments clarify that settlement refers to the transfer to the counterparty of cash, equity instruments, other assets. The amendments are effective for annual periods beginning on or after January 1, 2024. The amendments have been adopted by the Company and the amendments did not result in any changes to the interim financial statements.
4. Acquisition of Copper Mountain Mining Corporation
On June 20, 2023, Hudbay acquired all of the issued and outstanding common shares of Copper Mountain Mining Inc. (formerly, Copper Mountain Mining Corp., and referred to herein as "Copper Mountain"), as part of a court-approved plan of arrangement. At the time, Copper Mountain held 75% of CMBC, the entity that owns 100% of the Copper Mountain mine. MMC owns the remaining 25% interest in CMBC as a non-controlling interest.
As a result of the acquisition, Hudbay obtained control of Copper Mountain on June 20, 2023.
Management determined that the assets and processes comprised a business and therefore accounted for the transaction as a business combination, using the acquisition method of accounting.
Consideration transferred:
The purchase consideration paid by Hudbay was for 100% of the net assets of Copper Mountain and their 100% owned subsidiaries ("100% owned entities") and a 75% ownership in CMBC. The aggregate purchase consideration for the acquired assets, net of the liabilities assumed is as follows:
| |
|
|
|
| Equity instruments (84,165,617 common shares of Hudbay) |
$ |
436,687 |
|
| Cash |
|
3,794 |
|
| Consideration transferred - June 20, 2023 |
$ |
440,481 |
|
The fair value of the common shares issued was based on Hudbay's listed share price of C$6.87 at the June 20, 2023 acquisition date. Immediately prior to the acquisition, Copper Mountain settled its outstanding restricted share units and performance share units through the issuance of shares and settled its stock options for replacement Hudbay options that were immediately settled in cash.
Hudbay incurred acquisition related costs of $6,932 during the year ended December 31, 2023, mainly relating to external legal and advisory fees and due diligence costs, which were recorded in other expense in the consolidated income statements. In addition, Hudbay incurred share issuance costs of $188 and presented these as a deduction from share capital.
Identifiable assets acquired and liabilities assumed:
The fair value of the net assets was determined using a combination of market, income and cost methods. The fair value of the non-controlling interest was then computed at a 25% of the equity interest in CMBC.
The following presents the allocation of the final purchase price, resulting in recognized fair value amounts of identifiable assets acquired and liabilities assumed as follows:
| Fair value of net assets acquired / (liabilities) assumed |
|
Final |
|
| Cash and cash equivalent |
$ |
14,483 |
|
| Trade and other receivables |
|
19,110 |
|
| Inventories |
|
47,875 |
|
| Prepaid expenses |
|
3,096 |
|
| Other financial assets |
|
8,495 |
|
| Property, plant and equipment |
|
434,821 |
|
| Mineral properties |
|
369,000 |
|
| Inventories - low grade stockpile |
|
6,000 |
|
| Trade and other payables |
|
(77,111 |
) |
| Advances from Hudbay |
|
(3,421 |
) |
| Lease liabilities |
|
(34,617 |
) |
| Other financial liabilities |
|
(9,550 |
) |
| Long-term debt |
|
(144,981 |
) |
| Environmental and other provisions |
|
(12,702 |
) |
| Deferred tax liabilities |
|
(148,246 |
) |
| Total fair value of net identifiable assets acquired |
$ |
472,252 |
|
The fair values of mineral properties, low grade stockpile and other property, plant and equipment have been determined based on an independent valuation, using a combination of market, income and cost methods. In particular, the fair values of the mineral properties and low grade stockpile have been calculated using significant judgements and estimates.
Trade receivables acquired as part of the acquisition have a fair value of $8,764 which is equal to their gross contractual value. Other receivables acquired have a fair value of $10,346 which is equal to their gross contractual value. Trade and other receivables are expected to be collected during the next 12 months.
Hudbay provided advances to Copper Mountain prior to the acquisition date, which have been recorded as a purchaser loan.
Hudbay recognized goodwill as a result of the acquisition as follows:
| |
|
Final |
|
| Total consideration transferred |
$ |
440,481 |
|
| Non-controlling interest |
|
106,976 |
|
| Less: value of net identifiable assets acquired |
|
(472,252 |
) |
| Goodwill upon acquisition at June 20, 2023 |
$ |
75,205 |
|
The goodwill balance arose from the requirement to record deferred income tax liabilities measured at the tax effect of the difference between the fair values of the assets acquired and liabilities assumed and their tax bases. None of the goodwill recognized is expected to be deductible for income tax purposes.
The results of operations have been consolidated with those of the Company from the date of acquisition and included in the British Columbia operating segment.
5. Acquisition of Rockcliff Metals Corporation
On September 14, 2023, Hudbay acquired all of the issued and outstanding common shares of Rockcliff, as part of a court-approved plan of arrangement. In doing so, Hudbay obtained control of Rockcliff on September 14, 2023.
Management determined that substantially all of the fair value of the gross assets acquired is concentrated in the Talbot exploration property and therefore accounted for the transaction as an asset acquisition.
The purchase consideration paid was 2,675,324 Hudbay common shares and 517,460 Hudbay warrants. For asset acquisitions settled with equity, entities are required to record the net assets acquired based on the fair value of the assets received in exchange for the equity issued, unless that fair value cannot be estimated reliably. Hudbay incurred acquisition related costs of $518 during the third quarter of 2023, mainly relating to external legal and advisory fees and due diligence costs, which were capitalized and included as a cost of acquiring the net assets.
The fair value of the net assets acquired was determined using a combination of income and cost methods. In particular, the fair values of the exploration property have been calculated using significant judgements and estimates. The following presents the fair value amounts of identifiable assets acquired and liabilities assumed:
| Fair value of net assets acquired / (liabilities) assumed |
|
|
|
| Cash and cash equivalents |
$ |
270 |
|
| Accounts receivable and prepaid expenses |
|
98 |
|
| Property, plant & equipment |
|
33 |
|
| Exploration property |
|
14,198 |
|
| Accounts payable and accrued liabilities |
|
(305 |
) |
| Advance from Hudbay |
|
(548 |
) |
| Total fair value of net identifiable assets acquired |
$ |
13,746 |
|
6. Revenue and expenses
(a) Revenue
Hudbay's revenue by significant product types:
| |
|
Three months ended March 31, |
|
| |
|
2024 |
|
|
2023 |
|
| Copper |
$ |
285,156 |
|
$ |
164,242 |
|
| Gold |
|
178,130 |
|
|
74,926 |
|
| Zinc |
|
14,931 |
|
|
19,842 |
|
| Silver |
|
12,168 |
|
|
6,301 |
|
| Molybdenum |
|
18,195 |
|
|
18,962 |
|
| Other |
|
- |
|
|
239 |
|
| Revenue from contracts |
|
508,580 |
|
|
284,512 |
|
| Non-cash streaming arrangement items 1 |
|
|
|
|
|
|
| Amortization of deferred revenue - gold |
|
16,448 |
|
|
5,392 |
|
| Amortization of deferred revenue - silver |
|
10,572 |
|
|
5,580 |
|
Amortization of deferred revenue - variable
consideration adjustments - prior periods |
|
(3,849 |
) |
|
4,885 |
|
| |
|
23,171 |
|
|
15,857 |
|
| Pricing and volume adjustments 2 |
|
20,902 |
|
|
13,345 |
|
| |
|
552,653 |
|
|
313,714 |
|
| Treatment and refining charges |
|
(27,664 |
) |
|
(18,495 |
) |
| |
$ |
524,989 |
|
$ |
295,219 |
|
1 See note 17.
2 Pricing and volume adjustments represent mark-to-market adjustments on initial estimate of provisionally priced sales, realized and unrealized changes to fair value of quotational pricing hedge derivative contracts and adjustments to originally invoiced weights and assays.
Consideration from the Company's stream agreements is considered variable (note 17). Gold and silver stream revenue can be subject to cumulative adjustments when the amount of precious metals to be delivered under the contract changes. As a result of changes in the Company's mineral reserve and resource estimate in the first quarter of 2024, the amortization rate by which deferred revenue is drawn down into income was adjusted and, as required, a variable consideration adjustment was made for all prior year stream revenues since the stream agreement inception date. This variable consideration adjustment for the three months ended March 31, 2024 resulted in a decrease of revenue of $3,849 (March 31, 2023 - increase of revenue of $4,885).
(b) Depreciation and amortization
Depreciation of property, plant and equipment and amortization of intangible assets are reflected in the condensed consolidated interim statements of earnings as follows:
| |
|
Three months ended March 31, |
|
| |
|
2024 |
|
|
2023 |
|
| Cost of sales |
$ |
109,273 |
|
$ |
67,422 |
|
| Selling and administrative expenses |
|
486 |
|
|
330 |
|
| |
$ |
109,759 |
|
$ |
67,752 |
|
(c) Other expenses
| |
|
Three months ended March 31, |
|
| |
|
2024 |
|
|
2023 |
|
| Regional costs |
$ |
1,487 |
|
$ |
1,069 |
|
| Write-down/loss on disposal of PP&E |
|
9,045 |
|
|
69 |
|
| Amortization of community costs (other assets) |
|
1,757 |
|
|
340 |
|
| Restructuring |
|
943 |
|
|
- |
|
| Care & maintenance - Manitoba |
|
3,129 |
|
|
3,995 |
|
| Evaluation costs |
|
588 |
|
|
91 |
|
| Reduction of obligation to renounce flow-through expenditures |
|
(675 |
) |
|
- |
|
| Option agreement proceeds |
|
(363 |
) |
|
- |
|
| Other |
|
349 |
|
|
(605 |
) |
| |
$ |
16,260 |
|
$ |
4,959 |
|
The Arizona business unit held an option to acquire water rights and land, which expired during the first quarter of 2024 without being extended or exercised. The previously capitalized cost to maintain the option, net of accrued interest, of $8,133 is presented as part of write-down of PP&E.
On March 7, 2024, Hudbay and Marubeni Corporation executed an option agreement whereby Marubeni will fund certain minimum annual exploration expenditures for agreed upon properties. During the first quarter of 2024, proceeds of $363 were received and recorded as other income.
(d) Net finance expense
| |
|
Three months ended March 31, |
|
| |
|
2024 |
|
|
2023 |
|
| Net interest expense on long-term debt |
|
|
|
|
|
|
| Net interest expense on long-term debt |
$ |
19,208 |
|
$ |
17,007 |
|
| Accretion on streaming arrangements (note 17) |
|
|
|
|
|
|
| Additions |
|
6,000 |
|
|
6,597 |
|
| Variable consideration adjustments - prior periods |
|
176 |
|
|
(96 |
) |
| |
|
6,176 |
|
|
6,501 |
|
| Change in fair value of financial instruments |
|
|
|
|
|
|
| Gold prepayment liability (note 14) |
|
3,462 |
|
|
6,097 |
|
| Net unrealized loss on non-quotational pricing hedges |
|
3,328 |
|
|
- |
|
| Investments |
|
164 |
|
|
(500 |
) |
| |
|
6,954 |
|
|
5,597 |
|
| Other net finance costs |
|
|
|
|
|
|
| Net foreign exchange loss |
|
4,827 |
|
|
306 |
|
| Accretion on community agreements measured at amortized cost |
|
959 |
|
|
763 |
|
| Accretion on environmental provisions |
|
2,676 |
|
|
2,404 |
|
| Accretion on Wheaton refund liability |
|
150 |
|
|
139 |
|
| Withholding taxes |
|
923 |
|
|
1,405 |
|
| Loss on disposal of investments |
|
- |
|
|
652 |
|
| Other finance expense |
|
4,590 |
|
|
1,730 |
|
| Interest income |
|
(2,450 |
) |
|
(1,528 |
) |
| |
|
11,675 |
|
|
5,871 |
|
| Net finance expense |
$ |
44,013 |
|
$ |
34,976 |
|
Other finance expense relates primarily to standby fees on Hudbay's revolving credit facilities and leases.
Commencing in the first quarter of 2024, Hudbay has entered into copper forward sale, copper costless collars and gold costless collars which are non-quotational pricing ("QP") contracts (note 22b). Subsequent movements in the fair value of non-QP contracts are recognized in change in fair value of financial instruments in the condensed consolidated interim statements of earnings.
7. Trade and other receivables
| |
|
Mar. 31, 2024 |
|
|
Dec. 31, 2023 |
|
| Current |
|
|
|
|
|
|
| Trade receivables |
$ |
150,282 |
|
$ |
169,806 |
|
| Statutory receivables |
|
42,798 |
|
|
27,215 |
|
| Other receivables |
|
4,652 |
|
|
6,408 |
|
| |
|
197,732 |
|
|
203,429 |
|
| Non-current |
|
|
|
|
|
|
| Taxes receivable |
|
12,010 |
|
|
12,157 |
|
| |
$ |
209,742 |
|
$ |
215,586 |
|
8. Inventories
| |
|
Mar. 31, 2024 |
|
|
Dec. 31, 2023 |
|
| Current |
|
|
|
|
|
|
| Stockpile |
$ |
56,284 |
|
$ |
52,454 |
|
| Finished goods |
|
48,904 |
|
|
61,266 |
|
| Materials and supplies |
|
96,777 |
|
|
93,614 |
|
| |
|
201,965 |
|
|
207,334 |
|
| Non-current |
|
|
|
|
|
|
| Stockpile |
|
1,577 |
|
|
9,591 |
|
| Low grade stockpile1 |
|
5,867 |
|
|
5,875 |
|
| Materials and supplies |
|
8,877 |
|
|
8,984 |
|
| |
|
16,321 |
|
|
24,450 |
|
| |
$ |
218,286 |
|
$ |
231,784 |
|
1Stockpile of inventory that is not expected to be processed until the end of the Copper Mountain mine life.
The cost of inventories recognized as an expense, including depreciation, and included in cost of sales amounted to $328,502 for the three months ended March 31, 2024 (three months ended March 31, 2023 - $204,910).
9. Other financial assets
| |
|
Mar. 31, 2024 |
|
|
Dec. 31, 2023 |
|
| Current |
|
|
|
|
|
|
| Derivative assets |
$ |
520 |
|
$ |
1,416 |
|
| Guaranteed investment certificates |
|
622 |
|
|
722 |
|
| Restricted cash |
|
536 |
|
|
1,964 |
|
| |
|
1,678 |
|
|
4,102 |
|
| |
|
|
|
|
|
|
| Non-current |
|
|
|
|
|
|
| Investments at fair value through profit or loss |
|
6,137 |
|
|
6,452 |
|
| Guaranteed investment certificates |
|
709 |
|
|
637 |
|
| |
|
6,846 |
|
|
7,089 |
|
| |
$ |
8,524 |
|
$ |
11,191 |
|
10. Intangibles and other assets
Intangibles and other assets of $50,780 (December 31, 2023 - $52,453) includes $47,063 of other assets (December 31, 2023 - $48,428) and $3,717 of intangibles (December 31, 2023 - $4,025).
Other assets represent the carrying value of certain future community costs that relate to original agreements with communities for the Constancia operation which allow Hudbay to extract minerals over the useful life of the Peru operation. The liability remaining for these costs is recorded in agreements with communities recorded at amortized cost (note 13). Amortization of the carrying amount is recorded in the condensed consolidated interim income statements within other expenses (note 6c) or exploration expense, depending on the nature of the agreement.
Intangibles mainly represent computer software costs.
11. Property, plant and equipment
| Mar. 31, 2024 |
|
Cost |
|
|
Accumulated
depreciation
and
amortization |
|
|
Carrying
amount |
|
| Exploration and evaluation assets |
$ |
98,617 |
|
$ |
- |
|
$ |
98,617 |
|
| Capital works in progress |
|
819,995 |
|
|
- |
|
|
819,995 |
|
| Mining properties |
|
2,497,275 |
|
|
(1,133,789 |
) |
|
1,363,486 |
|
| Plant and equipment |
|
3,219,375 |
|
|
(1,384,349 |
) |
|
1,835,026 |
|
| Plant and equipment-ROU Assets1 |
|
261,002 |
|
|
(146,590 |
) |
|
114,412 |
|
| |
$ |
6,896,264 |
|
$ |
(2,664,728 |
) |
$ |
4,231,536 |
|
| |
|
|
|
|
|
|
|
|
|
| Dec. 31, 2023 |
|
Cost |
|
|
Accumulated
depreciation
and
amortization |
|
|
Carrying
amount |
|
| Exploration and evaluation assets |
$ |
96,901 |
|
$ |
- |
|
$ |
96,901 |
|
| Capital works in progress |
|
804,020 |
|
|
- |
|
|
804,020 |
|
| Mining properties |
|
2,481,118 |
|
|
(1,093,839 |
) |
|
1,387,279 |
|
| Plant and equipment |
|
3,262,854 |
|
|
(1,345,604 |
) |
|
1,917,250 |
|
| Plant and equipment - ROU Assets1 |
|
253,344 |
|
|
(142,788 |
) |
|
110,556 |
|
| |
$ |
6,898,237 |
|
$ |
(2,582,231 |
) |
$ |
4,316,006 |
|
1 Includes $4,492 of capital works in progress - ROU assets (cost) that relate to the Arizona segment (December 31, 2023 - $4,800 related to the Arizona segment).
During the first quarter of 2024, Hudbay received a grant of $2,400 from the Environment and Climate Change Canada related to the purchase of an electric mining shovel in the third quarter of 2023. The carrying amount of the shovel has been deducted by the amount of the grant received. The grant will be recognized in profit or loss over the life of the shovel as a reduced depreciation expense. There were no significant unfulfilled conditions attached to the grant.
12. Other liabilities
| |
|
Mar. 31, 2024 |
|
|
Dec. 31, 2023 |
|
| |
|
|
|
|
|
|
| Unearned revenue |
$ |
304 |
|
$ |
616 |
|
| Environmental and other provisions (note 18) |
|
26,333 |
|
|
22,292 |
|
| Pension liability |
|
4,256 |
|
|
3,284 |
|
| Other employee benefits |
|
3,792 |
|
|
3,843 |
|
| |
$ |
34,685 |
|
$ |
30,035 |
|
13. Other financial liabilities
| |
|
Mar. 31, 2024 |
|
|
Dec. 31, 2023 |
|
| Current |
|
|
|
|
|
|
| Derivative liabilities |
$ |
12,030 |
|
$ |
11,811 |
|
| Equipment financing |
|
4,663 |
|
|
3,300 |
|
| Deferred Rosemont acquisition consideration |
|
9,855 |
|
|
9,713 |
|
| Agreements with communities recorded at amortized cost |
|
17,227 |
|
|
17,411 |
|
| |
|
43,775 |
|
|
42,235 |
|
| |
|
|
|
|
|
|
| Non-current |
|
|
|
|
|
|
| Equipment financing |
|
11,321 |
|
|
7,499 |
|
| Agreements with communities recorded at amortized cost |
|
40,702 |
|
|
37,568 |
|
| Wheaton refund liability |
|
6,812 |
|
|
6,653 |
|
| |
|
58,835 |
|
|
51,720 |
|
| |
$ |
102,610 |
|
$ |
93,955 |
|
Agreements with communities recorded at amortized cost relate to agreements with communities near the Constancia operation which allow Hudbay to extract minerals over the useful life of the Constancia operation, carry out exploration and evaluation activities in the area and provide Hudbay with community support to operate in the region.
As part of the streaming agreement for the 777 mine, Hudbay must repay, with precious metals credits, the stream deposit by August 1, 2052, the expiry date of the agreement. If the stream deposit is not fully repaid with precious metals credits from 777 production by the expiry date, a payment for the remaining amount will be due at the expiry date of the agreement. As the 777 mine has concluded all mining activities following the depletion of reserves and finalized the sales of produced concentrate, Hudbay concluded that the remaining stream deposit will not be repaid by means of precious metals credits from 777 production. The repayment amount is recorded as a Wheaton refund liability, which is and will be discounted at the 9.0% rate inherent in the original 777 stream agreement and accreted over the remaining term of the agreement.
14. Gold prepayment liability
Gold prepayment liabilities are reflected in the condensed consolidated interim balance sheets as follows:
| |
|
Mar. 31, 2024 |
|
|
Dec. 31, 2023 |
|
| Current |
$ |
37,945 |
|
$ |
55,901 |
|
The following table summarizes changes in the gold prepayment liability:
| Balance, January 1, 2023 |
$ |
71,208 |
|
| Change in fair value recorded in income statement |
|
11,223 |
|
| Change in fair value recorded in other comprehensive income |
|
192 |
|
| Repayments |
|
(26,722 |
) |
| Balance, December 31, 2023 |
$ |
55,901 |
|
| Change in fair value recorded in income statement (note 6d) |
|
3,462 |
|
| Change in fair value recorded in other comprehensive income |
|
15 |
|
| Repayments |
|
(21,433 |
) |
| Balance, March 31, 2024 |
$ |
37,945 |
|
During the first quarter of 2023, Hudbay renegotiated its agreements with various financial institutions and deferred eight months of scheduled gold deliveries. Monthly deliveries of the outstanding gold ounces under the new agreements have resumed in October 2023 and will continue until August 2024.
15. Lease liabilities
| Balance, January 1, 2023 |
$ |
61,019 |
|
| Acquired through the acquisition of Copper Mountain |
|
34,617 |
|
| Additional capitalized leases |
|
21,401 |
|
| Lease payments |
|
(25,216 |
) |
| Derecognized leases |
|
(685 |
) |
| Accretion and other movements |
|
(801 |
) |
| Balance, December 31, 2023 |
$ |
90,335 |
|
| Additional capitalized leases |
|
7,849 |
|
| Lease payments |
|
(7,749 |
) |
| Derecognized leases |
|
(12 |
) |
| Accretion and other movements |
|
1,733 |
|
| Balance, March 31, 2024 |
$ |
92,156 |
|
Lease liabilities are reflected in the condensed consolidated interim balance sheets as follows:
| |
|
Mar. 31, 2024 |
|
|
Dec. 31, 2023 |
|
| Current |
$ |
31,920 |
|
$ |
28,902 |
|
| Non-current |
|
60,236 |
|
|
61,433 |
|
| |
$ |
92,156 |
|
$ |
90,335 |
|
Hudbay has entered into leases which expire between 2024 and 2037. The interest rates on leases which were capitalized have interest rates between 2.39% and 8.49%, per annum. The range of interest rates utilized for discounting varies depending mostly on the Hudbay entity acting as lessee and duration of the lease. For certain leases, Hudbay has the option to purchase the equipment and vehicles leased at the end of the terms of the leases. Hudbay's obligations under these leases are secured by the lessor's title to the leased assets. The present value of applicable lease payments has been recognized as an ROU asset, which was included as a non-cash addition to property, plant and equipment, and a corresponding amount as a lease liability.
There are no restrictions placed on Hudbay by entering into these leases.
The following outlines expenses recognized within the Company's condensed consolidated interim statements of earnings, relating to leases for which a recognition exemption was applied.
| |
|
Three months ended March 31, |
|
| |
|
2024 |
|
|
2023 |
|
| Short-term leases |
$ |
890 |
|
$ |
1,175 |
|
| Low value leases |
|
98 |
|
|
112 |
|
| Variable leases |
|
6,490 |
|
|
6,394 |
|
| Total |
$ |
7,478 |
|
$ |
7,681 |
|
Payments made for short-term, low value and variable leases would mostly be captured as expenses in the condensed consolidated interim statements of earnings, however, certain amounts may be capitalized to PP&E for the Arizona segment during its development phase and certain amounts may be reported in inventories given the timing of sales. Variable payment leases include equipment used for heavy civil works at Constancia.
16. Long-term debt
Long-term debt is comprised of the following:
| |
|
Mar. 31, 2024 |
|
|
Dec. 31, 2023 |
|
| Senior unsecured notes (a) |
$ |
1,191,220 |
|
$ |
1,190,586 |
|
| Senior secured revolving credit facilities (b) |
|
87,367 |
|
|
96,950 |
|
| |
$ |
1,278,587 |
|
$ |
1,287,536 |
|
(a) Senior unsecured notes
| Balance, January 1, 2023 |
$ |
1,188,132 |
|
| Accretion of transaction costs and premiums |
|
2,454 |
|
| Balance, December 31, 2023 |
$ |
1,190,586 |
|
| Accretion of transaction costs and premiums |
|
634 |
|
| Balance, March 31, 2024 |
$ |
1,191,220 |
|
As at March 31, 2024, $1,200,000 aggregate principal amount of senior notes were outstanding in two series: (i) a series of 4.50% senior notes due 2026 in an aggregate principal amount of $600,000 and (ii) a series of 6.125% senior notes due 2029 in an aggregate principal amount of $600,000.
The senior notes are guaranteed on a senior unsecured basis by substantially all of the Company's subsidiaries, other than HudBay (BVI) Inc. and certain excluded or unrestricted subsidiaries, which includes CMBC (the Company's 75% owned subsidiary that owns the Copper Mountain mine), and subsidiaries that hold the Copper World and Mason projects as well as any newly formed or acquired subsidiaries that primarily hold or may develop non-producing mineral assets that are in the pre-construction phase of development.
(b) Senior secured revolving credit facilities
| Balance, January 1, 2023 1 |
$ |
(3,970 |
) |
| Proceeds from drawdown, net of repayments |
|
100,000 |
|
| Accretion of transaction costs |
|
1,627 |
|
| Transaction costs |
|
(707 |
) |
| Balance, December 31, 2023 |
$ |
96,950 |
|
| Repayments |
|
(10,000 |
) |
| Accretion of transaction costs |
|
485 |
|
| Transaction costs |
|
(68 |
) |
| Balance, March 31, 2024 |
$ |
87,367 |
|
1 Balance, representing deferred transaction costs, is in an asset position.
Hudbay has two senior secured revolving credit facilities with total commitments of $450 million and substantially similar terms and conditions for its Canadian and Peruvian businesses. Hudbay's revolving credit facilities are secured against substantially all of the Company's assets, other than those associated with the Copper World and Mason projects.
During the three months ended March 31, 2024, Hudbay repaid $10,000 under its Canadian revolving credit facility.
At March 31, 2024, we had $90,000 of debt outstanding under our Peruvian revolving credit facilities. The Company may repay any borrowings under the revolving credit facility at any time without premium or penalty.
As at March 31, 2024, the Peru segment had nil in letters of credit issued under the Peru revolving credit facility to support its reclamation obligations and the Manitoba segment had $25,518 in letters of credit issued under the Canadian revolving credit facility to support its reclamation and pension obligations. As at March 31, 2024, we were in compliance with our covenants under the revolving credit facilities.
Surety bonds
The Arizona segment had $8,666 in surety bonds issued to support future reclamation and closure obligations. No cash collateral is required to be posted under these surety bonds.
The British Columbia segment had $45,509 in surety bonds issued to support future reclamation and closure obligations and $4,893 in surety bonds with BC Hydro in relation to the BC Hydro transmission system at the Copper Mountain Mine. No cash collateral is required to be posted under these surety bonds.
Other letters of credit
The Peru segment had $126,094 in letters of credit issued with various Peruvian financial institutions to support future reclamation and other operating matters. No cash collateral is required to be posted under these letters of credit.
Hudbay has a C$130.0 million bilateral letter of credit facility ("LC Facility") with a major Canadian financial institution. As at March 31, 2024, the Manitoba segment had $55,296 in letters of credit issued under the LC Facility to support its reclamation and pension obligations.
17. Deferred revenue
Peru Stream Agreement
For the three months ended March 31, 2024, the drawdown rates for the Peru stream agreement for gold and silver were $817 and $14.56 per ounce, respectively (year ended December 31, 2023 - $820 and $15.26 per ounce, respectively).
The following table summarizes changes in deferred revenue:
| Balance, January 1, 2023 |
$ |
469,538 |
|
| Amortization of deferred revenue |
|
|
|
| Liability drawdown |
|
(72,424 |
) |
| Variable consideration adjustments - prior periods |
|
(4,885 |
) |
| Accretion on streaming arrangements |
|
|
|
| Current year additions |
|
26,387 |
|
| Variable consideration adjustments - prior periods |
|
(96 |
) |
| Balance, December 31, 2023 |
$ |
418,520 |
|
| Amortization of deferred revenue (note 6a) |
|
|
|
| Liability drawdown |
|
(27,020 |
) |
| Variable consideration adjustments - prior periods |
|
3,849 |
|
| Accretion on streaming arrangements (note 6d) |
|
|
|
| Current year-to-date additions |
|
6,000 |
|
| Variable consideration adjustments - prior periods |
|
176 |
|
| Balance, March 31, 2024 |
$ |
401,525 |
|
Consideration from the Company's stream agreement is considered variable. Gold and silver stream revenue can be subject to cumulative adjustments when the number of ounces to be delivered under the contract changes. As a result of changes in the Company's mineral reserve and resource estimate in the first quarter of 2024, the amortization rate by which deferred revenue is drawn down into income was adjusted and, as required, a current period variable adjustment was made for all prior period stream revenues since the stream agreement inception date. This variable consideration adjustment resulted in a decrease in revenue of $3,849 and an increase of finance expense of $176 for the three months ended March 31, 2024 (December 31, 2023 - increase in revenue of $4,885 and a decrease of finance expense of $96).
Deferred revenue is reflected in the condensed consolidated interim balance sheets as follows:
| |
|
Mar. 31, 2024 |
|
|
Dec. 31, 2023 |
|
| Current |
$ |
72,383 |
|
$ |
87,672 |
|
| Non-current |
|
329,142 |
|
|
330,848 |
|
| |
$ |
401,525 |
|
$ |
418,520 |
|
18. Environmental and other provisions
Reflected in the condensed consolidated interim balance sheets as follows:
| Mar. 31, 2024 |
|
Decommissioning,
restoration and
similar liabilities |
|
|
Deferred
share units |
|
|
Restricted
share units |
|
|
Performance
share units |
|
|
Other 1 |
|
|
Total |
|
| Current (note 12) |
$ |
2,630 |
|
$ |
11,364 |
|
$ |
2,835 |
|
$ |
1,438 |
|
$ |
8,066 |
|
$ |
26,333 |
|
| Non-current |
|
298,407 |
|
|
- |
|
|
1,569 |
|
|
1,366 |
|
|
- |
|
|
301,342 |
|
| |
$ |
301,037 |
|
$ |
11,364 |
|
$ |
4,404 |
|
$ |
2,804 |
|
$ |
8,066 |
|
$ |
327,675 |
|
| |
|
|
|
|
|
|
|
|
|
|
|
|
|
|
|
|
|
|
| Dec. 31, 2023 |
|
Decommissioning,
restoration and
similar liabilities |
|
|
Deferred
share units |
|
|
Restricted
share units |
|
|
Performance
share units |
|
|
Other 1 |
|
|
Total |
|
| Current (note 12) |
$ |
1,370 |
|
$ |
8,660 |
|
$ |
2,147 |
|
$ |
727 |
|
$ |
9,388 |
|
$ |
22,292 |
|
| Non-current |
|
313,971 |
|
|
- |
|
|
2,941 |
|
|
1,853 |
|
|
3,147 |
|
|
321,912 |
|
| |
$ |
315,341 |
|
$ |
8,660 |
|
$ |
5,088 |
|
$ |
2,580 |
|
$ |
12,535 |
|
$ |
344,204 |
|
1 Relates primarily to flow-through share premiums, restructuring costs and other non-capital provisions.
Decommissioning and restoration obligation ("DRO") are remeasured at each reporting date to reflect changes in discount rates, exchange rates, and timing and extent of cash outflows which can significantly affect the liabilities. This provision has been recorded based on estimates and assumptions that management believes are reasonable; however, actual decommissioning and restoration costs may differ from expectations.
During the first quarter of 2024, the Company recorded a non-cash gain of $5,269 in the condensed consolidated interim income statements mainly related to a revaluation adjustment to the Flin Flon operation's environmental reclamation provision. The current quarter was impacted by an increase in long term, risk-free discount rates based on changes in Canadian bond yields, slightly offset by an increase in inflation rates. Typically, an operating location will reflect any revaluation adjustments to the environmental reclamation provision against its reclamation assets. However, as the Flin Flon operations closed in June 2022, the corresponding Flin Flon assets have been fully depreciated and cannot be reduced below residual value resulting in the remaining impact being recorded as a gain in the condensed consolidated interim income statements.
As at March 31, 2024, decommissioning, restoration and similar liabilities have been discounted to their present value at rates ranging from 3.34% to 5.19% per annum (December 31, 2023 - 3.01% to 4.86%), using pre-tax, risk-free interest rates that reflect the estimated maturity of each specific liability.
During the first quarter of 2023, the Company recorded a non-cash gain of $8,240 in the condensed consolidated interim income statements mainly related to a revaluation adjustment to the Flin Flon operation's environmental reclamation provision.
19. Income and mining taxes
The tax expense is applicable as follows:
| |
|
Three months ended March 31, |
|
| |
|
2024 |
|
|
2023 |
|
| Current: |
|
|
|
|
|
|
| Income tax expense |
$ |
35,397 |
|
$ |
10,765 |
|
| Mining tax expense |
|
12,753 |
|
|
6,357 |
|
| Adjustments in respect of prior years |
|
(112 |
) |
|
- |
|
| |
|
48,038 |
|
|
17,122 |
|
| Deferred: |
|
|
|
|
|
|
| Income tax expense (recovery) - origination, revaluation and/or reversal of temporary differences |
|
3,254 |
|
|
(3,722 |
) |
| Mining tax recovery - origination, revaluation and/or reversal of temporary difference |
|
(2,264 |
) |
|
(1,999 |
) |
| Adjustments in respect of prior years |
|
187 |
|
|
572 |
|
| |
|
1,177 |
|
|
(5,149 |
) |
| |
$ |
49,215 |
|
$ |
11,973 |
|
Adjustments in respect of prior years refers to amounts changing due to the filing of tax returns and assessments from government authorities as well as any change identified that would result in a difference to our current or deferred tax balances as reported in the prior fiscal year end.
20. Share capital
(a) Preference shares:
Authorized: Unlimited preference shares without par value.
Issued and fully paid: Nil.
(b) Common shares:
Authorized: Unlimited common shares without par value.
Issued and fully paid:
| |
|
Three months ended
March 31, 2024 |
|
|
Year ended
Dec. 31, 2023 |
|
| |
|
Common
shares |
|
|
Amount |
|
|
Common
shares |
|
|
Amount |
|
| Balance, beginning of year |
|
350,728,536 |
|
$ |
2,240,233 |
|
|
262,019,857 |
|
$ |
1,780,774 |
|
| Exercise of options |
|
181,504 |
|
|
1,128 |
|
|
67,145 |
|
|
291 |
|
| Exercise of warrants |
|
88,088 |
|
|
480 |
|
|
- |
|
|
- |
|
| Shares issued on acquisition of Copper Mountain, net of share issuance costs |
|
- |
|
|
- |
|
|
84,165,617 |
|
|
436,499 |
|
| Shares issued on acquisition of Rockcliff |
|
- |
|
|
- |
|
|
2,675,324 |
|
|
12,503 |
|
| Flow through shares, net of share issuance costs |
|
- |
|
|
- |
|
|
1,960,000 |
|
|
10,166 |
|
| Cancelled shares |
|
- |
|
|
- |
|
|
(159,407 |
) |
|
- |
|
| Balance, end of period |
|
350,998,128 |
|
$ |
2,241,841 |
|
|
350,728,536 |
|
$ |
2,240,233 |
|
During the three months ended March 31, 2024, the Company declared a dividend of C$0.01 per share. The Company paid $2,591 in dividends on March 22, 2024 to shareholders of record as of March 5, 2024.
During the year ended December 31, 2023, the Company declared two semi-annual dividends of C$0.01 per share. The Company paid $1,908 and $2,555 in dividends on March 24, 2023 and September 22, 2023 to shareholders of record as of March 7, 2023 and September 1, 2023.
During the year ended December 31, 2023, the Company completed a Canadian Development Expense and Canadian Exploration Expense flow-through financing. The Company issued 1,960,000 common shares for proceeds, net of transaction costs, of $14,424. The implied premium on the flow-through shares of $4,258 was recorded as a flow-through share liability. At March 31, 2024, the Company has incurred $1,880 in qualifying expenditures related to this flow-through financing. The flow-through share liability will be recognized in earnings as eligible expenditures are made.
(c) Equity-settled share-based compensation - stock options:
The Company's stock option plan was approved in June 2005 and amended in May 2008 (the "Plan"). Under the amended Plan, the Company may grant to employees, officers, directors or consultants of the Company or its affiliates options to purchase up to a maximum of 13 million common shares of Hudbay. The Company has determined that the appropriate accounting treatment is to classify the stock options as equity settled transactions.
The following table outlines the changes in the number of stock options outstanding:
| |
|
Mar. 31, 2024 |
|
|
Dec. 31, 2023 |
|
| |
|
Number of
shares subject
to option |
|
|
Weighted-
average
exercise price
C$ |
|
|
Number of
shares subject
to option |
|
|
Weighted
average
exercise price
C$ |
|
| Balance, beginning of year |
|
2,182,970 |
|
$ |
7.23 |
|
|
1,528,760 |
|
$ |
7.38 |
|
| Number of units granted |
|
902,874 |
|
$ |
7.50 |
|
|
801,661 |
|
$ |
6.75 |
|
| Exercised |
|
(181,504 |
) |
$ |
4.76 |
|
|
(67,145 |
) |
$ |
3.79 |
|
| Forfeited |
|
(36,024 |
) |
$ |
7.92 |
|
|
(80,306 |
) |
$ |
8.33 |
|
| Expired |
|
(12,087 |
) |
$ |
10.24 |
|
|
- |
|
$ |
- |
|
| Balance, end of period |
|
2,856,229 |
|
$ |
7.45 |
|
|
2,182,970 |
|
$ |
7.23 |
|
The following table presents the weighted average fair value assumptions used in the Black-Scholes valuation of these options:
| For options granted during the period |
|
Mar. 31, 2024 |
|
|
Dec. 31, 2023 |
|
| Weighted average share price at grant date (CAD) |
$ |
7.50 |
|
$ |
6.75 |
|
| Risk-free rate |
|
3.49% |
|
|
3.40% |
|
| Expected dividend yield |
|
0.3% |
|
|
0.3% |
|
| Expected stock price volatility (based on historical volatility) |
|
51.4% |
|
|
56.0% |
|
| Expected life of option (months) |
|
84 |
|
|
84 |
|
| Weighted average per share fair value of stock options granted (CAD) |
$ |
4.11 |
|
$ |
3.90 |
|
The following table outlines stock options outstanding and exercisable:
| Mar. 31, 2024 |
|
Range of
exercise prices
C$ |
|
Number of
options
outstanding |
|
|
Weighted average
remaining
contractual life
(years) |
|
|
Weighted
average
exercise price
C$ |
|
|
Number of
options
exercisable |
|
|
Weighted
average share
price at exercise
date C$ |
|
| $3.76 - $5.90 |
|
445,854 |
|
|
2.9 |
|
$ |
3.76 |
|
|
445,854 |
|
$ |
3.76 |
|
| $5.91 - $6.75 |
|
722,206 |
|
|
5.9 |
|
$ |
6.75 |
|
|
217,750 |
|
$ |
6.75 |
|
| $6.76 - $8.76 |
|
905,748 |
|
|
6.9 |
|
$ |
7.50 |
|
|
- |
|
$ |
- |
|
| $8.77 - $10.17 |
|
448,036 |
|
|
4.9 |
|
$ |
9.92 |
|
|
298,594 |
|
$ |
9.92 |
|
| $10.18 - $10.42 |
|
334,385 |
|
|
3.9 |
|
$ |
10.42 |
|
|
334,385 |
|
$ |
10.42 |
|
| Dec. 31, 2023 |
|
Range of
exercise prices
C$ |
|
Number of
options
outstanding |
|
|
Weighted average
remaining
contractual life
(years) |
|
|
Weighted
average exercise
price C$ |
|
|
Number of
options
exercisable |
|
|
Weighted
average share
price at
exercise date
C$ |
|
| $3.76 - $4.82 |
|
568,801 |
|
|
3.15 |
|
$ |
3.76 |
|
|
568,801 |
|
$ |
3.76 |
|
| $5.91 - $6.75 |
|
779,959 |
|
|
6.17 |
|
$ |
6.75 |
|
|
- |
|
$ |
- |
|
| $6.76 - $10.17 |
|
488,340 |
|
|
5.17 |
|
$ |
9.76 |
|
|
174,989 |
|
$ |
9.57 |
|
| $10.18 - $10.42 |
|
345,870 |
|
|
4.15 |
|
$ |
10.42 |
|
|
230,514 |
|
$ |
10.42 |
|
Hudbay estimates expected life of options and expected volatility based on historical data, which may differ from actual outcomes.
21. Earnings per share
| |
|
Three months ended March 31, |
|
| |
|
2024 |
|
|
2023 |
|
| Weighted average common shares outstanding |
|
|
|
|
|
|
| Basic |
|
350,781,240 |
|
|
262,030,805 |
|
| Plus net incremental shares from: |
|
|
|
|
|
|
| Assumed conversion: stock options |
|
167,472 |
|
|
294,124 |
|
| Assumed conversion: warrants |
|
21,636 |
|
|
- |
|
| Diluted weighted average common shares outstanding |
|
350,970,348 |
|
|
262,324,929 |
|
22. Financial instruments
(a) Fair value and carrying value of financial instruments:
The following presents the fair value ("FV") and carrying value ("CV") of Hudbay's financial instruments and non-financial derivatives:
| |
|
Mar. 31, 2024 |
|
|
Dec. 31, 2023 |
|
| |
|
FV |
|
|
CV |
|
|
FV |
|
|
CV |
|
| Financial assets at amortized cost |
|
|
|
|
|
|
|
|
|
|
|
|
| Cash and cash equivalents1 |
$ |
284,385 |
|
$ |
284,385 |
|
$ |
249,794 |
|
$ |
249,794 |
|
| Guaranteed investment certificates1 |
|
1,331 |
|
|
1,331 |
|
|
1,359 |
|
|
1,359 |
|
| Restricted cash1 |
|
536 |
|
|
536 |
|
|
1,964 |
|
|
1,964 |
|
| Fair value through profit or loss |
|
|
|
|
|
|
|
|
|
|
|
|
| Trade and other receivables2,3 |
|
154,934 |
|
|
154,934 |
|
|
176,214 |
|
|
176,214 |
|
| Non-hedge derivative assets 4 |
|
520 |
|
|
520 |
|
|
1,416 |
|
|
1,416 |
|
| Investments 5 |
|
6,137 |
|
|
6,137 |
|
|
6,452 |
|
|
6,452 |
|
| Total financial assets |
$ |
447,843 |
|
$ |
447,843 |
|
$ |
437,199 |
|
$ |
437,199 |
|
| Financial liabilities at amortized cost |
|
|
|
|
|
|
|
|
|
|
|
|
| Trade and other payables1, 2 |
|
222,202 |
|
|
222,202 |
|
|
219,304 |
|
|
219,304 |
|
| Deferred Rosemont acquisition consideration 8 |
|
9,855 |
|
|
9,855 |
|
|
9,713 |
|
|
9,713 |
|
| Agreements with communities 6 |
|
55,723 |
|
|
57,929 |
|
|
53,459 |
|
|
54,979 |
|
| Wheaton refund liability10 |
|
10,604 |
|
|
6,812 |
|
|
10,346 |
|
|
6,653 |
|
| Senior unsecured notes 7 |
|
1,174,692 |
|
|
1,191,220 |
|
|
1,176,312 |
|
|
1,190,586 |
|
| Senior secured revolving credit facilities11 |
|
87,367 |
|
|
87,367 |
|
|
96,950 |
|
|
96,950 |
|
| Fair value through profit or loss |
|
|
|
|
|
|
|
|
|
|
|
|
| Gold prepayment liability 9 |
|
37,945 |
|
|
37,945 |
|
|
55,901 |
|
|
55,901 |
|
| Non-hedge derivative liabilities 4 |
|
12,030 |
|
|
12,030 |
|
|
11,811 |
|
|
11,811 |
|
| Total financial liabilities |
$ |
1,610,418 |
|
$ |
1,625,360 |
|
$ |
1,633,796 |
|
$ |
1,645,897 |
|
1 Cash and cash equivalents, guaranteed investment certificates, restricted cash, trade and other payables are recorded at carrying value, which approximates fair value due to their short-term nature and generally negligible credit losses.
2 Excludes tax and other statutory amounts.
3 Trade and other receivables contain receivables including provisionally priced receivables classified as FVTPL and various other items at amortized cost. The fair value of provisionally priced receivables is determined using forward metals prices (level 2).
4 Derivatives are carried at their fair value, which is determined based on observable forward market commodity prices corresponding to the maturity of the contract (level 2),
5 All investments are carried at their fair value, which is determined using quoted market bid prices in active markets for listed shares.
6 These financial liabilities relate to agreements with communities near the Constancia project in Peru (note 13). Fair values have been determined using an applicable credit-risk adjusted discounted rate and foreign exchange rates (level 3).
7 Fair value of the senior unsecured notes (note 16a) has been determined using an applicable credit-risk adjusted discount rate (level 3).
8 Discounted value based on a risk adjusted discount rate.
9 The gold prepayment liability (note 14) is designated as fair value through profit or loss under the fair value option. Fair value is determined using observable gold forward prices corresponding to the delivery of gold ounces in the contract along with an estimate of credit-risk for similar instruments (level 3). Gains and losses related to the Company's own credit-risk have been recorded at fair value through other comprehensive income. The fair value adjustment recorded in other comprehensive income for the three months ended March 31, 2024 was a loss of $15 (year ended December 31, 2023 was a loss of $192).
10 Discounted value based on a market rate at inception of the applicable Wheaton contract for carrying value (note 13) and fair value using an applicable credit-risk adjusted discount rate (level 3).
11 Fair value of the senior secured revolving credit facility is valued using an applicable credit adjusted discount rate (level 3).
Fair value hierarchy
The table below provides an analysis by valuation method of financial instruments that are measured at fair value subsequent to recognition as well as financial instruments not measured at fair value but for which a fair value is disclosed. Levels 1 to 3 are defined based on the degree to which fair value inputs are observable and have a significant effect on the recorded fair value, as follows:
- Level 1: Quoted prices in active markets for identical assets or liabilities;
- Level 2: Valuation techniques use significant observable inputs, either directly or indirectly, or valuations are based on quoted prices for similar instruments; and,
- Level 3: Valuation techniques use significant inputs that are not based on observable market data.
| March 31, 2024 |
|
Level 1 |
|
|
Level 2 |
|
|
Level 3 |
|
|
Total |
|
| Financial assets at FVTPL: |
|
|
|
|
|
|
|
|
|
|
|
|
| Non-hedge derivatives |
$ |
- |
|
$ |
520 |
|
$ |
- |
|
$ |
520 |
|
| Investments |
|
6,137 |
|
|
- |
|
|
- |
|
|
6,137 |
|
| |
$ |
6,137 |
|
$ |
520 |
|
$ |
- |
|
$ |
6,657 |
|
| Financial liabilities at FVTPL: |
|
|
|
|
|
|
|
|
|
|
|
|
| Non-hedge derivatives |
$ |
- |
|
$ |
12,030 |
|
$ |
- |
|
$ |
12,030 |
|
| Gold prepayment liability |
|
- |
|
|
37,945 |
|
|
- |
|
|
37,945 |
|
| Financial liabilities at amortized cost: |
|
|
|
|
|
|
|
|
|
|
|
|
| Agreements with communities |
|
- |
|
|
- |
|
|
55,723 |
|
|
55,723 |
|
| Wheaton refund liability |
|
- |
|
|
- |
|
|
10,604 |
|
|
10,604 |
|
| Senior secured revolving credit facilities |
|
- |
|
|
- |
|
|
87,367 |
|
|
87,367 |
|
| Senior unsecured notes |
|
1,174,692 |
|
|
- |
|
|
- |
|
|
1,174,692 |
|
| |
$ |
1,174,692 |
|
$ |
49,975 |
|
$ |
153,694 |
|
$ |
1,378,361 |
|
| December 31, 2023 |
|
Level 1 |
|
|
Level 2 |
|
|
Level 3 |
|
|
Total |
|
| Financial assets at FVTPL: |
|
|
|
|
|
|
|
|
|
|
|
|
| Non-hedge derivatives |
$ |
- |
|
$ |
1,416 |
|
$ |
- |
|
$ |
1,416 |
|
| Investments |
|
6,452 |
|
|
- |
|
|
- |
|
|
6,452 |
|
| |
$ |
6,452 |
|
$ |
1,416 |
|
$ |
- |
|
$ |
7,868 |
|
| Financial liabilities at FVTPL: |
|
|
|
|
|
|
|
|
|
|
|
|
| Non-hedge derivatives |
$ |
- |
|
$ |
11,811 |
|
$ |
- |
|
$ |
11,811 |
|
| Gold prepayment liability |
|
- |
|
|
55,901 |
|
|
- |
|
|
55,901 |
|
| Financial liabilities at amortized cost: |
|
|
|
|
|
|
|
|
|
|
|
|
| Agreements with communities |
|
- |
|
|
- |
|
|
53,459 |
|
|
53,459 |
|
| Wheaton refund liability |
|
- |
|
|
- |
|
|
10,346 |
|
|
10,346 |
|
| Senior secured revolving credit facilities |
|
- |
|
|
- |
|
|
96,950 |
|
|
96,950 |
|
| Senior unsecured notes |
|
1,176,312 |
|
|
- |
|
|
- |
|
|
1,176,312 |
|
| |
$ |
1,176,312 |
|
$ |
67,712 |
|
$ |
160,755 |
|
$ |
1,404,779 |
|
The Company's policy is to recognize transfers into and transfers out of fair value hierarchy levels as of the date of the event or change in circumstances that caused the transfer. During the three months ended March 31, 2024 and year ended December 31, 2023, Hudbay did not make any such transfers.
Valuation techniques used for instruments categorized in Levels 2 and 3 are consistent with the year ended December 31, 2023.
(b) Derivatives and hedging:
Copper fixed for floating swaps
Hudbay enters into copper fixed for floating swaps in order to manage the risk associated with provisional pricing terms in copper concentrate sales agreements. As at March 31, 2024, Hudbay had 83.6 million pounds of net copper swaps outstanding at an effective average price of $3.91/lb and settling from April to July 2024. As at December 31, 2023, Hudbay had 90.6 million pounds of net copper swaps outstanding at an effective average price of $3.74/lb and settling from January to May 2024. The aggregate fair value of the transactions at March 31, 2024 was a liability of $8,607 (December 31, 2023 - a liability position of $9,515).
Zinc fixed for floating swaps
Hudbay enters into zinc fixed for floating swaps in order to manage the risk associated with provisional pricing terms in zinc concentrate sales agreements. As at March 31, 2024, Hudbay had 9.2 million pounds of net zinc swaps outstanding at an effective average price of $1.14/lb and settling in May 2024. As at December 31, 2023, Hudbay had 13.9 million pounds of net zinc swaps outstanding at an effective average price of $1.14/lb and settling from January to March 2024. The aggregate fair value of the transactions at March 31, 2024 was an asset of $423 (December 31, 2023 - a liability position of $945).
Copper forward sales
As at March 31, 2024, Hudbay had 15.9 million pounds of copper forwards outstanding at an effective average price of $3.95/lb and settling from May 2024 to April 2025. As of December 31, 2023, Hudbay had 7.9 million pounds of copper forwards outstanding at an effective average price of $3.93/lb and settling from May 2024 to April 2025. The aggregate fair value of the transactions at March 31, 2024 was a liability of $1,752 (December 31, 2023 - an asset position of $65).
Copper costless collars
At at March 31, 2024, Hudbay had 19.8 million pounds of copper collars outstanding settling from May 2024 to April 2025 at an average floor price of $3.88/lb and an average cap price of $4.14/lb. As at December 31, 2023, Hudbay had 13.2 million pounds of copper collars outstanding settling from May 2024 to April 2025 at an average floor price of $3.83/lb and an average cap price of $4.03/lb. The aggregate fair value of the position at March 31, 2024 was a liability of $1,122 (December 31, 2023 - nil).
Gold costless collars
During the first quarter of 2024, Hudbay entered into zero-cost collar program for 4,000 ounces of gold production per month over the period of April 2024 to December 2024 at an average floor price of $2,088/oz and an average cap price of $2,458/oz. As at March 31, 2024, 36,000 ounces of gold collars were unsettled (December 31, 2023 - nil). The aggregate fair value of the position at March 31, 2024 was a liability of $452 (December 31, 2023 - nil).
(c) Provisionally priced receivables
Changes in fair value of provisionally priced receivables
Hudbay records changes in fair value of provisionally priced receivables related to provisional pricing in concentrate purchase, concentrate sale and certain other sale contracts. Under the terms of these contracts, prices are subject to final adjustment at the end of a future period after title transfers based on quoted market prices during the quotation period specified in the contract. The period between provisional pricing and final pricing is typically up to three months.
Changes in fair value of provisionally priced receivables are presented in trade and other receivables when they relate to sales contracts and in trade and other payables when they relate to purchase contracts. At each reporting date, provisionally priced metals are marked-to-market based on the forward market price for the quotation period stipulated in the contract, with changes in fair value recognized in revenue for sales contracts and in inventory or cost of sales for purchase concentrate contracts. Cash flows related to changes in fair value of provisionally priced receivables are classified in operating activities.
As at March 31, 2024 and December 31, 2023, Hudbay's net position consisted of contracts awaiting final pricing are as indicated below:
Metal in
concentrate |
|
|
Sales awaiting final pricing |
|
|
Average YTD price ($/unit) |
|
| Unit |
|
Mar. 31, 2024 |
|
|
Dec. 31, 2023 |
|
|
Mar. 31, 2024 |
|
|
Dec. 31, 2023 |
|
| Copper |
pounds
(in thousands) |
|
94,483 |
|
|
111,069 |
|
|
4.01 |
|
|
3.87 |
|
| Gold |
troy ounces |
|
45,707 |
|
|
50,563 |
|
|
2,224 |
|
|
2,072 |
|
| Silver |
troy ounces |
|
176,157 |
|
|
205,579 |
|
|
24.89 |
|
|
23.94 |
|
| Zinc |
pounds
(in thousands) |
|
5,711 |
|
|
16,416 |
|
|
1.09 |
|
|
1.20 |
|
| |
|
|
|
|
|
|
|
|
|
|
|
|
|
The aggregate fair value of provisionally priced receivables within the copper and zinc concentrate at March 31, 2024, was an asset position of $25,159 (December 31, 2023 - an asset position of $22,635).
(d) Other financial liabilities
Gold prepayment liability
The gold prepayment liability (note 14) requires settlement by physical delivery of gold ounces or equivalent gold credits. The fair value of the financial liability at March 31, 2024 was $37,945 (December 31, 2023 - a liability of $55,901).
23. Commitments
Capital commitments
As at March 31, 2024, Hudbay had outstanding capital commitments in Manitoba of approximately $11,422 of which $7,500 can be terminated, approximately $9,863 in British Columbia, all of which can be terminated, approximately $66,469 in Peru, all of which can be terminated, and approximately $34,718 in Arizona, primarily related to the Copper World Complex, of which none can be terminated.
24. Supplementary cash flow information
(a) Other operating activities:
| |
|
Three months ended March 31, |
|
| |
|
2024 |
|
|
2023 |
|
| Share-based compensation paid |
$ |
(2,524 |
) |
$ |
(5,817 |
) |
| Write-down/loss on disposal of PP&E |
|
9,045 |
|
|
69 |
|
| Restructuring paid |
|
(207 |
) |
|
(575 |
) |
| Other |
|
5 |
|
|
(147 |
) |
| |
$ |
6,319 |
|
$ |
(6,470 |
) |
(b) Change in non-cash working capital:
| |
|
Three months ended March 31, |
|
| |
|
2024 |
|
|
2023 |
|
| Change in: |
|
|
|
|
|
|
| Trade and other receivables |
$ |
3,928 |
|
$ |
9,780 |
|
| Other financial assets/liabilities |
|
(242 |
) |
|
(10,531 |
) |
| Inventories |
|
5,668 |
|
|
(19,290 |
) |
| Prepaid expenses |
|
(7,979 |
) |
|
766 |
|
| Trade and other payables |
|
(13,254 |
) |
|
(18,934 |
) |
| Provisions and other liabilities |
|
4,016 |
|
|
23,880 |
|
| |
$ |
(7,863 |
) |
$ |
(14,329 |
) |
(c) Non-cash transactions:
During the three months ended March 31, 2024 and 2023, Hudbay entered into the following non-cash investing and financing activities which are not reflected in the condensed consolidated interim statements of cash flows:
- Remeasurement of Hudbay's decommissioning and restoration liabilities led to a net decrease in related property, plant and equipment assets of $5,932 (March 31, 2023 - a net increase of $6,112), mainly related to changes to real discount rates associated with remeasurement of the liabilities.
- Property, plant and equipment included $7,849 (March 31, 2023 - $560) of capital additions related to the recognition of ROU assets and $7,341 (March 31, 2023 - nil) of capital additions related to the recognition of property, plant and equipment that has been financed. Property, plant and equipment and other assets include $1,845 of capital additions related to agreements with communities (March 31, 2023 - nil).
25. Segmented information
Hudbay has the following reportable segments identified by the individual mining operations of Manitoba, British Columbia, Peru, as well as Arizona which holds our Copper World project. Corporate and other activities are not considered an operating segment and are included as a reconciliation to total consolidated results. No results for the British Columbia segment are reflected in the prior period comparative figures as Copper Mountain acquisition closed on June 20, 2023. Corporate and other activities include the Company's exploration activities in Chile, Canada and the State of Nevada. These exploration entities are not individually significant, as they do not meet the minimum quantitative thresholds for standalone segment disclosure.
| Three months ended March 31, 2024 |
|
| |
|
Peru |
|
|
Manitoba |
|
|
British
Columbia |
|
|
Arizona |
|
|
Corporate
and other
activities |
|
|
Total |
|
| Revenue from external customers |
$ |
287,906 |
|
$ |
169,236 |
|
$ |
67,847 |
|
$ |
- |
|
$ |
- |
|
$ |
524,989 |
|
| Cost of sales |
|
|
|
|
|
|
|
|
|
|
|
|
|
|
|
|
|
|
| Mine operating costs |
|
128,827 |
|
|
78,023 |
|
|
56,912 |
|
|
- |
|
|
- |
|
|
263,762 |
|
| Depreciation and amortization |
|
71,030 |
|
|
26,594 |
|
|
11,649 |
|
|
- |
|
|
- |
|
|
109,273 |
|
| Gross profit (loss) |
|
88,049 |
|
|
64,619 |
|
|
(714 |
) |
|
- |
|
|
- |
|
|
151,954 |
|
| Selling and administrative expenses |
|
- |
|
|
- |
|
|
- |
|
|
- |
|
|
16,607 |
|
|
16,607 |
|
| Exploration expenses |
|
2,192 |
|
|
8,456 |
|
|
353 |
|
|
- |
|
|
1,592 |
|
|
12,593 |
|
| Other expenses |
|
3,206 |
|
|
3,205 |
|
|
1,142 |
|
|
8,246 |
|
|
461 |
|
|
16,260 |
|
| Re-evaluation adjustment - environmental provision |
|
- |
|
|
(5,269 |
) |
|
- |
|
|
- |
|
|
- |
|
|
(5,269 |
) |
| Results from operating activities |
$ |
82,651 |
|
$ |
58,227 |
|
$ |
(2,209 |
) |
$ |
(8,246 |
) |
$ |
(18,660 |
) |
$ |
111,763 |
|
| Net interest expense on long term debt |
|
|
19,208 |
|
| Accretion on streaming arrangements |
|
|
6,176 |
|
| Change in fair value of financial instruments |
|
|
6,954 |
|
| Other net finance costs |
|
|
11,675 |
|
| Earnings before tax |
|
|
67,750 |
|
| Tax expense |
|
|
49,215 |
|
| Net earnings for the period |
|
$ |
18,535 |
|
| Three months ended March 31, 2023 |
|
| |
|
Peru |
|
|
Manitoba |
|
|
Arizona |
|
|
Corporate
and other
activities |
|
|
Total |
|
| Revenue from external customers |
$ |
186,802 |
|
$ |
108,417 |
|
$ |
- |
|
$ |
- |
|
$ |
295,219 |
|
| Cost of sales |
|
|
|
|
|
|
|
|
|
|
|
|
|
|
|
| Mine operating costs |
|
91,386 |
|
|
69,898 |
|
|
- |
|
|
- |
|
|
161,284 |
|
| Depreciation and amortization |
|
41,960 |
|
|
25,462 |
|
|
- |
|
|
- |
|
|
67,422 |
|
| Gross profit |
|
53,456 |
|
|
13,057 |
|
|
- |
|
|
- |
|
|
66,513 |
|
| Selling and administrative expenses |
|
- |
|
|
- |
|
|
- |
|
|
9,146 |
|
|
9,146 |
|
| Exploration expenses |
|
3,509 |
|
|
4,578 |
|
|
- |
|
|
155 |
|
|
8,242 |
|
| Other expenses |
|
1,221 |
|
|
3,549 |
|
|
175 |
|
|
14 |
|
|
4,959 |
|
| Re-evaluation adjustment - environmental provision |
|
- |
|
|
(8,240 |
) |
|
- |
|
|
- |
|
|
(8,240 |
) |
| Results from operating activities |
$ |
48,726 |
|
$ |
13,170 |
|
$ |
(175 |
) |
$ |
(9,315 |
) |
$ |
52,406 |
|
| Net interest expense on long term debt |
|
|
17,007 |
|
| Accretion on streaming arrangements |
|
|
6,501 |
|
| Change in fair value of financial instruments |
|
|
5,597 |
|
| Other net finance costs |
|
|
5,871 |
|
| Earnings before tax |
|
|
17,430 |
|
| Tax expense |
|
|
11,973 |
|
| Net earnings for the period |
|
$ |
5,457 |
|
| March 31, 2024 |
|
| |
|
Peru |
|
|
Manitoba |
|
|
British
Columbia |
|
|
Arizona |
|
|
Corporate
and other
activities |
|
|
Total |
|
| Total assets |
$ |
2,396,322 |
|
$ |
624,115 |
|
$ |
1,002,857 |
|
$ |
729,746 |
|
$ |
478,243 |
|
$ |
5,231,283 |
|
| Total liabilities |
|
1,026,040 |
|
|
407,358 |
|
|
269,313 |
|
|
21,461 |
|
|
1,296,078 |
|
|
3,020,250 |
|
| Property, plant and equipment1 |
|
1,971,190 |
|
|
662,663 |
|
|
834,387 |
|
|
721,235 |
|
|
42,061 |
|
|
4,231,536 |
|
1 Included in Corporate and other activities are $27.6 million of property, plant and equipment that is located in Nevada.
| December 31, 2023 |
|
| |
|
Peru |
|
|
Manitoba2 |
|
|
British
Columbia2 |
|
|
Arizona |
|
|
Corporate
and other
activities2 |
|
|
Total |
|
| Total assets |
$ |
2,406,260 |
|
$ |
673,437 |
|
$ |
1,018,602 |
|
$ |
736,680 |
|
$ |
477,655 |
|
$ |
5,312,634 |
|
| Total liabilities |
|
1,086,229 |
|
|
413,355 |
|
|
274,510 |
|
|
23,446 |
|
|
1,308,255 |
|
|
3,105,795 |
|
| Property, plant and equipment1 |
|
2,001,716 |
|
|
693,972 |
|
|
850,477 |
|
|
727,903 |
|
|
41,938 |
|
|
4,316,006 |
|
1 Included in Corporate and other activities are $27.6 million of property, plant and equipment that is located in Nevada.
2 On January 1, 2024, the Company amalgamated with Copper Mountain Mining Inc., Hudbay British Columbia Inc. and Rockcliff Metals Corp. and continued carrying on business as Hudbay Minerals Inc. Following the amalgamation Copper Mountain Mining Inc. and Hudbay British Columbia Inc, which do not contain operating assets and have liabilities primarily related to head office finance leases, have moved from British Columbia to Corporate and other activities. Rockcliff Metals Corp. has move from Corporate and other activities to the Manitoba segment

Management's Discussion and Analysis of
Results of Operations and Financial Condition
For the three months ended
March 31, 2024
May 13, 2024
INTRODUCTION
This Management's Discussion and Analysis ("MD&A") dated May 13, 2024 is intended to supplement Hudbay Minerals Inc.'s unaudited condensed consolidated interim financial statements and related notes for the three months ended March 31, 2024 and 2023 (the "consolidated interim financial statements"). The consolidated interim financial statements have been prepared in accordance with International Financial Reporting Standards ("IFRS"), including International Accounting Standard 34, Interim Financial Reporting, as issued by the International Accounting Standards Board ("IASB").
References to "Hudbay", the "Company", "we", "us", "our" or similar terms refer to Hudbay Minerals Inc. and its direct and indirect subsidiaries as at March 31, 2024.
Readers should be aware that:
- This MD&A contains certain "forward-looking statements" and "forward-looking information" (collectively, "forward-looking information") that are subject to risk factors set out in a cautionary note contained in our MD&A.
- This MD&A excludes first quarter 2023 comparable figures for Copper Mountain, as we completed the Copper Mountain acquisition at the end of the second quarter of 2023.
- This MD&A has been prepared in accordance with the requirements of the securities laws in effect in Canada, which may differ materially from the requirements of United States securities laws applicable to US issuers.
- We use a number of non-IFRS financial performance measures in our MD&A, which do not have standardized meaning under IFRS. For further information and detailed reconciliations of such measures, please see the discussion under the "Non-IFRS Financial Performance Measures" section herein.
- The technical and scientific information in this MD&A has been approved by qualified persons based on a variety of assumptions and estimates. Please see the discussion under the "Qualified Person and NI 43-101" section herein.
Readers are also urged to review the "Financial Risk Management" and "Notes to Reader" sections beginning on pages 37 and 54 of this MD&A.
Additional information regarding Hudbay, including the risks related to our business and those that are reasonably likely to affect our consolidated interim financial statements in the future, is contained in our continuous disclosure materials, including our most recent AIF, consolidated interim financial statements and Management Information Circular available on SEDAR+ at www.sedarplus.ca and on EDGAR at www.sec.gov.
All amounts are in US dollars unless otherwise noted.
OUR BUSINESS
We are a diversified mining company with long-life assets in North and South America. Our Constancia operations in Cusco (Peru) produce copper with gold, silver and molybdenum by-products. Our Snow Lake operations in Manitoba (Canada) produce gold with copper, zinc and silver by-products. Our Copper Mountain operations in British Columbia (Canada) produce copper with gold and silver by-products. We have a development pipeline that includes the Copper World project in Arizona (United States) and the Mason project in Nevada (United States), and our growth strategy is focused on the exploration, development, operation, and optimization of properties we already control, as well as other mineral assets we may acquire that fit our strategic criteria. We are governed by the Canada Business Corporations Act and our shares are listed under the symbol "HBM" on the Toronto Stock Exchange, New York Stock Exchange and Bolsa de Valores de Lima.
OUR PURPOSE
We care about our people, our communities and our planet. Hudbay provides the metals the world needs. We work sustainably, transform lives and create better futures for communities.
We transform lives: We invest in our employees, their families and local communities through long-term employment, local procurement and economic development to improve their quality of life and ensure the communities benefit from our presence.
We operate responsibly: From exploration to closure, we operate safely and responsibly, we welcome innovation and we strive to minimize our environmental footprint while following leading operating practices in all facets of mining.
We provide critical metals: We produce copper and other metals needed for everyday products and essential for applications to support the energy transition toward a more sustainable future.
SUMMARY
Delivered Strong First Quarter Operating and Financial Results; Production and Cost Guidance Affirmed
- Enhanced operating platform delivered consolidated copper production of 34,749 tonnes and stronger-than-expected gold production of 90,392 ounces in the first quarter.
- Solid operating performance was driven by continued high copper and gold grades at the Pampacancha deposit in Peru, continued high gold grades at Lalor and strong performance from the New Britannia mill in Manitoba and the operational stabilization efforts at the Copper Mountain mine in British Columbia.
- Achieved revenue of $525.0 million and operating cash flow before change in non-cash working capital of $147.5 million in the first quarter of 2024.
- Affirmed full year 2024 consolidated copper production and cash cost guidance of 137,000 to 176,000 tonnes of copper at a cash cost of $1.05 to $1.25 per pound1 and sustaining cash cost of $2.00 to $2.45 per pound1.
- Consolidated cash cost1 and sustaining cash cost1 per pound of copper produced, net of by-product credits1, in the first quarter of 2024, were $0.16 and $1.03, respectively, consistent with strong levels achieved in the fourth quarter of 2023.
- Peru operations benefited from continued contributions from the high-grade Pampacancha satellite pit, resulting in 24,576 tonnes of copper and 29,144 ounces of gold produced in the first quarter of 2024. Peru cash cost per pound of copper produced, net of by-product credits1, in the first quarter improved to $0.43, a 20% decrease compared to the fourth quarter of 2023.
- Manitoba operations produced 56,831 ounces of gold in the first quarter of 2024, exceeding management's quarterly cadence expectations as New Britannia continues to operate well above nameplate capacity and budgeted throughput levels. Manitoba cash cost per ounce of gold produced, net of by-product credits1, was $736 during the first quarter of 2024 and well within guidance expectations.
- British Columbia operations produced 7,024 tonnes of copper at a cash cost per pound of copper produced, net of by-product credits1, of $3.49 in the first quarter. Operational stabilization plans continue to be advanced at the Copper Mountain mine.
- First quarter net earnings and earnings per share were $18.5 million and $0.05, respectively. After adjusting for a non-cash gain of $5.3 million related to a quarterly revaluation of our closed site environmental reclamation provision, a $12.8 million mark-to-market adjustment loss related to share-based compensation, gold prepayment liability and strategic gold and copper hedges and a $9.0 million write-down of property, plant and equipment ("PP&E"), among other items, first quarter adjusted earnings1 per share were $0.16.
- Cash and cash equivalents increased by $34.6 million to $284.4 million during the first quarter due to strong operating cash flows bolstered by higher copper and gold prices and sales volumes enabling a $43.5 million reduction in net debt1 during the quarter.
Operating Performance and Financial Discipline Driving Free Cash Flow and Deleveraging
- Unique copper and gold diversification provides exposure to higher copper and gold prices and attractive free cash flow generation.
- Executed on planned higher production levels and achieved continued operating and capital cost efficiencies to generate significant free cash flow in the first quarter.
- Realized strong margins by maintaining low consolidated cash cost of $0.16 per pound of copper in the first quarter while benefiting from higher copper prices, positioning the company for continued significant cash flow generation in a period of high commodity prices.
- Achieved adjusted EBITDA1 of $214.2 million in the first quarter and a trailing twelve month adjusted EBITDA1 of $760.5 million.
- Reduced net debt1 to $994.2 million during the first quarter, which, together with higher levels of adjusted EBITDA1, further improved our net debt to adjusted EBITDA ratio1 to 1.3x compared to 1.6x at the end of 2023.
- Continued deleveraging efforts with a $10 million repayment of our revolving credit facility balance in January 2024 and an additional $10 million repayment after quarter-end in May 2024.
- Increased cash and total liquidity by $45.2 million to $618.9 million as at March 31, 2024 compared to the end of 2023.
Continued Execution of Growth Initiatives to Further Enhance Copper and Gold Exposure
- Post-acquisition plans to stabilize the Copper Mountain operations remain in progress, with a focus on mining fleet ramp-up activities, accelerated stripping and increasing mill reliability. Achieved better than planned copper recoveries of 83% in the first quarter, and stabilization benefits continued to be realized subsequent to quarter end with 83% copper recoveries and approximately 40,000 tonnes per day average mill throughput in the month of April.
- Constancia's expected mine life extended by three years to 2041 as a result of mineral reserve conversion with the addition of a further mining phase at the Constancia pit.
- The New Britannia mill achieved record throughput levels averaging 1,870 tonnes per day in the first quarter, exceeding its original design capacity of 1,500 tonnes per day due to the successful implementation of process improvement initiatives and effective preventative maintenance measures. Received permit to increase New Britannia throughput to 2,500 tonnes per day.
- Achieved copper recoveries of approximately 92% and gold recoveries of approximately 68% at the Stall mill in the first quarter of 2024 as we continue to benefit from the Stall mill recovery improvement project, which was completed in 2023.
- The development of an access drift to the 1901 deposit in Snow Lake remains on track and on budget. 1901 is located within 1,000 metres of the existing underground ramp access to the Lalor mine. The drift is expected to reach mineralization in late-2024, which is intended to enable confirmation of the optimal mining method and conducting drilling to further evaluate the orebody and upgrade inferred gold resources to reserves.
- Progressing the three prerequisites plan (the "3-P plan") for sanctioning Copper World with deleveraging advancing towards targeted levels and remaining key state permits expected in 2024.
- Drill permitting for highly prospective Maria Reyna and Caballito properties near Constancia continues to advance through the regulatory process with environmental impact assessment applications submitted for both properties in recent months.
- Largest annual exploration program in Snow Lake underway consisting of geophysical surveys and drill campaigns testing the newly acquired Cook Lake claims, former Rockcliff properties and near-mine exploration at Lalor.
- Advancing Flin Flon tailings reprocessing opportunities through metallurgical test work and early economic evaluation to potentially produce critical minerals and precious metals while reducing the environmental footprint.
- Entered into an option agreement with Marubeni Corporation relating to three exploration projects located near Hudbay's existing Flin Flon processing facilities.
Summary of First Quarter Results
Cash generated from operating activities in the first quarter of 2024 increased to $139.7 million compared to $71.3 million in the same quarter of 2023. Operating cash flow before change in non-cash working capital during the first quarter of 2024 was $147.5 million, reflecting an increase of $61.9 million compared to the same period of 2023. The increase in operating cash flow before change in non-cash working capital was primarily the result of higher copper and gold sales volumes from mining the high copper and gold grade zones of the Pampacancha deposit and higher gold and copper grade zones at Lalor, higher gold prices, as well as an incremental contribution from the Copper Mountain mine. This was partially offset by a significant increase in cash taxes paid of $54.9 million mainly at our Peru operations, compared to the same period in 2023.
Incorporating the first quarter operating results of the Copper Mountain mine, consolidated copper, gold and silver production in the first quarter of 2024 increased by 54%, 91% and 35%, respectively, compared to the same period in 2023 primarily due to meaningfully higher recoveries in Peru and Manitoba, mining of the high copper and gold grade zones at the Pampacancha deposit, higher gold and copper grade zones at Lalor and incremental production from the Copper Mountain mine. Consolidated zinc production in the first quarter of 2024 decreased by 11% compared to the same period in 2023 primarily due to lower mill throughput and lower planned zinc grades as we continue to prioritize the higher gold and copper grade areas at Lalor.
Net earnings and earnings per share in the first quarter of 2024 were $18.5 million and $0.05, respectively, compared to net earnings and earnings per share of $5.5 million and $0.02, respectively, in the first quarter of 2023. The results were positively impacted by higher copper, gold and silver sales volumes as well as higher realized gold prices and a non-cash gain of $5.3 million related to the quarterly revaluation of the environmental reclamation provision at our closed sites. This was partially offset by a $12.8 million mark-to-market adjustment loss related to share-based compensation expense, a revaluation of the gold prepayment liability and a revaluation of our strategic gold and copper hedges and a $9.0 million write-down of PP&E.
Adjusted net earnings1 and adjusted net earnings per share1 in the first quarter of 2024 were $57.6 million and $0.16 per share, respectively, after adjusting for the non-cash gain related to the revaluation of our environmental provision, the non-cash mark-to-market revaluation loss and the PP&E write-down, among other items. This compares to adjusted net earnings and adjusted net earnings per share of $0.1 million, and $0.00 in the same period of 2023.
First quarter adjusted EBITDA1 was $214.2 million, compared to $101.9 million in the same period in 2023.
In the first quarter of 2024, consolidated cash cost per pound of copper produced, net of by-product credits1, was $0.16, compared to $0.85 in the same period in 2023. This decrease was mainly the result of higher copper production and significantly higher by-product credits, partially offset by higher mining, milling and G&A costs from incorporating Copper Mountain. Consolidated sustaining cash cost per pound of copper produced, net of by-product credits1, was $1.03 in the first quarter of 2024 compared to $1.83 in the same period in 2023. This decrease was primarily due to the same reasons outlined above partially offset by higher cash sustaining capital expenditures.
Consolidated all-in sustaining cash cost per pound of copper produced, net of by-product credits1, was $1.32 in the first quarter of 2024, lower than $2.07 in the same period in 2023, due to the same reasons outlined above partially offset by higher corporate selling and administrative expenses.
As at March 31, 2024, total liquidity increased to $618.9 million, including $284.4 million in cash and cash equivalents as well as undrawn availability of $334.5 million under our revolving credit facilities. Net debt declined by $43.5 million during the quarter to $994.2 million as at March 31, 2024. Based on expected free cash flow generation beyond the first quarter of 2024, we continue to make progress on our deleveraging targets as outlined in our "3-P" plan for sanctioning Copper World. We expect that our current liquidity together with cash flows from operations will be sufficient to meet our liquidity needs for 2024.
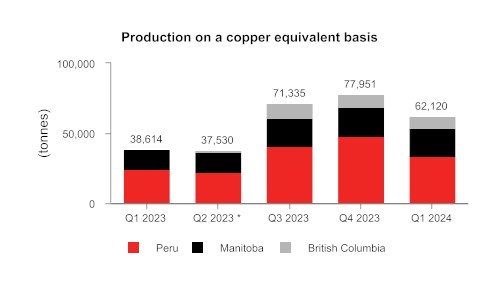
* British Columbia production in Q2 2023 represents a 10-day stub period of production following the June 20, 2023 transaction closing date. British Columbia production is not included in three months ended March 31, 2023 figures as the acquisition of Copper Mountain had not yet closed.
** Copper equivalent production is calculated using the quarter average LME prices for each metal.
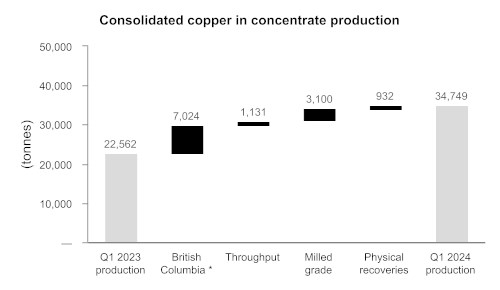
*British Columbia production is not included in the three months ended March 31, 2023 figures as the acquisition of Copper Mountain had not yet closed.
1 Adjusted net earnings (loss) and adjusted net earnings (loss) per share, adjusted EBITDA, cash cost, sustaining cash cost, all-in sustaining cash cost per pound of copper produced, net of by-product credits, cash cost, sustaining cash cost per ounce of gold produced, net of by-product credits, combined unit cost, net debt and net debt to adjusted EBITDA ratio are non-IFRS financial performance measures with no standardized definition under IFRS. For further information and a detailed reconciliation, please see the discussion under the "Non-IFRS Financial Performance Measures" section of this MD&A.
KEY FINANCIAL RESULTS
| Financial Condition |
|
|
|
|
|
|
| (in $ thousands, except net debt to adjusted EBITDA ratio) |
|
Mar. 31, 2024 |
|
|
Dec. 31 2023 |
|
| Cash and cash equivalents |
$ |
284,385 |
|
$ |
249,794 |
|
| Total long-term debt |
|
1,278,587 |
|
|
1,287,536 |
|
| Net debt1 |
|
994,202 |
|
|
1,037,742 |
|
| Working capital2 |
|
200,850 |
|
|
135,913 |
|
| Total assets |
|
5,231,283 |
|
|
5,312,634 |
|
| Equity attributable of owners of the Company |
|
2,107,532 |
|
|
2,096,811 |
|
| Net debt to adjusted EBITDA 1 |
|
1.3 |
|
|
1.6 |
|
1 Net debt and net debt to adjusted EBITDA are a non-IFRS financial performance measure with no standardized definition under IFRS. For further information and a detailed reconciliation, please see discussion under the "Non-IFRS Financial Performance Measures" section of this MD&A.
2 Working capital is determined as total current assets less total current liabilities as defined under IFRS and disclosed on the consolidated interim financial statements.
| Financial Performance |
|
Three months ended |
|
| (in $ thousands, except per share amounts or as noted below) |
|
Mar. 31, 2024 |
|
|
Mar. 31, 2023 |
|
| Revenue |
$ |
524,989 |
|
$ |
295,219 |
|
| Cost of sales |
|
373,035 |
|
|
228,706 |
|
| Earnings before tax |
|
67,750 |
|
|
17,430 |
|
| Net earnings |
|
18,535 |
|
|
5,457 |
|
| Basic earnings per share |
|
0.05 |
|
|
0.02 |
|
| Adjusted earnings per share1 |
|
0.16 |
|
|
0.00 |
|
| Operating cash flow before change in non-cash working capital2 |
|
147.5 |
|
|
85.6 |
|
| Adjusted EBITDA1,2 |
|
214.2 |
|
|
101.9 |
|
1 Adjusted earnings (loss) per share and adjusted EBITDA are non-IFRS financial performance measures with no standardized definition under IFRS. For further information and a detailed reconciliation, please see discussion under the "Non-IFRS Financial Performance Measures" section of this MD&A.
2 In $ millions.
KEY PRODUCTION RESULTS
| |
|
Three months ended |
|
|
Three months ended |
|
| |
Mar. 31, 2024 |
|
|
Mar. 31, 2023 |
|
| |
Peru |
|
|
Manitoba |
|
|
British Columbia3 |
|
|
Total |
|
|
Peru |
|
|
Manitoba |
|
|
Total |
|
| Contained metal in concentrate and doré produced1 |
|
|
|
|
|
|
|
|
|
|
|
|
|
| Copper |
tonnes |
|
24,576 |
|
|
3,149 |
|
|
7,024 |
|
|
34,749 |
|
|
20,517 |
|
|
2,045 |
|
|
22,562 |
|
| Gold |
oz |
|
29,144 |
|
|
56,831 |
|
|
4,417 |
|
|
90,392 |
|
|
11,206 |
|
|
36,034 |
|
|
47,240 |
|
| Silver |
oz |
|
639,718 |
|
|
219,823 |
|
|
88,376 |
|
|
947,917 |
|
|
552,167 |
|
|
150,642 |
|
|
702,809 |
|
| Zinc |
tonnes |
|
- |
|
|
8,798 |
|
|
- |
|
|
8,798 |
|
|
- |
|
|
9,846 |
|
|
9,846 |
|
| Molybdenum |
tonnes |
|
397 |
|
|
- |
|
|
- |
|
|
397 |
|
|
289 |
|
|
- |
|
|
289 |
|
| Payable metal sold |
|
|
|
|
|
|
|
|
|
|
|
|
|
|
|
|
|
|
|
|
|
| Copper |
tonnes |
|
23,754 |
|
|
2,921 |
|
|
6,933 |
|
|
33,608 |
|
|
16,316 |
|
|
2,225 |
|
|
18,541 |
|
| Gold2 |
oz |
|
42,677 |
|
|
62,003 |
|
|
3,401 |
|
|
108,081 |
|
|
11,781 |
|
|
37,939 |
|
|
49,720 |
|
| Silver2 |
oz |
|
753,707 |
|
|
231,841 |
|
|
83,300 |
|
|
1,068,848 |
|
|
392,207 |
|
|
149,677 |
|
|
541,884 |
|
| Zinc |
tonnes |
|
- |
|
|
6,119 |
|
|
- |
|
|
6,119 |
|
|
- |
|
|
5,628 |
|
|
5,628 |
|
| Molybdenum |
tonnes |
|
415 |
|
|
- |
|
|
- |
|
|
415 |
|
|
254 |
|
|
- |
|
|
254 |
|
1 Metal reported in concentrate is prior to deductions associated with smelter contract terms.
2 Includes total payable gold and silver in concentrate and in doré sold.
3 Includes 100% of Copper Mountain mine production. Hudbay owns 75% of Copper Mountain mine. As Copper Mountain was acquired on June 20, 2023, there were no comparative figures for the three months ended March 31, 2023.
KEY COST RESULTS
| |
|
|
Three months ended |
|
|
Guidance |
|
| |
|
|
Mar. 31,
2024 |
|
|
Mar. 31,
2023 |
|
|
Annual
2024 |
|
| Peru cash cost per pound of copper produced |
|
|
|
|
|
|
|
|
|
|
| Cash cost1 |
$/lb |
|
0.43 |
|
|
1.36 |
|
|
1.25 - 1.60 |
|
| Sustaining cash cost1 |
$/lb |
|
1.06 |
|
|
2.12 |
|
|
|
|
| Manitoba cash cost per ounce of gold produced |
|
|
|
|
|
|
|
|
|
|
| Cash cost1 |
$/oz |
|
736 |
|
|
938 |
|
|
700 - 900 |
|
| Sustaining cash cost1 |
$/oz |
|
950 |
|
|
1,336 |
|
|
|
|
| British Columbia cash cost per pound of copper produced2 |
|
|
|
|
|
|
|
|
|
|
| Cash cost1 |
$/lb |
|
3.49 |
|
|
- |
|
|
2.00 - 2.50 |
|
| Sustaining cash cost1 |
$/lb |
|
4.85 |
|
|
- |
|
|
|
|
| Consolidated cash cost per pound of copper produced |
|
|
|
|
|
|
|
|
|
|
| Cash cost1 |
$/lb |
|
0.16 |
|
|
0.85 |
|
|
1.05 - 1.25 |
|
| Sustaining cash cost1 |
$/lb |
|
1.03 |
|
|
1.83 |
|
|
2.00 - 2.45 |
|
| All-in sustaining cash cost1 |
$/lb |
|
1.32 |
|
|
2.07 |
|
|
|
|
1 Cash cost, sustaining cash cost, all-in sustaining cash cost per pound of copper produced, net of by-product credits, gold cash cost, sustaining cash cost per ounce of gold produced, net of by-product credits, and unit operating cost are non-IFRS financial performance measures with no standardized definition under IFRS. For further information and a detailed reconciliation, please see the discussion under the "Non-IFRS Financial Performance Measures" section of this MD&A.
2 Cash cost, sustaining cash cost per pound of copper produced for British Columbia does not have any comparative information for the three months ended March 31, 2023 as Copper Mountain was acquired by Hudbay on June 20, 2023.
RECENT DEVELOPMENTS
Generating Free Cash Flow with Increased Production and Continued Financial Discipline
We delivered a third successive quarter of positive free cash flow during the first quarter of 2024 as we executed our plan for higher copper and gold production from Pampacancha and higher gold production at Lalor, both driven by higher grades, throughput and recoveries. We continue to expect to see strong production levels throughout 2024 from sustained higher grades in Peru and Manitoba, along with additional production from Copper Mountain.
During the first quarter, we completed $10 million in net repayments on our revolving credit facilities. We also completed three additional months of deliveries under the gold forward sale and prepay agreement, further reducing our outstanding gold prepayment liability, and are scheduled to fully repay the gold prepay facility by August 2024. Despite these debt repayments and gold deliveries, we increased our cash and cash equivalents to $284.4 million and reduced our overall net debt to $994.2 million as at March 31, 2024, compared to $249.8 million and $1,037.7 million, respectively, as at December 31, 2023. The $43.5 million decline in net debt, together with higher levels of adjusted EBITDA1 in the first quarter, have improved our net debt to adjusted EBITDA ratio2 to 1.3x compared to 1.6x at the end of 2023. Subsequent to quarter-end, we continued our deleveraging efforts with an additional $10 million repayment on our revolving credit facilities in May 2024.
During the first quarter, we continued to exercise financial discipline and take steps to support free cash flow generation during the stabilization period at Copper Mountain. To this end, we entered into new forward sales contracts at Copper Mountain for a total of 3,600 tonnes of copper production over the twelve-month period from May 2024 to April 2025 at an average price of $3.97 per pound, as well as zero-cost collars for 3,000 tonnes of copper production over the twelve-month period from May 2024 to April 2025 at an average floor price of $4.00 per pound and an average cap price of $4.36 per pound. As at March 31, 2024, 15.9 million pounds of copper forwards and 19.8 million pounds of copper collars were outstanding, representing approximately 44% of 2024 production guidance levels for Copper Mountain. We also entered into zero-cost collars for 36,000 ounces of gold production over the period from April to December 2024 at an average floor price of $2,088 per ounce and an average cap price of $2,458 per ounce.
Annual Reserve and Resource Update
We provided our annual mineral reserve and resource update on March 28, 2024. Current mineral reserve estimates at Constancia and Pampacancha total an aggregate of approximately 548 million tonnes at 0.27% copper with approximately 1.5 million tonnes of contained copper. The expected mine life of Constancia has been extended by three years to 2041 as a result of the successful conversion of mineral resources to mineral reserves with the addition of a further mining phase at the Constancia pit following positive geotechnical drilling studies in 2023. There remains potential for further reserve conversion and future mine life extensions at Constancia through an additional 172 million tonnes of measured and indicated resources at 0.22% copper and 37 million tonnes of inferred resources at 0.40% copper, in each case, exclusive of mineral reserves.
Current mineral reserve estimates in Snow Lake total 17 million tonnes with approximately 2 million ounces in contained gold, and the expected mine life of the Snow Lake operations has been maintained until 2038. The Snow Lake operations continue to achieve higher gold production levels due to the New Britannia mill operating well above design capacity, the recent completion of the Stall mill recovery improvement project in 2023 and the implementation of several optimization initiatives at the Lalor mine to improve the quality of ore production and minimize waste dilution. There remains another 1.4 million ounces of gold in inferred resources in Snow Lake that have the potential to maintain strong annual gold production levels beyond 2030 and further extend the mine life in Snow Lake. The company is advancing an access drift at the nearby 1901 deposit to enable infill drilling aimed at converting the inferred mineral resources in the gold lenses to mineral reserves.
Current mineral reserve estimates at the Copper Mountain mine total 367 million tonnes at 0.25% copper and 0.12 grams per tonne gold with approximately 900,000 tonnes of contained copper and 1.4 million ounces of contained gold. We acquired the Copper Mountain mine as part of the acquisition of Copper Mountain Mining Corporation in June 2023. We hold a 75% interest in the Copper Mountain mine, while Mitsubishi Materials Corp. holds the remaining 25% interest. The current mineral reserve estimates support a 21-year mine life, as previously disclosed in our first National Instrument 43-101 technical report in respect of the Copper Mountain mine filed in December 2023 (the "Copper Mountain Technical Report"). There exists significant upside potential for reserve conversion and extending mine life beyond 21 years through an additional 140 million tonnes of measured and indicated resources at 0.21% copper and 0.10 grams per tonne gold and 370 million tonnes of inferred resources at 0.25% copper and 0.13 grams per tonne gold, in each case, exclusive of mineral reserves.
We released our updated three-year production guidance with our annual mineral reserve and resource update, as presented below. Consolidated copper production over the next three years is expected to average 153,0001 tonnes, representing an increase of 16% from 2023 levels. Consolidated gold production over the next three years is expected to average 272,5001 ounces, reflecting continued high annual gold production levels in Manitoba and a smoothing of Pampacancha high grade gold zones in Peru over the 2023 to 2025 period. Annual production at our Constancia operations is expected to average approximately 101,0001 tonnes of copper and 62,0001 ounces of gold over the next three years. Annual gold production from Snow Lake is expected to average approximately 185,0001 ounces over the next three years, in line with 2023 levels. Annual copper production at our British Columbia operations is expected to average approximately 41,0001 tonnes of copper over the next three years. British Columbia production guidance ranges in 2024 and 2025 are wider than typical ranges and coincide with the operation ramp up activities over the stabilization period. Copper production at the Copper Mountain mine is expected to increase by 32% in 2026 compared to 2024, reflecting operational improvements consistent with the Copper Mountain Technical Report.
|
3-Year Production Outlook
Contained Metal in Concentrate and Doré1
|
2024 Guidance
|
2025 Guidance
|
2026 Guidance
|
|
Peru
|
|
|
|
|
|
Copper
|
tonnes
|
98,000 - 120,000
|
94,000 - 115,000
|
80,000 - 100,000
|
|
Gold
|
ounces
|
76,000 - 93,000
|
70,000 - 90,000
|
15,000 - 25,000
|
|
Silver
|
ounces
|
2,500,000 - 3,000,000
|
2,700,000 - 3,300,000
|
1,500,000 - 1,900,000
|
|
Molybdenum
|
tonnes
|
1,250 - 1,500
|
1,200 - 1,600
|
1,500 - 1,900
|
|
|
|
|
|
|
|
Manitoba
|
|
|
|
|
|
Gold
|
ounces
|
170,000 - 200,000
|
170,000 - 200,000
|
170,000 - 200,000
|
|
Zinc
|
tonnes
|
27,000 - 35,000
|
25,000 - 33,000
|
18,000 - 24,000
|
|
Copper
|
tonnes
|
9,000 - 12,000
|
8,000 - 12,000
|
10,000 - 14,000
|
|
Silver
|
ounces
|
750,000 - 1,000,000
|
800,000 - 1,100,000
|
800,000 - 1,100,000
|
|
|
|
|
|
|
|
British Columbia2
|
|
|
|
|
|
Copper
|
tonnes
|
30,000 - 44,000
|
30,000 - 45,000
|
44,000 - 54,000
|
|
Gold
|
ounces
|
17,000 - 26,000
|
24,000 - 36,000
|
24,000 - 29,000
|
|
Silver
|
ounces
|
300,000 - 455,000
|
290,000 - 400,000
|
450,000 - 550,000
|
|
|
|
|
|
|
|
Total
|
|
|
|
|
|
Copper
|
tonnes
|
137,000 - 176,000
|
132,000 - 172,000
|
134,000 - 168,000
|
|
Gold
|
ounces
|
263,000 - 319,000
|
264,000 - 326,000
|
209,000 - 254,000
|
|
Zinc
|
tonnes
|
27,000 - 35,000
|
25,000 - 33,000
|
18,000 - 24,000
|
|
Silver
|
ounces
|
3,550,000 - 4,455,000
|
3,790,000 - 4,800,000
|
2,750,000 - 3,550,000
|
|
Molybdenum
|
tonnes
|
1,250 - 1,500
|
1,200 - 1,600
|
1,500 - 1,900
|
1 Metal reported in concentrate and doré is prior to treatment or refining losses or deductions associated with smelter terms.
2 Includes 100% of Copper Mountain mine production. Hudbay owns 75% of Copper Mountain mine.
____________________________________
1 Calculated using the mid-point of the guidance range.
Advancing Permitting at Copper World
The first key state permit required for Copper World, the Mined Land Reclamation Plan, was initially approved by the Arizona State Mine Inspector in October 2021 and was subsequently amended to reflect a larger private land project footprint. This approval was challenged in state court, but the challenge was dismissed in May 2023. In late 2022, Hudbay submitted the applications for an Aquifer Protection Permit and an Air Quality Permit to the Arizona Department of Environmental Quality. Hudbay continues to expect to receive these two outstanding state permits in 2024. Hudbay also received the floodplain use permit approval from Pima County in April 2024.
Copper World is one of the highest-grade open pit copper projects in the Americas2 with proven and probable mineral reserves of 385 million tonnes at 0.54% copper. There remains approximately 60% of the total copper contained in measured and indicated mineral resources (exclusive of mineral reserves), providing significant potential for Phase II expansion and mine life extension. In addition, the inferred mineral resource estimates are at a comparable copper grade and also provide significant upside potential.
Exploration Update
Progressing Maria Reyna and Caballito Exploration Permits
Hudbay controls a large, contiguous block of mineral rights with the potential to host mineral deposits in close proximity to the Constancia processing facility, including the past producing Caballito property and the highly prospective Maria Reyna property. The company commenced early exploration activities at Maria Reyna and Caballito after completing a surface rights exploration agreement with the community of Uchucarcco in August 2022. As part of the drill permitting process, environmental impact assessment applications were submitted for the Maria Reyna property in November 2023 and for the Caballito property in April 2024.
Executing Largest Snow Lake Exploration Program
The planned 2024 exploration program is Hudbay's largest Snow Lake program in our history and consists of modern geophysical programs and multi-phased drilling campaigns:
• Modern geophysics program - A majority of the newly acquired Cook Lake and former Rockcliff claims have been untested by modern deep geophysics, which was the discovery method for the Lalor deposit. A large geophysics program is currently underway including surface electromagnetic surveys using cutting-edge techniques that enable the team to detect targets at depths of almost 1,000 metres below surface.
• Multi-phased drilling program - The results from the winter 2024 surface drill program near Lalor are being analyzed and we are planning follow-up drill programs for the balance of 2024.
The goal of the 2024 exploration program is to test mineralized extensions of the Lalor deposit and to find a new anchor deposit within trucking distance of the Snow Lake processing infrastructure, which has the potential to extend the life of the Snow Lake operations beyond 2038.
Advancing Access to the 1901 Deposit
In the first quarter of 2024, we commenced the development of a smaller profile drift from the existing Lalor ramp towards the 1901 deposit. The 1901 development and exploration drift is proceeding on schedule and on budget and is expected to reach the mineralization in late-2024, followed by planned definition drilling in 2025 intended to confirm the optimal mining method, evaluate the orebody geometry and continuity, and convert inferred mineral resources in the gold lenses to mineral reserves. In addition to the benefits of being able to cycle development rounds faster, the smaller profile drift has significantly reduced the cost per metre of advance by 33% compared to average 2023 development costs incurred at Lalor.
____________________________________
2 Sourced from S&P Global, August 2023.
Unlocking Value Through Flin Flon Tailings Reprocessing
Hudbay is advancing studies to evaluate the opportunity to reprocess Flin Flon tailings where more than 100 million tonnes of tailings have been deposited for over 90 years from the mill and the zinc plant. The studies are evaluating the potential to use the existing Flin Flon concentrator, which is currently on care and maintenance after the closure of the 777 mine in 2022, with flow sheet modifications to reprocess tailings to recover critical minerals and precious metals while creating environmental and social benefits for the region. We are completing metallurgical test work and an early economic study to evaluate the tailings reprocessing opportunity.
The Flin Flon tailings facility contains materials generated from the metallurgical complex and confirmatory drilling has been conducted over the last several years:
• Mill tailings - Initial confirmatory drilling completed in 2022 indicated higher zinc, copper and silver grades than predicted from historical mill records while confirming the historical gold grade. In 2023, Hudbay advanced metallurgical test work and evaluated metallurgical technologies, including the signing of a test work co-operation agreement with Cobalt Blue Holdings ("COB") examining the use of COB technology to treat Flin Flon mill tailings. Initial results from preliminary roasting test work were encouraging in converting more than 90% of pyrite into pyrrhotite and molten sulphur, and the project has been advanced to the next stage of testing.
• Zinc plant tailings - This section of the tailings facility was previously unable to be drilled in 2022 due to water levels from operations. The water levels have receded since the completion of operations in mid-2022, and in 2024, Hudbay completed an initial confirmatory drill program in this portion of the tailings facility with results pending.
A key benefit of tailings reprocessing is the potential to reduce the environmental footprint by removing acid-generating properties of the tailings, which would improve the environmental impacts through higher quality water in the tailings facility and reduce the need for long-term water treatment.
Marubeni Flin Flon Exploration Partnership
In March 2024, Hudbay entered into an option agreement (the "Marubeni Option Agreement") with Marubeni Corporation, pursuant to which Hudbay has granted Marubeni's wholly-owned Canadian subsidiary an option to acquire a 20% interest in three projects located within trucking distance of Hudbay's existing processing facilities in the Flin Flon area. Pursuant to the Marubeni Option Agreement, the option holder must fund a minimum of C$12 million in exploration expenditures over a period of approximately five years in order to exercise its option. All three projects hold past producing mines that generated meaningful production with attractive grades of both base metals and precious metals. The properties remain highly prospective with potential for further discovery based on the attractive geological setting, limited historical deep drilling and promising geochemical and geophysical targets.
Upon successful completion of the option holder's earn-in obligations and the exercise of the option, a joint venture will be formed to hold the selected projects with Hudbay, acting as operator, holding an 80% interest and Marubeni indirectly holding the remaining 20% interest.
PERU OPERATIONS REVIEW
| |
|
Three months ended |
|
| |
Mar. 31, 2024 |
|
|
Mar. 31, 2023 |
|
| Constancia ore mined1 |
tonnes |
|
2,559,547 |
|
|
3,403,181 |
|
| Copper |
% |
|
0.31 |
|
|
0.34 |
|
| Gold |
g/tonne |
|
0.04 |
|
|
0.04 |
|
| Silver |
g/tonne |
|
2.79 |
|
|
2.52 |
|
| Molybdenum |
% |
|
0.01 |
|
|
0.01 |
|
| Pampacancha ore mined1 |
tonnes |
|
2,214,354 |
|
|
897,295 |
|
| Copper |
% |
|
0.56 |
|
|
0.49 |
|
| Gold |
g/tonne |
|
0.32 |
|
|
0.52 |
|
| Silver |
g/tonne |
|
4.64 |
|
|
5.12 |
|
| Molybdenum |
% |
|
0.02 |
|
|
0.01 |
|
| Total ore mined |
tonnes |
|
4,773,901 |
|
|
4,300,476 |
|
| Strip ratio2 |
|
|
1.95 |
|
|
1.84 |
|
| Ore milled |
tonnes |
|
8,077,962 |
|
|
7,663,728 |
|
| Copper |
% |
|
0.36 |
|
|
0.33 |
|
| Gold |
g/tonne |
|
0.15 |
|
|
0.08 |
|
| Silver |
g/tonne |
|
3.48 |
|
|
3.69 |
|
| Molybdenum |
% |
|
0.01 |
|
|
0.01 |
|
| Copper concentrate |
tonnes |
|
114,099 |
|
|
95,448 |
|
| Concentrate grade |
% Cu |
|
21.54 |
|
|
21.50 |
|
| Copper recovery |
% |
|
84.9 |
|
|
81.7 |
|
| Gold recovery |
% |
|
73.4 |
|
|
56.8 |
|
| Silver recovery |
% |
|
70.7 |
|
|
60.7 |
|
| Molybdenum recovery |
% |
|
43.2 |
|
|
34.8 |
|
| Combined unit operating costs3,4 |
$/tonne |
|
10.92 |
|
|
11.47 |
|
1 Reported tonnes and grade for ore mined are estimates based on mine plan assumptions and may not reconcile fully to ore milled.
2 Strip ratio is calculated as waste mined divided by ore mined.
3 Reflects combined mine, mill and general and administrative ("G&A") costs per tonne of ore milled. Reflects the deduction of expected capitalized stripping costs.
4 Combined unit costs is a non-IFRS financial performance measure with no standardized definition under IFRS. For further information and a detailed reconciliation, please see the discussion under the "Non-IFRS Financial Performance Measures" section of this MD&A.
| |
|
|
Three months ended |
|
| |
|
|
Mar. 31, 2024 |
|
|
Mar. 31, 2023 |
|
| Contained metal in concentrate produced |
|
|
|
|
|
|
|
| Copper |
tonnes |
|
24,576 |
|
|
20,517 |
|
| Gold |
oz |
|
29,144 |
|
|
11,206 |
|
| Silver |
oz |
|
639,718 |
|
|
552,167 |
|
| Molybdenum |
tonnes |
|
397 |
|
|
289 |
|
| Payable metal sold |
|
|
|
|
|
|
|
| Copper |
tonnes |
|
23,754 |
|
|
16,316 |
|
| Gold |
oz |
|
42,677 |
|
|
11,781 |
|
| Silver |
oz |
|
753,707 |
|
|
392,207 |
|
| Molybdenum |
tonnes |
|
415 |
|
|
254 |
|
| Cost per pound of copper produced |
|
|
|
|
|
|
|
| Cash cost1 |
$/lb |
|
0.43 |
|
|
1.36 |
|
| Sustaining cash cost1 |
$/lb |
|
1.06 |
|
|
2.12 |
|
1 Cash cost and sustaining cash costs per pound of copper produced, net of by-product credits, are not recognized under IFRS. For more detail on these non-IFRS financial performance measures, please see the discussion under the "Non-IFRS Financial Performance Measures" section of this MD&A.
Overview
The Constancia operations benefited from strong mill throughput performance, averaging 89,000 tonnes per day in the first quarter. Mill ore feed has reverted to the typical blend of approximately one-third from Pampacancha and two-thirds from Constancia, which is expected to continue throughout 2024. The operations also benefited from strong cost performance, achieving lower unit operating costs, cash cost and sustaining cash cost compared to the comparative 2023 period. Cash cost also benefited from higher gold sales volumes in the first quarter of 2024.
The collective bargaining agreement with the labour union representing a portion of the Constancia workforce expired in November 2023, and we continue to negotiate the terms of a new agreement with the union.
Mining Activities
Total ore mined in the first quarter of 2024 increased by 11% compared to the same period in 2023 primarily due to the reduced mining activities in the comparative 2023 period in order to ration fuel during protests and civil unrest in Peru. Ore mined from Pampacancha during the first quarter increased to 2.2 million tonnes compared to the same period in 2023 at average grades of 0.56% copper and 0.32 grams per tonne gold. The total ore mined was in line with our mine plan, which included supplemental ore feed from stockpiles during the quarter as we are advancing pit stripping activities.
Milling Activities
Ore milled during the first quarter of 2024 was 5% higher than the comparative 2023 period mainly due to the treatment of softer ore from stockpiles. Milled copper and gold grades increased by 9% and 88%, respectively, in the first quarter of 2024 compared to the same period in 2023 due to a significant increase in the mining of higher copper and gold grade ore from Pampacancha.
Recoveries of copper, gold and silver during the first quarter of 2024 were 84.9%, 73.4% and 70.7%, respectively, representing an increase of 4%, 29% and 16%, respectively, than the comparative 2023 period and were in line with our metallurgical models.
In March 2024, the Peruvian Ministry of Energy and Mines proposed regulation changes to allow mining companies to increase their permitted mill throughput levels by up to 10%. The Company is monitoring the status of this proposal and evaluating the potential to increase future production at Constancia.
Production and Sales Performance
First quarter 2024 production of copper, gold and silver was 24,576 tonnes, 29,144 ounces and 639,718 ounces, respectively, representing an increase of 20%, 160% and 16%, respectively, than the comparative period in 2023 due to higher copper and precious metal grades from Pampacancha, higher recoveries and higher throughput. Production of molybdenum in the first quarter of 2024 was 397 tonnes, 37% higher than the comparative prior year period due to higher ore grades and higher molybdenum plant throughput.
Quantities of payable copper, gold and silver sold during the first quarter of 2024 were 46%, 262% and 92% higher, respectively, than the corresponding period in 2023 primarily due to the same reasons that affected contained metal production. Gold and silver sales in the first quarter significantly exceed production due to a precious metal stream sale that was recognized in revenue shortly after the year end cutoff date. Payable metal included in this sale was approximately 16,000 ounces of gold and 309,000 ounces of silver.


Cost Performance
Combined mine, mill and G&A unit operating costs in the first quarter were $10.92 per tonne, 5% lower than the same period in 2023 primarily due to higher ore throughput.
Cash cost per pound of copper produced, net of by-product credits, in the first quarter of 2024 was $0.43, a decrease of 68% compared to the same period in 2023 due to higher copper production and higher gold by-product credits. This was partially offset by higher profit sharing, treatment and refining charges and freight costs.
Sustaining cash cost per pound of copper produced, net of by-product credits, for the first quarter of 2024 was 50% lower than the comparative 2023 period primarily due to the same factors affecting cash cost.
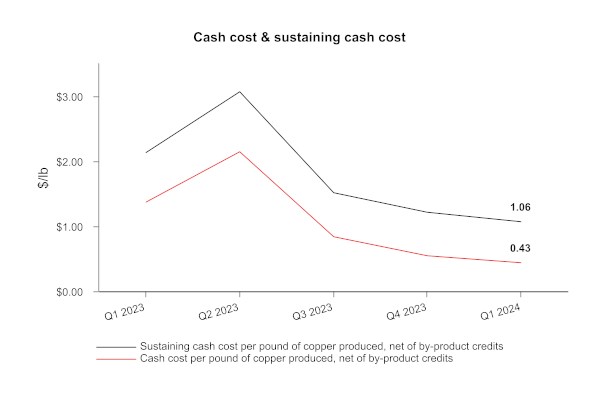
Peru Guidance Outlook
|
|
|
Three months ended
|
Guidance
|
|
|
|
Mar. 31, 2024
|
Mar. 31, 2023
|
Annual 2024
|
|
Contained metal in concentrate produced
|
|
|
|
|
|
Copper
|
tonnes
|
24,576
|
20,517
|
98,000 - 120,000
|
|
Gold
|
oz
|
29,144
|
11,206
|
76,000 - 93,000
|
|
Silver
|
oz
|
639,718
|
552,167
|
2,500,000 - 3,000,000
|
|
Molybdenum
|
tonnes
|
397
|
289
|
1,250 - 1,500
|
|
Cost per pound of copper produced
|
|
|
|
|
|
Cash cost1
|
$/lb
|
0.43
|
1.36
|
1.25 - 1.60
|
1 Cash cost and sustaining cash costs per pound of copper produced, net of by-product credits, are not recognized under IFRS. For more detail on these non-IFRS financial performance measures, please see the discussion under the "Non-IFRS Financial Performance Measures" section of this MD&A.
We expect to achieve our 2024 production guidance for all metals in Peru. Cash cost for the quarter was below the low-end of our 2024 guidance range primarily due to high gold by-product credits; however, it is expected to increase during the remainder of 2024 and the full year cash cost is expected to be within the 2024 guidance range.
MANITOBA OPERATIONS REVIEW
| |
|
Three months ended |
|
| |
Mar. 31, 2024 |
|
|
Mar. 31, 2023 |
|
| Lalor ore mined |
tonnes |
|
407,708 |
|
|
373,599 |
|
| Gold |
g/tonne |
|
4.84 |
|
|
3.96 |
|
| Copper |
% |
|
0.84 |
|
|
0.57 |
|
| Zinc |
% |
|
2.92 |
|
|
3.32 |
|
| Silver |
g/tonne |
|
23.44 |
|
|
18.24 |
|
| New Britannia ore milled |
tonnes |
|
170,409 |
|
|
143,042 |
|
| Gold |
g/tonne |
|
7.03 |
|
|
6.05 |
|
| Copper |
% |
|
1.13 |
|
|
0.61 |
|
| Zinc |
% |
|
0.82 |
|
|
0.76 |
|
| Silver |
g/tonne |
|
21.6 |
|
|
22.39 |
|
| Copper concentrate |
tonnes |
|
11,647 |
|
|
5,556 |
|
| Concentrate grade |
% Cu |
|
15.98 |
|
|
14.29 |
|
| Copper recovery |
% |
|
96.2 |
|
|
91.7 |
|
| Gold recovery1 |
% |
|
88.6 |
|
|
87.9 |
|
| Silver recovery1 |
% |
|
82.0 |
|
|
79.1 |
|
| Contained metal in concentrate produced |
|
|
|
|
|
|
| Gold |
oz |
|
25,595 |
|
|
17,235 |
|
| Copper |
tonnes |
|
1,861 |
|
|
794 |
|
| Silver |
oz |
|
77,216 |
|
|
63,769 |
|
| Metal in doré produced2 |
|
|
|
|
|
|
| Gold |
oz |
|
16,495 |
|
|
5,387 |
|
| Silver |
oz |
|
39,058 |
|
|
11,578 |
|
| Stall ore milled |
tonnes |
|
219,358 |
|
|
242,619 |
|
| Gold |
g/tonne |
|
3.07 |
|
|
2.78 |
|
| Copper |
% |
|
0.64 |
|
|
0.59 |
|
| Zinc |
% |
|
4.54 |
|
|
4.81 |
|
| Silver |
g/tonne |
|
24.46 |
|
|
17.14 |
|
| Copper concentrate |
tonnes |
|
7,167 |
|
|
6,645 |
|
| Concentrate grade |
% Cu |
|
17.96 |
|
|
18.83 |
|
| Zinc concentrate |
tonnes |
|
17,838 |
|
|
19,198 |
|
| Concentrate grade |
% Zn |
|
49.33 |
|
|
51.29 |
|
| Copper recovery |
% |
|
91.7 |
|
|
87.0 |
|
| Zinc recovery |
% |
|
88.4 |
|
|
84.4 |
|
| Gold recovery |
% |
|
68.0 |
|
|
61.9 |
|
| Silver recovery |
% |
|
59.8 |
|
|
56.3 |
|
| Contained metal in concentrate produced |
|
|
|
|
|
|
| Gold |
oz |
|
14,741 |
|
|
13,412 |
|
| Copper |
tonnes |
|
1,288 |
|
|
1,251 |
|
| Zinc |
tonnes |
|
8,798 |
|
|
9,846 |
|
| Silver |
oz |
|
103,549 |
|
|
75,295 |
|
1 Gold and silver recovery includes total recovery from concentrate and doré.
2 Doré includes sludge, slag and carbon fines in three ended March 31, 2024 and 2023.
| |
|
Three months ended |
|
| |
Mar. 31, 2024 |
|
|
Mar. 31, 2023 |
|
| Total contained metal in concentrate and doré produced1 |
|
|
|
|
|
|
|
| Gold |
oz |
|
56,831 |
|
|
36,034 |
|
| Copper |
tonnes |
|
3,149 |
|
|
2,045 |
|
| Zinc |
tonnes |
|
8,798 |
|
|
9,846 |
|
| Silver |
oz |
|
219,823 |
|
|
150,642 |
|
| Payable metal sold in concentrate and doré |
|
|
|
|
|
|
| Gold |
oz |
|
62,003 |
|
|
37,939 |
|
| Copper |
tonnes |
|
2,921 |
|
|
2,225 |
|
| Zinc |
tonnes |
|
6,119 |
|
|
5,628 |
|
| Silver |
oz |
|
231,841 |
|
|
149,677 |
|
| Unit Operating Costs2 |
|
|
|
|
|
|
|
| Lalor |
C$/tonne |
|
146.74 |
|
|
136.58 |
|
| New Britannia |
C$/tonne |
|
78.03 |
|
|
81.98 |
|
| Stall |
C$/tonne |
|
40.69 |
|
|
34.33 |
|
| Combined mine/mill unit operating costs3,4 |
C$/tonne |
|
235 |
|
|
216 |
|
| Cost per pound of gold produced |
|
|
|
|
|
|
|
| Cash cost4 |
$/oz |
|
736 |
|
|
938 |
|
| Sustaining cash cost4 |
$/oz |
|
950 |
|
|
1,336 |
|
1 Metal reported in concentrate is prior to deductions associated with smelter terms.
2 Reflects costs per tonne of ore mined/milled.
3 Reflects combined mine, mill and G&A costs per tonne of milled ore.
4 Combined unit costs, cash cost and sustaining cash cost per ounce of gold produced, net of by-product credits, are non-IFRS financial performance measures with no standardized definition under IFRS. For further information and a detailed reconciliation, please see the discussion under the "Non-IFRS Financial Performance Measures" section of this MD&A.
Overview
At our Snow Lake operations in Manitoba, we achieved strong production results in the first quarter of 2024 partly because of the successful implementation of improvement initiatives at the Lalor mine that were completed in the second half of 2023, and several new initiatives in early 2024. Noteworthy improvements include high shaft availability, efficient ore hoisting, stope fragmentation reduction and mucking productivity enhancements, which have contributed significantly to our strong quarterly performance. In 2024, our primary focus entails implementing stope design modifications aimed at improving mucking efficiency throughout a stope's lifecycle. We also continue to focus on maintaining the quality of ore production with elevated metal grades through diligent efforts to minimize dilution and enhance ore recovery from stopes.
The New Britannia mill achieved record quarterly throughput of 1,870 tonnes per day in the first quarter due to ongoing improvement initiatives and effective preventative maintenance measures. Noteworthy enhancements in the elution circuit, which facilitates efficient carbon transfer and gold stripping, have bolstered gold recovery to doré. During the first quarter, we received a permit approval from the Manitoba Environment and Climate Change ministry ("MECC") to increase the New Britannia mill production rate above nameplate capacity to 2,500 tonnes per day. This key approval aligns with our long-term objectives to further increase gold production at our Snow Lake operations by directing more gold ore from Lalor to the New Britannia mill to achieve higher gold recoveries.
At the Anderson tailings facility, we successfully improved the tailings deposition process during the quarter, leveraging new equipment and procedural refinements, enabling us to optimize storage capacity and defer dam construction capital to future years. To further optimize the storage capacity of the facility, a permit to conduct a subaerial tailings deposition trial study was submitted to MECC during the quarter.
Mining Activities
Total ore mined in Manitoba in the first quarter of 2024 was 9% higher than the corresponding quarter in 2023. Gold, copper and silver grades mined at Lalor during the first quarter were 22%, 47% and 29% higher, respectively, than the comparative 2023 period, reflecting the successful execution of our strategic mine plan that prioritizes gold and copper production with a focus on enhanced ore recovery. This resulted in the mining of higher gold and copper grade zones and robust grade control practices, including assaying and sampling of blastholes, which further improved ore quality. This also resulted in reduced mining from the zinc areas, lowering the overall zinc grade at Lalor in the first quarter of 2024 by 12% lower compared to the same period in 2023, in line with the mine plan.
Milling Activities
Consistent with our strategy of allocating more Lalor ore feed to New Britannia, the New Britannia mill throughput averaged a record 1,870 tonnes per day in the first quarter of 2024, approximately 18% above average daily throughput levels in the comparative 2023 period. Recoveries of gold, copper and silver in the first quarter of 2024 were 88.6%, 96.2% and 82.0%, respectively, representing an increase of 1%, 5%, and 4%, respectively, compared to the same period in 2023.
The Stall mill processed 10% less ore in the first quarter of 2024 than the comparative 2023 period, which is aligned with our strategy of allocating more Lalor ore feed to New Britannia, as noted above. With the completion of the Stall mill recovery improvement project in 2023, recoveries of gold, copper and silver in the first quarter of 2024 were notably higher compared to the same period in 2023, achieving targeted gold recovery levels of approximately 68%.
Production and Sales Performance
Manitoba operations produced 56,831 ounces of gold during the first quarter of 2024. Compared to the first quarter of 2023, production of gold, copper, and silver in the first quarter of 2024 significantly increased by 58%, 54%, and 46%, respectively, while production of zinc declined by 11% due to mining of higher grade gold zones with a focus on higher quality ore production and higher recoveries at the New Britannia and Stall mills.
Quantities of payable metal sold during the first quarter of 2024 were generally in line with contained metal production during the quarter. Due to significantly higher metal production during the quarter, as noted above, quantities of payable metal sold in the first quarter of 2024 were significantly higher than the comparable period in 2023.
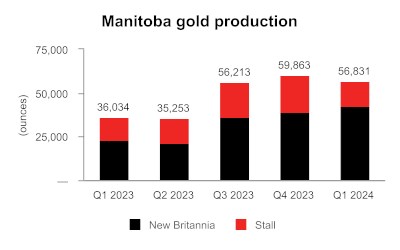
Cost Performance
Total Lalor mine unit operating costs during the first quarter of 2024 increased by 7% compared to the same period in 2023 but were in line with expectations as a result of lower capitalized development costs and longer haulage distances. Compared to the same period in 2023, unit operating costs at the Stall mill were 19% higher during the first quarter of 2024 primarily due to lower throughput. New Britannia unit operating costs decreased by 5% during the first quarter of 2024 versus the same period in 2023, primarily a result of higher throughput. Combined mine, mill and G&A unit operating costs in the first quarter of 2024 of C$235 per tonne, an increase of 9% compared to the same period in 2023 due to a combination of higher costs at Lalor and Stall, as noted above.
Cash cost per ounce of gold produced, net of by-product credits, in the first quarter of 2024 was $736, a decrease of 22% compared to the same period in 2023 due to significantly higher gold production, partially offset by lower copper and zinc by-product credits.
Sustaining cash cost per ounce of gold produced, net of by-product credits, in the first quarter of 2024 was $950, a decrease of 29% compared to the same period in 2023 primarily due to the same factors affecting cash cost as well as lower sustaining capital costs during the quarter.
Manitoba Guidance Outlook
|
|
Three months ended
|
Guidance
|
|
Mar. 31, 2024
|
Mar. 31, 2023
|
Annual 2024
|
|
Total contained metal in concentrate and doré produced1
|
|
|
|
|
|
Gold2
|
oz
|
56,831
|
36,034
|
170,000 - 200,000
|
|
Copper
|
tonnes
|
3,149
|
2,045
|
9,000 - 12,000
|
|
Zinc
|
tonnes
|
8,798
|
9,846
|
27,000 - 35,000
|
|
Silver3
|
oz
|
219,823
|
150,642
|
750,000 - 1,000,000
|
|
Cost per pound of gold produced
|
|
|
|
|
|
Cash cost4
|
$/oz
|
736
|
938
|
700 - 900
|
1 Metal reported in concentrate is prior to deductions associated with smelter terms.
2 Gold production guidance includes gold contained in concentrate produced and gold in doré.
3 Silver production guidance includes silver contained in concentrate produced and silver in doré.
4 Combined unit costs, cash cost and sustaining cash cost per ounce of gold produced, net of by-product credits, are non-IFRS financial performance measures with no standardized definition under IFRS. For further information and a detailed reconciliation, please see the discussion under the "Non-IFRS Financial Performance Measures" section of this MD&A.
The Manitoba operations produced 56,831 ounces of gold, 3,149 tonnes of copper, 8,798 tonnes of zinc and 219,823 ounces of silver during the first quarter of 2024. Production of gold in the first quarter was better than expected as a result of many operational improvement initiatives and record performance from New Britannia mill, as described above. We expect to achieve our 2024 production guidance for all metals in Manitoba. We also expect full year gold cash cost to remain within the 2024 guidance range.
BRITISH COLUMBIA OPERATIONS REVIEW
| |
|
|
Three months ended5 |
|
| |
|
|
Mar. 31, 2024 |
|
| Ore mined1 |
tonnes |
|
3,722,496 |
|
| Waste mined |
tonnes |
|
15,276,598 |
|
| Strip ratio2 |
|
|
4.10 |
|
| Ore milled |
tonnes |
|
3,180,149 |
|
| Copper |
% |
|
0.27 |
|
| Gold |
g/tonne |
|
0.07 |
|
| Silver |
g/tonne |
|
1.19 |
|
| Copper concentrate |
tonnes |
|
30,650 |
|
| Concentrate grade |
% Cu |
|
22.9 |
|
| Copper recovery |
% |
|
83.4 |
|
| Gold recovery |
% |
|
61.8 |
|
| Silver recovery |
% |
|
72.4 |
|
| Combined unit operating costs3,4 |
C$/tonne |
|
23.67 |
|
1 Reported tonnes and grade for ore mined are estimates based on mine plan assumptions and may not reconcile fully to ore milled.
2 Strip ratio is calculated as waste mined divided by ore mined.
3 Reflects combined mine, mill and general and administrative ("G&A") costs per tonne of ore milled. Reflects the deduction of expected capitalized stripping costs.
4 Combined unit costs is a non-IFRS financial performance measure with no standardized definition under IFRS. For further information and a detailed reconciliation, please see the discussion under the "Non-IFRS Financial Performance Measures" section of this MD&A.
5 Copper Mountain mine results are stated at 100%. Hudbay owns 75% of Copper Mountain mine. As Copper Mountain was acquired on June 20, 2023, there were no comparative figures for the three months ended March 31, 2023.
| |
|
|
Three months ended2 |
|
| |
|
|
Mar. 31, 2024 |
|
| Contained metal in concentrate produced |
|
|
|
|
| Copper |
tonnes |
|
7,024 |
|
| Gold |
oz |
|
4,417 |
|
| Silver |
oz |
|
88,376 |
|
| Payable metal sold |
|
|
|
|
| Copper |
tonnes |
|
6,933 |
|
| Gold |
oz |
|
3,401 |
|
| Silver |
oz |
|
83,300 |
|
| Cost per pound of copper produced |
|
|
|
|
| Cash cost1 |
$/lb |
|
3.49 |
|
| Sustaining cash cost1 |
$/lb |
|
4.85 |
|
1 Cash cost and sustaining cash cost, net of by-product credits, are non-IFRS financial performance measures with no standardized definition under IFRS. For further information and a detailed reconciliation, please see the discussion under the "Non-IFRS Financial Performance Measures" section of this MD&A.
2 Copper Mountain mine results are stated at 100%. Hudbay owns 75% of Copper Mountain mine. As Copper Mountain was acquired on June 20, 2023, there were no comparative 2023 figures.
Overview
Since completing the acquisition of Copper Mountain on June 20, 2023, Hudbay has been focused on advancing operational stabilization plans, including opening up the mine by adding additional mining faces and re-mobilizing idle haul trucks, optimizing the ore feed to the plant and implementing plant improvement initiatives that mirror Hudbay's successful processes at Constancia. While the benefits of these stabilization plans are not expected to be fully realized until 2025, we have successfully increased the total tonnes moved and have seen stronger mill performance as demonstrated by higher mill availability and above-target copper recoveries of 83.4% in the first quarter of 2024, achieving the highest quarterly copper recoveries in the last decade. Stabilization benefits continued to be realized into April with 83% copper recoveries and approximately 40,000 tonnes per day average mill throughput, an increase of approximately 9% over throughput levels in the first quarter.
We have exceeded the targeted $10 million in annualized corporate synergies and we are on track to realize our three-year annual operating efficiencies target.
Mining Activities
Total ore mined at Copper Mountain in the first quarter of 2024 was 3.7 million tonnes, a 42% increase versus the fourth quarter of 2023. The mine operations team continues to implement a fleet production ramp up plan to remobilize idle capital equipment at the Copper Mountain site as part of the accelerated stripping program to access higher head grades. This plan entails remobilization of the mining truck fleet, deployment of an additional shovel, production drill and associated equipment. During the quarter, we also advanced the delivery of five haul trucks to self-perform additional stripping activities over the next three years at lower cost than the contractor mining approach that was contemplated in the technical report. As a result, total material moved is expected to continue to increase quarter over quarter in line with the mine plan.
Milling Activities
The mill processed 3.2 million tonnes of ore during the first quarter of 2024, a 3% decrease versus the fourth quarter of 2023. Benefiting from stabilization and reliability initiatives within the comminution circuit, the average mill availability during the first quarter of 2024 increased by approximately 4% to 90.4%, compared to the fourth quarter of 2023, while maintaining a stable throughput rate. Mill throughput in the first quarter 2024 was impacted by reduced reliability of the crushing circuit, caused primarily by elevated levels of magnetite and scrap metal as mining progresses through areas of historical underground workings. During the quarter, a number of initiatives were advanced to address these issues and other identified constraints and improve throughput to targeted levels, with the benefits expected to be realized throughout the rest of 2024. These initiatives include, reprogramming of the mill expert system, installation of advanced semi-autogenous grinding (SAG) control instrumentation, redesign of the SAG liner package and updated operational procedures intended to remove magnetite from the pebble stream.
Maintenance practices to improve mill availability continue to be a key pillar of our stabilization initiatives. The first quarter planned maintenance shutdown focused on achieving 100% compliance to planned execution. Future maintenance practice enhancements are planned for rollout over the second and third quarters of 2024, which entail the implementation of improved maintenance management processes and a change in our maintenance organizational structure. Work has begun to analyze the trade-off among the various alternatives to further enhance mill performance.
Milled copper grades during the first quarter of 2024 averaged 0.27%, lower than the fourth quarter of 2023 but higher than the reserve grade of 0.25%. Copper recoveries of 83.4% were higher than the fourth quarter of 2023 and higher than expectations for the first quarter due to relieving the regrind circuit constraint and implementing the flotation operational strategy improvements, including reagent selection and dose modification.
Work continues on the expert system that controls mill feed with implementation expected during the second quarter. Throughput in April increased to approximately 40,000 tonnes per day as the mill began realizing benefits from the recalibrated expert system, amongst other initiatives. The benefits of the operational stabilization improvements are expected to continue to be realized throughout 2024. We are also accelerating engineering studies to debottleneck and increase the nominal plant capacity to 50,000 tonnes per day earlier than was contemplated in the technical report.
Production and Sales Performance
First quarter 2024 production of copper, gold and silver was 7,024 tonnes, 4,417 ounces and 88,376 ounces, respectively. Production of copper and silver was lower than the fourth quarter of 2024 primarily as a result of lower head grades, partially offset by higher recoveries. Production of gold was higher than the fourth quarter of 2024 as a result of higher grades and higher recoveries. We are on track to achieve 2024 production guidance for all metals in British Columbia.
Quantities of payable metal sold during the first quarter of 2024 were generally in line with contained metal production during the quarter.
Cost Performance
Combined mine, mill and G&A unit operating costs in the first quarter of 2024 were C$23.67 per tonne milled, 13% higher than the fourth quarter of 2023 primarily due to higher mining costs. Combined unit operating costs are expected to decrease over time as we continue to implement our stabilization and optimization initiatives at Copper Mountain. As the hiring and training of additional haul truck drivers continues, the Company expects to have a fully trained complement of truck drivers by July to support the larger mining fleet, which is expected to increase material moved and reduce unit operating costs.
Cash cost and sustaining cash cost per pound of copper produced, net of by-product credits, in the first quarter of 2024 were $3.49 and $4.85, respectively.
British Columbia Guidance Outlook
|
|
|
Three months ended2
|
Guidance
|
|
|
|
Mar. 31, 2024
|
Annual 2024
|
|
Contained metal in concentrate produced
|
|
|
|
|
Copper
|
tonnes
|
7,024
|
30,000 - 44,000
|
|
Gold
|
oz
|
4,417
|
17,000 - 26,000
|
|
Silver
|
oz
|
88,376
|
300,000 - 455,000
|
|
Cost per pound of copper produced
|
|
|
|
|
Cash cost1
|
$/lb
|
3.49
|
2.00 - 2.50
|
|
1 Cash cost and sustaining cash cost, net of by-product credits, are non-IFRS financial performance measures with no standardized definition under IFRS. For further information and a detailed reconciliation, please see the discussion under the "Non-IFRS Financial Performance Measures" section of this MD&A.
|
|
2 Copper Mountain mine results are stated at 100%. Hudbay owns 75% of Copper Mountain mine. As Copper Mountain was acquired on June 20, 2023, there were no comparative 2023 figures.
|
We expect to achieve our 2024 production guidance for all metals in British Columbia. Cash cost for the quarter was above the upper end of our 2024 guidance range; however, it is expected to decline during the remainder of 2024 and the full year cash cost is expected to be within the 2024 guidance range.
FINANCIAL REVIEW
Financial Results
In the first quarter of 2024, we recorded a net earnings of $18.5 million compared to a net earnings of $5.5 million in the first quarter of 2023, representing an increase in net earnings of $13.0 million.
The following table provides further details on the makeup of this variance:
| (in $ millions) |
|
Three months ended
March 31, 2024 |
|
| Increase (decrease) in components of earnings or loss: |
|
|
|
| Revenues |
|
229.8 |
|
| Cost of sales |
|
|
|
| Mine operating costs |
|
(102.5 |
) |
| Depreciation and amortization |
|
(41.9 |
) |
| Selling and administrative expenses |
|
(7.5 |
) |
| Exploration expenses |
|
(4.4 |
) |
| Re-evaluation adjustment - environmental obligation |
|
(3.0 |
) |
| Other expenses |
|
(11.3 |
) |
| Net finance expense |
|
(9.0 |
) |
| Tax expense |
|
(37.2 |
) |
| Increase in net earnings for the period |
|
13.0 |
|
Revenue
Revenue for the first quarter of 2024 was $525.0 million, $229.8 million higher than the same period in 2023, primarily as a result of as a result of higher copper and gold sales volumes from mining the high-grade zones of the Pampacancha deposit and higher gold and copper grade zones at Lalor as well as significantly lower copper and gold sales in the comparative period due to political unrest in Peru causing logistics and supply chain disruptions leading to a buildup of copper concentrate inventory, and $67.9 million of incremental revenue generated by the acquired Copper Mountain mine.
The following table provides further details on these variances:
| (in $ millions) |
|
Three months ended
March 31, 2024 |
|
| |
|
|
|
| Metals prices1 |
|
|
|
| Lower copper prices |
|
(6.0 |
) |
| Lower zinc prices |
|
(4.3 |
) |
| Higher gold prices |
|
5.4 |
|
| Lower silver prices |
|
(0.8 |
) |
| Sales volumes |
|
|
|
| Higher copper sales volumes |
|
71.4 |
|
| Higher zinc sales volumes |
|
1.5 |
|
| Higher gold sales volumes |
|
103.3 |
|
| Higher silver sales volumes |
|
9.8 |
|
| British Columbia Business Unit2 |
|
|
|
| Copper |
|
61.8 |
|
| Gold |
|
7.6 |
|
| Silver |
|
2.0 |
|
| Treatment & Refining |
|
(3.5 |
) |
| Other |
|
|
|
| Molybdenum and other volume and pricing differences |
|
(4.0 |
) |
| Variable consideration adjustments |
|
(8.7 |
) |
| Effect of higher treatment and refining charges |
|
(5.7 |
) |
| Increase in revenue in 2024 compared to 2023 |
|
229.8 |
|
1 See discussion below for further information regarding metals prices.
2 Copper Mountain mine results are stated at 100%. Hudbay owns 75% of Copper Mountain mine. As Copper Mountain was acquired on June 20, 2023, there were no comparative figures for the three months ended March 31, 2023.
Our revenue by significant product type is summarized below:
| |
|
Three months ended |
|
| (in $ millions) |
|
Mar. 31, 2024 |
|
|
Mar. 31, 2023 |
|
| Copper |
|
285.2 |
|
|
164.2 |
|
| Gold |
|
178.1 |
|
|
74.9 |
|
| Zinc |
|
14.9 |
|
|
19.8 |
|
| Silver |
|
12.2 |
|
|
6.3 |
|
| Molybdenum |
|
18.2 |
|
|
19.0 |
|
| Other metals |
|
- |
|
|
0.2 |
|
| Revenue from contracts |
|
508.6 |
|
|
284.4 |
|
| Amortization of deferred revenue - gold |
|
16.4 |
|
|
5.4 |
|
| Amortization of deferred revenue - silver |
|
10.6 |
|
|
5.6 |
|
| Amortization of deferred revenue - variable consideration adjustments - prior periods |
|
(3.8 |
) |
|
4.9 |
|
| Pricing and volume adjustments1 |
|
20.9 |
|
|
13.4 |
|
| Treatment and refining charges |
|
(27.7 |
) |
|
(18.5 |
) |
| Revenue |
|
525.0 |
|
|
295.2 |
|
1 Pricing and volume adjustments represents mark-to-market adjustments on provisionally prices sales, realized and unrealized changes to fair value for non-hedge derivative contracts and adjustments to originally invoiced weights and assays.
For further detail on variable consideration adjustments, refer to note 17 of our consolidated interim financial statements.
Realized sales prices
This measure is intended to enable management and investors to understand the average realized price of metals sold to third parties in each reporting period. The average realized price per unit sold does not have any standardized meaning prescribed by IFRS, is unlikely to be comparable to similar measures presented by other issuers and should not be considered in isolation or a substitute for measures of performance prepared in accordance with IFRS.
For sales of copper, zinc, gold and silver we may enter into non-hedge derivatives ("QP hedges") which are intended to manage the provisional pricing risk arising from quotational period terms in concentrate sales agreements. The gains and losses on QP hedges are included in the calculation of realized prices. We expect that gains and losses on QP hedges will offset provisional pricing adjustments on concentrate sales contracts.
Our realized prices for the first quarter of 2024 and 2023, respectively, are summarized below:
| |
|
|
Realized prices1 for the |
|
| |
Three months ended |
|
| Prices |
|
LME QTD 20242 |
|
|
Mar. 31, 2024 |
|
|
Mar. 31, 2023 |
|
| Copper |
$/lb |
|
3.83 |
|
|
3.91 |
|
|
3.98 |
|
| Zinc3 |
$/lb |
|
1.11 |
|
|
1.07 |
|
|
1.39 |
|
| Gold4 |
$/oz |
|
|
|
|
1,941 |
|
|
1,881 |
|
| Silver4 |
$/oz |
|
|
|
|
21.52 |
|
|
22.14 |
|
1 Realized prices exclude refining and treatment charges and are on the sale of finished metal or metal in concentrate. Realized prices include the effect of provisional pricing adjustments on prior period sales.
2 London Metal Exchange average for Cash copper and zinc prices.
3 Includes sales of zinc concentrate and sales of zinc metal. Zinc realized prices include premiums paid by customers for delivery of refined zinc metal, but exclude unrealized gains and losses related to non-hedge derivative contracts that are included in zinc revenues. Realized prices include the effect of provisional pricing adjustments on zinc concentrate.
4 Sales of gold and silver from Constancia mine are subject to our precious metals stream agreement with Wheaton, pursuant to which we recognize deferred revenue for precious metals deliveries and also receive cash payments. Stream sales are included within realized prices and their respective deferred revenue and cash payment rates can be found on page 29 of this MD&A.
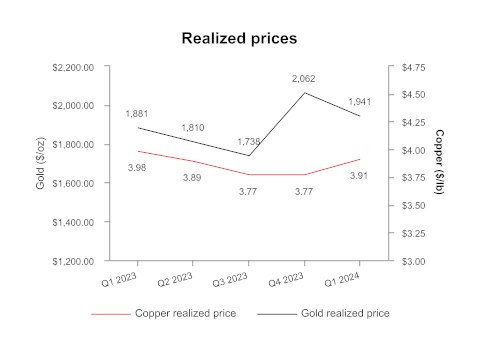
In addition to QP hedges, we may periodically undertake metal price hedging in accordance with Board approved policies to achieve strategic objectives, including locking in favourable metal prices to ensure minimum cash flows during or after the construction of a mine or during a period of reduced liquidity, to manage cash flows at shorter life or higher cost operations or as part of a financing arrangement. The realized prices, denoted in the table above, exclude the impact of derivative mark-to-market gains and losses on these non-QP hedges, which are included in change in fair value of financial instruments in our consolidated interim statement of earnings. As of March 31, 2024, Hudbay had the following non-QP hedges outstanding:
- Forward sales contracts at the Copper Mountain mine for a total of 7,200 tonnes of copper over the period of May 2024 to April 2025 at an average price of $3.95 per pound;
- Zero-cost collar program at the Copper Mountain mine for 9,000 tonnes of copper over a twelve month period of May 2024 to April 2025 at an average floor price of $3.88 per pound and an average cap price of $4.14 per pound; and
- Zero-cost collar program for 4,000 ounces of gold production per month over a period of April 2024 to December 2024 at an average floor price of $2,088 per ounce and an average cap price of $2,458 per ounce.
Together, the existing forward copper sales and zero copper cost collar hedges represent approximately 44% of Copper Mountain's expected 2024 production.
The following tables provide a reconciliation of average realized price per unit sold, by metal, to revenues as shown in the consolidated interim financial statements.
| Three months ended March 31, 2024 |
|
| (in $ millions) 1 |
|
Copper |
|
|
Zinc |
|
|
Gold |
|
|
Silver |
|
|
Molybdenum |
|
|
Other |
|
|
Total |
|
| Revenue from contracts 2 |
|
285.2 |
|
|
14.9 |
|
|
178.1 |
|
|
12.2 |
|
|
18.2 |
|
|
- |
|
|
508.6 |
|
| Amortization of deferred revenue |
|
- |
|
|
- |
|
|
16.4 |
|
|
10.6 |
|
|
- |
|
|
- |
|
|
27.0 |
|
| Pricing and volume adjustments 3 |
|
4.7 |
|
|
(0.4 |
) |
|
15.3 |
|
|
0.2 |
|
|
1.1 |
|
|
- |
|
|
20.9 |
|
| Revenue, including mark-to-market on QP hedges 4 |
|
289.9 |
|
|
14.5 |
|
|
209.8 |
|
|
23.0 |
|
|
19.3 |
|
|
- |
|
|
556.5 |
|
| Realized non-QP derivative mark-to-market |
|
- |
|
|
- |
|
|
- |
|
|
- |
|
|
- |
|
|
- |
|
|
- |
|
| By-product credits 5 |
|
289.9 |
|
|
14.5 |
|
|
209.8 |
|
|
23.0 |
|
|
19.3 |
|
|
- |
|
|
556.5 |
|
| Payable metal in concentrate and doré sold 6 |
|
33,608 |
|
|
6,119 |
|
|
108,081 |
|
|
1,068,848 |
|
|
415 |
|
|
- |
|
|
- |
|
| Realized price 7 |
|
8,618 |
|
|
2,370 |
|
|
1,941 |
|
|
21.52 |
|
|
- |
|
|
- |
|
|
- |
|
| Realized price 8 |
|
3.91 |
|
|
1.07 |
|
|
- |
|
|
- |
|
|
- |
|
|
- |
|
|
- |
|
| Three months ended March 31, 2023 |
|
| (in $ millions) 1 |
|
Copper |
|
|
Zinc |
|
|
Gold |
|
|
Silver |
|
|
Molybdenum |
|
|
Other |
|
|
Total |
|
| Revenue from contracts 2 |
|
164.2 |
|
|
19.8 |
|
|
74.9 |
|
|
6.3 |
|
|
19.0 |
|
|
0.2 |
|
|
284.4 |
|
| Amortization of deferred revenue |
|
- |
|
|
- |
|
|
5.4 |
|
|
5.6 |
|
|
- |
|
|
- |
|
|
11.0 |
|
| Pricing and volume adjustments 3 |
|
(1.5 |
) |
|
(2.5 |
) |
|
13.2 |
|
|
0.1 |
|
|
4.1 |
|
|
- |
|
|
13.4 |
|
| Revenue, including mark-to-market on QP hedges 4 |
|
162.7 |
|
|
17.3 |
|
|
93.5 |
|
|
12.0 |
|
|
23.1 |
|
|
0.2 |
|
|
308.8 |
|
| Realized non-QP derivative mark-to-market |
|
- |
|
|
- |
|
|
- |
|
|
- |
|
|
- |
|
|
- |
|
|
- |
|
| By-product credits 5 |
|
162.7 |
|
|
17.3 |
|
|
93.5 |
|
|
12.0 |
|
|
23.1 |
|
|
0.2 |
|
|
308.8 |
|
| Payable metal in concentrate and doré sold 6 |
|
18,541 |
|
|
5,628 |
|
|
49,720 |
|
|
541,884 |
|
|
254 |
|
|
- |
|
|
- |
|
| Realized price 7 |
|
8,775 |
|
|
3,074 |
|
|
1,881 |
|
|
22.14 |
|
|
- |
|
|
- |
|
|
- |
|
| Realized price 8 |
|
3.98 |
|
|
1.39 |
|
|
- |
|
|
- |
|
|
- |
|
|
- |
|
|
- |
|
|
1 Average realized price per unit sold may not calculate based on amounts presented in this table due to rounding.
|
|
2 As per consolidated interim financial statements.
|
|
3 Pricing and volume adjustments represents mark-to-market adjustments on provisionally priced sales, realized and unrealized changes to fair value for QP hedge derivative contracts and adjustments to originally invoiced weights and assays.
|
|
4 Revenue, including mark-to-market on QP hedges is used in the calculation of realized price.
|
|
5 By-product credits subtotal is used in the calculated of cash cost per pound of copper and ounce of gold produced, net of by-product credits. Cash cost per pound of copper and per ounce of gold produced, net of by-product credits, are non-IFRS financial performance measures with no standardized definition under IFRS. For further information and a detailed reconciliation, please see the discussion under the "Non-IFRS Financial Performance Measures" section of this MD&A.
|
|
6 Copper, zinc and molybdenum shown in metric tonnes and gold and silver shown in ounces.
|
|
7 Realized price for copper and zinc in $/metric tonne and realized price for gold and silver in $/oz.
|
|
8 Realized price for copper and zinc in $/lb.
|
The price, quantity and mix of metals sold, affect our revenue, operating cash flow and gross profit. Revenue from metals sales can vary from quarter to quarter due to production levels, shipping volumes and transfer of risk and title to customers.
Stream Sales
The following table shows stream sales included within realized prices and their respective deferred revenue and cash payment rates:
| |
|
|
Three months ended |
|
| |
|
|
March 31, 2024 |
|
|
Mar. 31, 2023 |
|
| Gold |
oz |
|
20,123 |
|
|
6,579 |
|
| Silver |
oz |
|
726,114 |
|
|
365,644 |
|
| Gold deferred revenue drawdown rate1,2 |
$/oz |
|
817 |
|
|
820 |
|
| Gold cash rate3 |
$/oz |
|
420 |
|
|
416 |
|
| Total gold stream realized price |
$/oz |
|
1,237 |
|
|
1,236 |
|
| Silver deferred revenue drawdown rate1,2 |
$/oz |
|
14.56 |
|
|
15.26 |
|
| Silver cash rate3 |
$/oz |
|
6.20 |
|
|
6.14 |
|
| Total silver stream realized price |
$/oz |
|
20.76 |
|
|
21.40 |
|
1 Subsequent to the variable consideration adjustment recorded on January 1, 2024, the deferred revenue amortization is recorded in Peru at $817/oz gold and $14.56/oz silver (March 31, 2023 - $820/oz gold and $15.26/oz silver).
2 Deferred revenue drawdown rates for gold and silver do not include variable consideration adjustments.
3 The gold and silver cash rate for Peru increased by 1% from $400/oz and $5.90/oz effective August 4, 2019. Subsequently every year, on August 4, the cash rate will increase by 1% compounded. The gold and silver cash rate for Manitoba increased by 1% from $400/oz and $5.90/oz effective August 1, 2015. Subsequently every year, on August 1, the cash rate will increase by 1% compounded. The weighted average cash rate is disclosed.
Cost of Sales
Our detailed cost of sales is summarized as follows:
| (in $ thousands) |
|
Three months ended |
|
| |
Mar. 31, 2024 |
|
|
Mar. 31, 2023 |
|
| Peru |
|
|
|
|
|
|
| Mining |
|
29,220 |
|
|
26,786 |
|
| Milling |
|
43,624 |
|
|
46,191 |
|
| Changes in product inventory |
|
14,077 |
|
|
(11,135 |
) |
| Depreciation and amortization |
|
71,030 |
|
|
41,960 |
|
| G&A |
|
23,208 |
|
|
16,452 |
|
| Freight, royalties and other charges |
|
18,698 |
|
|
13,092 |
|
| Total Peru cost of sales |
|
199,857 |
|
|
133,346 |
|
| Manitoba |
|
|
|
|
|
|
| Mining |
|
44,360 |
|
|
37,752 |
|
| Milling |
|
16,476 |
|
|
14,848 |
|
| Changes in product inventory |
|
(558 |
) |
|
1,726 |
|
| Depreciation and amortization |
|
26,594 |
|
|
25,462 |
|
| Inventory adjustments |
|
(24 |
) |
|
- |
|
| G&A |
|
11,580 |
|
|
10,182 |
|
| Freight, royalties and other charges |
|
6,189 |
|
|
5,390 |
|
| Total Manitoba cost of sales |
|
104,617 |
|
|
95,360 |
|
| British Columbia1 |
|
|
|
|
|
|
| Mining |
|
28,553 |
|
|
- |
|
| Milling |
|
23,374 |
|
|
- |
|
| Changes in product inventory |
|
(3,965 |
) |
|
- |
|
| Depreciation and amortization |
|
11,649 |
|
|
- |
|
| G&A |
|
3,902 |
|
|
- |
|
| Freight, royalties and other charges |
|
5,048 |
|
|
- |
|
| Total British Columbia cost of sales |
|
68,561 |
|
|
- |
|
| Cost of sales |
|
373,035 |
|
|
228,706 |
|
1 As Copper Mountain was acquired on June 20, 2023, there were no comparative figures for the three months ended March 31, 2023.
Total cost of sales for the first quarter of 2024 was $373.0 million, reflecting an increase of $144.3 million from the first quarter of 2023 in part due to $68.6 million of operating costs from British Columbia with no similar costs in the comparative period. In addition, Peru cost of sales increased by $66.5 million in the first quarter of 2024, compared to the same period of 2023 mainly due to higher depreciation, in line with the higher production during the quarter. Peru cost of sales was also higher in the first quarter of 2024, due to higher G&A and freight costs and a drawdown of product inventory versus the comparative 2023 period. Manitoba cost of sales increased by $9.2 million in the first quarter of 2024, primarily as a result of higher mining costs during the quarter, compared to the same period of 2023.
For details on unit operating costs, refer to the respective tables in the "Operations Review" section of this MD&A.
For the first quarter of 2024, other significant variances in non-operating expenses, compared to the same period in 2023, include the following:
- Net finance expenses increased by $9.0 million primarily due to an increase in net foreign exchange loss by $4.5 million, an increase in mark-to-market losses of $3.3 million from non-QP hedges, an increase in other finance charges of $2.9 million and an increase in net interest expense on long-term debt of $2.2 million. These increases were partially offset by a $2.6 million decrease in the relative revaluation loss of the gold prepayment liability.
- Other expenses increased by $11.3 million primarily due to a $9.0 million write-off of previously capitalized PP&E costs, net of capitalized accrued interest, related to an expired option agreement in Arizona and a $1.4 million increase in amortization of certain community costs.
- Selling and administrative expenses increased by $7.5 million reflecting a higher share based compensation expense as a result of a comparative increase in share price during the current period along with incremental selling and administrative expenses incurred by the Copper Mountain mine.
- Exploration expenses increased by $4.4 million primarily due to our planned Snow Lake exploration program consisting of modern geophysical programs and multi-phased drilling campaigns.
- Re-evaluation adjustment - environmental provision gain decreased by $3.0 million due to the relative revaluation of the environmental reclamation provision on our Manitoba non-producing sites from changes in long term risk-free discount rates and inflation rates.
Given the long term nature of the reclamation cash flows, the related environmental reclamation provision is highly sensitive to changes in inflation rates and long-term risk-free discount rates and, as such, we may continue to experience significant quarterly closure cost provision revaluations.
Tax Expense
For the three months ended March 31, 2024, tax expense increased by $37.2 million compared to the same periods in 2023. The following table provides further details:
(in $ thousands)
|
|
Three months ended |
|
| |
Mar. 31,
2024 |
|
|
Mar. 31,
2023 |
|
| Deferred tax recovery - income tax1 |
|
3,441 |
|
|
(3,150 |
) |
| Deferred tax recovery - mining tax1 |
|
(2,264 |
) |
|
(1,999 |
) |
| Total deferred tax recovery |
|
1,177 |
|
|
(5,149 |
) |
| Current tax expense - income tax |
|
35,285 |
|
|
10,765 |
|
| Current tax expense - mining tax |
|
12,753 |
|
|
6,357 |
|
| Total current tax expense |
|
48,038 |
|
|
17,122 |
|
| Tax expense |
|
49,215 |
|
|
11,973 |
|
1 Deferred tax expense (recovery) represents our draw down/increase of non-cash deferred income and mining tax assets/liabilities.
Income Tax Expense/Recovery
Applying the estimated Canadian statutory income tax rate of 26.2% to our earnings before taxes of $67.7 million for the year-to-date of 2024 would have resulted in a tax expense of approximately $17.8 million; however, we recorded an income tax expense of $38.7 million. The significant items causing our effective income tax rate to be different than the 26.2% estimated Canadian statutory income tax rate include:
- Deductible temporary differences with respect to Peru, Manitoba and British Columbia, relating to the decommissioning and restoration liabilities, were derecognized as we have determined that it is probable that we will not realize the recovery of these deferred tax assets based on the timing of the reversals of the deductible temporary differences and the future projected taxable earnings of the operations. This resulted in a combined deferred tax expense of $6.5 million.
- Foreign exchange on the translation of deferred tax balances to group currency resulted in a deferred tax expense of $7.1 million.
- The tax expense with respect to our foreign operations are recorded using an income tax rate other than the Canadian statutory income tax rate of 26.2%, resulting in a tax expense of $5.7 million.
- New Canadian tax legislation, applicable to Hudbay starting in the 2024 tax year, that limits interest and finance expenses to 30% of Tax EBITDA. The restricted interest and finance expense (RIFE) in the year creates a new tax pool that can be used in future years when there is excess capacity available. The effect of restricted interest and financing expense limitations of which no deferred tax asset is recognized results in a tax expense of $3.5 million.
Mining Tax Expense
Applying the estimated Manitoba mining tax rate of 10.0% to our net income before taxes of $67.7 million for the year-to-date of 2024 would have resulted in a tax expense of approximately $6.8 million; however, we recorded a mining tax expense of $10.5 million. Effective mining tax rates can vary significantly based on the composition of our earnings and the expected amount of mining taxable earnings. Corporate costs and other costs not related to mining operations are not deductible in computing mining earnings. A brief description of how mining taxes are calculated in our various business units is discussed below.
Manitoba
The Province of Manitoba imposes mining tax on earnings related to the sale of mineral products mined in the Province of Manitoba (mining taxable profit) at the following rates:
- 10% of total mining taxable earnings if mining profit is C$50 million or less;
- Between mining earnings of C$50 and $C55 million, mining tax is equal to a minimum of C$5 million plus mining earnings less C$50 million multiplied by 65%;
- 15% of total mining taxable earnings if mining profits are between C$55 million and C$100 million;
- Between mining earnings of C$100 million and C$105 million, mining tax is equal to a minimum of C$15 million plus mining earnings less C$100 million multiplied by 57%; and
- 17% of total mining taxable earnings if mining profits exceed C$105 million.
We estimate that the tax rate that will be applicable when temporary differences reverse will be approximately 10.0%.
Peru
The Peruvian government imposes two parallel mining tax regimes, the Special Mining Tax and the Modified Royalty, on companies' operating mining income on a sliding scale, with progressive rates ranging from 2.0% to 8.4% and 1.0% to 12.0%, respectively. Based on financial forecasts, we have recorded a deferred tax liability as at March 31, 2024, at the tax rate we expect to apply when temporary differences reverse.
British Columbia
The Province of British Columbia imposes a 13% net revenue tax on the sale of mineral products mined in the province of British Columbia after the mine owner has recovered the capital invested in the mine and its "Cumulative Expenditure Account" ("CEA") no longer has a balance. The tax is paid on the profit in excess of the capital that has been invested in the mine. British Columbia mineral tax is deductible for federal and provincial income tax purposes.
While there is a balance in the CEA account, the mine owner must pay a "Net Current Proceeds" ("NCP") tax of 2%. Any amounts paid as NCP can then be claimed in the future against net revenue taxes payable.
We estimate that the effective tax rate that will be applicable when temporary differences reverse will be approximately 9.49%.
LIQUIDITY AND CAPITAL RESOURCES
As at March 31, 2024, our liquidity includes $284.4 million in cash as well as undrawn total availability of $334.5 million under our revolving credit facilities.
Senior Unsecured Notes
We have $600.0 million aggregate principal amount of 4.5% senior notes due April 2026 and $600.0 million aggregate principal amount of 6.125% senior notes due April 2029.
Senior Secured Revolving Credit Facilities
We have two senior secured revolving credit facilities with total commitments of $450 million ("the Credit Facilities") for our Canadian and Peruvian businesses on substantially similar terms and conditions.
As at March 31, 2024, we had $90.0 million of debt outstanding under our Peruvian revolving credit facility. As at March 31, 2024, we were in compliance with our covenants under the Credit Facilities and had also drawn $25.5 million in letters of credit under the Credit Facilities. In total, $115.5 million was owing under the Credit Facilities as at March 31, 2024. Subsequent to March 31, 2024, we repaid $10.0 million on our Peruvian revolving credit facility.
C$130 Million Bilateral Letter of Credit Facility
We have a C$130.0 million bilateral letter of credit facility ("LC Facility") with a major Canadian financial institution. The LC Facility has no financial covenants and enables us to issue up to C$130.0 million of letters of credit to beneficiaries on an unsecured basis at attractive rates, including C$30.0 million sub-limit for financial letters of credit. As at March 31, 2024, the Manitoba business unit had drawn $55.3 million in letters of credit under the LC Facility.
Surety Bonds and Unsecured Letters of Credit
As at March 31, 2024, the Arizona business unit had $8.7 million in surety bonds issued to support future reclamation and closure obligations and the Peru business unit had $126.1 million in letters of credit issued with various Peruvian financial institutions to support future reclamation and other operating matters. In addition, the British Columbia business unit had $45.5 million in surety bonds issued to support future reclamation and $4.9 million in surety bonds issued to support the hydro used at Copper Mountain mine. No cash collateral is required to be posted under these letters of credit or surety bonds.
Gold Prepayment Liability
During the fourth quarter of 2020, we entered into a gold forward sale and prepay transaction which generated $115.0 million in cash proceeds to pre-fund the expected capital requirements for the New Britannia gold mill refurbishment project. The transaction valued the future gold ounce delivery obligation at 79,954 gold ounces to be delivered in fixed monthly deliveries of 3,331 gold ounces over a 24-month period from January 2022 to December 2023.
During the first quarter of 2023, we amended our gold forward sale and prepay agreements to defer eight months of deliveries starting with February 2023. As at March 31, 2024 we have 17,202 ounces of gold fixed monthly deliveries to make from April to August 2024. The fair value of the financial liability as at March 31, 2024 was $37.9 million.
Working Capital
Working capital increased by $64.9 million to $200.9 million from December 31, 2023 to March 31, 2024, primarily due to an increase in cash and cash equivalents of $34.6 million, a decrease in gold prepayment liability of $18.0 million, a decrease in deferred revenue of $15.3 million, a decrease in taxes payable of $13.5 million and an increase in prepaid and other assets of $7.8 million. Partially offsetting these items were increases in other liabilities, other financial liabilities and lease liabilities of $9.2 million, decreases in trade receivables of $5.7 million, and a decrease in inventories of $5.4 million.
Cash Flows
The following table summarizes our cash flows for the three months ended March 31, 2024 and March 31, 2023:
| (in $ thousands) |
|
Three months ended |
|
| |
Mar. 31, 2024 |
|
|
Mar. 31, 2023 |
|
| Operating cash flow before change in non-cash working capital |
|
147,539 |
|
|
85,608 |
|
| Change in non-cash working capital |
|
(7,863 |
) |
|
(14,329 |
) |
| Cash generated from operating activities |
|
139,676 |
|
|
71,279 |
|
| Cash used in investing activities |
|
(58,920 |
) |
|
(65,076 |
) |
| Cash (used in) generated from financing activities |
|
(47,600 |
) |
|
23,245 |
|
| Effect of movement in exchange rates on cash |
|
1,435 |
|
|
450 |
|
| Increase in cash |
|
34,591 |
|
|
29,898 |
|
Cash Flow from Operating Activities
Cash generated from operating activities was $139.7 million during the first quarter of 2024, an increase of $68.4 million compared to the same period in 2023. Operating cash flow before change in non-cash working capital was $147.5 million during the first quarter of 2024, reflecting an increase of $61.9 million compared to the first quarter of 2023. The increase in operating cash flows before change in working capital was primarily the result higher copper and gold sales volumes from mining the high grade zones of the Pampacancha deposit and higher gold and copper grade zones at Lalor, higher realized gold metal prices as well as incremental contribution margin from the Copper Mountain mine. This was partially offset by a significant increase in cash taxes paid of $54.9 million mainly at our Peru operations, compared to the same period in 2023.
Cash Flow from Investing and Financing Activities
During the first quarter of 2024, we spent $106.5 million in investing and financing activities, primarily driven by $62.4 million in capital expenditures, a $21.4 million partial repayment of our gold prepayment liability, $10.0 million in repayments on our revolving credit facilities, $8.6 million in capitalized lease and equipment financing payments, $5.3 million in other financing costs mainly related to our Credit Facilities and withholding taxes, $2.6 million of dividends paid and $1.4 million in community agreement payments. These cash outflows were partially offset by $4.8 million of interest income and grants received and $1.3 million net proceeds from exercise of stock options and warrants.
Capital Expenditures
The following summarizes accrued and cash additions to capital assets for the periods indicated:
| |
|
Three months ended |
|
|
Guidance |
|
| |
|
Mar. 31, 2024 |
|
|
Mar. 31, 2023 |
|
|
Annual |
|
| (in $ millions) |
|
20242 |
|
| Peru sustaining capital expenditures1 |
|
25.2 |
|
|
29.1 |
|
|
130.0 |
|
| Manitoba sustaining capital expenditures |
|
9.7 |
|
|
11.6 |
|
|
55.0 |
|
| British Columbia sustaining capital expenditures3 |
|
16.3 |
|
|
- |
|
|
105.0 |
|
| Total sustaining capital expenditures |
|
51.2 |
|
|
40.7 |
|
|
290.0 |
|
| Arizona capitalized costs |
|
4.4 |
|
|
6.1 |
|
|
20.0 |
|
| Peru growth capitalized expenditures |
|
0.1 |
|
|
1.8 |
|
|
2.0 |
|
| Manitoba growth capitalized expenditures |
|
1.7 |
|
|
8.4 |
|
|
10.0 |
|
| British Columbia growth capitalized costs3 |
|
0.3 |
|
|
- |
|
|
5.0 |
|
| Other capitalized costs2 |
|
18.4 |
|
|
2.8 |
|
|
|
|
| Capitalized exploration |
|
2.1 |
|
|
0.6 |
|
|
8.0 |
|
| Total other capitalized expenditures |
|
27.0 |
|
|
19.7 |
|
|
|
|
| Total accrued capital additions |
|
78.2 |
|
|
60.4 |
|
|
|
|
| Reconciliation to cash capital additions: |
|
|
|
|
|
|
|
|
|
| Right-of-use asset and equipment financing additions |
|
(15.2 |
) |
|
(0.6 |
) |
|
|
|
| Grants received |
|
2.4 |
|
|
- |
|
|
|
|
| Community agreement additions |
|
(1.8 |
) |
|
- |
|
|
|
|
| Change in capital accruals and other |
|
(1.2 |
) |
|
5.1 |
|
|
|
|
| Acquisition of property, plant & equipment - cash |
|
62.4 |
|
|
64.9 |
|
|
|
|
1 Peru sustaining capital expenditures include capitalized stripping costs.
2 Other capitalized costs primarily include right-of-use lease and equipment financing additions, which are excluded from guidance in 2024, in addition to non-cash deferred stripping.
3 British Columbia operations represented on a 100% basis and for the period since the acquisition completion date of June 20, 2023. Hence, there are no comparatives figures for the three months ended March 31, 2023.
For the three months ended March 31, 2024, total capital additions increased by $17.8 million, compared to the same period in 2023, primarily due to new sustaining capital expenditures at the Copper Mountain mine and higher capitalized right of use assets and leases, partially offset by reduced sustaining and growth capital expenditures in Manitoba and Peru.
Sustaining capital expenditures in Manitoba for the three months ended March 31, 2024 was $9.7 million, representing a decline of $1.9 million compared to the same period in 2023 due to lower capital development at Lalor in 2024. Sustaining capital expenditures in Peru for the three months ended March 31, 2024 was $25.2 million, representing a decrease of $3.9 million compared to the same period in 2023. Sustaining capital expenditures in British Columbia for the three months ended March 31, 2024 was $16.3 million which included $10.7 million of capitalized stripping related to our three year accelerated stripping campaign to access higher grade ore. The accelerated stripping campaign in British Columbia is expected to improve operating efficiencies and lower unit operating costs over the next three years.
Growth capital spending in Manitoba for the three months ended March 31, 2024 was $1.7 million, representing a decrease of $6.7 million compared to the same period in 2023. The decrease mainly relates to the completion of the Stall mill recovery improvement project in 2023. Growth capital expenditures in Peru for the three months ended March 31, 2024 were $0.1 million, representing a decrease of $1.7 million compared to the same period in 2023. The decrease mainly relates to the completion of the copper recovery improvement project in 2023. Arizona's capital expenditures for the three months March 31, 2024 was $4.4 million, mainly relate to ongoing carrying costs.
Other capitalized costs for the three months ended March 31, 2024 was $18.4 million, which are mostly made up of non-cash capitalized lease and equipment financing additions.
Capitalized exploration for the three months ended March 31, 2024 was $2.1 million.
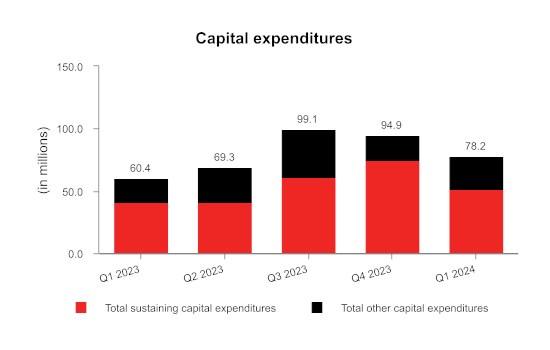
Capital Commitments
As at March 31, 2024, we had outstanding capital commitments in Canada of approximately $21.3 million, of which $17.4 million can be terminated, approximately $66.5 million in Peru primarily related to sustaining capital commitments and exploration option agreements, all of which can be terminated, and approximately $34.7 million in Arizona, primarily related to our Copper World project, none of which can be terminated.
Contractual Obligations
The following table summarizes our significant contractual obligations as at March 31, 2024:
| |
|
Total |
|
|
Less than
12 months |
|
|
13 - 36
months |
|
|
37 - 60
months |
|
|
More than
60 months |
|
| Payment Schedule (in $ millions) |
| Long-term debt obligations1 |
|
1,578.8 |
|
|
74.3 |
|
|
812.6 |
|
|
73.5 |
|
|
618.4 |
|
| Gold prepayment obligation2 |
|
37.9 |
|
|
37.9 |
|
|
- |
|
|
- |
|
|
- |
|
| Lease obligations |
|
157.6 |
|
|
61.0 |
|
|
63.5 |
|
|
19.6 |
|
|
13.5 |
|
| Purchase obligation - capital commitments |
|
122.6 |
|
|
71.6 |
|
|
30.4 |
|
|
20.6 |
|
|
- |
|
| Purchase obligation - other commitments3 |
|
1,521.6 |
|
|
504.9 |
|
|
429.9 |
|
|
126.0 |
|
|
460.8 |
|
| Pension and other employee future benefits obligations2 |
|
109.9 |
|
|
7.7 |
|
|
13.3 |
|
|
8.8 |
|
|
80.1 |
|
| Community agreement obligations4, 5 |
|
89.1 |
|
|
20.3 |
|
|
10.0 |
|
|
7.8 |
|
|
51.0 |
|
| Decommissioning and restoration obligations5 |
|
484.8 |
|
|
2.7 |
|
|
13.3 |
|
|
7.5 |
|
|
461.3 |
|
| Total |
|
4,102.3 |
|
|
780.4 |
|
|
1,373.0 |
|
|
263.8 |
|
|
1,685.1 |
|
1 Long-term debt obligations include scheduled interest payments, as well as principal repayments
2 Discounted.
3 Primarily made up of trades payables, accrued liabilities, long-term agreements with operational suppliers, obligations for power purchases, concentrate handling, fleet and port services, as well as deferred consideration arising from the acquisition of Rosemont's minority interest.
4 Represents community agreement obligations and various finalized land user agreements, including Pampacancha.
5 Undiscounted before inflation.
In addition to the contractual obligations included in the above payment schedule, we also have the following commitments which impact our financial position:
- A profit-sharing plan with most Manitoba employees;
- A profit-sharing plan with all Peru employees;
- Wheaton precious metals stream agreement for the Constancia mine;
- Government royalty payments related to the Constancia mines; and,
- Participation Agreements related to the Copper Mountain mine.
Outstanding Share Data
As of May 10, 2024, the final trading day prior to the date of this MD&A, there were 351,056,529 common shares of Hudbay issued and outstanding. In addition, there were 2,812,474 stock options and 351,912 common share purchase warrants outstanding.
FINANCIAL RISK MANAGEMENT
The Financial Risk Management risks in this MD&A are not exhaustive. Please also refer to the heading "Risk Factors" in our most recent Annual Information Form, for a discussion of the additional risk factors that may affect Hudbay's business, operations and financial condition.
TREND ANALYSIS AND QUARTERLY REVIEW
A detailed quarterly and annual summary of financial and operating performance can be found in the "Summary of Results" section at the end of this MD&A. The following table sets forth selected consolidated financial information for each of our eight most recently completed quarters:
|
(in $ millions, except per share amounts, production on a copper equivalent basis and average realized copper price)
|
2024
|
2023
|
2022
|
|
Q1
|
Q4
|
Q3
|
Q2
|
Q1
|
Q4
|
Q3
|
Q2
|
|
Production on a copper equivalent basis (tonnes)
|
62,120
|
77,951
|
71,335
|
37,530
|
38,614
|
45,454
|
42,099
|
46,332
|
|
Average realized copper price ($/lb)
|
3.91
|
3.77
|
3.77
|
3.89
|
3.98
|
3.61
|
3.47
|
4.28
|
|
Revenue
|
525.0
|
602.2
|
480.5
|
312.2
|
295.2
|
321.2
|
346.2
|
415.5
|
|
Gross profit
|
152.0
|
196.8
|
106.4
|
22.9
|
66.5
|
69.7
|
32.4
|
89.5
|
|
Earnings (loss) before tax
|
67.8
|
81.0
|
84.1
|
(30.7)
|
17.4
|
(14.3)
|
(0.3)
|
21.5
|
|
Net earnings (loss)
|
18.5
|
33.5
|
45.5
|
(14.9)
|
5.5
|
(17.4)
|
(8.1)
|
32.1
|
|
Adjusted net earnings (loss)1
|
57.6
|
71.3
|
24.4
|
(18.3)
|
0.1
|
2.6
|
(12.4)
|
30.5
|
|
Earnings (loss) per share:
|
|
|
|
|
|
|
|
|
|
Basic and diluted
|
0.05
|
0.10
|
0.13
|
(0.05)
|
0.02
|
(0.07)
|
(0.03)
|
0.12
|
|
Adjusted net earnings (loss)1 per share
|
0.16
|
0.20
|
0.07
|
(0.07)
|
0.00
|
0.01
|
(0.05)
|
0.12
|
|
Operating cash flow before change in non-cash working capital
|
147.5
|
246.5
|
182.0
|
55.9
|
85.6
|
109.1
|
81.6
|
123.9
|
|
Adjusted EBITDA1
|
214.2
|
274.4
|
190.7
|
81.2
|
101.9
|
124.7
|
99.3
|
141.4
|
1 Adjusted net earnings (loss), adjusted net earnings (loss) per share, and adjusted EBITDA are non-IFRS financial performance measure with no standardized definition under IFRS. For further information and a detailed reconciliation, please see the discussion under the "Non-IFRS Financial Performance Measures" section of this MD&A.
On a quarterly basis, the Company's revenue is primarily impacted by metal prices, production mix and sales volumes of the key metals we produce. In addition to these factors, gross profit, net earnings (loss), earnings (loss) per share, operating cash flow before change in non-cash working capital and adjusted EBITDA are also impacted by input costs. Net earnings (loss) and earnings (loss) per share are further impacted by net finance expense and re-evaluation adjustments of our closed site environmental provision.
The Company's results have also been impacted by the acquisition of Copper Mountain in June 2023 and by the planned closure of 777 in the second quarter of 2022.
The first quarter of 2024 and the fourth quarter of 2023 reflected the continuation of strong copper, gold and silver production that commenced in the third quarter of 2023. The increase in copper, gold and silver prices in the first quarter of 2024 also contributed to strong revenue and profitability in the quarter.
Third quarter of 2023 results reflected significantly higher copper and gold production and sales volumes from the high grade zones of the Pampacancha deposit and higher gold and copper grade zones at Lalor resulting in a significant increase in our revenues, gross profits and earnings.
The second quarter of 2023 benefited from the drawdown of higher-than-normal unsold copper concentrate inventory levels in Peru that had built up due to supply chain disruptions during a short period of social and political unrest in the first quarter of 2023.
Gold prices during the first quarter of 2023 averaged levels not seen since 2020, which positively impacted gross profit during the quarter. Political unrest in Peru resulted in road blockades causing logistics and supply chain disruptions until mid-February 2023 and led to a buildup of copper concentrate inventory above normal operating levels, affecting overall revenues and net earnings in the first quarter.
Revenues for the fourth quarter of 2022 were negatively impacted by lower production due to planned maintenance programs at Lalor and Constancia, short-term changes in the mine plan in Peru and a build up of product inventory in Peru due to the aforementioned social unrest. The revenue impact of lower throughput was partially offset by higher commodity prices. Inflationary pressures on fuel, consumables and energy costs negatively impacting our production costs and margins.
Commodity prices declined during the third quarter of 2022 while growing inflationary pressures contributed to higher mine operating costs resulting in declines in our key financial metrics during the quarter.
The second quarter results for 2022 were impacted by a revaluation gain of $60.7 million pertaining mostly to the environmental reclamation provision on our Flin Flon site due to increases in long-term risk-free interest rates. A pre-tax impairment loss of $95.0 million was recorded following the release of the Copper World Preliminary Economic Assessment in June 2022 as certain assets associated with the previous, stand-alone development plan for the Rosemont deposit are no longer expected to be recoverable.
NON-IFRS FINANCIAL PERFORMANCE MEASURES
Adjusted net earnings (loss), adjusted net earnings (loss) per share, adjusted EBITDA, realized prices, net debt, net debt to adjusted EBITDA, cash cost, sustaining and all-in sustaining cash cost per pound of copper produced, cash cost and sustaining cash cost per ounce of gold produced, combined unit cost and ratios based on these measures are non-IFRS performance measures. These measures do not have a meaning prescribed by IFRS and are therefore unlikely to be comparable to similar measures presented by other issuers. These measures should not be considered in isolation or as a substitute for measures prepared in accordance with IFRS and are not necessarily indicative of gross profit or cash flow from operations as determined under IFRS. Other companies may calculate these measures differently.
Management believes adjusted net earnings (loss) and adjusted net earnings (loss) per share provides an alternate measure of the Company's performance for the current period and gives insight into its expected performance in future periods. These measures are used internally by the Company to evaluate the performance of its underlying operations and to assist with its planning and forecasting of future operating results. As such, the Company believes these measures are useful to investors in assessing the Company's underlying performance. We provide adjusted EBITDA to help users analyze our results and to provide additional information about our ongoing cash generating potential in order to assess our capacity to service and repay debt, carry out investments and cover working capital needs. Net debt is shown because it is a performance measure used by the Company to assess our financial position. Net debt to adjusted EBITDA is shown because it is a performance measure used by the Company to assess our financial leverage and debt capacity. Realized price is shown to understand the average realized price of metals sold to third parties in each reporting period. Cash cost, sustaining and all-in sustaining cash cost per pound of copper produced are shown because we believe they help investors and management assess the performance of our operations, including the margin generated by the operations and the Company. Cash cost and sustaining cash cost per ounce of gold produced are shown because we believe they help investors and management assess the performance of our Manitoba operations. Combined unit cost is shown because we believe it helps investors and management assess our cost structure and margins that are not impacted by variability in by-product commodity prices.
Adjusted Net Earnings
Adjusted net earnings represents net earnings (loss) excluding certain impacts, net of taxes, such as mark-to-market adjustments, impairment charges and reversal of impairment charges, write-down of assets, revaluation of the environmental reclamation provision for closed sites, and foreign exchange (gain) loss. These measures are not necessarily indicative of net earnings (loss) or cash flows as determined under IFRS. The following table provides a reconciliation of net earnings per the condensed consolidated interim statements of earnings, to adjusted net earnings for the three months ended March 31, 2024 and 2023.
| |
|
Three months ended |
|
| (in $ millions) |
|
Mar. 31,
2024 |
|
|
Mar. 31,
2023 |
|
| Net earnings for the period |
|
18.5 |
|
|
5.4 |
|
| Tax expense |
|
49.3 |
|
|
12.0 |
|
| Earnings before tax |
|
67.8 |
|
|
17.4 |
|
| Adjusting items: |
|
|
|
|
|
|
| Mark-to-market adjustments1 |
|
12.8 |
|
|
6.8 |
|
| Foreign exchange loss |
|
4.8 |
|
|
0.3 |
|
| Variable consideration adjustment - stream revenue and accretion |
|
4.0 |
|
|
(5.0 |
) |
| Re-evaluation adjustment - environmental provision2 |
|
(5.3 |
) |
|
(8.2 |
) |
| Restructuring charges |
|
0.9 |
|
|
- |
|
| Reduction of obligation to renounce flow-through expenditures |
|
(0.7 |
) |
|
- |
|
| Loss on disposal of investments |
|
- |
|
|
0.7 |
|
| Write-down/loss on disposal of PP&E |
|
9.0 |
|
|
0.1 |
|
| Adjusted earnings before income taxes |
|
93.3 |
|
|
12.1 |
|
| Tax expense |
|
(49.3 |
) |
|
(12.0 |
) |
| Tax impact of adjusting items |
|
13.6 |
|
|
- |
|
| Adjusted net earnings |
|
57.6 |
|
|
0.1 |
|
| Adjusted net earnings ($/share) |
|
0.16 |
|
|
0.00 |
|
| Basic weighted average number of common shares outstanding (millions) |
|
350.8 |
|
|
262.0 |
|
1 Includes changes in fair value of the gold prepayment liability, Canadian junior mining investments, other financial assets and liabilities at fair value through net earnings and share-based compensation (recoveries) expenses.
2 Changes from movements to environmental reclamation provisions are primarily related to the Flin Flon operations, which were fully depreciated as of June 30, 2022, as well as other Manitoba non-operating sites.
After adjusting reported net earnings for those items not considered representative of the Company's core business or indicative of future operations, the Company had adjusted net earnings in the first quarter of 2024 of $57.6 million or $0.16 earnings per share.
Adjusted EBITDA
Adjusted EBITDA is earnings before net finance expense/income, tax expense/recoveries, depreciation and amortization of property, plant and equipment and deferred revenue, as well as certain other adjustments. We calculate adjusted EBITDA by excluding certain adjustments included within our adjusted net earnings measure which we believe reflects the underlying performance of our core operating activities. The measure also removes the impact of non-cash items and financing costs that are not associated with measuring the underlying performance of our operations. However, our adjusted EBITDA is not the measure defined as EBITDA under our senior notes or revolving credit facilities and may not be comparable with performance measures with the same name reported by other companies. Adjusted EBITDA should not be considered as a substitute for earnings or as a better measure of liquidity than operating cash flow, which are calculated in accordance with IFRS. We provide adjusted EBITDA to help users analyze our results and to provide additional information about our ongoing cash generating potential in order to assess our capacity to service and repay debt, carry out investments and cover working capital needs.
The following table presents the reconciliation of earnings per the condensed consolidated interim statements of earnings, to adjusted EBITDA for the three months ended March 31, 2024 and 2023:
| |
|
Three months ended |
|
| (in $ millions) |
|
Mar. 31, 2024 |
|
|
Mar. 31, 2023 |
|
| Net earnings for the period |
|
18.5 |
|
|
5.4 |
|
| Add back: |
|
|
|
|
|
|
| Tax expense |
|
49.3 |
|
|
12.0 |
|
| Net finance expense |
|
44.0 |
|
|
35.0 |
|
| Other expense |
|
16.3 |
|
|
5.0 |
|
| Depreciation and amortization |
|
109.3 |
|
|
67.4 |
|
| Amortization of deferred revenue and variable consideration adjustment |
|
(23.2 |
) |
|
(15.9 |
) |
| Adjusting items (pre-tax): |
|
|
|
|
|
|
| Re-evaluation adjustment - environmental provision |
|
(5.3 |
) |
|
(8.2 |
) |
| Option agreement proceeds |
|
(0.4 |
) |
|
- |
|
| Share-based compensation expense 1 |
|
5.7 |
|
|
1.2 |
|
| Adjusted EBITDA |
|
214.2 |
|
|
101.9 |
|
1 Share-based compensation expense reflected in cost of sales and selling and administrative expenses.
Net Debt
The following table presents our calculation of net debt as at March 31, 2024 and December 31, 2023:
| (in $ thousands) |
|
Mar. 31,
2024 |
|
|
Dec. 31,
2023 |
|
| Total long-term debt |
|
1,278,587 |
|
|
1,287,536 |
|
| Cash and cash equivalents |
|
(284,385 |
) |
|
(249,794 |
) |
| Net debt |
|
994,202 |
|
|
1,037,742 |
|
Net Debt to Adjusted EBITDA Ratio
The following table presents our calculation of net debt to adjusted EBITDA, both metrics have been reconciled above to the most comparable IFRS measure, as at March 31, 2024 and December 31, 2023:
| (in $ millions, except net debt to adjusted EBITDA ratio) |
|
Mar. 31,
2024 |
|
|
Dec. 31,
2023 |
|
| Net debt |
|
994.2 |
|
|
1,037.7 |
|
| Adjusted EBITDA for the last twelve months |
|
760.5 |
|
|
647.8 |
|
| Net debt to adjusted EBITDA |
|
1.3 |
|
|
1.6 |
|
The following table presents the reconciliation of Net earnings per the condensed consolidated interim statements of earnings, to adjusted EBITDA for the last twelve month ended March 31, 2024 and December 31, 2023:
| |
|
12 months ended |
|
| (in $ millions) |
|
Mar. 31, 2024 |
|
|
Dec. 31, 2023 |
|
| Net earnings for the period |
|
82.6 |
|
|
69.5 |
|
| Add back: |
|
|
|
|
|
|
| Tax expense |
|
119.7 |
|
|
82.3 |
|
| Net finance expense |
|
154.3 |
|
|
145.3 |
|
| Other expense |
|
49.7 |
|
|
38.3 |
|
| Depreciation and amortization |
|
433.7 |
|
|
391.7 |
|
| Amortization of deferred revenue and variable consideration adjustment |
|
(84.6 |
) |
|
(77.3 |
) |
| Adjusting items (pre-tax): |
|
|
|
|
|
|
| Re-evaluation adjustment - environmental provision |
|
(8.4 |
) |
|
(11.4 |
) |
| Inventory adjustments |
|
2.3 |
|
|
2.3 |
|
| Option agreement proceeds |
|
(0.4 |
) |
|
- |
|
| Share-based compensation expense 1 |
|
11.6 |
|
|
7.1 |
|
| Adjusted EBITDA for the last twelve months |
|
760.5 |
|
|
647.8 |
|
1 Share-based compensation expense reflected in cost of sales and selling and administrative expenses.
The following table presents our calculation of the last twelve months adjusted EBITDA:
| |
|
Three months ended |
|
|
LTM1 |
|
Trailing Adjusted EBITDA
(in $ millions) |
|
Mar. 31, 2024 |
|
|
Dec. 31, 2023 |
|
|
Sept. 30, 2023 |
|
|
Jun. 30, 2023 |
|
| Net earnings (loss) for the period |
|
18.5 |
|
|
33.5 |
|
|
45.5 |
|
|
(14.9 |
) |
|
82.6 |
|
| Add back: |
|
|
|
|
|
|
|
|
|
|
|
|
|
|
|
| Tax expense (recovery) |
|
49.3 |
|
|
47.5 |
|
|
38.7 |
|
|
(15.8 |
) |
|
119.7 |
|
| Net finance expense |
|
44.0 |
|
|
48.9 |
|
|
30.9 |
|
|
30.5 |
|
|
154.3 |
|
| Other expenses |
|
16.3 |
|
|
10.6 |
|
|
8.9 |
|
|
13.9 |
|
|
49.7 |
|
| Depreciation and amortization |
|
109.3 |
|
|
121.9 |
|
|
113.8 |
|
|
88.7 |
|
|
433.7 |
|
| Amortization of deferred revenue and variable consideration adjustment |
|
(23.2 |
) |
|
(26.5 |
) |
|
(16.8 |
) |
|
(18.1 |
) |
|
(84.6 |
) |
| Adjusting items (pre-tax): |
|
|
|
|
|
|
|
|
|
|
|
|
|
|
|
| Re-evaluation adjustment - environmental provision |
|
(5.3 |
) |
|
34.0 |
|
|
(32.4 |
) |
|
(4.7 |
) |
|
(8.4 |
) |
| Inventory adjustments |
|
- |
|
|
1.4 |
|
|
- |
|
|
0.9 |
|
|
2.3 |
|
| Option agreement proceeds |
|
(0.4 |
) |
|
- |
|
|
- |
|
|
- |
|
|
(0.4 |
) |
| Share-based compensation expenses2 |
|
5.7 |
|
|
3.1 |
|
|
2.1 |
|
|
0.7 |
|
|
11.6 |
|
| Adjusted EBITDA |
|
214.2 |
|
|
274.4 |
|
|
190.7 |
|
|
81.2 |
|
|
760.5 |
|
1 LTM (last twelve months) as of March 31, 2024.
2 Share-based compensation expense reflected in cost of sales and administrative expenses.
Cash Cost, Sustaining and All-in Sustaining Cash Cost (Copper Basis)
Cash cost per pound of copper produced ("cash cost") is a non-IFRS measure that management uses as a key performance indicator to assess the performance of our operations. Our calculation designates copper as our primary metal of production as it has been the largest component of revenues. The calculation is presented in four manners:
- Cash cost, before by-product credits - This measure is gross of by-product revenues and is a function of the efforts and costs incurred to mine and process all ore mined. However, the measure divides this aggregate cost over only pounds of copper produced, our primary metal of production. This measure is generally less volatile from period to period, as it is not affected by changes in the price received for by-product metals. It is, however, affected by the relative mix of copper concentrate and zinc concentrate production, where an increase in production of zinc concentrate will tend to result in an increase in cash cost under this measure.
- Cash cost, net of by-product credits - In order to calculate the net cost to produce and sell copper, the net of by-product credits measure subtracts the revenues realized from the sale of the metals other than copper. The by-product revenues from zinc, gold, and silver are significant and are integral to the economics of our operations. The economics that support our decision to produce and sell copper would be different if we did not receive revenues from the other significant metals being extracted and processed. This measure provides management and investors with an indication of the minimum copper price consistent with positive operating margins, assuming realized by-product metal prices are consistent with those prevailing during the reporting period. It also serves as an important operating statistic that management and investors utilize to measure our operating performance versus that of our competitors. However, it is important to understand that if by-product metal prices decline alongside copper prices, the cash cost net of by-product credits would increase, requiring a higher copper price than that reported to maintain positive cash flows and operating margins.
- Sustaining cash cost, net of by-product credits - This measure is an extension of cash cost that includes cash sustaining capital expenditures, including payments on capitalized leases, capitalized sustaining exploration, net smelter returns royalties, payments on certain long-term community agreements, as well as accretion and amortization for expected decommissioning activities for producing assets. It does not include corporate selling and administrative expenses. It provides a more fulsome measurement of the cost of sustaining production than cash cost, which is focused on operating costs only.
- All-in sustaining cash cost, net of by-product credits - This measure is an extension of sustaining cash cost that includes corporate G&A, regional costs, accretion and amortization for community agreements relating to current operations, and accretion for expected decommissioning activities for non-producing sites. Due to the inclusion of corporate selling and administrative expenses, all-in sustaining cash cost is presented on a consolidated basis only.
The tables below present a detailed build-up of cash cost and sustaining cash cost, net of by-product credits, by business unit in addition to consolidated all-in sustaining cash cost, net of by-product credits, and reconciliations between cash cost, net of by-product credits, to the most comparable IFRS measures of cost of sales for the three months ended March 31, 2024 and 2023. Cash cost, net of by-product credits may not calculate exactly based on amounts presented in the tables below due to rounding.
| Consolidated |
|
Three months ended |
|
| Net pounds of copper produced1 |
|
|
|
| (in thousands) |
|
Mar. 31, 2024 |
|
|
Mar. 31, 2023 |
|
| Peru |
|
54,181 |
|
|
45,233 |
|
| Manitoba |
|
6,942 |
|
|
4,508 |
|
| British Columbia2 |
|
15,485 |
|
|
- |
|
| Net pounds of copper produced |
|
76,608 |
|
|
49,741 |
|
1 Contained copper in concentrate.
2 The net pounds of copper produced for British Columbia are only included from the date of acquisition of June 20, 2023. There are no comparative figures for the three months ended March 31, 2023.
| Consolidated |
|
Three months ended |
|
| |
|
Mar. 31, 2024 |
|
|
Mar. 31, 2023 |
|
| Cash cost per pound of copper produced |
|
$000s |
|
|
$/lb |
|
|
$000s |
|
|
$/lb |
|
| Cash cost, before by-product credits |
|
278,668 |
|
|
3.64 |
|
|
188,403 |
|
|
3.79 |
|
| By-product credits |
|
(266,686 |
) |
|
(3.48 |
) |
|
(146,111 |
) |
|
(2.94 |
) |
| Cash cost, net of by-product credits |
|
11,982 |
|
|
0.16 |
|
|
42,292 |
|
|
0.85 |
|
| Consolidated |
|
Three months ended |
|
| |
|
Mar. 31, 2024 |
|
|
Mar. 31, 2023 |
|
| Cash cost per pound of copper produced |
|
$000s |
|
|
$/lb |
|
|
$000s |
|
|
$/lb |
|
| Mining |
|
102,133 |
|
|
1.33 |
|
|
64,538 |
|
|
1.30 |
|
| Milling |
|
83,474 |
|
|
1.09 |
|
|
61,039 |
|
|
1.23 |
|
| G&A |
|
38,335 |
|
|
0.50 |
|
|
26,555 |
|
|
0.53 |
|
| Onsite costs |
|
223,942 |
|
|
2.92 |
|
|
152,132 |
|
|
3.06 |
|
| Treatment & refining |
|
27,664 |
|
|
0.36 |
|
|
18,495 |
|
|
0.37 |
|
| Freight & other |
|
27,062 |
|
|
0.36 |
|
|
17,776 |
|
|
0.36 |
|
| Cash cost, before by-product credits |
|
278,668 |
|
|
3.64 |
|
|
188,403 |
|
|
3.79 |
|
| Consolidated |
|
Three months ended |
|
| |
|
Mar. 31, 2024 |
|
|
Mar. 31, 2023 |
|
| Supplementary cash cost information |
|
$000s |
|
|
$/lb1 |
|
|
$000s |
|
|
$/lb1 |
|
| By-product credits2: |
|
|
|
|
|
|
|
|
|
|
|
|
| Zinc |
|
14,589 |
|
|
0.19 |
|
|
17,374 |
|
|
0.35 |
|
| Gold3 |
|
209,812 |
|
|
2.74 |
|
|
93,479 |
|
|
1.88 |
|
| Silver3 |
|
23,039 |
|
|
0.30 |
|
|
11,998 |
|
|
0.24 |
|
| Molybdenum & other |
|
19,246 |
|
|
0.25 |
|
|
23,260 |
|
|
0.47 |
|
| Total by-product credits |
|
266,686 |
|
|
3.48 |
|
|
146,111 |
|
|
2.94 |
|
| Reconciliation to IFRS: |
|
|
|
|
|
|
|
|
|
|
|
|
| Cash cost, net of by-product credits |
|
11,982 |
|
|
|
|
|
42,292 |
|
|
|
|
| By-product credits |
|
266,686 |
|
|
|
|
|
146,111 |
|
|
|
|
| Treatment and refining charges |
|
(27,664 |
) |
|
|
|
|
(18,495 |
) |
|
|
|
| Inventory adjustments |
|
(24 |
) |
|
|
|
|
- |
|
|
|
|
| Share-based compensation expense |
|
355 |
|
|
|
|
|
79 |
|
|
|
|
| Change in product inventory |
|
9,554 |
|
|
|
|
|
(9,409 |
) |
|
|
|
| Royalties |
|
2,873 |
|
|
|
|
|
706 |
|
|
|
|
| Depreciation and amortization4 |
|
109,273 |
|
|
|
|
|
67,422 |
|
|
|
|
| Cost of sales5 |
|
373,035 |
|
|
|
|
|
228,706 |
|
|
|
|
1 Per pound of copper produced.
2 By-product credits are computed as revenue per financial statements, including amortization of deferred revenue and pricing and volume adjustments. For more information, please see the realized price reconciliation table on page 28 of this MD&A for these figures.
3 Gold and silver by-product credits do not include variable consideration adjustments with respect to stream arrangements. Variable consideration adjustments are cumulative adjustments to gold and silver stream deferred revenue primarily associated with the net change in mineral reserves and resources or amendments to the mine plan that would change the total expected deliverable ounces under the precious metal streaming arrangement. For the three months ended March 31, 2024 the variable consideration adjustments amounted loss of $3,849 (three months ended March 31, 2023 - income of $4,885).
4 Depreciation is based on concentrate sold.
5 As per consolidated interim financial statements.
| Peru |
|
Three months ended |
|
| (in thousands) |
|
Mar. 31, 2024 |
|
|
Mar. 31, 2023 |
|
| Net pounds of copper produced1 |
|
54,181 |
|
|
45,233 |
|
1 Contained copper in concentrate.
| Peru |
|
Three months ended |
|
| |
|
Mar. 31, 2024 |
|
|
Mar. 31, 2023 |
|
| Cash cost per pound of copper produced |
|
$000s |
|
|
$/lb |
|
|
$000s |
|
|
$/lb |
|
| Mining |
|
29,220 |
|
|
0.54 |
|
|
26,786 |
|
|
0.59 |
|
| Milling |
|
43,624 |
|
|
0.80 |
|
|
46,191 |
|
|
1.03 |
|
| G&A |
|
23,092 |
|
|
0.43 |
|
|
16,466 |
|
|
0.36 |
|
| Onsite costs |
|
95,936 |
|
|
1.77 |
|
|
89,443 |
|
|
1.98 |
|
| Treatment & refining |
|
14,975 |
|
|
0.28 |
|
|
10,603 |
|
|
0.24 |
|
| Freight & other |
|
16,580 |
|
|
0.30 |
|
|
12,427 |
|
|
0.27 |
|
| Cash cost, before by-product credits |
|
127,491 |
|
|
2.35 |
|
|
112,473 |
|
|
2.49 |
|
| By-product credits |
|
(104,329 |
) |
|
(1.92 |
) |
|
(50,899 |
) |
|
(1.13 |
) |
| Cash cost, net of by-product credits |
|
23,162 |
|
|
0.43 |
|
|
61,574 |
|
|
1.36 |
|
| Peru |
|
Three months ended |
|
| |
|
Mar. 31, 2024 |
|
|
Mar. 31, 2023 |
|
| Supplementary cash cost information |
|
$000s |
|
|
$/lb 1 |
|
|
$000s |
|
|
$/lb 1 |
|
| By-product credits2: |
|
|
|
|
|
|
|
|
|
|
|
|
| Gold3 |
|
69,533 |
|
|
1.28 |
|
|
19,301 |
|
|
0.43 |
|
| Silver3 |
|
15,550 |
|
|
0.29 |
|
|
8,577 |
|
|
0.19 |
|
| Molybdenum |
|
19,246 |
|
|
0.35 |
|
|
23,021 |
|
|
0.51 |
|
| Total by-product credits |
|
104,329 |
|
|
1.92 |
|
|
50,899 |
|
|
1.13 |
|
| Reconciliation to IFRS: |
|
|
|
|
|
|
|
|
|
|
|
|
| Cash cost, net of by-product credits |
|
23,162 |
|
|
|
|
|
61,574 |
|
|
|
|
| By-product credits |
|
104,329 |
|
|
|
|
|
50,899 |
|
|
|
|
| Treatment and refining charges |
|
(14,975 |
) |
|
|
|
|
(10,603 |
) |
|
|
|
| Share-based compensation expenses |
|
116 |
|
|
|
|
|
(14 |
) |
|
|
|
| Change in product inventory |
|
14,077 |
|
|
|
|
|
(11,135 |
) |
|
|
|
| Royalties |
|
2,118 |
|
|
|
|
|
665 |
|
|
|
|
| Depreciation and amortization4 |
|
71,030 |
|
|
|
|
|
41,960 |
|
|
|
|
| Cost of sales5 |
|
199,857 |
|
|
|
|
|
133,346 |
|
|
|
|
1 Per pound of copper produced.
2 By-product credits are computed as revenue per financial statements, including amortization of deferred revenue and pricing and volume adjustments. For more information, please see the realized price reconciliation table on page 28 of this MD&A.
3 Gold and silver by-product credits do not include variable consideration adjustments with respect to stream arrangements.
4 Depreciation is based on concentrate sold.
5 As per consolidated interim financial statements.
| British Columbia2 |
|
Three months ended |
|
| (in thousands) |
|
Mar. 31, 2024 |
|
| Net pounds of copper produced1 |
|
15,485 |
|
1 Contained copper in concentrate.
2 Copper Mountain mine results are states at 100%. Hudbay owns 75% of Copper Mountain mine. As Copper Mountain was acquired on June 20, 2023, there were no comparative figures for the three months ended March 31, 2023.
| British Columbia5 |
|
Three months ended |
|
| |
|
Mar. 31, 2024 |
|
| Cash cost per pound of copper produced |
|
$000s |
|
|
$/lb |
|
| Mining |
|
28,553 |
|
|
1.85 |
|
| Milling |
|
23,374 |
|
|
1.51 |
|
| G&A |
|
3,897 |
|
|
0.25 |
|
| Onsite costs |
|
55,824 |
|
|
3.61 |
|
| Treatment & refining |
|
3,476 |
|
|
0.22 |
|
| Freight & other |
|
4,293 |
|
|
0.28 |
|
| Cash cost, before by-product credits |
|
63,593 |
|
|
4.11 |
|
| By-product credits |
|
(9,543 |
) |
|
(0.62 |
) |
| Cash cost, net of by-product credits |
|
54,050 |
|
|
3.49 |
|
| British Columbia5 |
|
Three months ended |
|
| |
|
Mar. 31, 2024 |
|
| Supplementary cash cost information |
|
$000s |
|
|
$/lb 1 |
|
| By-product credits2: |
|
|
|
|
|
|
| Gold |
|
7,564 |
|
|
0.49 |
|
| Silver |
|
1,979 |
|
|
0.13 |
|
| Total by-product credits |
|
9,543 |
|
|
0.62 |
|
| Reconciliation to IFRS: |
|
|
|
|
|
|
| Cash cost, net of by-product credits |
|
54,050 |
|
|
|
|
| By-product credits |
|
9,543 |
|
|
|
|
| Treatment and refining charges |
|
(3,476 |
) |
|
|
|
| Share-based compensation expenses |
|
5 |
|
|
|
|
| Change in product inventory |
|
(3,965 |
) |
|
|
|
| Royalties |
|
755 |
|
|
|
|
| Depreciation and amortization3 |
|
11,649 |
|
|
|
|
| Cost of sales4 |
|
68,561 |
|
|
|
|
1 Per pound of copper produced.
2 By-product credits are computed as revenue per financial statements, including pricing and volume adjustments. For more information, please see the realized price reconciliation table on page 28 of this MD&A.
3 Depreciation is based on concentrate sold.
4 As per consolidated interim financial statements
5 Copper Mountain mine results are states at 100%. Hudbay owns 75% of Copper Mountain mine. As Copper Mountain was acquired on June 20, 2023, there were no comparative figures for the three months ended March 31, 2023.
| Consolidated |
|
Three months ended |
|
| |
|
Mar. 31, 2024 |
|
|
Mar. 31, 2023 |
|
| All-in sustaining cash cost per pound of copper produced |
|
$000s |
|
|
$/lb |
|
|
$000s |
|
|
$/lb |
|
| Cash cost, net of by-product credits |
|
11,982 |
|
|
0.16 |
|
|
42,292 |
|
|
0.85 |
|
| Cash sustaining capital expenditures |
|
62,314 |
|
|
0.80 |
|
|
47,869 |
|
|
0.96 |
|
| Capitalized exploration |
|
2,100 |
|
|
0.03 |
|
|
- |
|
|
- |
|
| Royalties |
|
2,873 |
|
|
0.04 |
|
|
706 |
|
|
0.02 |
|
| Sustaining cash cost, net of by-product credits |
|
79,269 |
|
|
1.03 |
|
|
90,867 |
|
|
1.83 |
|
| Corporate selling and administrative expenses & regional costs |
|
18,094 |
|
|
0.24 |
|
|
10,215 |
|
|
0.20 |
|
| Accretion and amortization of decommissioning and community agreements1 |
|
4,007 |
|
|
0.05 |
|
|
1,958 |
|
|
0.04 |
|
| All-in sustaining cash cost, net of by-product credits |
|
101,370 |
|
|
1.32 |
|
|
103,040 |
|
|
2.07 |
|
| Reconciliation to property, plant and equipment additions: |
|
|
|
|
|
|
|
|
|
|
|
|
| Property, plant and equipment additions |
|
46,220 |
|
|
|
|
|
33,554 |
|
|
|
|
| Capitalized stripping net additions |
|
31,983 |
|
|
|
|
|
26,984 |
|
|
|
|
| Total accrued capital additions |
|
78,203 |
|
|
|
|
|
60,538 |
|
|
|
|
| Less other non-sustaining capital costs2 |
|
26,982 |
|
|
|
|
|
19,850 |
|
|
|
|
| Total sustaining capital costs |
|
51,221 |
|
|
|
|
|
40,688 |
|
|
|
|
| Capitalized lease & equipment financing cash payments - operating sites |
|
8,274 |
|
|
|
|
|
4,702 |
|
|
|
|
| Community agreement cash payments |
|
800 |
|
|
|
|
|
1,189 |
|
|
|
|
| Accretion and amortization of decommissioning and restoration obligations 3 |
|
2,019 |
|
|
|
|
|
1,290 |
|
|
|
|
| Cash sustaining capital expenditures |
|
62,314 |
|
|
|
|
|
47,869 |
|
|
|
|
1 Includes accretion of decommissioning liability relating to non-producing sites, and accretion and amortization of community agreements capitalized to Other assets.
2 Other non-sustaining capital costs include Arizona capitalized costs, capitalized interest, capitalized exploration, right-of-use lease asset additions, equipment financing asset additions and growth capital expenditures.
3 Includes amortization of decommissioning and restoration PP&E assets and accretion of decommissioning and restoration liabilities related to producing sites.
| Peru |
|
Three months ended |
|
| |
|
Mar. 31, 2024 |
|
|
Mar. 31, 2023 |
|
| Sustaining cash cost per pound of copper produced |
|
$000s |
|
|
$/lb |
|
|
$000s |
|
|
$/lb |
|
| Cash cost, net of by-product credits |
|
23,162 |
|
|
0.43 |
|
|
61,574 |
|
|
1.36 |
|
| Cash sustaining capital expenditures |
|
29,779 |
|
|
0.55 |
|
|
33,564 |
|
|
0.74 |
|
| Capitalized exploration1 |
|
2,100 |
|
|
0.04 |
|
|
- |
|
|
- |
|
| Royalties |
|
2,118 |
|
|
0.04 |
|
|
665 |
|
|
0.02 |
|
| Sustaining cash cost per pound of copper produced |
|
57,159 |
|
|
1.06 |
|
|
95,803 |
|
|
2.12 |
|
1 Only includes exploration costs incurred for locations near to existing mine operations.
| British Columbia1 |
|
Three months ended |
|
| |
|
Mar. 31, 2024 |
|
| Sustaining cash cost per pound of copper produced |
|
$000s |
|
|
$/lb |
|
| Cash cost, net of by-product credits |
|
54,050 |
|
|
3.49 |
|
| Cash sustaining capital expenditures |
|
20,361 |
|
|
1.31 |
|
| Royalties |
|
755 |
|
|
0.05 |
|
| Sustaining cash cost per pound of copper produced |
|
75,166 |
|
|
4.85 |
|
1 Copper Mountain mine results are states at 100%. Hudbay owns 75% of Copper Mountain mine. As Copper Mountain was acquired on June 20, 2023, there were no comparative figures for the three months ended March 31, 2023.
Gold Cash Cost and Gold Sustaining Cash Cost
Cash cost per ounce of gold produced ("gold cash cost") is a non-IFRS measure that management uses as a key performance indicator to assess the performance of our Manitoba operations. This alternative cash cost calculation designates gold as the primary metal of production as it represents a substantial component of revenues for our Manitoba business unit and should therefore be less volatile over time than Manitoba cash cost per pound of copper. The calculation is presented in three manners:
- Gold cash cost, before by-product credits - This measure is gross of by-product revenues and is a function of the efforts and costs incurred to mine and process all ore mined. However, the measure divides this aggregate cost over only ounces of gold produced, the assumed primary metal of production. This measure is generally less volatile from period to period, as it is not affected by changes in the price received for by-product metals.
- Gold cash cost, net of by-product credits - In order to calculate the net cost to produce and sell gold, the net of by-product credits measure subtracts the revenues realized from the sale of the metals other than gold. The by-product revenues from copper, zinc, and silver are significant and are integral to the economics of our Manitoba operation. The economics that support our decision to produce and sell gold would be different if we did not receive revenues from the other significant metals being extracted and processed. This measure provides management and investors with an indication of the minimum gold price consistent with positive operating margins, assuming realized by-product metal prices are consistent with those prevailing during the reporting period. It also serves as an important operating statistic that management and investors utilize to measure our operating performance at our Manitoba operation versus that of our competitors. However, it is important to understand that if by-product metal prices decline alongside gold prices, the gold cash cost net of by-product credits would increase, requiring a higher gold price than that reported to maintain positive cash flows and operating margins.
- Gold sustaining cash cost, net of by-product credits - This measure is an extension of gold cash cost that includes cash sustaining capital expenditures, capitalized exploration, net smelter returns royalties, as well as accretion and amortization for expected decommissioning activities for producing assets. It does not include corporate selling and administrative expenses. It provides a more fulsome measurement of the cost of sustaining production than gold cash cost, which is focused on operating costs only.
The tables below present a detailed build-up of gold cash cost and gold sustaining cash cost, net of by-product credits, for the Manitoba business unit, and reconciliations between gold cash cost, net of by-product credits, to the most comparable IFRS measures of cost of sales for the three months ended March 31, 2024 and 2023. Gold cash cost, net of by-product credits, may not calculate exactly based on amounts presented in the tables below due to rounding.
| Manitoba |
|
Three months ended |
|
| (in thousands) |
|
Mar. 31, 2024 |
|
|
Mar. 31, 2023 |
|
| Net ounces of gold produced1 |
|
56,831 |
|
|
36,034 |
|
1 Contained gold in concentrate and doré.
| Manitoba |
|
Three months ended |
|
| |
|
Mar. 31, 2024 |
|
|
Mar. 31, 2023 |
|
| Cash cost per ounce of gold produced |
|
$000s |
|
|
$/oz1 |
|
|
$000s |
|
|
$/oz1 |
|
| Mining |
|
44,360 |
|
|
780 |
|
|
37,752 |
|
|
1,048 |
|
| Milling |
|
16,476 |
|
|
290 |
|
|
14,848 |
|
|
412 |
|
| G&A |
|
11,346 |
|
|
200 |
|
|
10,089 |
|
|
280 |
|
| Onsite costs |
|
72,182 |
|
|
1,270 |
|
|
62,689 |
|
|
1,740 |
|
| Treatment & refining |
|
9,213 |
|
|
162 |
|
|
7,892 |
|
|
219 |
|
| Freight & other |
|
6,189 |
|
|
109 |
|
|
5,349 |
|
|
148 |
|
| Cash cost, before by-product credits |
|
87,584 |
|
|
1,541 |
|
|
75,930 |
|
|
2,107 |
|
| By-product credits |
|
(45,734 |
) |
|
(805 |
) |
|
(42,131 |
) |
|
(1,169 |
) |
| Gold cash cost, net of by-product credits |
|
41,850 |
|
|
736 |
|
|
33,799 |
|
|
938 |
|
| Manitoba |
|
Three months ended |
|
| Supplementary cash cost information |
|
Mar. 31, 2024 |
|
|
Mar. 31, 2023 |
|
| |
$000s |
|
|
$/oz 1 |
|
|
$000s |
|
|
$/oz 1 |
|
| By-product credits2: |
|
|
|
|
|
|
|
|
|
|
|
|
| Copper |
|
25,635 |
|
|
451 |
|
|
21,097 |
|
|
585 |
|
| Zinc |
|
14,589 |
|
|
257 |
|
|
17,374 |
|
|
482 |
|
| Silver |
|
5,510 |
|
|
97 |
|
|
3,421 |
|
|
95 |
|
| Other |
|
- |
|
|
- |
|
|
239 |
|
|
7 |
|
| Total by-product credits |
|
45,734 |
|
|
805 |
|
|
42,131 |
|
|
1,169 |
|
| Reconciliation to IFRS: |
|
|
|
|
|
|
|
|
|
|
|
|
| Cash cost, net of by-product credits |
|
41,850 |
|
|
|
|
|
33,799 |
|
|
|
|
| By-product credits |
|
45,734 |
|
|
|
|
|
42,131 |
|
|
|
|
| Treatment and refining charges |
|
(9,213 |
) |
|
|
|
|
(7,892 |
) |
|
|
|
| Share-based compensation expenses |
|
234 |
|
|
|
|
|
93 |
|
|
|
|
| Inventory adjustments |
|
(24 |
) |
|
|
|
|
- |
|
|
|
|
| Change in product inventory |
|
(558 |
) |
|
|
|
|
1,726 |
|
|
|
|
| Royalties |
|
- |
|
|
|
|
|
41 |
|
|
|
|
| Depreciation and amortization3 |
|
26,594 |
|
|
|
|
|
25,462 |
|
|
|
|
| Cost of sales4 |
|
104,617 |
|
|
|
|
|
95,360 |
|
|
|
|
1 Per ounce of gold produced.
2 By-product credits are computed as revenue per financial statements, amortization of deferred revenue and pricing and volume adjustments. For more information, please see the realized price reconciliation table on page 28 of this MD&A.
3 Depreciation is based on concentrate sold.
4 As per consolidated interim financial statements.
| Manitoba |
|
Three months ended |
|
| |
|
Mar. 31, 2024 |
|
|
Mar. 31, 2023 |
|
| Sustaining cash cost per ounce of gold produced |
|
$000s |
|
|
$/oz |
|
|
$000s |
|
|
$/oz |
|
| Gold cash cost, net of by-product credits |
|
41,850 |
|
|
736 |
|
|
33,799 |
|
|
938 |
|
| Cash sustaining capital expenditures |
|
12,173 |
|
|
214 |
|
|
14,304 |
|
|
397 |
|
| Royalties |
|
- |
|
|
- |
|
|
41 |
|
|
1 |
|
| Sustaining cash cost per ounce of gold produced |
|
54,023 |
|
|
950 |
|
|
48,144 |
|
|
1,336 |
|
Combined Unit Cost
Combined unit cost ("unit cost") and zinc plant unit cost is a non-IFRS measure that management uses as a key performance indicator to assess the performance of our mining and milling operations. Combined unit cost is calculated by dividing the cost of sales by mill throughput. This measure is utilized by management and investors to assess our cost structure and margins and compare it to similar information provided by other companies in our industry. Unlike cash cost, this measure is not impacted by variability in by-product commodity prices since there are no by-product deductions; costs associated with profit-sharing and similar costs are excluded because of their correlation to external metal prices. In addition, the unit costs are reported in the functional currency of the operation which minimizes the impact of foreign currency fluctuations. In all, the unit cost measures provide an alternative perspective on operating cost performance with minimal impact from external market prices.
The tables below present a detailed combined unit cost for the Peru and Manitoba business units, and reconciliations between these measures to the most comparable IFRS measures of cost of sales for the three months ended March 31, 2024 and 2023.
| Peru |
|
Three months ended |
|
| (in thousands except unit cost per tonne) |
|
Mar. 31,
2024 |
|
|
Mar. 31,
2023 |
|
| Combined unit cost per tonne processed |
| Mining |
|
29,220 |
|
|
26,786 |
|
| Milling |
|
43,624 |
|
|
46,191 |
|
| G&A1 |
|
23,092 |
|
|
16,466 |
|
| Less: Other G&A2 |
|
(7,688 |
) |
|
(1,539 |
) |
| Unit cost |
|
88,248 |
|
|
87,904 |
|
| Tonnes ore milled |
|
8,078 |
|
|
7,664 |
|
| Combined unit cost per tonne |
|
10.92 |
|
|
11.47 |
|
| Reconciliation to IFRS: |
|
|
|
|
|
|
| Unit cost |
|
88,248 |
|
|
87,904 |
|
| Freight & other |
|
16,580 |
|
|
12,427 |
|
| Other G&A |
|
7,688 |
|
|
1,539 |
|
| Share-based compensation expenses |
|
116 |
|
|
(14 |
) |
| Change in product inventory |
|
14,077 |
|
|
(11,135 |
) |
| Royalties |
|
2,118 |
|
|
665 |
|
| Depreciation and amortization |
|
71,030 |
|
|
41,960 |
|
| Cost of sales3 |
|
199,857 |
|
|
133,346 |
|
1 G&A as per cash cost reconciliation above.
2 Other G&A primarily includes profit sharing costs.
3 As per consolidated interim financial statements.
| Manitoba |
|
Three months ended |
|
| (in thousands except tonnes ore milled and unit cost per tonne) |
|
Mar. 31,
2024 |
|
|
Mar. 31,
2023 |
|
| Combined unit cost per tonne processed |
| Mining |
|
44,360 |
|
|
37,752 |
|
| Milling |
|
16,476 |
|
|
14,848 |
|
| G&A1 |
|
11,346 |
|
|
10,089 |
|
| Less: Other G&A related to profit sharing costs |
|
(4,131 |
) |
|
(1,139 |
) |
| Unit cost |
|
68,051 |
|
|
61,550 |
|
| USD/CAD implicit exchange rate |
|
1.35 |
|
|
1.35 |
|
| Unit cost - C$ |
|
91,748 |
|
|
83,193 |
|
| Tonnes ore milled |
|
389,767 |
|
|
385,661 |
|
| Combined unit cost per tonne - C$ |
|
235 |
|
|
216 |
|
| Reconciliation to IFRS: |
|
|
|
|
|
|
| Unit cost |
|
68,051 |
|
|
61,550 |
|
| Freight & other |
|
6,189 |
|
|
5,349 |
|
| Other G&A related to profit sharing |
|
4,131 |
|
|
1,139 |
|
| Share-based compensation expenses |
|
234 |
|
|
93 |
|
| Inventory adjustments |
|
(24 |
) |
|
- |
|
| Change in product inventory |
|
(558 |
) |
|
1,726 |
|
| Royalties |
|
- |
|
|
41 |
|
| Depreciation and amortization |
|
26,594 |
|
|
25,462 |
|
| Cost of sales2 |
|
104,617 |
|
|
95,360 |
|
1 G&A as per cash cost reconciliation above.
2 As per consolidated interim financial statements.
| British Columbia4 |
|
Three months ended |
|
| (in thousands except unit cost per tonne) |
|
Mar. 31, 2024 |
|
| Combined unit cost per tonne processed |
| Mining |
|
28,553 |
|
| Milling |
|
23,374 |
|
| G&A1 |
|
3,897 |
|
| Unit cost |
|
55,824 |
|
| USD/CAD implicit exchange rate |
|
1.35 |
|
| Unit cost - C$ |
|
75,282 |
|
| Tonnes ore milled |
|
3,180 |
|
| Combined unit cost per tonne C$ |
|
23.67 |
|
| Reconciliation to IFRS: |
|
|
|
| Unit cost |
|
55,824 |
|
| Freight & other |
|
4,293 |
|
| Share-based compensation expenses |
|
5 |
|
| Change in product inventory |
|
(3,965 |
) |
| Royalties |
|
755 |
|
| Depreciation and amortization |
|
11,649 |
|
| Cost of sales3 |
|
68,561 |
|
1 G&A as per cash cost reconciliation above.
2 Other G&A primarily includes profit sharing costs.
3 As per consolidated interim financial statements.
4 Copper Mountain mine results are states at 100%. Hudbay owns 75% of Copper Mountain mine. As Copper Mountain was acquired on June 20, 2023, there were no comparative figures for the three months ended March 31, 2023.
ACCOUNTING CHANGES AND CRITICAL ESTIMATES
New standards and interpretations adopted
For information on new standards and interpretations adopted, refer to note 3 of our March 31, 2024 consolidated interim financial statements.
Estimates and judgements
The preparation of the consolidated interim financial statements in accordance with IFRS requires us to make judgements, estimates and assumptions that affect the application of accounting policies, reported amounts of assets and liabilities, disclosure of contingent assets and liabilities at the date of the consolidated interim financial statements, and reported amounts of revenue and expenses during the reporting period. Actual results may differ from these estimates.
We review these estimates and underlying assumptions on an ongoing basis based on our experience and other factors, including expectations of future events that we believe to be reasonable under the circumstances. Revisions to accounting estimates are recognized in the period in which the estimates are revised and in any future periods affected. Certain accounting estimates and judgements have been identified as being "critical" to the presentation of our financial condition and results of operations because they require us to make subjective and/or complex judgments about matters that are inherently uncertain; or there is a reasonable likelihood that materially different amounts could be reported under different conditions or using different assumptions and estimates.
For more information on judgements and estimates, refer to note 2 of our March 31, 2024 consolidated interim financial statements.
CHANGES IN INTERNAL CONTROL OVER FINANCIAL REPORTING
Management is responsible for establishing and maintaining adequate internal control over financial reporting ("ICFR"). ICFR is designed to provide reasonable assurance regarding the reliability of financial reporting and the preparation of consolidated interim financial statements for external purposes in accordance with IFRS.
Limitation on Scope of Design
Management has determined to limit the scope of design of disclosure controls and procedures ("DC&P") and ICFR to exclude controls, policies and procedures of Copper Mountain, which Hudbay acquired on June 20, 2023. This scope of limitation is in accordance with section 3.3(1)(b) of NI 52-109 and SEC staff guidance, which allows for an issuer to limit the design of DC&P or ICFR to exclude a business that the issuer acquired not more than 365 days before the end of the financial period to which the Chief Executive Officer's and Chief Financial Officer's certification of interim filings relate.
Other than related to the aforementioned acquisition of Copper Mountain, we did not make any changes to ICFR during the three months ended March 31, 2024 that materially affected or are reasonably likely to materially affect our ICFR.
NOTES TO READER
Forward-Looking Information
This MD&A contains forward-looking information within the meaning of applicable Canadian and United States securities legislation. All information contained in this MD&A, other than statements of current and historical fact, is forward-looking information. Often, but not always, forward-looking information can be identified by the use of words such as "plans", "expects", "budget", "guidance", "scheduled", "estimates", "forecasts", "strategy", "target", "intends", "objective", "goal", "understands", "anticipates" and "believes" (and variations of these or similar words) and statements that certain actions, events or results "may", "could", "would", "should", "might" "occur" or "be achieved" or "will be taken" (and variations of these or similar expressions). All of the forward-looking information in this MD&A is qualified by this cautionary note.
Forward-looking information includes, but is not limited to, statements with respect to our production, cost and capital and exploration expenditure guidance, expectations regarding reductions in discretionary spending and capital expenditures, our ability to stabilize and optimize the Copper Mountain mine operation, and achieve operating synergies, the fleet production ramp up plan and the accelerated stripping strategies at the Copper Mountain site, our ability to complete business integration activities at the Copper Mountain mine, the estimated timelines and pre-requisites for sanctioning the Copper World project and the pursuit of a potential minority joint venture partner, expectations regarding the permitting requirements for the Copper World project (including expected timing for receipt of such applicable permits), the expected benefits of Manitoba growth initiatives, including the advancement of and timeline for the development and exploration drift at the 1901 deposit; the benefits and results of the option agreement entered into with Marubeni Corporation, our future deleveraging strategies and our ability to deleverage and repay debt as needed, expectations regarding our cash balance and liquidity, our ability to increase the mining rate at Lalor, the anticipated benefits from completing the Stall recovery improvement program, expectations regarding the ability to conduct exploration work and execute on exploration programs on its properties and to advance related drill plans, the advancement of the exploration program at Maria Reyna and Caballito and the status of the related drill permit application process, the ability to continue mining higher-grade ore in the Pampacancha pit and our expectations resulting therefrom, expectations regarding our ability to further reduce greenhouse gas emissions, our evaluation and assessment of opportunities to reprocess tailings using various metallurgical technologies, expectations regarding the prospective nature of the Maria Reyna and Caballito properties, the anticipated impact of brownfield and greenfield growth projects on our performance, anticipated expansion opportunities and extension of mine life in Snow Lake and our ability to find a new anchor deposit near our Snow Lake operations, anticipated future drill programs and exploration activities and any results expected therefrom, anticipated mine plans, anticipated metals prices and the anticipated sensitivity of our financial performance to metals prices, events that may affect our operations and development projects, anticipated cash flows from operations and related liquidity requirements, the anticipated effect of external factors on revenue, such as commodity prices, estimation of mineral reserves and resources, mine life projections, reclamation costs, economic outlook, government regulation of mining operations, and business and acquisition strategies. Forward-looking information is not, and cannot be, a guarantee of future results or events. Forward-looking information is based on, among other things, opinions, assumptions, estimates and analyses that, while considered reasonable by us at the date the forward-looking information is provided, inherently are subject to significant risks, uncertainties, contingencies and other factors that may cause actual results and events to be materially different from those expressed or implied by the forward-looking information.
The material factors or assumptions that we identified and were applied by us in drawing conclusions or making forecasts or projections set out in the forward-looking information include, but are not limited to:
- the ability to achieve production, cost and capital and exploration expenditure guidance;
- the ability to achieve discretionary spending reductions without impacting operations;
- no significant interruptions to our operations due to social or political unrest in the regions we operate, including the navigation of the complex political and social environment in Peru;
- no interruptions to our plans for advancing the Copper World project, including with respect to timely receipt of applicable permits and the pursuit of a potential joint venture partner;
- our ability to successfully complete the integration and optimization of the Copper Mountain operations, achieve operating synergies and develop and maintain good relations with key stakeholders;
- the ability to execute on its exploration plans and to advance related drill plans;
- the ability to advance the exploration program at Maria Reyna and Caballito;
- the success of mining, processing, exploration and development activities;
- the scheduled maintenance and availability of our processing facilities;
- the accuracy of geological, mining and metallurgical estimates;
- anticipated metals prices and the costs of production;
- the supply and demand for metals we produce;
- the supply and availability of all forms of energy and fuels at reasonable prices;
- no significant unanticipated operational or technical difficulties;
- no significant interruptions to operations due to adverse effects from extreme weather events, including the current forest fire in the Flin Flon region and potential seasonal forest fires that may affect the regions in which we operate;
- the execution of our business and growth strategies, including the success of our strategic investments and initiatives;
- the availability of additional financing, if needed;
- the ability to deleverage and repay debt as needed;
- the ability to complete project targets on time and on budget and other events that may affect our ability to develop our projects;
- the timing and receipt of various regulatory and governmental approvals;
- the availability of personnel for our exploration, development and operational projects and ongoing employee relations;
- maintaining good relations with the employees at our operations;
- maintaining good relations with the labour unions that represent certain of our employees in Manitoba and Peru;
- maintaining good relations with the communities in which we operate, including the neighbouring Indigenous communities and local governments;
- no significant unanticipated challenges with stakeholders at our various projects;
- no significant unanticipated events or changes relating to regulatory, environmental, health and safety matters;
- no contests over title to our properties, including as a result of rights or claimed rights of Indigenous peoples or challenges to the validity of our unpatented mining claims;
- the timing and possible outcome of pending litigation and no significant unanticipated litigation;
- certain tax matters, including, but not limited to current tax laws and regulations, changes in taxation policies and the refund of certain value added taxes from the Canadian and Peruvian governments; and
- no significant and continuing adverse changes in general economic conditions or conditions in the financial markets (including commodity prices and foreign exchange rates).
The risks, uncertainties, contingencies and other factors that may cause actual results to differ materially from those expressed or implied by the forward-looking information may include, but are not limited to, risks related to the ongoing business integration of Copper Mountain and the process for designing, implementing and maintaining effective internal controls for Copper Mountain the failure to effectively complete the integration and optimization of the Copper Mountain operations, or to achieve anticipated operating synergies, political and social risks in the regions we operate, including the navigation of the complex political and social environment in Peru, risks generally associated with the mining industry and the current geopolitical environment, including future commodity prices, currency and interest rate fluctuations, energy and consumable prices, supply chain constraints and general cost escalation in the current inflationary environment, risks related to the renegotiation of collective bargaining agreements with the labour unions representing certain of our employees in Manitoba and Peru uncertainties related to the development and operation of our projects, the risk of an indicator of impairment or impairment reversal relating to a material mineral property, risks related to the Copper World project, including in relation to permitting, project delivery and financing risks, risks related to the Lalor mine plan, including the ability to convert inferred mineral resource estimates to higher confidence categories, dependence on key personnel and employee and union relations, risks related to political or social instability, unrest or change, risks in respect of Indigenous and community relations, rights and title claims, risks related to extreme weather events, including risks arising from the current forest fire in the Flin Flon region, potential seasonal forest fires that may affect the regions in which we operate and other severe storms, operational risks and hazards, including the cost of maintaining and upgrading our tailings management facilities and any unanticipated environmental, industrial and geological events and developments and the inability to insure against all risks, failure of plant, equipment, processes, transportation and other infrastructure to operate as anticipated, compliance with government and environmental regulations, including permitting requirements and anti-bribery legislation, depletion of our reserves, volatile financial markets and interest rates that may affect our ability to obtain additional financing on acceptable terms, the failure to obtain required approvals or clearances from government authorities on a timely basis, uncertainties related to the geology, continuity, grade and estimates of mineral reserves and resources, and the potential for variations in grade and recovery rates, uncertain costs of reclamation activities, our ability to comply with our pension and other post-retirement obligations, our ability to abide by the covenants in our debt instruments and other material contracts, tax refunds, hedging transactions, as well as the risks discussed under the heading "Risk Factors" in our most recent Annual Information Form and under the heading "Financial Risk Management" in this MD&A, each of which is available on the company's SEDAR+ profile at www.sedarplus.ca and the company's EDGAR profile at www.sec.gov.
Should one or more risk, uncertainty, contingency or other factor materialize or should any factor or assumption prove incorrect, actual results could vary materially from those expressed or implied in the forward-looking information. Accordingly, you should not place undue reliance on forward-looking information. We do not assume any obligation to update or revise any forward-looking information after the date of this MD&A or to explain any material difference between subsequent actual events and any forward-looking information, except as required by applicable law.
Note to United States Investors
This MD&A has been prepared in accordance with the requirements of the securities laws in effect in Canada, which may differ materially from the requirements of United States securities laws applicable to U.S. issuers.
Qualified Person and NI 43-101
The technical and scientific information in this MD&A related to our material mineral projects has been approved by Olivier Tavchandjian, P. Geo, Senior Vice President, Exploration and Technical Services. Mr. Tavchandjian is a qualified person pursuant to National Instrument 43-101 - Standards of Disclosure for Mineral Projects ("NI 43-101").
For a description of the key assumptions, parameters and methods used to estimate mineral reserves and resources at Hudbay's material mineral properties, as well as data verification procedures and a general discussion of the extent to which the estimates of scientific and technical information may be affected by any known environmental, permitting, legal title, taxation, sociopolitical, marketing or other relevant factors, please see the technical reports for our material properties as filed by us on SEDAR+ at www.sedarplus.ca and EDGAR at www.sec.gov.
SUMMARY OF HISTORICAL RESULTS
The following unaudited tables set out a summary of quarterly and annual results for the Company.
|
|
|
Q1 2024
|
2023 4
|
Q4 2023
|
Q3 2023
|
Q2 2023
|
Q1 2023
|
2022 4
|
Q4 2022
|
Q3 2022
|
Q2 2022
|
Q1 2022
|
|
Consolidated Financial Condition ($000s)
|
|
Cash
|
|
$284,385
|
$249,794
|
$249,794
|
$245,217
|
$179,734
|
$255,563
|
$225,665
|
$225,665
|
$286,117
|
$258,556
|
$213,359
|
|
Total long-term debt
|
|
1,278,587
|
1,287,536
|
1,287,536
|
1,377,443
|
1,370,682
|
1,225,023
|
1,184,162
|
1,184,162
|
1,183,237
|
1,182,143
|
1,181,119
|
|
Net debt1
|
|
994,202
|
1,037,742
|
1,037,742
|
1,132,226
|
1,190,948
|
969,460
|
958,497
|
958,497
|
897,120
|
923,587
|
967,760
|
|
Consolidated Financial Performance ($000s except per share amounts)
|
|
Revenue
|
|
$524,989
|
$1,690,030
|
$602,189
|
$480,456
|
$312,166
|
$295,219
|
$1,461,440
|
$321,196
|
$346,171
|
$415,454
|
$378,619
|
|
Cost of sales
|
|
373,035
|
1,297,469
|
405,433
|
374,057
|
289,273
|
228,706
|
1,184,552
|
251,520
|
313,741
|
325,940
|
293,351
|
|
Earnings (loss) before tax
|
|
67,750
|
151,830
|
80,982
|
84,149
|
(30,731)
|
17,430
|
95,815
|
(14,287)
|
(263)
|
21,504
|
88,861
|
|
Earnings (loss)
|
|
18,535
|
69,543
|
33,528
|
45,490
|
(14,932)
|
5,457
|
70,382
|
(17,441)
|
(8,135)
|
32,143
|
63,815
|
|
Basic and diluted earnings (loss) per share
|
$0.05
|
$0.22
|
$0.10
|
$0.13
|
$(0.05)
|
$0.02
|
$0.27
|
$(0.07)
|
$(0.03)
|
$0.12
|
$0.24
|
|
Adjusted earnings (loss) per share 1
|
$0.16
|
$0.23
|
$0.20
|
$0.07
|
$(0.07)
|
$0.00
|
$0.10
|
$0.01
|
$(0.05)
|
$0.12
|
$0.02
|
|
Operating cash flow before change in non-cash working capital
|
147,539
|
569,994
|
246,528
|
181,980
|
55,878
|
85,608
|
391,729
|
109,148
|
81,617
|
123,911
|
77,053
|
|
Adjusted EBITDA (in $ millions) 1
|
214.2
|
647.8
|
274.4
|
190.7
|
81.2
|
101.9
|
475.9
|
124.7
|
99.3
|
141.4
|
110.2
|
|
Consolidated Operational Performance
|
|
|
|
|
Contained metal in concentrate and doré produced 2
|
|
|
|
|
|
|
Copper
|
tonnes
|
34,749
|
131,691
|
45,450
|
41,964
|
21,715
|
22,562
|
104,173
|
29,305
|
24,498
|
25,668
|
24,702
|
|
Gold
|
ounces
|
90,392
|
310,429
|
112,776
|
101,417
|
48,996
|
47,240
|
219,700
|
53,920
|
53,179
|
58,645
|
53,956
|
|
Silver
|
ounces
|
947,917
|
3,575,234
|
1,197,082
|
1,063,032
|
612,310
|
702,809
|
3,161,294
|
795,015
|
717,069
|
864,853
|
784,357
|
|
Zinc
|
tonnes
|
8,798
|
34,642
|
5,747
|
10,291
|
8,758
|
9,846
|
55,381
|
6,326
|
9,750
|
17,053
|
22,252
|
|
Molybdenum
|
tonnes
|
397
|
1,566
|
397
|
466
|
414
|
289
|
1,377
|
344
|
437
|
390
|
207
|
|
Payable metal in concentrate and doré sold
|
|
|
|
|
|
|
|
Copper
|
tonnes
|
33,608
|
124,996
|
44,006
|
39,371
|
23,078
|
18,541
|
94,473
|
25,415
|
24,799
|
23,650
|
20,609
|
|
Gold
|
ounces
|
108,081
|
276,893
|
104,840
|
74,799
|
47,533
|
49,720
|
213,415
|
47,256
|
66,932
|
50,884
|
48,343
|
|
Silver
|
ounces
|
1,068,848
|
3,145,166
|
1,048,877
|
748,955
|
805,448
|
541,884
|
2,978,485
|
559,306
|
816,416
|
738,171
|
864,591
|
|
Zinc 3
|
tonnes
|
6,119
|
28,779
|
7,385
|
7,125
|
8,641
|
5,628
|
59,043
|
8,230
|
12,714
|
20,793
|
17,306
|
|
Molybdenum
|
tonnes
|
415
|
1,462
|
468
|
426
|
314
|
254
|
1,352
|
421
|
511
|
208
|
213
|
|
Cash cost 1
|
$/lb
|
$0.16
|
$0.80
|
$0.16
|
$1.10
|
$1.60
|
$0.85
|
$0.86
|
$1.08
|
$0.58
|
$0.65
|
$1.11
|
|
Sustaining cash cost 1
|
$/lb
|
$1.03
|
$1.72
|
$1.09
|
$1.89
|
$2.73
|
$1.83
|
$2.07
|
$2.21
|
$1.91
|
$1.87
|
$2.29
|
|
All-in sustaining cash cost 1
|
$/lb
|
$1.32
|
$1.92
|
$1.31
|
$2.04
|
$2.98
|
$2.07
|
$2.26
|
$2.41
|
$2.16
|
$1.93
|
$2.54
|
1Net debt, adjusted earnings (loss) per share, adjusted EBITDA, cash cost, sustaining cash cost and all-in sustaining cash cost per pound of copper produced, net of by-product credits, are non-IFRS financial performance measures with no standardized definition under IFRS. For further information and a detailed reconciliation, please see discussion under the "Non-IFRS Financial Performance Measures" section of this MD&A. The above table sets forth selected non-IFRS financial performance measures for each of our nine most recently completed quarters and three most recently completed years; detailed reconciliations for non-comparable prior periods can be found in our MD&A for these prior periods in the "Non-IFRS Financial Performance Measures" section of these documents.
2 Metal reported in concentrate is prior to deductions associated with smelter contract terms.
3 Includes refined zinc metal sold.
4 Annual consolidated results may not calculate based on amounts presented in this table due to rounding.
|
|
|
Q1 2024
|
2023 5
|
Q4 2023
|
Q3 2023
|
Q2 2023
|
Q1 2023
|
2022 5
|
Q4 2022
|
Q3 2022
|
Q2 2022
|
Q1 2022
|
|
Peru Operations
|
|
|
|
|
|
|
|
|
|
|
Constancia ore mined1
|
tonnes
|
2,559,547
|
9,265,954
|
973,176
|
1,242,198
|
3,647,399
|
3,403,181
|
25,840,435
|
5,614,918
|
6,300,252
|
7,017,114
|
6,908,151
|
|
Copper
|
%
|
0.31
|
0.32
|
0.30
|
0.30
|
0.31
|
0.34
|
0.35
|
0.40
|
0.36
|
0.33
|
0.32
|
|
Gold
|
g/tonne
|
0.04
|
0.04
|
0.04
|
0.04
|
0.04
|
0.04
|
0.04
|
0.04
|
0.05
|
0.04
|
0.04
|
|
Silver
|
g/tonne
|
2.79
|
2.53
|
2.26
|
2.91
|
2.49
|
2.52
|
3.40
|
3.48
|
3.38
|
3.53
|
3.22
|
|
Molybdenum
|
%
|
0.01
|
0.01
|
0.01
|
0.01
|
0.01
|
0.01
|
0.01
|
0.01
|
0.01
|
0.01
|
0.01
|
|
Pampacancha ore mined1
|
tonnes
|
2,214,354
|
14,756,416
|
5,556,613
|
5,894,013
|
2,408,495
|
897,295
|
8,319,250
|
3,771,629
|
2,488,928
|
1,211,387
|
847,306
|
|
Copper
|
%
|
0.56
|
0.51
|
0.56
|
0.53
|
0.36
|
0.49
|
0.33
|
0.37
|
0.29
|
0.29
|
0.27
|
|
Gold
|
g/tonne
|
0.32
|
0.33
|
0.32
|
0.30
|
0.34
|
0.52
|
0.29
|
0.29
|
0.23
|
0.28
|
0.43
|
|
Silver
|
g/tonne
|
4.64
|
4.28
|
4.84
|
4.22
|
2.81
|
5.12
|
4.06
|
3.84
|
4.30
|
4.25
|
4.06
|
|
Molybdenum
|
%
|
0.02
|
0.01
|
0.01
|
0.02
|
0.02
|
0.01
|
0.01
|
0.01
|
0.01
|
0.01
|
0.01
|
|
Strip Ratio
|
|
1.95
|
1.51
|
1.26
|
1.36
|
1.74
|
1.84
|
1.13
|
0.97
|
1.26
|
1.22
|
1.10
|
|
Ore milled
|
tonnes
|
8,077,962
|
30,720,929
|
7,939,044
|
7,895,109
|
7,223,048
|
7,663,728
|
30,522,294
|
7,795,735
|
7,742,020
|
7,770,706
|
7,213,833
|
|
Copper
|
%
|
0.36
|
0.39
|
0.48
|
0.43
|
0.31
|
0.33
|
0.34
|
0.41
|
0.34
|
0.32
|
0.31
|
|
Gold
|
g/tonne
|
0.15
|
0.16
|
0.25
|
0.21
|
0.09
|
0.08
|
0.09
|
0.12
|
0.08
|
0.09
|
0.08
|
|
Silver
|
g/tonne
|
3.48
|
3.62
|
4.20
|
3.75
|
2.78
|
3.69
|
3.58
|
3.93
|
3.48
|
3.64
|
3.26
|
|
Molybdenum
|
%
|
0.01
|
0.01
|
0.01
|
0.02
|
0.01
|
0.01
|
0.01
|
0.01
|
0.01
|
0.01
|
0.01
|
|
Copper recovery
|
%
|
84.9
|
84.2
|
87.4
|
85.2
|
80.0
|
81.7
|
85.0
|
85.1
|
84.5
|
85.0
|
85.3
|
|
Gold recovery
|
%
|
73.4
|
71.8
|
77.6
|
74.8
|
61.1
|
56.8
|
63.6
|
69.6
|
61.9
|
60.3
|
59.8
|
|
Silver recovery
|
%
|
70.7
|
70.0
|
78.0
|
73.2
|
65.1
|
60.7
|
65.7
|
66.5
|
65.2
|
64.2
|
66.9
|
|
Molybdenum recovery
|
%
|
43.2
|
35.8
|
33.6
|
37.2
|
40.5
|
34.8
|
34.8
|
37.7
|
41.0
|
38.8
|
21.1
|
|
Contained metal in concentrate
|
|
|
|
|
|
|
|
|
|
Copper
|
tonnes
|
24,576
|
100,487
|
33,207
|
29,081
|
17,682
|
20,517
|
89,395
|
27,047
|
22,302
|
20,880
|
19,166
|
|
Gold
|
ounces
|
29,144
|
114,218
|
49,418
|
40,596
|
12,998
|
11,206
|
58,229
|
20,860
|
12,722
|
13,858
|
10,789
|
|
Silver
|
ounces
|
639,718
|
2,505,229
|
836,208
|
697,211
|
419,642
|
552,167
|
2,309,352
|
655,257
|
564,299
|
584,228
|
505,568
|
|
Molybdenum
|
tonnes
|
397
|
1,566
|
397
|
466
|
414
|
289
|
1,377
|
344
|
437
|
390
|
207
|
|
Payable metal sold
|
|
|
|
|
|
|
|
|
|
|
|
|
|
Copper
|
tonnes
|
23,754
|
96,213
|
31,200
|
27,490
|
21,207
|
16,316
|
79,805
|
23,789
|
20,718
|
18,473
|
16,825
|
|
Gold
|
ounces
|
42,677
|
97,176
|
38,114
|
32,757
|
14,524
|
11,781
|
49,968
|
15,116
|
11,970
|
8,430
|
14,452
|
|
Silver
|
ounces
|
753,707
|
2,227,419
|
703,679
|
460,001
|
671,532
|
392,207
|
2,045,678
|
411,129
|
513,470
|
484,946
|
636,133
|
|
Molybdenum
|
tonnes
|
415
|
1,462
|
468
|
426
|
314
|
254
|
1,352
|
421
|
511
|
208
|
213
|
|
Unit cost 2,3,4
|
$/tonne
|
$10.92
|
$12.47
|
$12.24
|
$12.20
|
$14.07
|
$11.47
|
$12.78
|
$13.64
|
$13.06
|
$12.02
|
$12.37
|
|
Peru cash cost3
|
$/lb
|
$0.43
|
$1.07
|
$0.54
|
$0.83
|
$2.14
|
$1.36
|
$1.58
|
$1.34
|
$1.68
|
$1.82
|
$1.54
|
|
Peru sustaining cash cost3
|
$/lb
|
$1.06
|
$1.81
|
$1.21
|
$1.51
|
$3.06
|
$2.12
|
$2.35
|
$2.09
|
$2.46
|
$2.62
|
$2.27
|
1 Reported tonnes and grade for ore mined are estimates based on mine plan assumptions and may not fully reconcile to ore milled.
2 Reflects combined mine, mill and general and administrative ("G&A") costs per tonne of ore milled. Reflects the deduction of expected capitalized stripping costs.
3 Combined unit costs, cash cost, and sustaining cash cost per pound of copper produced, net of by-product credits, are non-IFRS financial performance measures with no standardized definition under IFRS. For further information and a detailed reconciliation, please see the discussion under the "Non-IFRS Financial Performance Measures" section of this MD&A. The above table sets forth selected non-IFRS financial performance measures for each of our nine most recently completed quarters and three most recently completed years; detailed reconciliations for non-comparable prior periods can be found in our MD&A for these prior periods in the "Non-IFRS Financial Performance Measures" section of these documents.
4 2022 combined unit costs exclude COVID-19 related costs.
5 Annual consolidated results may not calculate based on amounts presented in this table due to rounding.
|
|
|
Q1 2024
|
2023 1
|
Q4 2023
|
Q3 2023
|
Q2 2023
|
Q1 2023
|
2022 1
|
Q4 2022
|
Q3 2022
|
Q2 2022
|
Q1 2022
|
|
Manitoba Operations
|
|
|
|
|
|
|
|
|
|
|
|
|
|
Lalor ore mined
|
tonnes
|
407,708
|
1,526,729
|
372,384
|
367,491
|
413,255
|
373,599
|
1,516,203
|
369,453
|
347,345
|
412,653
|
386,752
|
|
Copper
|
%
|
0.84
|
0.86
|
1.04
|
1.02
|
0.81
|
0.57
|
0.73
|
0.73
|
0.71
|
0.70
|
0.80
|
|
Zinc
|
%
|
2.92
|
3.00
|
2.20
|
3.31
|
3.14
|
3.32
|
3.14
|
2.17
|
3.27
|
3.06
|
4.06
|
|
Gold
|
g/tonne
|
4.84
|
4.74
|
5.92
|
5.08
|
4.07
|
3.96
|
4.00
|
4.00
|
4.57
|
3.73
|
3.76
|
|
Silver
|
g/tonne
|
23.44
|
24.51
|
28.92
|
27.80
|
23.27
|
18.24
|
21.96
|
19.37
|
21.27
|
23.95
|
22.94
|
|
777 ore mined
|
tonnes
|
-
|
-
|
-
|
-
|
-
|
-
|
484,355
|
-
|
-
|
226,286
|
258,069
|
|
Copper
|
%
|
-
|
-
|
-
|
-
|
-
|
-
|
1.12
|
-
|
-
|
1.03
|
1.19
|
|
Zinc
|
%
|
-
|
-
|
-
|
-
|
-
|
-
|
3.83
|
-
|
-
|
3.51
|
4.12
|
|
Gold
|
g/tonne
|
-
|
-
|
-
|
-
|
-
|
-
|
1.66
|
-
|
-
|
1.62
|
1.69
|
|
Silver
|
g/tonne
|
-
|
-
|
-
|
-
|
-
|
-
|
20.85
|
-
|
-
|
20.63
|
21.05
|
|
Stall Concentrator:
|
|
|
|
|
|
|
|
Ore milled
|
tonnes
|
219,358
|
965,567
|
228,799
|
255,516
|
238,633
|
242,619
|
968,638
|
204,350
|
229,746
|
261,417
|
273,125
|
|
Copper
|
%
|
0.64
|
0.74
|
0.73
|
0.77
|
0.85
|
0.59
|
0.71
|
0.61
|
0.67
|
0.73
|
0.81
|
|
Zinc
|
%
|
4.54
|
4.36
|
3.20
|
4.88
|
4.47
|
4.81
|
4.70
|
3.43
|
4.82
|
4.45
|
5.78
|
|
Gold
|
g/tonne
|
3.07
|
3.45
|
4.22
|
3.70
|
3.12
|
2.78
|
2.86
|
2.50
|
2.81
|
2.95
|
3.07
|
|
Silver
|
g/tonne
|
24.46
|
24.19
|
28.63
|
28.82
|
22.15
|
17.14
|
22.81
|
19.24
|
20.98
|
26.31
|
23.68
|
|
Copper recovery
|
%
|
91.7
|
90.4
|
92.0
|
93.9
|
88.5
|
87.0
|
87.2
|
89.0
|
85.8
|
88.0
|
86.7
|
|
Zinc recovery
|
%
|
88.4
|
82.2
|
78.5
|
82.6
|
82.2
|
84.4
|
86.6
|
90.1
|
88.0
|
84.3
|
85.7
|
|
Gold recovery
|
%
|
68.0
|
64.8
|
67.5
|
67.8
|
59.9
|
61.9
|
58.0
|
62.4
|
61.3
|
54.6
|
55.8
|
|
Silver recovery
|
%
|
59.8
|
61.4
|
61.8
|
64.9
|
60.3
|
56.3
|
56.8
|
56.6
|
55.7
|
56.1
|
58.6
|
|
New Britannia Concentrator:
|
|
|
|
|
|
|
|
Ore milled
|
tonnes
|
170,409
|
596,912
|
165,038
|
146,927
|
141,905
|
143,042
|
542,269
|
141,142
|
132,362
|
144,589
|
124,176
|
|
Copper
|
%
|
1.13
|
1.03
|
1.46
|
1.22
|
0.77
|
0.61
|
0.81
|
0.91
|
0.72
|
0.73
|
0.86
|
|
Zinc
|
%
|
0.82
|
0.84
|
0.85
|
0.90
|
0.85
|
0.76
|
0.80
|
0.67
|
0.73
|
0.94
|
0.85
|
|
Gold
|
g/tonne
|
7.03
|
6.76
|
8.03
|
6.93
|
5.82
|
6.05
|
6.28
|
6.11
|
7.70
|
5.69
|
5.63
|
|
Silver
|
g/tonne
|
21.60
|
25.11
|
27.97
|
23.88
|
25.79
|
22.39
|
20.97
|
22.09
|
20.11
|
19.77
|
22.03
|
|
Copper recovery
|
%
|
96.2
|
93.3
|
91.6
|
97.4
|
91.2
|
91.7
|
90.7
|
89.3
|
92.3
|
92.4
|
89.0
|
|
Gold recovery - concentrate and doré
|
%
|
88.6
|
88.6
|
89.0
|
88.8
|
88.6
|
87.9
|
-
|
-
|
-
|
-
|
-
|
|
Silver recovery - concentrate and doré
|
%
|
82.0
|
81.4
|
83.2
|
82.0
|
79.6
|
80.9
|
-
|
-
|
-
|
-
|
-
|
|
Flin Flon Concentrator:
|
|
|
|
|
|
|
|
|
|
|
|
|
Ore milled
|
tonnes
|
-
|
-
|
-
|
-
|
-
|
-
|
497,344
|
-
|
-
|
243,312
|
254,032
|
|
Copper
|
%
|
-
|
-
|
-
|
-
|
-
|
-
|
1.11
|
-
|
-
|
1.02
|
1.20
|
|
Zinc
|
%
|
-
|
-
|
-
|
-
|
-
|
-
|
3.87
|
-
|
-
|
3.60
|
4.13
|
|
Gold
|
g/tonne
|
-
|
-
|
-
|
-
|
-
|
-
|
1.67
|
-
|
-
|
1.64
|
1.70
|
|
Silver
|
g/tonne
|
-
|
-
|
-
|
-
|
-
|
-
|
21.00
|
-
|
-
|
20.76
|
21.23
|
|
Copper recovery
|
%
|
-
|
-
|
-
|
-
|
-
|
-
|
86.7
|
-
|
-
|
85.5
|
87.6
|
|
Zinc recovery
|
%
|
-
|
-
|
-
|
-
|
-
|
-
|
83.0
|
-
|
-
|
82.9
|
83.2
|
|
Gold recovery
|
%
|
-
|
-
|
-
|
-
|
-
|
-
|
57.1
|
-
|
-
|
56.4
|
57.7
|
|
Silver recovery
|
%
|
-
|
-
|
-
|
-
|
-
|
-
|
51.8
|
-
|
-
|
51.0
|
52.5
|
1 Annual consolidated results may not calculate based on amounts presented in this table due to rounding.
|
|
|
Q1 2024
|
2023 4
|
Q4 2023
|
Q3 2023
|
Q2 2023
|
Q1 2023
|
2022 4
|
Q4 2022
|
Q3 2022
|
Q2 2022
|
Q1 2022
|
|
Manitoba Operations (continued)
|
|
|
|
|
|
|
|
|
|
|
|
|
Total Manitoba payable metal sold in concentrate and doré
|
|
|
|
|
|
|
|
|
Copper
|
tonnes
|
2,921
|
10,708
|
3,687
|
2,925
|
1,871
|
2,225
|
14,668
|
1,626
|
4,081
|
5,177
|
3,784
|
|
Zinc1
|
tonnes
|
6,119
|
28,779
|
7,385
|
7,125
|
8,641
|
5,628
|
59,043
|
8,230
|
12,714
|
20,793
|
17,306
|
|
Gold
|
ounces
|
62,003
|
171,297
|
63,635
|
36,713
|
33,009
|
37,939
|
163,447
|
32,140
|
54,962
|
42,454
|
33,891
|
|
Silver
|
ounces
|
231,841
|
728,304
|
246,757
|
197,952
|
133,916
|
149,677
|
932,807
|
148,177
|
302,946
|
253,225
|
228,458
|
|
Combined unit cost 2,3
|
C$/tonne
|
$235
|
$217
|
$216
|
$217
|
$220
|
$216
|
$195
|
$241
|
$235
|
$168
|
$176
|
|
Gold cash cost 3
|
$/oz
|
$736
|
$727
|
$434
|
$670
|
$1,097
|
$938
|
$297
|
$922
|
$216
|
$(207)
|
$416
|
|
Sustaining gold cash cost 3
|
$/oz
|
$950
|
$1,077
|
$788
|
$939
|
$1,521
|
$1,336
|
$1,091
|
$1,795
|
$1,045
|
$519
|
$1,187
|
1 Includes refined zinc metal sold.
2 Reflects combined mine, mill and G&A costs per tonne of milled ore.
3 Combined unit costs, cash cost, and sustaining cash cost per pound of copper produced, cash cost, and sustaining cash cost per ounce of gold produced, net of by-product credits, are non-IFRS financial performance measures with no standardized definition under IFRS. For further information and a detailed reconciliation, please see the discussion under the "Non-IFRS Financial Performance Measures" section of this MD&A. The above table sets forth selected non-IFRS financial performance measures for each of our nine most recently completed quarters and three most recently completed years; detailed reconciliations for non-comparable prior periods can be found in our MD&A for these prior periods in the "Non-IFRS Financial Performance Measures" section of these documents.
4 Annual consolidated results may not calculate based on amounts presented in this table due to rounding.
|
|
|
Q1 2024
|
2023 6
|
Q4 2023
|
Q3 2023
|
Q2 2023 5
|
Q1 2023
|
2022
|
Q4 2022
|
Q3 2022
|
Q2 2022
|
Q1 2022
|
|
British Columbia Operations 4
|
|
|
|
|
|
|
|
|
|
Ore mined1
|
tonnes
|
3,722
|
6,975,389
|
2,627,398
|
3,792,568
|
555,423
|
-
|
-
|
-
|
-
|
-
|
-
|
|
Strip Ratio
|
|
4.10
|
3.82
|
5.34
|
2.96
|
-
|
-
|
-
|
-
|
-
|
-
|
-
|
|
Ore milled
|
tonnes
|
3,180
|
6,862,152
|
3,261,891
|
3,158,006
|
442,255
|
-
|
-
|
-
|
-
|
-
|
-
|
|
Copper
|
%
|
0.27
|
0.35
|
0.33
|
0.36
|
0.36
|
-
|
-
|
-
|
-
|
-
|
-
|
|
Gold
|
g/tonne
|
0.07
|
0.07
|
0.06
|
0.08
|
0.08
|
-
|
-
|
-
|
-
|
-
|
-
|
|
Silver
|
g/tonne
|
1.19
|
1.36
|
1.36
|
1.40
|
1.07
|
-
|
-
|
-
|
-
|
-
|
-
|
|
Copper recovery
|
%
|
83.4
|
79.7
|
78.8
|
80.90
|
77.69
|
-
|
-
|
-
|
-
|
-
|
-
|
|
Gold recovery
|
%
|
61.8
|
55.9
|
54.1
|
56.10
|
67.90
|
-
|
-
|
-
|
-
|
-
|
-
|
|
Silver recovery
|
%
|
72.4
|
73.0
|
73.8
|
71.30
|
78.60
|
-
|
-
|
-
|
-
|
-
|
-
|
|
Contained metal in concentrate produced
|
|
|
|
|
|
|
|
|
Copper
|
tonnes
|
7,024
|
19,050
|
8,508
|
9,303
|
1,239
|
-
|
-
|
-
|
-
|
-
|
-
|
|
Gold
|
ounces
|
4,417
|
8,848
|
3,495
|
4,608
|
745
|
-
|
-
|
-
|
-
|
-
|
-
|
|
Silver
|
ounces
|
88,376
|
218,282
|
105,295
|
101,069
|
11,918
|
-
|
-
|
-
|
-
|
-
|
-
|
|
Payable metal sold
|
|
|
|
|
|
|
|
|
|
|
|
|
|
Copper
|
tonnes
|
6,933
|
18,075
|
9,119
|
8,956
|
-
|
-
|
-
|
-
|
-
|
-
|
-
|
|
Gold
|
ounces
|
3,401
|
8,420
|
3,091
|
5,329
|
-
|
-
|
-
|
-
|
-
|
-
|
-
|
|
Silver
|
ounces
|
83,300
|
189,443
|
98,441
|
91,002
|
-
|
-
|
-
|
-
|
-
|
-
|
-
|
|
Combined unit cost 2,3
|
C$/tonne
|
$23.67
|
$21.38
|
$20.90
|
$24.88
|
-
|
-
|
-
|
-
|
-
|
-
|
-
|
|
Cash cost3
|
$/lb
|
$3.49
|
$2.50
|
$2.67
|
$2.67
|
-
|
-
|
-
|
-
|
-
|
-
|
-
|
|
Sustaining cash cost3
|
$/lb
|
$4.85
|
$3.41
|
$3.93
|
$3.39
|
-
|
-
|
-
|
-
|
-
|
-
|
-
|
1 Reported tonnes and grade for ore mined are estimates based on mine plan assumptions and may not fully reconcile to ore milled.
2 Reflects combined mine, mill and general and administrative ("G&A") costs per tonne of ore milled. Reflects the deduction of expected capitalized stripping costs.
3 Combined unit costs, cash cost, and sustaining cash cost per pound of copper produced, net of by-product credits, are non-IFRS financial performance measures with no standardized definition under IFRS. For further information and a detailed reconciliation, please see the discussion under the "Non-IFRS Financial Performance Measures" section of this MD&A. The above table sets forth selected non-IFRS financial performance measures for each of our nine most recently completed quarters and three most recently completed years; detailed reconciliations for non-comparable prior periods can be found in our MD&A for these prior periods in the "Non-IFRS Financial Performance Measures" section of these documents.
4 Includes 100% of Copper Mountain mine production. Hudbay owns 75% of Copper Mountain mine.
5 Production results from Copper Mountain operations represents the period from the June 20, 2023 acquisition date through to the end of the second quarter of 2023.
6 Annual consolidated results may not calculate based on amounts presented in this table due to rounding.
 |
TSX, NYSE – HBM
2024 No. 6
|
| |
|
25 York Street, Suite 800
Toronto, Ontario
Canada M5J 2V5
tel 416 362-8181
fax 416 362-7844
hudbay.com |
News Release |
|
|
Hudbay Delivers Strong First Quarter 2024 Results
Toronto, Ontario, May 14, 2024 - Hudbay Minerals Inc. ("Hudbay" or the "company") (TSX, NYSE: HBM) today released its first quarter 2024 financial results. All amounts are in U.S. dollars, unless otherwise noted. All production and cost amounts reflect the Copper Mountain mine on a 100% basis, with Hudbay owning a 75% interest in the mine.
"We delivered another consecutive quarter of strong operational and financial performance with steady free cash flow generation and further debt reduction," said Peter Kukielski, President and Chief Executive Officer. "These results demonstrate the strength of our diversified operating base, with continued contributions from the high-grade Pampacancha deposit in Peru, better-than-planned gold production in Manitoba and benefits starting to be realized from operational stabilization efforts at the Copper Mountain mine in British Columbia. We are well on track to achieve all of our production and cost guidance metrics. Hudbay's resilient operating platform offers leading exposure to copper and unique complementary exposure to gold, which together with our quality pipeline of growth assets, provide significant upside potential for further value creation at higher copper and gold prices."
Delivered Strong First Quarter Operating and Financial Results; Production and Cost Guidance Affirmed
- Enhanced operating platform delivered consolidated copper production of 34,749 tonnes and stronger than expected gold production of 90,392 ounces in the first quarter.
- Solid operating performance was driven by continued high copper and gold grades at the Pampacancha deposit in Peru, continued high gold grades at Lalor and strong performance from the New Britannia mill in Manitoba, and the operational stabilization efforts at the Copper Mountain mine in British Columbia.
- Achieved revenue of $525.0 million and operating cash flow before change in non-cash working capital of $147.5 million in the first quarter of 2024.
- Affirmed full year 2024 consolidated copper production and cash cost guidance of 137,000 to 176,000 tonnes of copper at a cash cost of $1.05 to $1.25 per poundi and sustaining cash cost of $2.00 to $2.45 per poundi.
- Consolidated cash costi and sustaining cash costi per pound of copper produced, net of by-product creditsi, in the first quarter of 2024, were $0.16 and $1.03, respectively, consistent with strong levels achieved in the fourth quarter of 2023.
- Peru operations benefited from continued contributions from the high-grade Pampacancha satellite pit, resulting in 24,576 tonnes of copper and 29,144 ounces of gold produced in the first quarter of 2024. Peru cash cost per pound of copper produced, net of by-product creditsi, in the first quarter improved to $0.43, a 20% decrease compared to the fourth quarter of 2023.
- Manitoba operations produced 56,831 ounces of gold in the first quarter of 2024, exceeding management's quarterly cadence expectations as New Britannia continues to operate well above nameplate capacity and budgeted throughput levels. Manitoba cash cost per ounce of gold produced, net of by-product creditsi, was $736 during the first quarter of 2024 and well within guidance expectations.
- British Columbia operations produced 7,024 tonnes of copper at a cash cost per pound of copper produced, net of by-product creditsi, of $3.49 in the first quarter. Operational stabilization plans continue to be advanced at the Copper Mountain mine.
- First quarter net earnings and earnings per share were $18.5 million and $0.05, respectively. After adjusting for a non-cash gain of $5.3 million related to a quarterly revaluation of the closed site environmental reclamation provision, a $12.8 million mark-to-market adjustment loss related to share-based compensation, gold prepayment liability and strategic gold and copper hedges and a $9.0 million write-down of property, plant and equipment ("PP&E"), among other items, first quarter adjusted earningsi per share were $0.16.
- Cash and cash equivalents increased by $34.6 million to $284.4 million during the first quarter due to strong operating cash flows bolstered by higher copper and gold prices and sales volumes enabling a $43.5 million reduction in net debti during the quarter.
Operating Performance and Financial Discipline Driving Free Cash Flow and Deleveraging
- Unique copper and gold diversification provides exposure to higher copper and gold prices and attractive free cash flow generation.
- Executed on planned higher production levels and achieved continued operating and capital cost efficiencies to generate significant free cash flow in the first quarter.
- Realized strong margins by maintaining low consolidated cash cost of $0.16 per pound of copper in the first quarter while benefiting from higher copper prices, positioning the company for continued significant cash flow generation in a period of high commodity prices.
- Achieved adjusted EBITDAi of $214.2 million in the first quarter and a trailing twelve month adjusted EBITDAi of $760.5 million.
- Reduced net debti to $994.2 million during the first quarter, which, together with higher levels of adjusted EBITDAi, further improved the company's net debt to adjusted EBITDA ratioi to 1.3x compared to 1.6x at the end of 2023.
- Continued deleveraging efforts with a $10 million repayment of the revolving credit facility balance in January 2024 and an additional $10 million repayment after quarter-end in May 2024.
- Increased cash and total liquidity by $45.2 million to $618.9 million as at March 31, 2024 compared to the end of 2023.
Continued Execution of Growth Initiatives to Further Enhance Copper and Gold Exposure
- Post-acquisition plans to stabilize the Copper Mountain operations remain in progress, with a focus on mining fleet ramp-up activities, accelerated stripping and increasing mill reliability. Achieved better than planned copper recoveries of 83% in the first quarter, and stabilization benefits continued to be realized subsequent to quarter end with 83% copper recoveries and approximately 40,000 tonnes per day average mill throughput in the month of April.
- Constancia's expected mine life extended by three years to 2041 as a result of mineral reserve conversion with the addition of a further mining phase at the Constancia pit.
- The New Britannia mill achieved record throughput levels, averaging 1,870 tonnes per day in the first quarter, exceeding its original design capacity of 1,500 tonnes per day due to the successful implementation of process improvement initiatives and effective preventative maintenance measures. Received permit to increase New Britannia throughput to 2,500 tonnes per day.
- Achieved copper recoveries of approximately 92% and gold recoveries of approximately 68% at the Stall mill in the first quarter of 2024 as the company continues to benefit from the Stall mill recovery improvement project, which was completed in 2023.
- The development of an access drift to the 1901 deposit in Snow Lake remains on track and on budget. 1901 is located within 1,000 metres of the existing underground ramp access to the Lalor mine. The drift is expected to reach mineralization in late-2024, which is intended to enable confirmation of the optimal mining method and conducting drilling to further evaluate the orebody and upgrade inferred gold resources to reserves.
- Progressing the three prerequisites plan (the "3-P plan") for sanctioning Copper World with deleveraging advancing towards targeted levels and remaining key state permits expected in 2024.
- Drill permitting for highly prospective Maria Reyna and Caballito properties near Constancia continues to advance through the regulatory process with environmental impact assessment applications submitted for both properties in recent months.
- Largest annual exploration program in Snow Lake underway consisting of geophysical surveys and drill campaigns testing the newly acquired Cook Lake claims, former Rockcliff properties and near-mine exploration at Lalor.
- Advancing Flin Flon tailings reprocessing opportunities through metallurgical test work and early economic evaluation to potentially produce critical minerals and precious metals while reducing the environmental footprint.
- Entered into an option agreement with Marubeni Corporation relating to three exploration projects located near Hudbay's existing Flin Flon processing facilities.
Summary of First Quarter Results
Consolidated copper production of 34,749 tonnes in the first quarter of 2024 declined from the strong levels achieved in the fourth quarter of 2023 but was in line with mine plan expectations. Consolidated gold production of 90,392 ounces in the first quarter exceeded expectations. First quarter production benefitted from the continued mining of high copper and gold grades at the Pampacancha deposit in Peru, continued high gold grades mined at Lalor and strong performance from the New Britannia mill in Manitoba, and the operational stabilization efforts at the Copper Mountain mine in British Columbia. Full year 2024 production guidance for all metals has been affirmed.
Industry-leading consolidated cash cost per pound of copper produced, net of by-product creditsi, was $0.16 in the first quarter of 2024, consistent with the favourable levels achieved in the fourth quarter of 2023. This was primarily the result of continued high by-product credits, partially offset by higher mining costs and lower copper production. Consolidated sustaining cash cost per pound of copper produced, net of by-product creditsi, was $1.03 in the first quarter of 2024 compared to $1.09 in the fourth quarter of 2023. This improvement was primarily due to lower sustaining capital expenditures. Full year 2024 consolidated cash cost, sustaining cash cost and capitalized expenditures guidance has been affirmed.
Cash generated from operating activities in the first quarter of 2024 of $139.7 million was lower than the fourth quarter of 2023 but better than anticipated, primarily because of strong gold sales volumes and higher realized copper prices, partially offset by a $30.1 million increase in cash taxes paid mainly in Peru. Operating cash flow before change in non-cash working capital of $147.5 million also exceeded expectations due to the same reasons.
Similarly, adjusted EBITDAi of $214.2 million in the first quarter of 2024 benefited from the solid operating performance outlined above and remained comparable to the strong levels achieved in recent quarters, including $274.4 million in the fourth quarter and $190.7 million in the third quarter of 2023.
Net earnings and earnings per share in the first quarter of 2024 were $18.5 million and $0.05, respectively, compared to net earnings and earnings per share of $33.5 million and $0.10, respectively in the fourth quarter of 2023. Adjusted net earningsi and adjusted net earnings per sharei in the first quarter of 2024 were $57.6 million and $0.16 per share, after adjusting for a $5.3 million non-cash gain related to the quarterly revaluation of the environmental reclamation provision at the closed sites, a $12.8 million mark-to-market revaluation loss related to share-based compensation expense, a revaluation of the gold prepayment liability and a revaluation of the company's strategic gold and copper hedges, and a $9.0 million write-down of PP&E, among other items.
As at March 31, 2024, total liquidity increased to $618.9 million, including $284.4 million in cash and cash equivalents as well as undrawn availability of $334.5 million under the company's revolving credit facilities. Net debt declined by $43.5 million during the quarter to $994.2 million as at March 31, 2024. Based on expected free cash flow generation beyond the first quarter of 2024, the company continues to make progress on the deleveraging targets as outlined in the 3-P plan for sanctioning Copper World.
| Consolidated Financial Condition ($000s) |
|
Mar. 31, 2024 |
Dec. 31, 2023 |
Mar. 31, 2023 |
| Cash and cash equivalents |
|
284,385 |
249,794 |
255,563 |
| Total long-term debt |
|
1,278,587 |
1,287,536 |
1,225,023 |
| Net debt1 |
|
994,202 |
1,037,742 |
969,460 |
| Working capital2 |
|
200,850 |
135,913 |
100,987 |
| Total assets |
|
5,231,283 |
5,312,634 |
4,367,982 |
| Equity3 |
|
2,107,532 |
2,096,811 |
1,574,521 |
| Net debt to adjusted EBITDA1,4 |
|
1.3 |
1.6 |
2.1 |
1 Net debt and net debit to adjusted EBITDA are non-IFRS financial performance measures with no standardized definition under IFRS. For further information, please see the "Non-IFRS Financial Performance Measures" section of this news release.
2 Working capital is determined as total current assets less total current liabilities as defined under IFRS and disclosed on the consolidated interim financial statements.
3 Equity attributable to owners of the company.
4 Net debt to adjusted EBITDA for the 12 month period.
| Consolidated Financial Performance |
|
Three Months Ended |
| |
|
Mar. 31, 2024 |
Dec. 31, 2023 |
Mar. 31, 2023 |
| Revenue |
$000s |
524,989 |
602,189 |
295,219 |
| Cost of sales |
$000s |
373,035 |
405,433 |
228,706 |
| Earnings before tax |
$000s |
67,750 |
80,982 |
17,430 |
| Net earnings |
$000s |
18,535 |
33,528 |
5,457 |
| Basic earnings per share |
$/share |
0.05 |
0.10 |
0.02 |
| Adjusted earnings per share1 |
$/share |
0.16 |
0.20 |
0.00 |
| Operating cash flow before change in non-cash working capital |
$ millions |
147.5 |
246.5 |
85.6 |
| Adjusted EBITDA1 |
$ millions |
214.2 |
274.4 |
101.9 |
1 Adjusted earnings per share and adjusted EBITDA are non-IFRS financial performance measures with no standardized definition under IFRS. For further information, please see the "Non-IFRS Financial Performance Measures" section.
| Consolidated Production and Cost Performance |
Three Months Ended1 |
| |
|
Mar. 31, 2024 |
Dec. 31, 2023 |
Mar. 31, 2023 |
| Contained metal in concentrate and doré produced2 |
|
|
|
| Copper |
tonnes |
34,749 |
45,450 |
22,562 |
| Gold |
ounces |
90,392 |
112,776 |
47,240 |
| Silver |
ounces |
947,917 |
1,197,082 |
702,809 |
| Zinc |
tonnes |
8,798 |
5,747 |
9,846 |
| Molybdenum |
tonnes |
397 |
397 |
289 |
| Payable metal sold |
|
|
|
|
| Copper |
tonnes |
33,608 |
44,006 |
18,541 |
| Gold3 |
ounces |
108,081 |
104,840 |
49,720 |
| Silver3 |
ounces |
1,068,848 |
1,048,877 |
541,884 |
| Zinc |
tonnes |
6,119 |
7,385 |
5,628 |
| Molybdenum |
tonnes |
415 |
468 |
254 |
| Consolidated cash cost per pound of copper produced4 |
|
|
|
| Cash cost |
$/lb |
0.16 |
0.16 |
0.85 |
| Sustaining cash cost |
$/lb |
1.03 |
1.09 |
1.83 |
| All-in sustaining cash cost |
$/lb |
1.32 |
1.31 |
2.07 |
1Includes 100% of Copper Mountain mine production. Hudbay owns 75% of Copper Mountain mine. As Copper Mountain was acquired on June 20, 2023, there were no comparative figures for the three months ended March 31, 2023.
2 Metal reported in concentrate is prior to deductions associated with smelter contract terms.
3 Includes total payable gold and silver in concentrate and in doré sold.
4 Cash cost, sustaining cash cost and all-in sustaining cash cost per pound of copper produced, net of by-product credits, are non-IFRS financial performance measures with no standardized definition under IFRS. For further information, please see the "Non-IFRS Financial Performance Measures" section of this news release.
Peru Operations Review
| Peru Operations |
Three Months Ended |
| |
|
Mar. 31, 2024 |
Dec. 31, 2023 |
Mar. 31, 2023 |
| Constancia ore mined1 |
tonnes |
2,559,547 |
973,176 |
3,403,181 |
| Copper |
% |
0.31 |
0.30 |
0.34 |
| Gold |
g/tonne |
0.04 |
0.04 |
0.04 |
| Silver |
g/tonne |
2.79 |
2.26 |
2.52 |
| Molybdenum |
% |
0.01 |
0.01 |
0.01 |
| Pampacancha ore mined |
tonnes |
2,214,354 |
5,556,613 |
897,295 |
| Copper |
% |
0.56 |
0.56 |
0.49 |
| Gold |
g/tonne |
0.32 |
0.32 |
0.52 |
| Silver |
g/tonne |
4.64 |
4.84 |
5.12 |
| Molybdenum |
% |
0.02 |
0.01 |
0.01 |
| Total ore mined |
tonnes |
4,773,901 |
6,529,789 |
4,300,476 |
| Strip ratio4 |
|
1.95 |
1.26 |
1.84 |
| Ore milled |
tonnes |
8,077,962 |
7,939,044 |
7,663,728 |
| Copper |
% |
0.36 |
0.48 |
0.33 |
| Gold |
g/tonne |
0.15 |
0.25 |
0.08 |
| Silver |
g/tonne |
3.48 |
4.20 |
3.69 |
| Molybdenum |
% |
0.01 |
0.01 |
0.01 |
| Copper recovery |
% |
84.9 |
87.4 |
81.7 |
| Gold recovery |
% |
73.4 |
77.6 |
56.8 |
| Silver recovery |
% |
70.7 |
78.0 |
60.7 |
| Molybdenum recovery |
% |
43.2 |
33.6 |
34.8 |
| Contained metal in concentrate |
|
|
|
| Copper |
tonnes |
24,576 |
33,207 |
20,517 |
| Gold |
ounces |
29,144 |
49,418 |
11,206 |
| Silver |
ounces |
639,718 |
836,208 |
552,167 |
| Molybdenum |
tonnes |
397 |
397 |
289 |
| Payable metal sold |
|
|
|
| Copper |
tonnes |
23,754 |
31,200 |
16,316 |
| Gold |
ounces |
42,677 |
38,114 |
11,781 |
| Silver |
ounces |
753,707 |
703,679 |
392,207 |
| Molybdenum |
tonnes |
415 |
468 |
254 |
| Combined unit operating cost2,3 |
$/tonne |
10.92 |
12.24 |
11.47 |
| Cash cost3 |
$/lb |
0.43 |
0.54 |
1.36 |
| Sustaining cash cost3 |
$/lb |
1.06 |
1.21 |
2.12 |
1 Reported tonnes and grade for ore mined are estimates based on mine plan assumptions and may not reconcile fully to ore milled.
2 Reflects combined mine, mill and general and administrative ("G&A") costs per tonne of ore milled. Reflects the deduction of expected capitalized stripping costs.
3 Combined unit costs, cash cost and sustaining cash cost per pound of copper produced, net of by-product credits, are non-IFRS financial performance measures with no standardized definition under IFRS. For further information, please see the "Non-IFRS Financial Performance Measures" section of this news release.
4 Strip ratio is calculated as waste mined divided by ore mined.
During the first quarter of 2024, the Peru operations produced 24,576 tonnes of copper, 29,144 ounces of gold, 639,718 ounces of silver and 397 tonnes of molybdenum. While high grade copper and gold ore continued to be mined from Pampacancha in the first quarter of 2024, the mill processed less Pampacancha ore than in the fourth quarter of 2023, which resulted in lower copper, gold and silver production, in line with mine plan expectations. The company is on track to achieve its 2024 production guidance for all metals in Peru.
The Constancia operations benefited from strong mill throughput, averaging 89,000 tonnes per day in the first quarter. Mill ore feed has reverted to the typical blend of approximately one-third from Pampacancha and two-thirds from Constancia, which is expected to continue throughout 2024. The operations benefited from strong cost performance, achieving lower unit operating costs, cash cost and sustaining cash cost compared to the fourth quarter of 2023. Cash cost also benefited from higher gold sales volumes in the first quarter of 2024.
Total ore mined in the first quarter of 2024 decreased by 27% compared to the fourth quarter of 2023, and was in line with the mine plan, which included supplemental ore feed from stockpiles during the quarter as the company advances pit stripping activities. Ore mined from Pampacancha during the first quarter was 2.2 million tonnes at average grades of 0.56% copper and 0.32 grams per tonne gold.
Ore milled during the first quarter of 2024 was 2% higher than the fourth quarter of 2023 mainly due to the treatment of softer ore from stockpiles. Milled copper and gold grades decreased in the first quarter of 2024 compared to the fourth quarter of 2023 as a result of a normalized blending of ore feed from Pampacancha, as described above. Recoveries of copper, gold and silver during the first quarter of 2024 were 84.9%, 73.4% and 70.7%, respectively, and were in line with metallurgical models.
Combined mine, mill and G&A unit operating costsi in the first quarter were $10.92 per tonne, 11% lower than the fourth quarter of 2023 primarily due to lower milling costs and higher ore throughput.
Cash cost per pound of copper produced, net of by-product creditsi, in the first quarter of 2024 was $0.43, a 20% improvement over the favourable levels achieved in the fourth quarter of 2023 primarily due to higher by-product credits, lower milling costs, lower treatment and refining costs and lower freight costs, partially offset by higher copper production. Cash cost for the quarter was below the low end of the 2024 guidance range primarily due to high gold by-product credits, and it is expected to increase during the remainder of 2024 with full year cash cost expected to be within the 2024 guidance range.
Sustaining cash cost per pound of copper produced, net of by-product creditsi, for the first quarter of 2024 was $1.06, a 12% improvement over the fourth quarter of 2023 primarily due to the same factors affecting cash cost.
The collective bargaining agreement with the labour union representing a portion of the Constancia workforce expired in November 2023, and Hudbay continues to negotiate the terms of a new agreement with the union.
In March 2024, the Peruvian Ministry of Energy and Mines indicated an intention to make regulatory changes to allow mining companies to increase their permitted mill throughput levels by up to 10%. The company is monitoring the status of this proposed regulation and evaluating the potential to increase future production at Constancia.
Manitoba Operations Review
| Manitoba Operations |
|
Three Months Ended |
| |
|
Mar. 31, 2024 |
Dec. 31, 2023 |
Mar. 31, 2023 |
| Lalor |
|
|
|
|
| Ore mined |
tonnes |
407,708 |
372,384 |
373,599 |
| Gold |
g/tonne |
4.84 |
5.92 |
3.96 |
| Copper |
% |
0.84 |
1.04 |
0.57 |
| Zinc |
% |
2.92 |
2.20 |
3.32 |
| Silver |
g/tonne |
23.44 |
28.92 |
18.24 |
| New Britannia |
|
|
|
|
| Ore milled |
tonnes |
170,409 |
165,038 |
143,042 |
| Gold |
g/tonne |
7.03 |
8.03 |
6.05 |
| Copper |
% |
1.13 |
1.46 |
0.61 |
| Zinc |
% |
0.82 |
0.85 |
0.76 |
| Silver |
g/tonne |
21.6 |
27.97 |
22.39 |
| Gold recovery1 |
% |
88.6 |
89.0 |
87.9 |
| Copper recovery |
% |
96.2 |
91.6 |
91.7 |
| Silver recovery1 |
% |
82.0 |
83.2 |
79.1 |
| Stall Concentrator |
|
|
|
| Ore milled |
tonnes |
219,358 |
228,799 |
242,619 |
| Gold |
g/tonne |
3.07 |
4.22 |
2.78 |
| Copper |
% |
0.64 |
0.73 |
0.59 |
| Zinc |
% |
4.54 |
3.20 |
4.81 |
| Silver |
g/tonne |
24.46 |
28.63 |
17.14 |
| Gold recovery |
% |
68.0 |
67.5 |
61.9 |
| Copper recovery |
% |
91.7 |
92.0 |
87.0 |
| Zinc recovery |
% |
88.4 |
78.5 |
84.4 |
| Silver recovery |
% |
59.8 |
61.8 |
56.3 |
| Total contained metal in concentrate and doré2 |
|
|
| Gold |
ounces |
56,831 |
59,863 |
36,034 |
| Copper |
tonnes |
3,149 |
3,735 |
2,045 |
| Zinc |
tonnes |
8,798 |
5,747 |
9,846 |
| Silver |
ounces |
219,823 |
255,579 |
150,642 |
| Total payable metal sold |
|
|
|
| Gold3 |
ounces |
62,003 |
63,635 |
37,939 |
| Copper |
tonnes |
2,921 |
3,687 |
2,225 |
| Zinc |
tonnes |
6,119 |
7,385 |
5,628 |
| Silver3 |
ounces |
231,841 |
246,757 |
149,677 |
| Combined unit operating cost4,5 |
C$/tonne |
235 |
216 |
216 |
| Gold cash cost5 |
$/oz |
736 |
434 |
938 |
| Gold sustaining cash cost5 |
$/oz |
950 |
788 |
1,336 |
1 Gold and silver recovery includes total recovery from concentrate and doré.
2 Doré includes sludge, slag and carbon fines in three ended March 31, 2024, December 31, 2023 and March 31, 2023.
3 Includes total payable precious metals in concentrate and in doré sold.
4 Reflects combined mine, mill and G&A costs per tonne of ore milled.
5 Combined unit cost, gold cash cost and sustaining cash cost per ounce of gold produced, net of by-product credits, are non-IFRS financial performance measures with no standardized definition under IFRS. For further information, please see the "Non-IFRS Financial Performance Measures" section of this news release.
The Manitoba operations produced 56,831 ounces of gold, 3,149 tonnes of copper, 8,798 tonnes of zinc and 219,823 ounces of silver during the first quarter of 2024. Production of gold in the first quarter was better than expected as a result of many operational improvement initiatives and record performance from the New Britannia mill, as described below. The company is on track to achieve its 2024 production guidance for all metals in Manitoba.
The strong production results in the first quarter of 2024 were partly attributed to the successful implementation of improvement initiatives at the Lalor mine that were completed in the second half of 2023 and in early 2024. Noteworthy improvements include high shaft availability, efficient ore hoisting, stope fragmentation reduction and mucking productivity enhancements. In 2024, the company's primary focus entails implementing stope design modifications aimed at improving mucking efficiency throughout a stope's lifecycle. The company also continues to focus on maintaining the quality of ore production with elevated metal grades through diligent efforts to minimize dilution and enhance ore recovery from stopes.
Total ore mined in Manitoba in the first quarter of 2024 was 9% higher than the fourth quarter of 2023. Grades for all metals reflect the successful execution of the company's strategic mine plan that prioritizes gold and copper production with a focus on enhanced ore recovery. This resulted in the continued mining of higher gold and copper grade zones and robust grade control practices, including assaying and sampling of blastholes, which further improved ore quality. This also resulted in reduced mining from the zinc areas, lowering the overall zinc grade at Lalor in the first quarter of 2024, in line with the mine plan.
Consistent with the company strategy of allocating more Lalor ore feed to New Britannia, the New Britannia mill throughput averaged a record 1,870 tonnes per day in the first quarter of 2024, a 4% improvement over the previous record level achieved in the fourth quarter of 2023. Recoveries of gold, copper and silver in the first quarter of 2024 were 88.6%, 96.2% and 82.0%, respectively.
The Stall mill processed 4% less ore in the first quarter of 2024 than the fourth quarter of 2023, which is aligned with the strategy of allocating more Lalor ore feed to New Britannia, as noted above. With the completion of the Stall mill recovery improvement project in 2023, recoveries of gold, copper and silver in the first quarter of 2024 were consistent with the fourth quarter, achieving targeted gold recovery levels of approximately 68%.
Combined mine, mill and G&A unit operating costsi in the first quarter of 2024 were C$235 per tonne, a small increase of 9% compared to the fourth quarter of 2023 due to higher mining costs as a result of lower capitalized development costs and longer haulage distances and higher milling costs at Stall associated with lower throughput.
Cash cost per ounce of gold produced, net of by-product creditsi, in the first quarter of 2024 was $736, an increase compared to the uncharacteristically low fourth quarter of 2023 which benefitted from record gold production and higher by-product credits. However, the first quarter cash cost was well positioned at the lower end of the 2024 cash cost guidance range, and the company expects full year gold cash cost to remain within the 2024 guidance range.
Sustaining cash cost per ounce of gold produced, net of by-product creditsi, in the first quarter of 2024 was $950, an increase compared to the fourth quarter of 2023 primarily due to the same factors affecting cash cost as well as lower sustaining capital costs during the quarter.
The New Britannia mill achieved record quarterly throughput of 1,870 tonnes per day in the first quarter due to ongoing improvement initiatives and effective preventative maintenance measures. Noteworthy enhancements in the elution circuit, which facilitates efficient carbon transfer and gold stripping, have bolstered gold recovery to doré. During the first quarter, Hudbay received a permit approval from the Manitoba Environment and Climate Change ministry ("MECC") to increase the New Britannia mill production rate above nameplate capacity to 2,500 tonnes per day. This key approval aligns with the company's long-term objectives to further increase gold production at the Snow Lake operations by directing more gold ore from Lalor to the New Britannia mill to achieve higher gold recoveries.
At the Anderson tailings facility, Hudbay successfully improved the tailings deposition process during the quarter, leveraging new equipment and procedural refinements, enabling optimized storage capacity and deferred dam construction capital to future years. To further optimize the storage capacity of the facility, a permit to conduct a subaerial tailings deposition trial study was submitted to MECC during the quarter.
British Columbia Operations Review
| British Columbia Operations |
Three Months Ended5 |
| |
|
Mar. 31, 2024 |
Dec. 31, 2023 |
| Ore mined1 |
tonnes |
3,722,496 |
2,627,398 |
| Waste mined |
tonnes |
15,276,598 |
14,032,093 |
| Strip ratio2 |
|
4.10 |
5.34 |
| Ore milled |
tonnes |
3,180,149 |
3,261,891 |
| Copper |
% |
0.27 |
0.33 |
| Gold |
g/tonne |
0.07 |
0.06 |
| Silver |
g/tonne |
1.19 |
1.36 |
| Copper recovery |
% |
83.4 |
78.8 |
| Gold recovery |
% |
61.8 |
54.1 |
| Silver recovery |
% |
72.4 |
73.8 |
| Total contained metal in concentrate2 |
|
|
| Copper |
tonnes |
7,024 |
8,508 |
| Gold |
ounces |
4,417 |
3,495 |
| Silver |
ounces |
88,376 |
105,295 |
| Total payable metal sold |
|
|
| Copper |
tonnes |
6,933 |
9,119 |
| Gold |
ounces |
3,401 |
3,091 |
| Silver |
ounces |
83,300 |
98,441 |
| Combined unit operating cost3,4 |
C$/tonne |
23.67 |
20.90 |
| Cash cost4 |
$/lb |
3.49 |
2.67 |
| Sustaining cash cost4 |
$/lb |
4.85 |
3.93 |
1 Reported tonnes and grade for ore mined are estimates based on mine plan assumptions and may not reconcile fully to ore milled.
2 Strip ratio is calculated as waste mined divided by ore mined.
3 Reflects combined mine, mill and G&A costs per tonne of ore milled. Reflects the deduction of expected capitalized stripping costs.
4 Combined unit operating cost, cash cost and sustaining cash cost per pound of copper produced, net of by-product credits, are non-IFRS financial performance measures with no standardized definition under IFRS. For further information, please see the "Non-IFRS Financial Performance Measures" section of this news release.
5 Copper Mountain mine results are stated at 100%. Hudbay owns 75% of Copper Mountain mine.
During the first quarter of 2024, the British Columbia operations produced 7,024 tonnes of copper, 4,417 ounces of gold and 88,376 ounces of silver. Production of copper and silver was lower than the fourth quarter of 2024 primarily as a result of lower head grades, partially offset by higher recoveries. Production of gold was higher than the fourth quarter of 2024 as a result of higher grades and higher recoveries. The company is on track to achieve 2024 production guidance for all metals in British Columbia.
Since completing the acquisition of Copper Mountain on June 20, 2023, Hudbay has been focused on advancing operational stabilization plans, including opening up the mine by adding additional mining faces and re-mobilizing idle haul trucks, optimizing the ore feed to the plant and implementing plant improvement initiatives that mirror Hudbay's successful processes at Constancia. While the benefits of these stabilization plans are not expected to be fully realized until 2025, the company successfully increased the total tonnes moved and has seen stronger mill performance as demonstrated by higher mill availability and above-target copper recoveries of 83.4% in the first quarter of 2024, achieving the highest quarterly copper recoveries in the last decade. Stabilization benefits continued to be realized into April with 83% copper recoveries and approximately 40,000 tonnes per day average mill throughput, an increase of approximately 9% over throughput levels in the first quarter.
Hudbay has exceeded the targeted $10 million in annualized corporate synergies and is on track to realize the three-year annual operating efficiencies target.
Total ore mined at Copper Mountain in the first quarter of 2024 was 3.7 million tonnes, a 42% increase versus the fourth quarter of 2023. The mine operations team continues to implement a fleet production ramp up plan to remobilize idle capital equipment at the Copper Mountain site as part of the accelerated stripping program to access higher head grades. This plan entails remobilization of the mining truck fleet, deployment of an additional shovel, production drill and associated equipment. During the quarter, the company also advanced the delivery of five haul trucks to self-perform additional stripping activities over the next three years at a lower cost than the contractor mining approach that was contemplated in the technical report. As a result, total material moved is expected to continue to increase quarter over quarter in line with the mine plan.
The mill processed 3.2 million tonnes of ore during the first quarter of 2024, a 3% decrease versus the fourth quarter of 2023. Benefiting from stabilization and reliability initiatives within the comminution circuit, the average mill availability during the first quarter of 2024 increased by approximately 4% to 90.4%, compared to the fourth quarter of 2023, while maintaining a stable throughput rate. Mill throughput in the first quarter 2024 was impacted by reduced reliability of the crushing circuit, caused primarily by elevated levels of magnetite and scrap metal as mining progresses through areas of historical underground workings. During the quarter, a number of initiatives were advanced to address these issues and other identified constraints and improve throughput to targeted levels, with the benefits expected to be realized throughout the rest of 2024. These initiatives include reprogramming of the mill expert system, installation of advanced semi-autogenous grinding (SAG) control instrumentation, redesign of the SAG liner package and updated operational procedures intended to remove magnetite from the pebble stream.
Maintenance practices to improve mill availability continue to be a key pillar of the stabilization initiatives. The first quarter planned maintenance shutdown focused on achieving 100% compliance to planned execution. Future maintenance practice enhancements are planned for rollout over the second and third quarters of 2024, which entail the implementation of improved maintenance management processes and a change in the maintenance organizational structure. Work has begun to analyze the trade-off among the various alternatives to further enhance mill performance.
Milled copper grades during the first quarter of 2024 averaged 0.27%, lower than the fourth quarter of 2023 but higher than the reserve grade of 0.25%. Copper recoveries of 83.4% were higher than the fourth quarter of 2023 and higher than expectations for the first quarter due to relieving the regrind circuit constraint and implementing the flotation operational strategy improvements, including reagent selection and dose modification.
Work continues on the expert system that controls mill feed with implementation expected during the second quarter. Throughput in April increased to approximately 40,000 tonnes per day as the mill began realizing benefits from the recalibrated expert system, amongst other initiatives. The benefits of the operational stabilization improvements are expected to continue to be realized throughout 2024. The company is also accelerating engineering studies to debottleneck and increase the nominal plant capacity to 50,000 tonnes per day earlier than was contemplated in the technical report.
Combined mine, mill and G&A unit operating costs in the first quarter of 2024 were C$23.67 per tonne milled, 13% higher than the fourth quarter of 2023 primarily due to higher mining costs. Combined unit operating costs are expected to decrease over time as the company continues to implement its stabilization and optimization initiatives at Copper Mountain. As the hiring and training of additional haul truck drivers continues, the company expects to have a fully trained complement of truck drivers by July to support the larger mining fleet, which is expected to increase material moved and reduce unit operating costs.
Cash cost and sustaining cash cost per pound of copper produced, net of by-product credits, in the first quarter of 2024 were $3.49 and $4.85, respectively. Cash cost for the quarter was above the upper end of the 2024 guidance range; however, it is expected to decline during the remainder of 2024 and the full year cash cost is expected to be within the 2024 guidance range.
Generating Free Cash Flow with Increased Production and Continued Financial Discipline
Hudbay delivered a third successive quarter of positive free cash flow during the first quarter of 2024 as the company executed its plan for higher copper and gold production from Pampacancha and higher gold production at Lalor, both driven by higher grades, throughput and recoveries. The company continues to expect to see strong production levels throughout 2024 from sustained higher grades in Peru and Manitoba, along with additional production from Copper Mountain.
During the first quarter, Hudbay completed $10 million in net repayments on its revolving credit facilities. The company also completed three additional months of deliveries under the gold forward sale and prepay agreement, further reducing the outstanding gold prepayment liability, and is scheduled to fully repay the gold prepay facility by August 2024. Despite these debt repayments and gold deliveries, the company increased its cash and cash equivalents to $284.4 million and reduced overall net debt to $994.2 million as at March 31, 2024, compared to $249.8 million and $1,037.7 million, respectively, as at December 31, 2023. The $43.5 million decline in net debt, together with higher levels of adjusted EBITDAi in the first quarter, have improved Hudbay's net debt to adjusted EBITDA ratioi to 1.3x compared to 1.6x at the end of 2023. Subsequent to quarter-end, the company continued the deleveraging efforts with an additional $10 million repayment on the revolving credit facilities in May 2024.
During the first quarter, the company continued to exercise financial discipline and take steps to support free cash flow generation during the stabilization period at Copper Mountain. To this end, Hudbay entered into new forward sales contracts at Copper Mountain for a total of 3,600 tonnes of copper production over the twelve-month period from May 2024 to April 2025 at an average price of $3.97 per pound, as well as zero-cost collars for 3,000 tonnes of copper production over the twelve-month period from May 2024 to April 2025 at an average floor price of $4.00 per pound and an average cap price of $4.36 per pound. As at March 31, 2024, 15.9 million pounds of copper forwards and 19.8 million pounds of copper collars were outstanding, representing approximately 44% of 2024 production guidance levels for Copper Mountain. The company also entered into zero-cost collars for 36,000 ounces of gold production over the period from April to December 2024 at an average floor price of $2,088 per ounce and an average cap price of $2,458 per ounce.
Annual Reserve and Resource Update
Hudbay provided its annual mineral reserve and resource update on March 28, 2024. Current mineral reserve estimates at Constancia and Pampacancha total an aggregate of approximately 548 million tonnes at 0.27% copper with approximately 1.5 million tonnes of contained copper. The expected mine life of Constancia has been extended by three years to 2041 as a result of the successful conversion of mineral resources to mineral reserves with the addition of a further mining phase at the Constancia pit following positive geotechnical drilling studies in 2023. There remains potential for further reserve conversion and future mine life extensions at Constancia through an additional 172 million tonnes of measured and indicated resources at 0.22% copper and 37 million tonnes of inferred resources at 0.40% copper, in each case, exclusive of mineral reserves.
Current mineral reserve estimates in Snow Lake total 17 million tonnes with approximately 2 million ounces in contained gold, and the expected mine life of the Snow Lake operations has been maintained until 2038. The Snow Lake operations continue to achieve higher gold production levels due to the New Britannia mill operating well above design capacity, the recent completion of the Stall mill recovery improvement project in 2023 and the implementation of several optimization initiatives at the Lalor mine to improve the quality of ore production and minimize waste dilution. There remains another 1.4 million ounces of gold in inferred resources in Snow Lake that have the potential to maintain strong annual gold production levels beyond 2030 and further extend the mine life in Snow Lake. The company is advancing an access drift at the nearby 1901 deposit to enable infill drilling aimed at converting the inferred mineral resources in the gold lenses to mineral reserves.
Current mineral reserve estimates at the Copper Mountain mine total 367 million tonnes at 0.25% copper and 0.12 grams per tonne gold with approximately 900,000 tonnes of contained copper and 1.4 million ounces of contained gold. Hudbay acquired the Copper Mountain mine as part of the acquisition of Copper Mountain Mining Corporation in June 2023. The company holds a 75% interest in the Copper Mountain mine, while Mitsubishi Materials Corp. holds the remaining 25% interest. The current mineral reserve estimates support a 21-year mine life, as previously disclosed in Hudbay's first National Instrument 43-101 technical report in respect of the Copper Mountain mine filed in December 2023 (the "Copper Mountain Technical Report"). There exists significant upside potential for reserve conversion and extending mine life beyond 21 years through an additional 140 million tonnes of measured and indicated resources at 0.21% copper and 0.10 grams per tonne gold and 370 million tonnes of inferred resources at 0.25% copper and 0.13 grams per tonne gold, in each case, exclusive of mineral reserves.
Hudbay released updated three-year production guidance with its annual mineral reserve and resource update, as presented below. Consolidated copper production over the next three years is expected to average 153,000ii tonnes, representing an increase of 16% from 2023 levels. Consolidated gold production over the next three years is expected to average 272,500ii ounces, reflecting continued high annual gold production levels in Manitoba and a smoothing of Pampacancha high grade gold zones in Peru over the 2023 to 2025 period. Annual production at the Constancia operations is expected to average approximately 101,000ii tonnes of copper and 62,000ii ounces of gold over the next three years. Annual gold production from Snow Lake is expected to average approximately 185,000ii ounces over the next three years, in line with 2023 levels. Annual copper production at the British Columbia operations is expected to average approximately 41,000ii tonnes of copper over the next three years. British Columbia production guidance ranges in 2024 and 2025 are wider than typical ranges and coincide with the operation ramp up activities over the stabilization period. Copper production at the Copper Mountain mine is expected to increase by 32% in 2026 compared to 2024, reflecting operational improvements consistent with the Copper Mountain Technical Report.
3-Year Production Outlook
Contained Metal in Concentrate
and Doré1 |
2024 Guidance |
2025 Guidance |
2026 Guidance |
| Peru |
|
|
|
|
| Copper |
tonnes |
98,000 - 120,000 |
94,000 - 115,000 |
80,000 - 100,000 |
| Gold |
ounces |
76,000 - 93,000 |
70,000 - 90,000 |
15,000 - 25,000 |
| Silver |
ounces |
2,500,000 - 3,000,000 |
2,700,000 - 3,300,000 |
1,500,000 - 1,900,000 |
| Molybdenum |
tonnes |
1,250 - 1,500 |
1,200 - 1,600 |
1,500 - 1,900 |
| |
|
|
|
|
| Manitoba |
|
|
|
|
| Gold |
ounces |
170,000 - 200,000 |
170,000 - 200,000 |
170,000 - 200,000 |
| Zinc |
tonnes |
27,000 - 35,000 |
25,000 - 33,000 |
18,000 - 24,000 |
| Copper |
tonnes |
9,000 - 12,000 |
8,000 - 12,000 |
10,000 - 14,000 |
| Silver |
ounces |
750,000 - 1,000,000 |
800,000 - 1,100,000 |
800,000 - 1,100,000 |
| |
|
|
|
|
| British Columbia2 |
|
|
|
|
| Copper |
tonnes |
30,000 - 44,000 |
30,000 - 45,000 |
44,000 - 54,000 |
| Gold |
ounces |
17,000 - 26,000 |
24,000 - 36,000 |
24,000 - 29,000 |
| Silver |
ounces |
300,000 - 455,000 |
290,000 - 400,000 |
450,000 - 550,000 |
| |
|
|
|
|
| Total |
|
|
|
|
| Copper |
tonnes |
137,000 - 176,000 |
132,000 - 172,000 |
134,000 - 168,000 |
| Gold |
ounces |
263,000 - 319,000 |
264,000 - 326,000 |
209,000 - 254,000 |
| Zinc |
tonnes |
27,000 - 35,000 |
25,000 - 33,000 |
18,000 - 24,000 |
| Silver |
ounces |
3,550,000 - 4,455,000 |
3,790,000 - 4,800,000 |
2,750,000 - 3,550,000 |
| Molybdenum |
tonnes |
1,250 - 1,500 |
1,200 - 1,600 |
1,500 - 1,900 |
1 Metal reported in concentrate and doré is prior to treatment or refining losses or deductions associated with smelter terms.
2 Includes 100% of Copper Mountain mine production. Hudbay owns 75% of Copper Mountain mine.
Advancing Permitting at Copper World
The first key state permit required for Copper World, the Mined Land Reclamation Plan, was initially approved by the Arizona State Mine Inspector in October 2021 and was subsequently amended to reflect a larger private land project footprint. This approval was challenged in state court, but the challenge was dismissed in May 2023. In late 2022, Hudbay submitted the applications for an Aquifer Protection Permit and an Air Quality Permit to the Arizona Department of Environmental Quality. Hudbay continues to expect to receive these two outstanding state permits in 2024. Hudbay also received the floodplain use permit approval from Pima County in April 2024.
Copper World is one of the highest-grade open pit copper projects in the Americasiii with proven and probable mineral reserves of 385 million tonnes at 0.54% copper. There remains approximately 60% of the total copper contained in measured and indicated mineral resources (exclusive of mineral reserves), providing significant potential for Phase II expansion and mine life extension. In addition, the inferred mineral resource estimates are at a comparable copper grade and also provide significant upside potential.
Exploration Update
Progressing Maria Reyna and Caballito Exploration Permits
Hudbay controls a large, contiguous block of mineral rights with the potential to host mineral deposits in close proximity to the Constancia processing facility, including the past producing Caballito property and the highly prospective Maria Reyna property. The company commenced early exploration activities at Maria Reyna and Caballito after completing a surface rights exploration agreement with the community of Uchucarcco in August 2022. As part of the drill permitting process, environmental impact assessment applications were submitted for the Maria Reyna property in November 2023 and for the Caballito property in April 2024.
Executing Largest Snow Lake Exploration Program
The planned 2024 exploration program is Hudbay's largest Snow Lake program in company history and consists of modern geophysical programs and multi-phased drilling campaigns:
• Modern geophysics program - A majority of the newly acquired Cook Lake and former Rockcliff claims have been untested by modern deep geophysics, which was the discovery method for the Lalor deposit. A large geophysics program is currently underway including surface electromagnetic surveys using cutting-edge techniques that enable the team to detect targets at depths of almost 1,000 metres below surface.
• Multi-phased drilling program - The results from the winter 2024 surface drill program near Lalor are being analyzed and the company is planning follow-up drill programs for the balance of 2024.
The goal of the 2024 exploration program is to test mineralized extensions of the Lalor deposit and to find a new anchor deposit within trucking distance of the Snow Lake processing infrastructure, which has the potential to extend the life of the Snow Lake operations beyond 2038.
Advancing Access to the 1901 Deposit
In the first quarter of 2024, the company commenced the development of a smaller profile drift from the existing Lalor ramp towards the 1901 deposit. The 1901 development and exploration drift is proceeding on schedule and on budget and is expected to reach the mineralization in late-2024, followed by planned definition drilling in 2025 intended to confirm the optimal mining method, evaluate the orebody geometry and continuity, and convert inferred mineral resources in the gold lenses to mineral reserves. In addition to the benefits of being able to cycle development rounds faster, the smaller profile drift has significantly reduced the cost per metre of advance by 33% compared to average 2023 development costs incurred at Lalor.
Unlocking Value Through Flin Flon Tailings Reprocessing
Hudbay is advancing studies to evaluate the opportunity to reprocess Flin Flon tailings where more than 100 million tonnes of tailings have been deposited for over 90 years from the mill and the zinc plant. The studies are evaluating the potential to use the existing Flin Flon concentrator, which is currently on care and maintenance after the closure of the 777 mine in 2022, with flow sheet modifications to reprocess tailings to recover critical minerals and precious metals while creating environmental and social benefits for the region. The company is completing metallurgical test work and an early economic study to evaluate the tailings reprocessing opportunity.
The Flin Flon tailings facility contains materials generated from the metallurgical complex and confirmatory drilling has been conducted over the last several years:
• Mill tailings - Initial confirmatory drilling completed in 2022 indicated higher zinc, copper and silver grades than predicted from historical mill records while confirming the historical gold grade. In 2023, Hudbay advanced metallurgical test work and evaluated metallurgical technologies, including the signing of a test work co-operation agreement with Cobalt Blue Holdings ("COB") examining the use of COB technology to treat Flin Flon mill tailings. Initial results from preliminary roasting test work were encouraging in converting more than 90% of pyrite into pyrrhotite and molten sulphur, and the project has been advanced to the next stage of testing.
• Zinc plant tailings - This section of the tailings facility was previously unable to be drilled in 2022 due to water levels from operations. The water levels have receded since the completion of operations in mid-2022, and in 2024, Hudbay completed an initial confirmatory drill program in this portion of the tailings facility with results pending.
A key benefit of tailings reprocessing is the potential to reduce the environmental footprint by removing acid-generating properties of the tailings, which would improve the environmental impacts through higher quality water in the tailings facility and reduce the need for long-term water treatment.
Marubeni Flin Flon Exploration Partnership
In March 2024, Hudbay entered into an option agreement (the "Marubeni Option Agreement") with Marubeni Corporation, pursuant to which Hudbay has granted Marubeni's wholly-owned Canadian subsidiary an option to acquire a 20% interest in three projects located within trucking distance of Hudbay's existing processing facilities in the Flin Flon area. Pursuant to the Marubeni Option Agreement, the option holder must fund a minimum of C$12 million in exploration expenditures over a period of approximately five years in order to exercise its option. All three projects hold past producing mines that generated meaningful production with attractive grades of both base metals and precious metals. The properties remain highly prospective with potential for further discovery based on the attractive geological setting, limited historical deep drilling and promising geochemical and geophysical targets.
Upon successful completion of the option holder's earn-in obligations and the exercise of the option, a joint venture will be formed to hold the selected projects with Hudbay, acting as operator, holding an 80% interest and Marubeni indirectly holding the remaining 20% interest.
Website Links
Hudbay:
www.hudbay.com
Management's Discussion and Analysis:
https://www.hudbayminerals.com/MDA524
Financial Statements:
https://www.hudbayminerals.com/FS524
Conference Call and Webcast
| Date: |
Tuesday, May 14, 2024 |
| |
|
| Time: |
11:00 a.m. ET |
| |
|
| Webcast: |
www.hudbay.com |
| |
|
| Dial in: |
1-416-764-8650 or 1-888-664-6383
Additional Dial-in |
Qualified Person and NI 43-101
The technical and scientific information in this news release related to the company's material mineral projects has been approved by Olivier Tavchandjian, P. Geo, Senior Vice President, Exploration and Technical Services. Mr. Tavchandjian is a qualified person pursuant to National Instrument 43-101 - Standards of Disclosure for Mineral Projects ("NI 43-101").
For a description of the key assumptions, parameters and methods used to estimate mineral reserves and resources at Hudbay's material mineral properties, as well as data verification procedures and a general discussion of the extent to which the estimates of scientific and technical information may be affected by any known environmental, permitting, legal title, taxation, sociopolitical, marketing or other relevant factors, please see the technical reports for the company's material properties as filed by Hudbay on SEDAR+ at www.sedarplus.ca and EDGAR at www.sec.gov.
Non-IFRS Financial Performance Measures
Adjusted net earnings (loss), adjusted net earnings (loss) per share, adjusted EBITDA, net debt, cash cost, sustaining and all-in sustaining cash cost per pound of copper produced, cash cost and sustaining cash cost per ounce of gold produced, combined unit costs and ratios based on these measures are non-IFRS performance measures. These measures do not have a meaning prescribed by IFRS and are therefore unlikely to be comparable to similar measures presented by other issuers. These measures should not be considered in isolation or as a substitute for measures prepared in accordance with IFRS and are not necessarily indicative of operating gross profit or cash flow from operations as determined under IFRS. Other companies may calculate these measures differently.
Management believes adjusted net earnings (loss) and adjusted net earnings (loss) per share provides an alternate measure of the company's performance for the current period and gives insight into its expected performance in future periods. These measures are used internally by the company to evaluate the performance of its underlying operations and to assist with its planning and forecasting of future operating results. As such, the company believes these measures are useful to investors in assessing the company's underlying performance. Hudbay provides adjusted EBITDA to help users analyze the company's results and to provide additional information about its ongoing cash generating potential in order to assess its capacity to service and repay debt, carry out investments and cover working capital needs. Net debt is shown because it is a performance measure used by the company to assess its financial position. Net debt to adjusted EBITDA is shown because it is a performance measure used by the company to assess its financial leverage and debt capacity. Cash cost, sustaining and all-in sustaining cash cost per pound of copper produced are shown because the company believes they help investors and management assess the performance of its operations, including the margin generated by the operations and the company. Cash cost and sustaining cash cost per ounce of gold produced are shown because the company believes they help investors and management assess the performance of its Manitoba operations. Combined unit cost is shown because Hudbay believes it helps investors and management assess the company's cost structure and margins that are not impacted by variability in by-product commodity prices.
The following tables provide detailed reconciliations to the most comparable IFRS measures.
Adjusted Net Earnings (Loss) Reconciliation
| |
|
Three Months Ended |
|
| (in $ millions) |
|
Mar. 31, 2024 |
|
|
Dec. 31, 2023 |
|
|
Mar. 31, 2023 |
|
| Net earnings for the period |
|
18.5 |
|
|
33.5 |
|
|
5.4 |
|
| Tax expense |
|
49.3 |
|
|
47.5 |
|
|
12.0 |
|
| Earnings before tax |
|
67.8 |
|
|
81.0 |
|
|
17.4 |
|
| Adjusting items: |
|
|
|
|
|
|
|
|
|
| Mark-to-market adjustments1 |
|
12.8 |
|
|
12.7 |
|
|
6.8 |
|
| Foreign exchange loss |
|
4.8 |
|
|
4.2 |
|
|
0.3 |
|
| Inventory adjustments |
|
- |
|
|
1.4 |
|
|
- |
|
| Variable consideration adjustment - stream revenue and accretion |
|
4.0 |
|
|
- |
|
|
(5.0 |
) |
| Premium paid on redemption of notes |
|
- |
|
|
2.2 |
|
|
- |
|
| Re-evaluation adjustment - environmental provision2 |
|
(5.3 |
) |
|
34.0 |
|
|
(8.2 |
) |
| Insurance recovery |
|
- |
|
|
(4.2 |
) |
|
- |
|
| Value-added-tax recovery |
|
- |
|
|
(3.9 |
) |
|
- |
|
| Write off fair value of the Copper Mountain bonds |
|
- |
|
|
(1.0 |
) |
|
- |
|
| Reduction of obligation to renounce flow-through expenditures |
|
(0.7 |
) |
|
- |
|
|
- |
|
| Restructuring charges |
|
0.9 |
|
|
0.6 |
|
|
- |
|
| Loss on disposal of investments |
|
- |
|
|
- |
|
|
0.7 |
|
| Write-down/loss on disposal of PP&E |
|
9.0 |
|
|
6.6 |
|
|
0.1 |
|
| Adjusted earnings before income taxes |
|
93.3 |
|
|
133.6 |
|
|
12.1 |
|
| Tax expense |
|
(49.3 |
) |
|
(47.5 |
) |
|
(12.0 |
) |
| Tax impact on adjusting items |
|
13.6 |
|
|
(14.8 |
) |
|
- |
|
| Adjusted net earnings |
|
57.6 |
|
|
71.3 |
|
|
0.1 |
|
| Adjusted net earnings ($/share) |
|
0.16 |
|
|
0.20 |
|
|
0.00 |
|
| Basic weighted average number of common shares outstanding (millions) |
|
350.8 |
|
|
349.1 |
|
|
262.0 |
|
1 Includes changes in fair value of the gold prepayment liability, Canadian junior mining investments, other financial assets and liabilities at fair value through net earnings or loss and share-based compensation expenses.
2 Changes from movements to environmental reclamation provisions are primarily related to the Flin Flon operations, which were fully depreciated as of June 30, 2022, as well as other Manitoba non-operating sites.
Adjusted EBITDA Reconciliation
| |
|
Three Months Ended |
|
| (in $ millions) |
|
Mar. 31, 2024 |
|
|
Dec. 31, 2023 |
|
|
Mar. 31, 2023 |
|
| Net earnings for the period |
|
18.5 |
|
|
33.5 |
|
|
5.4 |
|
| Add back: |
|
|
|
|
|
|
|
|
|
| Tax expense |
|
49.3 |
|
|
47.5 |
|
|
12.0 |
|
| Net finance expense |
|
44.0 |
|
|
48.9 |
|
|
35.0 |
|
| Other expenses |
|
16.3 |
|
|
10.6 |
|
|
5.0 |
|
| Depreciation and amortization |
|
109.3 |
|
|
121.9 |
|
|
67.4 |
|
| Amortization of deferred revenue and variable consideration adjustment |
|
(23.2 |
) |
|
(26.5 |
) |
|
(15.9 |
) |
| Adjusting items (pre-tax): |
|
|
|
|
|
|
|
|
|
| Re-evaluation adjustment - environmental provision |
|
(5.3 |
) |
|
34.0 |
|
|
(8.2 |
) |
| Inventory adjustments |
|
- |
|
|
1.4 |
|
|
- |
|
| Option agreement proceeds |
|
(0.4 |
) |
|
- |
|
|
- |
|
| Share-based compensation expense1 |
|
5.7 |
|
|
3.1 |
|
|
1.2 |
|
| Adjusted EBITDA |
|
214.2 |
|
|
274.4 |
|
|
101.9 |
|
1 Share-based compensation expenses reflected in cost of sales and selling and administrative expenses.
Net Debt Reconciliation
| (in $ thousands) |
|
|
|
| |
|
Mar. 31, 2024 |
|
|
Dec. 31, 2023 |
|
Mar. 31, 2023 |
|
| Total long-term debt |
|
1,278,587 |
|
|
1,287,536 |
|
1,225,023 |
|
| Less: Cash and cash equivalents |
|
284,385 |
|
|
249,794 |
|
255,563 |
|
| Net debt |
|
994,202 |
|
|
1,037,742 |
|
969,460 |
|
| (in $ millions, except net debt to adjusted EBITDA ratio) |
|
|
|
|
|
|
|
|
| Net debt |
|
994.2 |
|
|
1,037.7 |
|
969.5 |
|
| Adjusted EBITDA (12 month period) |
|
760.5 |
|
|
647.8 |
|
467.3 |
|
| Net debt to adjusted EBITDA |
|
1.3 |
|
|
1.6 |
|
2.1 |
|
| Trailing Adjusted EBITDA |
|
Three Months Ended |
|
|
|
|
| (in $ millions) |
|
Mar. 31,
2024 |
|
|
Dec. 31,
2023 |
|
|
Sept. 30,
2023 |
|
|
Jun. 30,
2023 |
|
LTM1 |
| Net earnings (loss) for the period |
|
18.5 |
|
|
33.5 |
|
|
45.5 |
|
|
(14.9 |
) |
|
82.6 |
|
| Add back: |
|
|
|
|
|
|
|
|
|
|
|
|
|
|
|
| Tax expense (recovery) |
|
49.3 |
|
|
47.5 |
|
|
38.7 |
|
|
(15.8 |
) |
|
119.7 |
|
| Net finance expense |
|
44.0 |
|
|
48.9 |
|
|
30.9 |
|
|
30.5 |
|
|
154.3 |
|
| Other expenses |
|
16.3 |
|
|
10.6 |
|
|
8.9 |
|
|
13.9 |
|
|
49.7 |
|
| Depreciation and amortization |
|
109.3 |
|
|
121.9 |
|
|
113.8 |
|
|
88.7 |
|
|
433.7 |
|
| Amortization of deferred revenue and variable consideration adjustment |
|
(23.2 |
) |
|
(26.5 |
) |
|
(16.8 |
) |
|
(18.1 |
) |
|
(84.6 |
) |
| Adjusting items (pre-tax): |
|
|
|
|
|
|
|
|
|
|
|
|
|
|
|
| Re-evaluation adjustment - environmental provision |
|
(5.3 |
) |
|
34.0 |
|
|
(32.4 |
) |
|
(4.7 |
) |
|
(8.4 |
) |
| Inventory adjustments |
|
- |
|
|
1.4 |
|
|
- |
|
|
0.9 |
|
|
2.3 |
|
| Option agreement proceeds |
|
(0.4 |
) |
|
- |
|
|
- |
|
|
- |
|
|
(0.4 |
) |
| Share-based compensation expenses2 |
|
5.7 |
|
|
3.1 |
|
|
2.1 |
|
|
0.7 |
|
|
11.6 |
|
| Adjusted EBITDA |
|
214.2 |
|
|
274.4 |
|
|
190.7 |
|
|
81.2 |
|
|
760.5 |
|
1 LTM (last twelve months) as of March 31, 2024.
2 Share-based compensation expense reflected in cost of sales and administrative expenses.
Copper Cash Cost Reconciliation
| Consolidated |
|
Three Months Ended |
|
| Net pounds of copper produced1 |
|
|
|
|
|
|
|
|
|
| (in thousands) |
|
Mar. 31, 2024 |
|
|
Dec. 31, 2023 |
|
|
Mar. 31, 2023 |
|
| Peru |
|
54,181 |
|
|
73,209 |
|
|
45,233 |
|
| British Columbia2 |
|
15,485 |
|
|
18,755 |
|
|
- |
|
| Manitoba |
|
6,942 |
|
|
8,234 |
|
|
4,508 |
|
| Net pounds of copper produced |
|
76,608 |
|
|
100,198 |
|
|
49,741 |
|
1 Contained copper in concentrate.
2 Includes 100% of Copper Mountain mine production, Hudbay owns 75% of Copper Mountain mine. As Copper Mountain was acquired on June 20, 2023, there were no comparative figures for the period ended March 31, 2023.
| Consolidated |
|
Three Months Ended |
|
| |
|
Mar. 31, 2024 |
|
|
Dec. 31, 2023 |
|
|
Mar. 31, 2023 |
|
| Cash cost per pound of copper produced |
|
$000s |
|
|
$/lb |
|
|
$000s |
|
|
$/lb |
|
|
$000s |
|
|
$/lb |
|
| Mining |
|
102,133 |
|
|
1.33 |
|
|
89,587 |
|
|
0.89 |
|
|
64,538 |
|
|
1.30 |
|
| Milling |
|
83,474 |
|
|
1.09 |
|
|
90,763 |
|
|
0.91 |
|
|
61,039 |
|
|
1.23 |
|
| G&A |
|
38,335 |
|
|
0.50 |
|
|
38,937 |
|
|
0.39 |
|
|
26,555 |
|
|
0.53 |
|
| Onsite costs |
|
223,942 |
|
|
2.92 |
|
|
219,287 |
|
|
2.19 |
|
|
152,132 |
|
|
3.06 |
|
| Treatment & refining |
|
27,664 |
|
|
0.36 |
|
|
35,665 |
|
|
0.36 |
|
|
18,495 |
|
|
0.37 |
|
| Freight & other |
|
27,062 |
|
|
0.36 |
|
|
32,273 |
|
|
0.32 |
|
|
17,776 |
|
|
0.36 |
|
| Cash cost, before by-product credits |
|
278,668 |
|
|
3.64 |
|
|
287,225 |
|
|
2.87 |
|
|
188,403 |
|
|
3.79 |
|
| By-product credits |
|
(266,686 |
) |
|
(3.48 |
) |
|
(271,738 |
) |
|
(2.71 |
) |
|
(146,111 |
) |
|
(2.94 |
) |
| Cash cost, net of by-product credits |
|
11,982 |
|
|
0.16 |
|
|
15,487 |
|
|
0.16 |
|
|
42,292 |
|
|
0.85 |
|
| Consolidated |
|
Three Months Ended |
|
| |
|
Mar. 31, 2024 |
|
|
Dec. 31, 2023 |
|
|
Mar. 31, 2023 |
|
| Supplementary cash cost information |
|
$000s |
|
|
$/lb1 |
|
|
$000s |
|
|
$/lb1 |
|
|
$000s |
|
|
$/lb1 |
|
| By-product credits2: |
|
|
|
|
|
|
|
|
|
|
|
|
|
|
|
|
|
|
| Zinc |
|
14,589 |
|
|
0.19 |
|
|
18,474 |
|
|
0.18 |
|
|
17,374 |
|
|
0.35 |
|
| Gold3 |
|
209,812 |
|
|
2.74 |
|
|
216,178 |
|
|
2.16 |
|
|
93,479 |
|
|
1.88 |
|
| Silver3 |
|
23,039 |
|
|
0.30 |
|
|
22,698 |
|
|
0.23 |
|
|
11,998 |
|
|
0.24 |
|
| Molybdenum & other |
|
19,246 |
|
|
0.25 |
|
|
14,388 |
|
|
0.14 |
|
|
23,260 |
|
|
0.47 |
|
| Total by-product credits |
|
266,686 |
|
|
3.48 |
|
|
271,738 |
|
|
2.71 |
|
|
146,111 |
|
|
2.94 |
|
| Reconciliation to IFRS: |
|
|
|
|
|
|
|
|
|
|
|
|
|
|
|
|
|
|
| Cash cost, net of by-product credits |
|
11,982 |
|
|
|
|
|
15,487 |
|
|
|
|
|
42,292 |
|
|
|
|
| By-product credits |
|
266,686 |
|
|
|
|
|
271,738 |
|
|
|
|
|
146,111 |
|
|
|
|
| Treatment and refining charges |
|
(27,664 |
) |
|
|
|
|
(35,665 |
) |
|
|
|
|
(18,495 |
) |
|
|
|
| Share-based compensation expense |
|
355 |
|
|
|
|
|
301 |
|
|
|
|
|
79 |
|
|
|
|
| Inventory adjustments |
|
(24 |
) |
|
|
|
|
1,402 |
|
|
|
|
|
- |
|
|
|
|
| Change in product inventory |
|
9,554 |
|
|
|
|
|
29,326 |
|
|
|
|
|
(9,409 |
) |
|
|
|
| Royalties |
|
2,873 |
|
|
|
|
|
1,032 |
|
|
|
|
|
706 |
|
|
|
|
| Depreciation and amortization4 |
|
109,273 |
|
|
|
|
|
121,812 |
|
|
|
|
|
67,422 |
|
|
|
|
| Cost of sales |
|
373,035 |
|
|
|
|
|
405,433 |
|
|
|
|
|
228,706 |
|
|
|
|
1 Per pound of copper produced.
2 By-product credits are computed as revenue per consolidated financial statements, amortization of deferred revenue and pricing and volume adjustments.
3 Gold and silver by-product credits do not include variable consideration adjustments with respect to stream arrangements. Variable consideration adjustments are cumulative adjustments to gold and silver stream deferred revenue primarily associated with the net change in mineral reserves and resources or amendments to the mine plan that would change the total expected deliverable ounces under the precious metal streaming arrangement. For the three months ended March 31, 2024 the variable consideration adjustments amounted to an expense of $3,849, the three months ended December 31, 2023 $nil, and for the three months ended March 31, 2023 income of $4,885.
4 Depreciation is based on concentrate sold.
| Peru |
|
Three Months Ended |
|
| (in thousands) |
|
Mar. 31, 2024 |
|
|
Dec. 31, 2023 |
|
|
Mar. 31, 2023 |
|
| Net pounds of copper produced1 |
|
54,181 |
|
|
73,209 |
|
|
45,233 |
|
1 Contained copper in concentrate.
| Peru |
|
Three Months Ended |
|
| |
|
Mar. 31, 2024 |
|
|
Dec. 31, 2023 |
|
|
Mar. 31, 2023 |
|
| Cash cost per pound of copper produced |
|
$000s |
|
|
$/lb |
|
|
$000s |
|
|
$/lb |
|
|
$000s |
|
|
$/lb |
|
| Mining |
|
29,220 |
|
|
0.54 |
|
|
30,336 |
|
|
0.41 |
|
|
26,786 |
|
|
0.59 |
|
| Milling |
|
43,624 |
|
|
0.80 |
|
|
50,199 |
|
|
0.69 |
|
|
46,191 |
|
|
1.03 |
|
| G&A |
|
23,092 |
|
|
0.43 |
|
|
24,909 |
|
|
0.34 |
|
|
16,466 |
|
|
0.36 |
|
| Onsite costs |
|
95,936 |
|
|
1.77 |
|
|
105,444 |
|
|
1.44 |
|
|
89,443 |
|
|
1.98 |
|
| Treatment & refining |
|
14,975 |
|
|
0.28 |
|
|
19,626 |
|
|
0.27 |
|
|
10,603 |
|
|
0.24 |
|
| Freight & other |
|
16,580 |
|
|
0.30 |
|
|
20,854 |
|
|
0.28 |
|
|
12,427 |
|
|
0.27 |
|
| Cash cost, before by-product credits |
|
127,491 |
|
|
2.35 |
|
|
145,924 |
|
|
1.99 |
|
|
112,473 |
|
|
2.49 |
|
| By-product credits |
|
(104,329 |
) |
|
(1.92 |
) |
|
(106,227 |
) |
|
(1.45 |
) |
|
(50,899 |
) |
|
(1.13 |
) |
| Cash cost, net of by-product credits |
|
23,162 |
|
|
0.43 |
|
|
39,697 |
|
|
0.54 |
|
|
61,574 |
|
|
1.36 |
|
| Peru |
|
Three Months Ended |
|
| |
|
Mar. 31, 2024 |
|
|
Dec. 31, 2023 |
|
|
Mar. 31, 2023 |
|
| Supplementary cash cost information |
|
$000s |
|
|
$/lb1 |
|
|
$000s |
|
|
$/lb1 |
|
|
$000s |
|
|
$/lb1 |
|
| By-product credits2: |
|
|
|
|
|
|
|
|
|
|
|
|
|
|
|
|
|
|
| Gold3 |
|
69,533 |
|
|
1.28 |
|
|
77,517 |
|
|
1.05 |
|
|
19,301 |
|
|
0.43 |
|
| Silver3 |
|
15,550 |
|
|
0.29 |
|
|
14,322 |
|
|
0.20 |
|
|
8,577 |
|
|
0.19 |
|
| Molybdenum |
|
19,246 |
|
|
0.35 |
|
|
14,388 |
|
|
0.20 |
|
|
23,021 |
|
|
0.51 |
|
| Total by-product credits |
|
104,329 |
|
|
1.92 |
|
|
106,227 |
|
|
1.45 |
|
|
50,899 |
|
|
1.13 |
|
| Reconciliation to IFRS: |
|
|
|
|
|
|
|
|
|
|
|
|
|
|
|
|
|
|
| Cash cost, net of by-product credits |
|
23,162 |
|
|
|
|
|
39,697 |
|
|
|
|
|
61,574 |
|
|
|
|
| By-product credits |
|
104,329 |
|
|
|
|
|
106,227 |
|
|
|
|
|
50,899 |
|
|
|
|
| Treatment and refining charges |
|
(14,975 |
) |
|
|
|
|
(19,626 |
) |
|
|
|
|
(10,603 |
) |
|
|
|
| Share-based compensation expenses |
|
116 |
|
|
|
|
|
85 |
|
|
|
|
|
(14 |
) |
|
|
|
| Change in product inventory |
|
14,077 |
|
|
|
|
|
8,048 |
|
|
|
|
|
(11,135 |
) |
|
|
|
| Royalties |
|
2,118 |
|
|
|
|
|
1,456 |
|
|
|
|
|
665 |
|
|
|
|
| Depreciation and amortization4 |
|
71,030 |
|
|
|
|
|
85,722 |
|
|
|
|
|
41,960 |
|
|
|
|
| Cost of sales5 |
|
199,857 |
|
|
|
|
|
221,609 |
|
|
|
|
|
133,346 |
|
|
|
|
1 Per pound of copper produced.
2 By-product credits are computed as revenue per consolidated financial statements, including amortization of deferred revenue and pricing and volume adjustments.
3 Gold and silver by-product credits do not include variable consideration adjustments with respect to stream arrangements.
4 Depreciation is based on concentrate sold.
5 As per IFRS consolidated interim financial statements.
| British Columbia |
|
Three Months Ended |
|
| (in thousands) |
|
Mar. 31, 2024 |
|
|
Dec. 31, 2023 |
|
| Net pounds of copper produced1 |
|
15,485 |
|
|
18,755 |
|
1 Contained copper in concentrate.
| British Columbia |
|
Three Months Ended |
|
| |
|
Mar. 31, 2024 |
|
|
Dec. 31, 2023 |
|
| Cash cost per pound of copper produced |
|
$000s |
|
|
$/lb |
|
|
$000s |
|
|
$/lb |
|
| Mining |
|
28,553 |
|
|
1.85 |
|
|
19,015 |
|
|
1.01 |
|
| Milling |
|
23,374 |
|
|
1.51 |
|
|
25,218 |
|
|
1.35 |
|
| G&A |
|
3,897 |
|
|
0.25 |
|
|
5,643 |
|
|
0.30 |
|
| Onsite costs |
|
55,824 |
|
|
3.61 |
|
|
49,876 |
|
|
2.66 |
|
| Treatment & refining |
|
3,476 |
|
|
0.22 |
|
|
4,850 |
|
|
0.26 |
|
| Freight & other |
|
4,293 |
|
|
0.28 |
|
|
4,654 |
|
|
0.25 |
|
| Cash cost, before by-product credits |
|
63,593 |
|
|
4.11 |
|
|
59,380 |
|
|
3.17 |
|
| By-product credits |
|
(9,543 |
) |
|
(0.62 |
) |
|
(9,286 |
) |
|
(0.50 |
) |
| Cash cost, net of by-product credits |
|
54,050 |
|
|
3.49 |
|
|
50,094 |
|
|
2.67 |
|
| British Columbia |
|
Three Months Ended |
|
| |
|
Mar. 31, 2024 |
|
|
Dec. 31, 2023 |
|
| Supplementary cash cost information |
|
$000s |
|
|
$/lb |
|
|
$000s |
|
|
$/lb |
|
| By-product credits2: |
|
|
|
|
|
|
|
|
|
|
|
|
| Gold |
|
7,564 |
|
|
0.49 |
|
|
6,876 |
|
|
0.37 |
|
| Silver |
|
1,979 |
|
|
0.13 |
|
|
2,410 |
|
|
0.13 |
|
| Total by-product credits |
|
9,543 |
|
|
0.62 |
|
|
9,286 |
|
|
0.50 |
|
| Reconciliation to IFRS: |
|
|
|
|
|
|
|
|
|
|
|
|
| Cash cost, net of by-product credits |
|
54,050 |
|
|
|
|
|
50,094 |
|
|
|
|
| By-product credits |
|
9,543 |
|
|
|
|
|
9,286 |
|
|
|
|
| Treatment and refining charges |
|
(3,476 |
) |
|
|
|
|
(4,850 |
) |
|
|
|
| Share-based compensation expenses |
|
5 |
|
|
|
|
|
- |
|
|
|
|
| Change in product inventory |
|
(3,965 |
) |
|
|
|
|
8,469 |
|
|
|
|
| Royalties |
|
755 |
|
|
|
|
|
(424 |
) |
|
|
|
| Depreciation and amortization3 |
|
11,649 |
|
|
|
|
|
5,489 |
|
|
|
|
| Cost of sales4 |
|
68,561 |
|
|
|
|
|
68,064 |
|
|
|
|
1 Per pound of copper produced.
2 By-product credits are computed as revenue per consolidated financial statements, including pricing and volume adjustments.
3 Depreciation is based on concentrate sold.
4 As per consolidated interim financial statements.
Sustaining and All-in Sustaining Cash Cost Reconciliation
| Consolidated |
|
Three Months Ended |
|
| |
|
Mar. 31, 2024 |
|
|
Dec. 31, 2023 |
|
|
Mar. 31, 2023 |
|
| All-in sustaining cash cost per pound of copper produced |
|
$000s |
|
|
$/lb |
|
|
$000s |
|
|
$/lb |
|
|
$000s |
|
|
$/lb |
|
| Cash cost, net of by-product credits |
|
11,982 |
|
|
0.16 |
|
|
15,487 |
|
|
0.16 |
|
|
42,292 |
|
|
0.85 |
|
| Cash sustaining capital expenditures |
|
62,314 |
|
|
0.80 |
|
|
87,609 |
|
|
0.87 |
|
|
47,869 |
|
|
0.96 |
|
| Capitalized exploration |
|
2,100 |
|
|
0.03 |
|
|
5,150 |
|
|
0.05 |
|
|
- |
|
|
- |
|
| Royalties |
|
2,873 |
|
|
0.04 |
|
|
1,032 |
|
|
0.01 |
|
|
706 |
|
|
0.02 |
|
| Sustaining cash cost, net of by-product credits |
|
79,269 |
|
|
1.03 |
|
|
109,278 |
|
|
1.09 |
|
|
90,867 |
|
|
1.83 |
|
| Corporate selling and administrative expenses & regional costs |
|
18,094 |
|
|
0.24 |
|
|
12,727 |
|
|
0.13 |
|
|
10,215 |
|
|
0.20 |
|
| Accretion and amortization of decommissioning and community agreements1 |
|
4,007 |
|
|
0.05 |
|
|
8,967 |
|
|
0.09 |
|
|
1,958 |
|
|
0.04 |
|
| All-in sustaining cash cost, net of by-product credits |
|
101,370 |
|
|
1.32 |
|
|
130,972 |
|
|
1.31 |
|
|
103,040 |
|
|
2.07 |
|
| Reconciliation to property, plant and equipment additions: |
|
|
|
|
|
|
|
|
|
|
|
|
|
|
|
|
|
|
| Property, plant and equipment additions |
|
46,220 |
|
|
|
|
|
54,040 |
|
|
|
|
|
33,554 |
|
|
|
|
| Capitalized stripping net additions |
|
31,983 |
|
|
|
|
|
40,861 |
|
|
|
|
|
26,984 |
|
|
|
|
| Total accrued capital additions |
|
78,203 |
|
|
|
|
|
94,901 |
|
|
|
|
|
60,538 |
|
|
|
|
| Less other non-sustaining capital costs2 |
|
26,982 |
|
|
|
|
|
19,945 |
|
|
|
|
|
19,850 |
|
|
|
|
| Total sustaining capital costs |
|
51,221 |
|
|
|
|
|
74,956 |
|
|
|
|
|
40,688 |
|
|
|
|
| Capitalized lease an equipment financing payments |
|
8,274 |
|
|
|
|
|
8,708 |
|
|
|
|
|
4,702 |
|
|
|
|
| Community agreement cash payments |
|
800 |
|
|
|
|
|
2,274 |
|
|
|
|
|
1,189 |
|
|
|
|
| Accretion and amortization of decommissioning and restoration obligations3 |
|
2,019 |
|
|
|
|
|
1,671 |
|
|
|
|
|
1,290 |
|
|
|
|
| Cash sustaining capital expenditures |
|
62,314 |
|
|
|
|
|
87,609 |
|
|
|
|
|
47,869 |
|
|
|
|
1 Includes accretion of decommissioning relating to non-productive sites, and accretion and amortization of current community agreements capitalized to Other assets.
2 Other non-sustaining capital costs include Arizona capitalized costs, capitalized interest, capitalized exploration, right-of-use lease asset additions, equipment financing asset additions and growth capital expenditures.
3 Includes amortization of decommissioning and restoration PP&E assets and accretion of decommissioning and restoration liabilities related to producing sites.
| Peru |
|
Three Months Ended |
|
| |
|
Mar. 31, 2024 |
Dec. 31, 2023 |
|
Mar. 31, 2023 |
|
| Sustaining cash cost per pound of copper produced |
|
$000s |
|
|
$/lb |
|
|
$000s |
|
|
$/lb |
|
|
$000s |
|
|
$/lb |
|
| Cash cost, net of by-product credits |
|
23,162 |
|
|
0.43 |
|
|
39,697 |
|
|
0.54 |
|
|
61,574 |
|
|
1.36 |
|
| Cash sustaining capital expenditures |
|
29,779 |
|
|
0.55 |
|
|
42,351 |
|
|
0.58 |
|
|
33,564 |
|
|
0.74 |
|
| Capitalized exploration1 |
|
2,100 |
|
|
0.04 |
|
|
5,150 |
|
|
0.07 |
|
|
- |
|
|
- |
|
| Royalties |
|
2,118 |
|
|
0.04 |
|
|
1,456 |
|
|
0.02 |
|
|
665 |
|
|
0.02 |
|
| Sustaining cash cost per pound of copper produced |
|
57,159 |
|
|
1.06 |
|
|
88,654 |
|
|
1.21 |
|
|
95,803 |
|
|
2.12 |
|
1 Only includes exploration costs incurred for locations near to existing mine operations.
| British Columbia |
|
Three Months Ended1 |
|
| |
|
Mar. 31, 2024 |
|
|
Dec. 31, 2023 |
|
| Sustaining cash cost per pound of copper produced |
|
$000s |
|
|
$/lb |
|
|
$000s |
|
|
$/lb |
|
| Cash cost, net of by-product credits |
|
54,050 |
|
|
3.49 |
|
|
50,094 |
|
|
2.67 |
|
| Royalties |
|
20,361 |
|
|
1.31 |
|
|
24,063 |
|
|
1.28 |
|
| Cash sustaining capital expenditures |
|
755 |
|
|
0.05 |
|
|
(424 |
) |
|
(0.02 |
) |
| Sustaining cash cost per pound of copper produced |
|
75,166 |
|
|
4.85 |
|
|
73,733 |
|
|
3.93 |
|
1 As Copper Mountain was acquired on June 20, 2023, there were no comparative figures for the three months ended March 31, 2023.
Gold Cash Cost and Sustaining Cash Cost Reconciliation
| Manitoba |
|
Three Months Ended |
|
| (in thousands) |
|
Mar. 31, 2024 |
|
|
Dec. 31, 2023 |
|
|
Mar. 31, 2023 |
|
| Net ounces of gold produced1 |
|
56,831 |
|
|
59,683 |
|
|
36,034 |
|
1 Contained gold in concentrate and doré.
| Manitoba |
|
Three Months Ended |
|
| |
|
Mar. 31, 2024 |
|
|
Dec. 31, 2023 |
|
|
Mar. 31, 2023 |
|
| Cash cost per ounce of gold produced |
|
$000s |
|
|
$/oz |
|
|
$000s |
|
|
$/oz |
|
|
$000s |
|
|
$/oz |
|
| Mining |
|
44,360 |
|
|
780 |
|
|
40,236 |
|
|
673 |
|
|
37,752 |
|
|
1,048 |
|
| Milling |
|
16,476 |
|
|
290 |
|
|
15,346 |
|
|
256 |
|
|
14,848 |
|
|
412 |
|
| G&A |
|
11,346 |
|
|
200 |
|
|
8,385 |
|
|
140 |
|
|
10,089 |
|
|
280 |
|
| Onsite costs |
|
72,182 |
|
|
1,270 |
|
|
63,967 |
|
|
1,069 |
|
|
62,689 |
|
|
1,740 |
|
| Treatment & refining |
|
9,213 |
|
|
162 |
|
|
11,189 |
|
|
186 |
|
|
7,892 |
|
|
219 |
|
| Freight & other |
|
6,189 |
|
|
109 |
|
|
6,765 |
|
|
113 |
|
|
5,349 |
|
|
148 |
|
| Cash cost, before by-product credits |
|
87,584 |
|
|
1,541 |
|
|
81,921 |
|
|
1,368 |
|
|
75,930 |
|
|
2,107 |
|
| By-product credits |
|
(45,734 |
) |
|
(805 |
) |
|
(55,928 |
) |
|
(934 |
) |
|
(42,131 |
) |
|
(1,169 |
) |
| Gold cash cost, net of by-product credits |
|
41,850 |
|
|
736 |
|
|
25,993 |
|
|
434 |
|
|
33,799 |
|
|
938 |
|
| Manitoba |
|
Three Months Ended |
|
| |
|
Mar. 31, 2024 |
|
|
Dec. 31, 2023 |
|
|
Mar. 31, 2023 |
|
| Supplementary cash cost information |
|
$000s |
|
|
$/oz1 |
|
|
$000s |
|
|
$/oz1 |
|
|
$000s |
|
|
$/oz1 |
|
| By-product credits2: |
|
|
|
|
|
|
|
|
|
|
|
|
|
|
|
|
|
|
| Copper |
|
25,635 |
|
|
451 |
|
|
31,489 |
|
|
526 |
|
|
21,097 |
|
|
585 |
|
| Zinc |
|
14,588 |
|
|
257 |
|
|
18,473 |
|
|
308 |
|
|
17,374 |
|
|
482 |
|
| Silver3 |
|
5,510 |
|
|
97 |
|
|
5,966 |
|
|
100 |
|
|
3,421 |
|
|
95 |
|
| Other |
|
- |
|
|
- |
|
|
- |
|
|
- |
|
|
239 |
|
|
7 |
|
| Total by-product credits |
|
45,734 |
|
|
805 |
|
|
55,928 |
|
|
934 |
|
|
42,131 |
|
|
1,169 |
|
| Reconciliation to IFRS: |
|
|
|
|
|
|
|
|
|
|
|
|
|
|
|
|
|
|
| Cash cost, net of by-product credits |
|
41,850 |
|
|
|
|
|
25,993 |
|
|
|
|
|
33,799 |
|
|
|
|
| By-product credits |
|
45,734 |
|
|
|
|
|
55,928 |
|
|
|
|
|
42,131 |
|
|
|
|
| Treatment and refining charges |
|
(9,213 |
) |
|
|
|
|
(11,189 |
) |
|
|
|
|
(7,892 |
) |
|
|
|
| Inventory adjustments |
|
(24 |
) |
|
|
|
|
1,402 |
|
|
|
|
|
- |
|
|
|
|
| Share-based compensation expenses |
|
234 |
|
|
|
|
|
216 |
|
|
|
|
|
93 |
|
|
|
|
| Change in product inventory |
|
(558 |
) |
|
|
|
|
12,809 |
|
|
|
|
|
1,726 |
|
|
|
|
| Royalties |
|
- |
|
|
|
|
|
- |
|
|
|
|
|
41 |
|
|
|
|
| Depreciation and amortization4 |
|
26,594 |
|
|
|
|
|
30,601 |
|
|
|
|
|
25,462 |
|
|
|
|
| Cost of sales5 |
|
104,617 |
|
|
|
|
|
115,760 |
|
|
|
|
|
95,360 |
|
|
|
|
1 Per ounce of gold produced.
2 By-product credits are computed as revenue per consolidated interim financial statements, amortization of deferred revenue and pricing and volume adjustments.
3 Silver by-product credits do not include variable consideration adjustments with respect to stream arrangements.
4 Depreciation is based on concentrate sold.
5 As per IFRS consolidated interim financial statements.
| Manitoba |
|
Three Months Ended |
|
| |
|
Mar. 31, 2024 |
|
|
Dec. 31, 2023 |
|
|
Mar. 31, 2023 |
|
| Sustaining cash cost per pound of gold produced |
|
$000s |
|
|
$/oz |
|
|
$000s |
|
|
$/oz |
|
|
$000s |
|
|
$/oz |
|
| Gold cash cost, net of by-product credits |
|
41,850 |
|
|
736 |
|
|
25,993 |
|
|
434 |
|
|
33,799 |
|
|
938 |
|
| Cash sustaining capital expenditures |
|
12,173 |
|
|
214 |
|
|
21,195 |
|
|
354 |
|
|
14,304 |
|
|
397 |
|
| Royalties |
|
- |
|
|
- |
|
|
- |
|
|
- |
|
|
41 |
|
|
1 |
|
| Sustaining cash cost per pound of gold produced |
|
54,023 |
|
|
950 |
|
|
47,188 |
|
|
788 |
|
|
48,144 |
|
|
1,336 |
|
Combined Unit Cost Reconciliation
| Peru |
|
Three Months Ended |
|
| (in thousands except ore tonnes milled and unit cost per tonne) |
|
| Combined unit cost per tonne processed |
|
Mar. 31, 2024 |
|
|
Dec. 31, 2023 |
|
|
Mar. 31, 2023 |
|
| Mining |
|
29,220 |
|
|
30,336 |
|
|
26,786 |
|
| Milling |
|
43,624 |
|
|
50,199 |
|
|
46,191 |
|
| G&A1 |
|
23,092 |
|
|
24,909 |
|
|
16,466 |
|
| Other G&A2 |
|
(7,688 |
) |
|
(8,303 |
) |
|
(1,539 |
) |
| Unit Cost |
|
88,248 |
|
|
97,141 |
|
|
87,904 |
|
| Tonnes ore milled |
|
8,078 |
|
|
7,939 |
|
|
7,664 |
|
| Combined unit cost per tonne |
|
10.92 |
|
|
12.24 |
|
|
11.47 |
|
| Reconciliation to IFRS: |
|
|
|
|
|
|
|
|
|
| Unit cost |
|
88,248 |
|
|
97,141 |
|
|
87,904 |
|
| Freight & other |
|
16,580 |
|
|
20,854 |
|
|
12,427 |
|
| Other G&A |
|
7,688 |
|
|
8,303 |
|
|
1,539 |
|
| Share-based compensation expenses |
|
116 |
|
|
85 |
|
|
(14 |
) |
| Change in product inventory |
|
14,077 |
|
|
8,048 |
|
|
(11,135 |
) |
| Royalties |
|
2,118 |
|
|
1,456 |
|
|
665 |
|
| Depreciation and amortization |
|
71,030 |
|
|
85,722 |
|
|
41,960 |
|
| Cost of sales3 |
|
199,857 |
|
|
221,609 |
|
|
133,346 |
|
1 G&A as per cash cost reconciliation above.
2 Other G&A primarily includes profit sharing costs.
3 As per IFRS consolidated interim financial statements.
| Manitoba |
|
Three Months Ended |
|
| (in thousands except tonnes ore milled and unit cost per tonne) |
|
| Combined unit cost per tonne processed |
|
Mar. 31, 2024 |
|
|
Dec. 31, 2023 |
|
|
Mar. 31, 2023 |
|
| Mining |
|
44,360 |
|
|
40,236 |
|
|
37,752 |
|
| Milling |
|
16,476 |
|
|
15,346 |
|
|
14,848 |
|
| G&A1 |
|
11,346 |
|
|
8,385 |
|
|
10,089 |
|
| Less: Other G&A related to profit sharing costs |
|
(4,131 |
) |
|
(1,522 |
) |
|
(1,139 |
) |
| Unit cost |
|
68,051 |
|
|
62,445 |
|
|
61,550 |
|
| USD/CAD implicit exchange rate |
|
1.35 |
|
|
1.36 |
|
|
1.35 |
|
| Unit cost - C$ |
|
91,748 |
|
|
85,013 |
|
|
83,193 |
|
| Tonnes ore milled |
|
389,767 |
|
|
393,837 |
|
|
385,661 |
|
| Combined unit cost per tonne - C$ |
|
235 |
|
|
216 |
|
|
216 |
|
| Reconciliation to IFRS: |
|
|
|
|
|
|
|
|
|
| Unit cost |
|
68,051 |
|
|
62,445 |
|
|
61,550 |
|
| Freight & other |
|
6,189 |
|
|
6,765 |
|
|
5,349 |
|
| Other G&A related to profit sharing |
|
4,131 |
|
|
1,522 |
|
|
1,139 |
|
| Share-based compensation expenses |
|
234 |
|
|
216 |
|
|
93 |
|
| Inventory adjustments |
|
(24 |
) |
|
1,402 |
|
|
- |
|
| Change in product inventory |
|
(558 |
) |
|
12,809 |
|
|
1,726 |
|
| Royalties |
|
- |
|
|
- |
|
|
41 |
|
| Depreciation and amortization |
|
26,594 |
|
|
30,601 |
|
|
25,462 |
|
| Cost of sales2 |
|
104,617 |
|
|
115,760 |
|
|
95,360 |
|
1 G&A as per cash cost reconciliation above.
2 As per IFRS consolidated interim financial statements.
| British Columbia |
|
Three Months Ended |
|
| Combined unit cost per tonne processed |
|
Mar. 31, 2024 |
|
|
Dec. 31, 2023 |
|
| Mining |
|
28,553 |
|
|
19,015 |
|
| Milling |
|
23,374 |
|
|
25,218 |
|
| G&A1 |
|
3,897 |
|
|
5,643 |
|
| Unit cost |
|
55,824 |
|
|
49,876 |
|
| USD/CAD implicit exchange rate |
|
1.35 |
|
|
1.37 |
|
| Unit cost - C$ |
|
75,282 |
|
|
68,168 |
|
| Tonnes ore milled |
|
3,180 |
|
|
3,262 |
|
| Combined unit cost per tonne - C$ |
|
23.67 |
|
|
20.90 |
|
| Reconciliation to IFRS: |
|
|
|
|
|
|
| Unit cost |
|
55,824 |
|
|
49,876 |
|
| Freight & other |
|
4,293 |
|
|
4,654 |
|
| Share-based compensation expenses |
|
5 |
|
|
- |
|
| Change in product inventory |
|
(3,965 |
) |
|
8,469 |
|
| Royalties |
|
755 |
|
|
(424 |
) |
| Depreciation and amortization |
|
11,649 |
|
|
5,489 |
|
| Cost of sales2 |
|
68,561 |
|
|
68,064 |
|
1 G&A as per cash cost reconciliation above
2 Other G&A primarily includes profit sharing costs.
3 As per consolidated financial statements.
4 As Copper Mountain was acquired on June 20 2023, there were no comparative figures for the three months ended March 31, 2023.
Forward-Looking Information
This news release contains forward-looking information within the meaning of applicable Canadian and United States securities legislation. All information contained in this news release, other than statements of current and historical fact, is forward-looking information. Often, but not always, forward-looking information can be identified by the use of words such as "plans", "expects", "budget", "guidance", "scheduled", "estimates", "forecasts", "strategy", "target", "intends", "objective", "goal", "understands", "anticipates" and "believes" (and variations of these or similar words) and statements that certain actions, events or results "may", "could", "would", "should", "might" "occur" or "be achieved" or "will be taken" (and variations of these or similar expressions). All of the forward-looking information in this news release is qualified by this cautionary note.
Forward-looking information includes, but is not limited to, statements with respect to the company's production, cost and capital and exploration expenditure guidance, expectations regarding reductions in discretionary spending and capital expenditures, the ability of the company to stabilize and optimize the Copper Mountain mine operation and achieve operating synergies, the fleet production ramp up plan and the accelerated stripping strategies at the Copper Mountain site, the ability of the company to complete business integration activities at the Copper Mountain mine, the estimated timelines and pre-requisites for sanctioning the Copper World project and the pursuit of a potential minority joint venture partner, expectations regarding the permitting requirements for the Copper World project (including expected timing for receipt of such applicable permits), the expected benefits of Manitoba growth initiatives, including the advancement of and timeline for the development and exploration drift at the 1901 deposit, the benefits and results of the option agreement entered into with Marubeni Corporation, the company's future deleveraging strategies and the company's ability to deleverage and repay debt as needed, expectations regarding the company's cash balance and liquidity, the company's ability to increase the mining rate at Lalor, the anticipated benefits from completing the Stall recovery improvement program, expectations regarding the ability to conduct exploration work and execute on exploration programs on its properties and to advance related drill plans, including the advancement of the exploration program at Maria Reyna and Caballito and the status of the related drill permit application process, the ability to continue mining higher-grade ore in the Pampacancha pit and the company's expectations resulting therefrom, expectations regarding the ability for the company to further reduce greenhouse gas emissions, the company's evaluation and assessment of opportunities to reprocess tailings using various metallurgical technologies, expectations regarding the prospective nature of the Maria Reyna and Caballito properties, the anticipated impact of brownfield and greenfield growth projects on the company's performance, anticipated expansion opportunities and extension of mine life in Snow Lake and the ability for Hudbay to find a new anchor deposit near the company's Snow Lake operations, anticipated future drill programs and exploration activities and any results expected therefrom, anticipated mine plans, anticipated metals prices and the anticipated sensitivity of the company's financial performance to metals prices, events that may affect its operations and development projects, anticipated cash flows from operations and related liquidity requirements, the anticipated effect of external factors on revenue, such as commodity prices, estimation of mineral reserves and resources, mine life projections, reclamation costs, economic outlook, government regulation of mining operations, and business and acquisition strategies. Forward-looking information is not, and cannot be, a guarantee of future results or events. Forward-looking information is based on, among other things, opinions, assumptions, estimates and analyses that, while considered reasonable by the company at the date the forward-looking information is provided, inherently are subject to significant risks, uncertainties, contingencies and other factors that may cause actual results and events to be materially different from those expressed or implied by the forward-looking information.
The material factors or assumptions that Hudbay has identified and were applied in drawing conclusions or making forecasts or projections set out in the forward-looking information include, but are not limited to:
- the ability to achieve production, cost and capital and exploration expenditure guidance;
- the ability to achieve discretionary spending reductions without impacting operations;
- no significant interruptions to operations due to social or political unrest in the regions Hudbay operates, including the navigation of the complex political and social environment in Peru;
- no interruptions to the company's plans for advancing the Copper World project, including with respect to timely receipt of applicable permits and the pursuit of a potential joint venture partner;
- the ability for the company to successfully complete the integration and optimization of the Copper Mountain operations, achieve operating synergies and develop and maintain good relations with key stakeholders;
- the ability to execute on its exploration plans and to advance related drill plans;
- the ability to advance the exploration program at Maria Reyna and Caballito;
- the success of mining, processing, exploration and development activities;
- the scheduled maintenance and availability of the company's processing facilities;
- the accuracy of geological, mining and metallurgical estimates;
- anticipated metals prices and the costs of production;
- the supply and demand for metals the company produces;
- the supply and availability of all forms of energy and fuels at reasonable prices;
- no significant unanticipated operational or technical difficulties;
- no significant interruptions to operations due to adverse effects from extreme weather events, including the current forest fire in the Flin Flon region and potential seasonal forest fires that may affect the regions in which the company operates;
- the execution of the company's business and growth strategies, including the success of its strategic investments and initiatives;
- the availability of additional financing, if needed;
- the company's ability to deleverage and repay debt as needed;
- the ability to complete project targets on time and on budget and other events that may affect the company's ability to develop its projects;
- the timing and receipt of various regulatory and governmental approvals;
- the availability of personnel for the company's exploration, development and operational projects and ongoing employee relations;
- maintaining good relations with the employees at the company's operations;
- maintaining good relations with the labour unions that represent certain of the company's employees in Manitoba and Peru;
- maintaining good relations with the communities in which the company operates, including the neighbouring Indigenous communities and local governments;
- no significant unanticipated challenges with stakeholders at the company's various projects;
- no significant unanticipated events or changes relating to regulatory, environmental, health and safety matters;
- no contests over title to the company's properties, including as a result of rights or claimed rights of Indigenous peoples or challenges to the validity of the company's unpatented mining claims;
- the timing and possible outcome of pending litigation and no significant unanticipated litigation;
- certain tax matters, including, but not limited to current tax laws and regulations, changes in taxation policies and the refund of certain value added taxes from the Canadian and Peruvian governments; and
- no significant and continuing adverse changes in general economic conditions or conditions in the financial markets (including commodity prices and foreign exchange rates).
The risks, uncertainties, contingencies and other factors that may cause actual results to differ materially from those expressed or implied by the forward-looking information may include, but are not limited to, risks related to the ongoing business integration of Copper Mountain and the process for designing, implementing and maintaining effective internal controls for Copper Mountain, the failure to effectively complete the integration and optimization of the Copper Mountain operations or to achieve anticipated operating synergies, political and social risks in the regions Hudbay operates, including the navigation of the complex political and social environment in Peru, risks generally associated with the mining industry and the current geopolitical environment, including future commodity prices, currency and interest rate fluctuations, energy and consumable prices, supply chain constraints and general cost escalation in the current inflationary environment, risks related to the renegotiation of collective bargaining agreements with the labour unions representing certain of the company's employees in Manitoba and Peru, uncertainties related to the development and operation of the company's projects, the risk of an indicator of impairment or impairment reversal relating to a material mineral property, risks related to the Copper World project, including in relation to permitting, project delivery and financing risks, risks related to the Lalor mine plan, including the ability to convert inferred mineral resource estimates to higher confidence categories, dependence on key personnel and employee and union relations, risks related to political or social instability, unrest or change, risks in respect of Indigenous and community relations, rights and title claims, risks related to extreme weather events, including risks arising from the current forest fire in the Flin Flon region, potential seasonal forest fires that may affect the regions in which the company operates and other severe storms, operational risks and hazards, including the cost of maintaining and upgrading the company's tailings management facilities and any unanticipated environmental, industrial and geological events and developments and the inability to insure against all risks, failure of plant, equipment, processes, transportation and other infrastructure to operate as anticipated, compliance with government and environmental regulations, including permitting requirements and anti-bribery legislation, depletion of the company's reserves, volatile financial markets and interest rates that may affect the company's ability to obtain additional financing on acceptable terms, the failure to obtain required approvals or clearances from government authorities on a timely basis, uncertainties related to the geology, continuity, grade and estimates of mineral reserves and resources, and the potential for variations in grade and recovery rates, uncertain costs of reclamation activities, the company's ability to comply with its pension and other post-retirement obligations, the company's ability to abide by the covenants in its debt instruments and other material contracts, tax refunds, hedging transactions, as well as the risks discussed under the heading "Risk Factors" in the company's most recent Annual Information Form and under the heading "Financial Risk Management" in the company's most recent management's discussion and analysis, each of which is available on the company's SEDAR+ profile at www.sedarplus.ca and the company's EDGAR profile at www.sec.gov.
Should one or more risk, uncertainty, contingency or other factor materialize or should any factor or assumption prove incorrect, actual results could vary materially from those expressed or implied in the forward-looking information. Accordingly, you should not place undue reliance on forward-looking information. Hudbay does not assume any obligation to update or revise any forward-looking information after the date of this news release or to explain any material difference between subsequent actual events and any forward-looking information, except as required by applicable law.
Note to United States Investors
This news release has been prepared in accordance with the requirements of the securities laws in effect in Canada, which may differ materially from the requirements of United States securities laws applicable to U.S. issuers.
About Hudbay
Hudbay (TSX, NYSE: HBM) is a copper-focused mining company with three long-life operations and a world-class pipeline of copper growth projects in tier-one mining-friendly jurisdictions of Canada, Peru and the United States.
Hudbay's operating portfolio includes the Constancia mine in Cusco (Peru), the Snow Lake operations in Manitoba (Canada) and the Copper Mountain mine in British Columbia (Canada). Copper is the primary metal produced by the company, which is complemented by meaningful gold production. Hudbay's growth pipeline includes the Copper World project in Arizona (United States), the Mason project in Nevada (United States), the Llaguen project in La Libertad (Peru) and several expansion and exploration opportunities near its existing operations.
The value Hudbay creates and the impact it has is embodied in its purpose statement: "We care about our people, our communities and our planet. Hudbay provides the metals the world needs. We work sustainably, transform lives and create better futures for communities." Hudbay's mission is to create sustainable value and strong returns by leveraging its core strengths in community relations, focused exploration, mine development and efficient operations.
For further information, please contact:
Candace Brûlé
Vice President, Investor Relations
(416) 814-4387
investor.relations@hudbay.com
____________________
i Adjusted net earnings (loss) and adjusted net earnings (loss) per share; adjusted EBITDA; cash cost, sustaining cash cost and all-in sustaining cash cost per pound of copper produced, net of by-product credits; cash cost and sustaining cash cost per ounce of gold produced, net of by-product credits; combined unit costs, net debt and any ratios based on these measures are non-IFRS financial performance measures with no standardized definition under IFRS. For further information and a detailed reconciliation, please see the "Non-IFRS Financial Performance Measures" section of this news release.
ii Calculated using the mid-point of the guidance range.
iii Sourced from S&P Global, August 2023.
FORM 52-109F2
CERTIFICATION OF INTERIM FILINGS
FULL CERTIFICATE
I, Peter Kukielski, President and Chief Executive Officer of Hudbay Minerals Inc., certify the following:
1. Review: I have reviewed the interim financial report and interim MD&A (together, the "interim filings") of Hudbay Minerals Inc. (the "issuer") for the interim period ended March 31, 2024.
2. No misrepresentations: Based on my knowledge, having exercised reasonable diligence, the interim filings do not contain any untrue statement of a material fact or omit to state a material fact required to be stated or that is necessary to make a statement not misleading in light of the circumstances under which it was made, with respect to the period covered by the interim filings.
3. Fair presentation: Based on my knowledge, having exercised reasonable diligence, the interim financial report together with the other financial information included in the interim filings fairly present in all material respects the financial condition, financial performance and cash flows of the issuer, as of the date of and for the periods presented in the interim filings.
4. Responsibility: The issuer's other certifying officer and I are responsible for establishing and maintaining disclosure controls and procedures (DC&P) and internal control over financial reporting (ICFR), as those terms are defined in National Instrument 52-109 Certification of Disclosure in Issuers' Annual and Interim Filings, for the issuer.
5. Design: Subject to the limitations, if any, described in paragraphs 5.2 and 5.3, the issuer's other certifying officer and I have, as at the end of the period covered by the interim filings
(a) designed DC&P, or caused it to be designed under our supervision, to provide reasonable assurance that
(i) material information relating to the issuer is made known to us by others, particularly during the period in which the interim filings are being prepared; and
(ii) information required to be disclosed by the issuer in its annual filings, interim filings or other reports filed or submitted by it under securities legislation is recorded, processed, summarized and reported within the time periods specified in securities legislation; and
(b) designed ICFR, or caused it to be designed under our supervision, to provide reasonable assurance regarding the reliability of financial reporting and the preparation of financial statements for external purposes in accordance with the issuer's GAAP.
5.1 Control framework: The control framework the issuer's other certifying officer and I used to design the issuer's ICFR is the Internal Control - Integrated Framework (2013) issued by the Committee of Sponsoring Organizations of the Treadway Commission.
5.2 N/A
5.3 Limitation on scope of design: The issuer has disclosed in its interim MD&A (a) the fact that the issuer's other certifying officer and I have limited the scope of our design of DC&P and ICFR to exclude controls, policies and procedures of a business that the issuer acquired not more than 365 days before the last day of the period covered by the interim filings and (b) summary financial information about the business that the issuer acquired that has been consolidated in the issuer's financial statements.
6. Reporting changes in ICFR: The issuer has disclosed in its interim MD&A any change in the issuer's ICFR that occurred during the period beginning on January 1, 2024 and ended on March 31, 2024 that has materially affected, or is reasonably likely to materially affect, the issuer's ICFR.
Date: May 14, 2024
| (signed) "Peter Kukielski" |
|
|
|
| Peter Kukielski |
|
|
|
| President and Chief Executive Officer |
|
|
|
FORM 52-109F2
CERTIFICATION OF INTERIM FILINGS
FULL CERTIFICATE
I, Eugene Lei, Chief Financial Officer of Hudbay Minerals Inc., certify the following:
1. Review: I have reviewed the interim financial report and interim MD&A (together, the "interim filings") of Hudbay Minerals Inc. (the "issuer") for the interim period ended March 31, 2024.
2. No misrepresentations: Based on my knowledge, having exercised reasonable diligence, the interim filings do not contain any untrue statement of a material fact or omit to state a material fact required to be stated or that is necessary to make a statement not misleading in light of the circumstances under which it was made, with respect to the period covered by the interim filings.
3. Fair presentation: Based on my knowledge, having exercised reasonable diligence, the interim financial report together with the other financial information included in the interim filings fairly present in all material respects the financial condition, financial performance and cash flows of the issuer, as of the date of and for the periods presented in the interim filings.
4. Responsibility: The issuer's other certifying officer and I are responsible for establishing and maintaining disclosure controls and procedures (DC&P) and internal control over financial reporting (ICFR), as those terms are defined in National Instrument 52-109 Certification of Disclosure in Issuers' Annual and Interim Filings, for the issuer.
5. Design: Subject to the limitations, if any, described in paragraphs 5.2 and 5.3, the issuer's other certifying officer and I have, as at the end of the period covered by the interim filings
(a) designed DC&P, or caused it to be designed under our supervision, to provide reasonable assurance that
(i) material information relating to the issuer is made known to us by others, particularly during the period in which the interim filings are being prepared; and
(ii) information required to be disclosed by the issuer in its annual filings, interim filings or other reports filed or submitted by it under securities legislation is recorded, processed, summarized and reported within the time periods specified in securities legislation; and
(b) designed ICFR, or caused it to be designed under our supervision, to provide reasonable assurance regarding the reliability of financial reporting and the preparation of financial statements for external purposes in accordance with the issuer's GAAP.
5.1 Control framework: The control framework the issuer's other certifying officer and I used to design the issuer's ICFR is the Internal Control - Integrated Framework (2013) issued by the Committee of Sponsoring Organizations of the Treadway Commission.
5.2 N/A
5.3 Limitation on scope of design: The issuer has disclosed in its interim MD&A (a) the fact that the issuer's other certifying officer and I have limited the scope of our design of DC&P and ICFR to exclude controls, policies and procedures of a business that the issuer acquired not more than 365 days before the last day of the period covered by the interim filings and (b) summary financial information about the business that the issuer acquired that has been consolidated in the issuer's financial statements.
6. Reporting changes in ICFR: The issuer has disclosed in its interim MD&A any change in the issuer's ICFR that occurred during the period beginning on January 1, 2024 and ended on March 31, 2024 that has materially affected, or is reasonably likely to materially affect, the issuer's ICFR.
Date: May 14, 2024
| (signed) "Eugene Lei" |
|
|
|
| Eugene Lei |
|
|
|
| Chief Financial Officer |
|
|
|
HudBay Minerals (NYSE:HBM)
Graphique Historique de l'Action
De Mai 2024 à Juin 2024

HudBay Minerals (NYSE:HBM)
Graphique Historique de l'Action
De Juin 2023 à Juin 2024
