Allied Properties Real Estate Investment Trust Announces Fourth-Quarter and Year-End Results With Continuing Growth in FFO an...
04 Mars 2014 - 9:34PM
Marketwired Canada
Allied Properties REIT (TSX:AP.UN) today announced results for its fourth
quarter and year ended December 31, 2013. "It was all about execution and
financial discipline," said Michael Emory, President and CEO. "We delivered FFO
and AFFO per unit growth of 8% and 16% in 2013, pushing our FFO and AFFO pay-out
ratios for the year down to 70% and 82%. This enabled us at year-end to increase
our annual distribution by 4% to $1.41 per unit. We also continued our
unwavering commitment to the balance sheet by further improving our debt ratios,
interest coverage ratios and immediate and near-term liquidity."


The results for the fourth quarter are summarized below and compared to the same
quarter in 2012:


(In thousands except for per unit and %
 amounts)                                Q4 2013  Q4 2012   CHANGE  % CHANGE
----------------------------------------------------------------------------

Net income                                31,169   25,524    5,645     22.1%
Same-asset net operating income ("NOI")   40,701   36,676    4,025     11.0%
Funds from operations ("FFO")             34,796   28,020    6,776     24.2%
FFO per unit (diluted)                     $0.51    $0.45    $0.06     13.3%
FFO pay-out ratio                          67.7%    73.2%   (5.5%)
Adjusted FFO ("AFFO")                     29,506   23,430    6,076     25.9%
AFFO per unit (diluted)                    $0.43    $0.38    $0.05     13.2%
AFFO pay-out ratio                         79.8%    87.5%   (7.7%)
Total debt as a % of fair value of
 investment properties                     35.7%    36.4%   (0.7%)
Net debt as a multiple of annualized Q4
 EBITDA                                    6.3:1    6.5:1  (0.2:1)
Operating interest-coverage ratio          4.1:1    3.7:1    0.4:1
Total interest-coverage ratio              3.0:1    2.8:1    0.2:1
----------------------------------------------------------------------------


The results for the year ended December 31, 2013, are summarized below and
compared to the same period in 2012:


(In thousands except for per unit
 and % amounts)                           2013      2012    CHANGE  % CHANGE
----------------------------------------------------------------------------

Net income                             118,234    93,325    24,909     26.7%
Same-asset net operating income
 ("NOI")                               139,059   126,670    12,389      9.8%
Funds from operations ("FFO")          131,679   102,152    29,527     28.9%
FFO per unit (diluted)                   $1.94     $1.79     $0.15      8.4%
FFO pay-out ratio                        70.0%     73.8%    (3.8%)
Adjusted FFO ("AFFO")                  112,135    81,707    30,428     37.2%
AFFO per unit (diluted)                  $1.66     $1.43     $0.23     16.1%
AFFO pay-out ratio                       82.2%     92.3%   (10.1%)
Total debt as a % of fair value of
 investment properties                   35.7%     36.4%    (0.7%)
Net debt as a multiple of annualized
 Q4 EBITDA                               6.3:1     6.5:1   (0.2:1)
Operating interest-coverage ratio        4.0:1     3.2:1     0.8:1
Total interest-coverage ratio            3.0:1     2.7:1     0.3:1
----------------------------------------------------------------------------


Allied's financial performance measures for the fourth quarter and fiscal year
were up from the comparable quarter and period in 2012, despite a continuing
reduction in its debt ratios. This is a result of increased occupancy,
portfolio-wide rental growth, accretion from recent acquisitions and increasing
NOI as a result of value-creation activity.


Allied's operating performance measures were also strong. Having leased over 1.5
million square feet of space in 2013, Allied finished the year with its rental
portfolio 91.9% leased, 94.4% leased if upgrade properties are excluded. Allied
renewed or replaced leases for 85.6% of the GLA that matured in the 2013. This
resulted in an overall increase of 8.9% in net rental income per square foot
from the affected space.


With $182 million in acquisitions completed in 2013, Allied exceeded its targets
for the year. As expected, most of the acquisitions were immediately accretive
to FFO and AFFO per unit. They were also heavily weighted in Western Canada,
continuing the ongoing improvement in Allied's geographic diversification.


Allied's value-creation activity progressed well in 2013. Having completed one
upgrade project and five redevelopment projects over the course of the year,
Allied now has two upgrade projects and three redevelopment projects scheduled
for completion in 2014. Allied also has 11 intensification projects underway,
two of which are Properties Under Development and the remaining nine of which
are rental properties going through the municipal approval or pre-development
process. At the end of 2013, Allied's Properties Under Development represented
4% of the fair value of its portfolio.


Allied recently announced a major lease transaction at The Breithaupt Block in
Kitchener for 185,000 square feet and another at QRC West, Phase I, in Toronto
for 70,000 square feet. "These long-term commitments to our development
portfolio bode well for our value-creation activity going forward," said Mr.
Emory.


Allied's balance sheet continued to grow and strengthen in 2013. At the end of
the year, the fair value of its assets was $3.4 billion, up 16% from the end of
2012 through a combination of acquisitions ($182 million) and value appreciation
($285 million), offset somewhat by dispositions ($7 million). Allied's total
debt was 36% of fair value and comprised entirely of first mortgages with a
weighted average term of six years and a weighted average interest rate of 4.8%
Its immediate liquidity was $133 million, and it had approximately $400 million
in unencumbered properties, affording it very considerable near-term liquidity.


FFO, AFFO and EBITDA, total debt and net debt are not financial measures defined
by International Financial Reporting Standards ("IFRS"). Please see Allied's
MD&A for a description of these measures and their reconciliation to financial
measures defined by IFRS, as presented in Allied's consolidated financial
statements for the year ended December 31, 2013. These statements, together with
accompanying notes and MD&A, have been filed with SEDAR, www.sedar.com, and are
also available on Allied's web-site, www.alliedreit.com.


NOI is not a measure recognized under IFRS and does not have any standardized
meaning prescribed by IFRS. NOI is presented in this press release because
management of Allied believes that this non-IFRS measure is an important
financial performance indicator. NOI, as computed by Allied, may differ from
similar computations as reported by other similar organizations and,
accordingly, may not be comparable to NOI reported by such organizations.


This press release may contain forward-looking statements with respect to
Allied, its operations, strategy, financial performance and condition. These
statements generally can be identified by use of forward looking words such as
"may", "will", "expect", "estimate", "anticipate", intends", "believe" or
"continue" or the negative thereof or similar variations. Allied's actual
results and performance discussed herein could differ materially from those
expressed or implied by such statements. Such statements are qualified in their
entirety by the inherent risks and uncertainties surrounding future
expectations. Important factors that could cause actual results to differ
materially from expectations include, among other things, general economic and
market factors, competition, changes in government regulations and the factors
described under "Risk Factors" in the Allied's Annual Information Form which is
available at www. sedar.com. The cautionary statements qualify all
forward-looking statements attributable to Allied and persons acting on its
behalf. Unless otherwise stated, all forward-looking statements speak only as of
the date of this press release, and Allied has no obligation to update such
statements.


Allied Properties REIT is a leading owner, manager and developer of urban office
environments that enrich experience and enhance profitability for business
tenants operating in Canada's major cities. Its objectives are to provide stable
and growing cash distributions to unitholders and to maximize unitholder value
through effective management and accretive portfolio growth.


FOR FURTHER INFORMATION PLEASE CONTACT:
Allied Properties Real Estate Investment Trust
Michael R. Emory
President & Chief Executive Officer
416.977.9002
memory@alliedreit.com
www.alliedreit.com
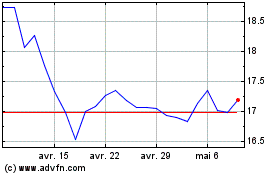
Allied Properties Real E... (TSX:AP.UN)
Graphique Historique de l'Action
De Avr 2024 à Mai 2024

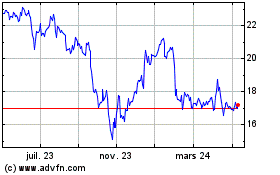
Allied Properties Real E... (TSX:AP.UN)
Graphique Historique de l'Action
De Mai 2023 à Mai 2024
