TERREBONNE, QC, June 13, 2012 /CNW Telbec/ - For the three-month
period ended April 30, 2012, ADF GROUP INC. ("ADF" or the
"Corporation") recorded revenues of $12.5 million compared with
$13.2 million for the same period last year. The gross margin as a
percentage of revenues stood at 14.7% compared with 23.5% in the
first quarter of the previous year. This decrease, which started in
the third quarter of the 2012 fiscal year, is explained by the
different mix of the projects currently underway. Income before
interest, income taxes, depreciation and amortization (EBITDA)
amounted to $0.9 million, compared with $2.1 million the previous
year. The Corporation recorded a slight profit of $0.1 million
(0.00$ per share) during the first quarter ended April 30, 2012,
compared with a net income of $1.1 million ($0.03 per share) in the
same period the previous year. ADF closed the first quarter of the
2013 fiscal year with working capital of $42.3 million, of which
$23.6 million in short-term available liquidities (cash, cash
equivalents and short-term investments), As at April 30, 2012, ADF
Group's short-term available liquidities exceeded its total debt by
$18.1 million, whereas the current ratio stood at 4.44:1. ADF
Group's order backlog stood at $43 million on April 30, 2012,
compared with $48 million on January 31, 2012. This decrease is
mostly attributable to the gradual execution of contracts, net of
contract changes and new contracts. Mr. Jean Paschini, Chairman of
the Board and Chief Executive Officer indicated that "the results
for the first quarter followed a similar trend as observed in the
past quarters, reflecting a still difficult economic environment in
our markets. Although ADF Group has maintained a sound performance
overall, we are not satisfied with these results. We are very keen
on pursuing our goals to provide the Corporation with all the
necessary tools to seize the opportunities that arise in this
challenging context and to position ADF Group advantageously for
the next economic upturn, while seeking to limit exposure to risks
associated with our market segments." Mr. Paschini added that the
Corporation is currently analyzing the possibility of setting up a
fabrication plant in the United States, which would provide ADF
access to the US public infrastructure market for which growth is
expected in the coming years. On April 11, 2012, the Corporation's
Board of Directors approved the payment of a semi-annual dividend.
Consequently, on May 17, 2012, ADF Group paid a semi-annual
dividend of $0.01 per share to shareholders of record as at April
30, 2012. Annual Meeting of Shareholders ADF Group's Annual Meeting
of Shareholders will take place this morning, June 13, 2012 at
11:00 am at the Hilton Montreal/Laval Hotel in Laval. About ADF
Group Inc. ADF Group Inc. is a North American leader in the design
and engineering of connections, fabrication and installation of
complex steel structures, heavy steel built-ups, as well as in
miscellaneous and architectural metals for the non residential
construction industry. ADF Group Inc. is one of the few players in
the industry capable of handling highly technically complex mega
projects on fast-track schedules in the commercial, institutional,
industrial and public sectors. Forward-Looking Information This
press release contains forward-looking statements reflecting ADF
objectives and expectations. These statements are identified by the
use of verbs such as "expect" as well as by the use of future or
conditional tenses. By their very nature these types of statements
involve risks and uncertainty. Consequently, reality may differ
from ADF's expectations. Non-IFRS Measures EBITDA is not a
performance measure recognized by IFRS standards, and is not likely
to be comparable to similar measures presented by other issuers.
Management, as well as investors, consider this to be useful
information to assist them in assessing the Corporation's
profitability and ability to generate funds to finance its
operations. All amounts are in Canadian dollars, unless otherwise
indicated.
____________________________________________________________________
| CONFERENCE CALL WITH INVESTORS | | | |To discuss ADF Group's
results for the first quarter ended April 30,| | 2012, | | | | June
13, 2012 at 10:00 a.m. (Montreal time) | | | |To participate in the
conference call, please dial 1-888-231-8191 a | | few minutes
before the start of the call. | | | | For those unable to
participate, a taped rebroadcast will be | | available from
Wednesday, June 13, 2012 at 1:00 p.m. | | until midnight June 20,
2012, by dialing 1-855-859-2056;access | | code83424725. | | | |
The conference call (audio) will also be available at | |
www.adfgroup.com | | | | Members of the media are invited to listen
in. |
|____________________________________________________________________|
CONSOLIDATED STATEMENT OF INCOME(unaudited) Three-Month Periods
Ended April 30, 2012 2011 (In thousands of Canadian dollars and in
dollars per share) $ $ Revenues 12,464 13,229 Cost of goods sold
10,634 10,123 Gross Margin 1,830 3,106 Selling and administrative
expenses 1,729 1,892 Financial revenues (45) (95) Financial
expenses 44 60 Foreign exchange gain (76) (755) 1,652 1,102 Income
before income tax expense 178 2,004 Income tax expense 87 923 Net
income for the period 91 1,081 Earnings per share Basic per share
0.00 0,03 Diluted per share 0.00 0,03 Average number of outstanding
shares (in thousands) 32,464 32,775 Average number of outstanding
diluted shares (in thousands) 32,928 33,390 CONSOLIDATED STATEMENTS
OF COMPREHENSIVE INCOME(unaudited) Three-Month Periods Ended April
30, 2012 2011 (In thousands of Canadian dollars) $ $ Net income for
the period 91 1,081 Other comprehensive income: Exchange
differences on translation of foreign operations (a) (366) (1,495)
Comprehensive income for the period (275) (414) (a) Net of hedging
activities and $12,000 in related income tax for the three-month
period ended April 30, 2012 (nil for the three-month period ended
April 30, 2011). CONSOLIDATED STATEMENTS OF CHANGES IN
SHAREHOLDERS' EQUITY(unaudited) Accumulated Other Capital
Contributed Comprehensive Retained Stock Surplus Income Income
Total (In thousands of Canadian dollars) $ $ $ $ $ Balance,
February 1, 2011 70,032 5,740 (1,477) 18,739 93,034 Net income - -
- 1,081 1,081 for the year Other - - (1,495) - (1,495)
comprehensive income Comprehensive - - (1,495) 1,081 (414) income
for the period Share-based - 59 - - 59 compensation Dividends - - -
(328) (328) Balance, April 30, 2011 70,032 5,799 (2,972) 19,492
92,351 Accumulated Other Capital Contributed Comprehensive Retained
Stock Surplus Income Income Total (In thousands of Canadian
dollars) $ $ $ $ $ Balance, February 1, 2012 69,086 6,368 (1,586)
19,895 93,763 Net income - - - 91 91 for the period Other - - (366)
- (366) comprehensive income Comprehensive - - (366) 91 (275)
income for the period Share-based - 11 - - 11 compensation Options
1 - - - 1 exercised Dividends - - - (325) (325) Balance, April 30,
2012 69,087 6,379 (1,952) 19,661 93,175 CONSOLIDATED STATEMENTS OF
FINANCIAL POSITION As at April 30, 2012 January 31, 2012
(unaudited) (audited) (In thousands of Canadian dollars) $ $ ASSETS
Current assets Cash and cash equivalents 18,209 18,976 Short-term
investments 5,440 5,562 Accounts receivable 14,171 14,189 Holdbacks
on contracts 4,231 5,082 Work in progress 7,858 5,263 Inventories
3,985 3,613 Prepaid expenses and other current assets 676 782
Derivative financial instruments 66 - Total current assets 54,636
53,467 Non-current assets Property, plant and equipment 44,396
45,089 Intangible assets 2,630 2,618 Other non-current assets 2,801
2,796 Deferred income tax assets 4,178 4,549 Total assets 108,641
108,519 LIABILITIES Current liabilities Accounts payable and other
current liabilities 6,399 5,551 Income tax liabilities 21 77
Deferred revenues 3,360 2,618 Derivative financial instruments 29
75 Current portion of long-term debt 2,492 2,526 Total current
liabilities 12,301 10,847 Non-current liabilities Long-term debt
3,015 3,676 Deferred income tax liabilities 150 233 Total
liabilities 15,466 14,756 SHAREHOLDERS' EQUITY Retained income
19,661 19,895 Accumulated other comprehensive income (1,952)
(1,586) 17,709 18,309 Capital stock 69,087 69,086 Contributed
surplus 6,379 6,368 Total shareholders' equity 93,175 93,763 Total
liabilities and shareholders' equity 108,641 108,519 CONSOLIDATED
STATEMENTS OF CASH FLOWS(unaudited) Three-Month Periods Ended April
30, 2012 2011 (In thousands of Canadian dollars) $ $ OPERATING
ACTIVITIES Net income for the period 91 1,081 Non-cash items:
Amortization of property, plant and 792 equipment 747 Amortization
of intangible assets 89 89 Unrealized gain on derivative (226)
financial instruments (112) Non-cash exchange loss (gain) 161 (244)
Share-based compensation 11 59 Income tax expense 87 923 Financial
revenues (45) (95) Financial expenses 44 60 Net income adjusted for
non-cash items 1,073 2,439 Changes in non-cash working capital
items (1) (790) 2,961 Income tax expense paid (152) (368) Cash
flows from (used in) operating activities 131 5,032 INVESTING
ACTIVITIES Disposal (acquisition) of short-term investments 62
(2,905) Net acquisition of property, plant and equipment (64) (29)
Acquisition of intangible assets (101) (88) Reduction in other
non-current assets (5) 1 Interest received 59 77 Cash flows from
(used in) investing activities (49) (2,944) FINANCING ACTIVITIES
Repayment of long-term debt (613) (600) Issuance of subordinate
voting shares 1 - Interest paid on the interest rate swap (6) (9)
Interest paid (44) (53) Cash flows from (used in) financing
activities (662) (662) Impact of fluctuations in foreign exchange
rate on cash (187) (709) Net (decrease) increase in cash and cash
equivalents (767) 717 Cash and cash equivalents, beginning of
period 18,976 18,677 Cash and cash equivalents, end of period
18,209 19,394 (1) Detail the components of the "Changes in non-cash
working capital items": Periods Ended April 30, 2012 2011 (In
thousands of Canadian dollars) $ $ Accounts receivable (116) (749)
Holdbacks on contracts 785 5 Income tax 77 (12) Work in progress
(2,693) (166) Inventories (372) (58) Prepaid expenses and other
current assets 106 273 Accounts payable and other current
liabilities 645 233 Deferred revenues 778 3,435 Changes in non-cash
working capital items (790) 2,961 For the
purpose of the consolidated statements of cash flows, cash and cash
equivalents in the amount of $18,209,000 as at April 30, 2012 and
$19,394,000 as at April 30, 2011 were only composed of cash.
SEGMENTED INFORMATION The Corporation operates in the
non-residential construction sector, primarily in the United States
and Canada. Its operations include the connections design and
engineering, fabrication and installation of complex steel
structures, heavy steel built-ups, as well as miscellaneous and
architectural metalwork. Periods Ended April 30, 2012 2011 (In
thousands of Canadian dollars) $ $ Revenues Canada 2,521 225 United
States 9,943 13,004 12,464 13,229 As at April 30, 2012 January 31,
2012 (In thousands of Canadian dollars) $ $ Property, Plant and
Equipment Canada 43,737 44,410 United States 659 679 44,396 45,089
All intangible assets and investment tax credits included under
"Other non-current assets" at April 30, 2012 and January 31, 2012
originated from Canada. During the three-month period ended April
30, 2012, two clients accounted for 84% of the Corporation's
revenues (one client accounted for 94% of the revenues during the
three-month period ended April 30, 2011), and therefore were the
only ones that accounted for more than 10% of revenues. ADF
GROUP INC. CONTACT: Source: ADF Group Inc.Contact: Jean Paschini,
Chairman of the Board of Directors and Chief
ExecutiveOfficerJean-Francois Boursier, CA, Chief Financial
OfficerTelephone: (450) 965-1911 / 1 (800) 263-7560Web Site:
www.adfgroup.com
Copyright
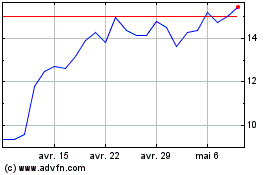
ADF (TSX:DRX)
Graphique Historique de l'Action
De Juin 2024 à Juil 2024

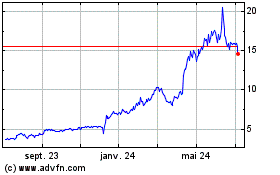
ADF (TSX:DRX)
Graphique Historique de l'Action
De Juil 2023 à Juil 2024
