UNITED
STATES
SECURITIES
AND EXCHANGE COMMISSION
Washington,
D.C. 20549
FORM
N-CSR
CERTIFIED
SHAREHOLDER REPORT OF REGISTERED
MANAGEMENT
INVESTMENT COMPANIES
Investment
Company Act file number: 811-21846
Clough
Global Opportunities Fund
(exact
name of Registrant as specified in charter)
1700
Broadway, Suite 1850, Denver, Colorado 80290
(Address
of principal executive offices) (Zip code)
Chris
Moore, Secretary
Clough
Global Opportunities Fund
1700
Broadway, Suite 1850
Denver,
Colorado 80290
(Name
and address of agent for service)
Registrant’s
telephone number, including area code: 855-425-6844
Date
of fiscal year end: October 31
Date
of reporting period: November 1, 2022 – April 30, 2023
Item
1. Reports to Stockholders.
(a)

CLOUGH GLOBAL
DIVIDEND AND INCOME FUND
CLOUGH GLOBAL
EQUITY FUND
CLOUGH GLOBAL OPPORTUNITIES FUND
Semi-Annual Report
April 30, 2023
Clough Global Funds
SECTION 19(B) DISCLOSURE
April 30, 2023 (Unaudited)
Clough Global Dividend and Income Fund,
Clough Global Equity Fund, and Clough Global Opportunities Fund (each a “Fund” and collectively, the “Funds”),
acting pursuant to a Securities and Exchange Commission (“SEC”) exemptive order and with the approval of each Fund’s
Board of Trustees (the “Board”), have adopted a plan, consistent with each Fund’s investment objectives and policies
to support a level distribution of income, capital gains and/or return of capital (the “Plan”). In accordance with
the Plan, the Funds’ managed distribution policy sets the monthly distribution rate at an amount equal to one twelfth of
10% of each Fund’s adjusted year-ending net asset value (“NAV”), which is the average of the NAVs as of the last
five business days of the prior calendar year.
Under the Plan, each Fund will distribute
all available investment income to its shareholders, consistent with each Fund’s primary investment objectives and as required
by the Internal Revenue Code of 1986, as amended (the “Code”). If sufficient investment income is not available on
a monthly basis, each Fund will distribute long-term capital gains and/or return of capital to shareholders in order to maintain
a level distribution.
Each monthly distribution to shareholders
is expected to be at the fixed amount established by the Board, except for extraordinary distributions and potential distribution
rate increases to enable each Fund to comply with the distribution requirements imposed by the Code.
Shareholders should not draw any conclusions
about each Fund’s investment performance from the amount of these distributions or from the terms of the Plan. Each
Fund’s total return performance on net asset value is presented in its financial highlights table.
Each Board may amend, suspend or terminate
each Fund’s Plan without prior notice. The suspension or termination of the Plan could have the effect of creating a trading
discount (if a Fund’s stock is trading at or above net asset value) or widening an existing trading discount. Each Fund is
subject to risks that could have an adverse impact on its ability to maintain level distributions. Examples of potential risks
include, but are not limited to, economic downturns impacting the markets, increased market volatility, companies suspending or
decreasing corporate dividend distributions and changes in the Code. Please refer to the Notes to Financial Statements in the Annual
Report to Shareholders for a more complete description of its risks.
Please refer to Additional Information
for a cumulative summary of the Section 19(a) notices for each Fund’s current fiscal period. Section 19(a) notices for each
Fund, as applicable, are available on the Clough Global Closed-End Funds website www.cloughglobal.com.
TABLE OF CONTENTS
| Shareholder Letter |
4 |
| Portfolio Allocation |
7 |
| Schedules of Investments |
13 |
| Statements of Assets and Liabilities |
28 |
| Statements of Operations |
29 |
| Statements of Changes in Net Assets |
30 |
| Statements of Cash Flows |
32 |
| Financial Highlights |
34 |
| Notes to Financial Statements |
40 |
| Additional Information |
56 |
| Dividend Reinvestment Plan |
57 |
| Investment Advisory Agreement Approval |
58 |
Clough Global Funds
SHAREHOLDER LETTER
April 30, 2023 (Unaudited)
To Our Investors:
For the semi-annual period ending April
30, 2023, the Clough Global Opportunities Fund (“GLO”) had a total net return of +0.63% on net asset value and -10.06%
on market price and the Clough Global Dividend Income Fund (“GLV”) had a total net return of +1.07% on net asset value
and -11.04% on market price; both funds compared to the Morningstar Global Allocation Index return of +10.99% for the same period.
The Clough Global Equities Fund (“GLQ”) had a total net return of +0.74% on net asset value and -9.71% on market price
compared to the MSCI World Index return of +12.57% over the same period.
Most recently, in fiscal Q2 ending April
30, the GLO had a total net return of +2.45% on net asset value and -1.14% on market price, and GLV had a total net return of 0.04%
on net asset value and -7.63% on market price; both funds compared to the Morningstar Global Allocation Index return of +0.84%.
GLQ had a total net return of +2.98% on net asset value and -2.26% on market price compared to the MSCI World Index return of +2.54%
over the same period.
Closed-end fund discounts widened during
the semi-annual period, which has weighed on market price returns across the space. As of April 30, Morningstar reports that the
average closed-end fund discount was 8.5%, a wide level relative to the historic average of ~4.5%.
TOP 5 CONTRIBUTORS AND DETRACTORS FOR GLV’S FIRST FISCAL
HALF OF THE YEAR
The top contributor
for the first six months of the fiscal year was Airbus SE, the large aerospace company, due to an improving production outlook.
The commercial aircraft cycle is in an expansion phase which could last most of the decade as growth in travel combines with the
need to replace many 15 to 20-year-old aircrafts to support demand. Microsoft Corporation, a large technology company, gained
due to positive earnings results and artificial intelligence services revenues ramping up. Broadcom Inc., a semiconductor company,
gained due to strength in infrastructure markets. The company also stands to benefit from increased spending on generative artificial
intelligence. Comcast Corporation, a cable and communications company, exceeded Wall Street analysts’ expectations on recent
results. Merck & Co. Inc., a global pharmaceuticals company, rounded out the contributors, due to strong results and
positive data from one of its largest pipeline assets.
As for the detractors, an equity hedge
position detracted from performance as equities gained during the period. Advance Auto Parts Inc., an automotive parts retailer,
declined due to concerns over margins and a CEO transition. We have since exited the position. Northrop Grumman Corp, a defense
company, declined in part due to concerns about defense spending. Bank of America Corporation, a large, diversified bank, declined
due to macroeconomic concerns. A corporate bond position in a regional bank declined. We have since exited the position due to
regulatory uncertainty.
TOP 5 CONTRIBUTORS AND DETRACTORS FOR GLQ’S FIRST FISCAL
HALF OF THE YEAR
The top contributors for the first six
months of the fiscal year were Boeing Co and Airbus SE, two large aerospace companies, due to an improving production outlook.
The commercial aircraft cycle is in an expansion phase which could last most of the decade as growth in travel combines with the
need to replace many 15 to 20-year-old aircrafts to support demand. Arcellx Inc., a clinical stage biotechnology company, gained
after announcing a strategic collaboration with Gilead Sciences Inc., which included a $225m upfront payment and $100m equity investment.
Microsoft Corporation, a large technology company, gained due to positive earnings results and artificial intelligence services
revenues ramping up. TransDigm Group Inc., an aerospace company, rounded out the gainers on positive earnings and guidance.
As for the detractors, an equity hedge
position detracted from performance as equities gained during the period. CrowdStrike Holdings Inc., a cybersecurity company, declined
on the company’s weaker than expected revenue outlook. We have since exited the position. Tesla Inc., a manufacturer of electric
vehicles, declined over concerns about pricing cuts and potential margin impact. We have since exited the position. Northrop Grumman
Corp, a defense company, declined in part due to concerns about defense spending. Amphivena Therapeutics Inc., a private clinical
stage biotechnology company, announced an M&A transaction with Anji Pharmaceuticals, resulting in a markdown.
TOP 5 CONTRIBUTORS AND DETRACTORS FOR GLO’S FIRST FISCAL
HALF OF THE YEAR
The top contributors for the first six
months of the fiscal year were Boeing Co and Airbus SE, two large aerospace companies, due to an improving production outlook.
The commercial aircraft cycle is in an expansion phase which could last most of the decade as growth in travel combines with the
need to replace many 15 to 20-year-old aircrafts to support demand. Arcellx Inc., a clinical stage biotechnology company, gained
after announcing a strategic collaboration with Gilead Sciences Inc., which included a $225m upfront payment and $100m equity investment.
Microsoft Corporation, a large technology company, gained due to positive earnings results and artificial intelligence services
revenues ramping up. TransDigm Group Inc., an aerospace company, rounded out the gainers on positive earnings and guidance.
As for the detractors, an equity hedge
position detracted from performance as equities gained during the period. CrowdStrike Holdings Inc., a cybersecurity company, declined
on the company’s weaker than expected revenue outlook. We have since exited the position. Tesla Inc., a manufacturer of electric
vehicles, declined over concerns about pricing cuts and potential margin impact. We have since exited the position. Northrop Grumman
Corp, a defense company, declined in part due to concerns about defense spending. Amphivena Therapeutics Inc., a private clinical
stage biotechnology company, announced a mergers & acquisition (“M&A”) transaction with Anji Pharmaceuticals,
resulting in a markdown.
SELECT THEMES
Healthcare
Roughly over 20% of GLO, GLQ, and GLV’s
(“the Funds”) portfolios are dedicated to opportunities in healthcare. We see two levels of opportunity in healthcare.
First, we continue to build positions within medical technology and hospital companies as signs point to normalization of industry
supply chains and improvements in labor costs. Surgical procedures left undone during COVID times are growing again and high-cost
pressures due to inflated travel nurse contracts are beginning to reverse. These trends bode particularly well for our investments
in healthcare facilities. Several facilities stocks currently trade at a discount to their historical multiples, and we believe
a recovery in volumes could drive both higher earnings and continued multiple expansion.
Secondly, we see pharmaceutical and biotechnology
stocks as the cheapest way to buy technology in the marketplace. Higher interest rates and the failure of Silicon Valley
Bank, which funded many venture-backed and newly publicly traded companies, led to declines in many biotech issues during the
first calendar quarter, providing an excellent buying opportunity for long-term performance. Performance has improved recently,
and we think this turn may finally be underpinned by the resurgence of a mergers and acquisitions market and the reopening of
broader capital markets. Pfizer Inc.’s $40 billion acquisition of Seagen Inc., and Merck & Co’s $11 billion acquisition
of Prometheus Biosciences Inc., underscore our argument that pharmaceutical companies must buy product pipelines. Public market
investors we think are valuing strategic assets far below what desperate buyers will pay for out-year earnings.
Clough Global Funds
SHAREHOLDER LETTER
April 30, 2023 (Continued) (Unaudited)
Defense and Aerospace
In both the defense and commercial sides
of the business, aircraft building rates are rising, and order activity is strong. We believe highly profitable aftermarket sales
will follow, giving further long-range visibility to profitability in the industry. On the defense side, investment in U.S. defense
capability has been limited ever since the collapse of the former Soviet Union thirty years ago. Both equipment supplies and technologies
have to be widely upgraded and a long demand cycle is likely.
On the commercial side, GLQ & GLO hold
investments in both Airbus SE and Boeing Co, while GLV holds an investment in Airbus SE. Airbus is essentially backlogged through
2027. In Boeing’s case, despite a newly reported production glitch on the 737 at Spirit AeroSystems, the primary supplier
of the aircraft’s fuselage, the need for these aircraft will only rise and production glitches should be fixed. Forty seven
percent of Boeing’s fleet is operating in China and now China seems to be reopening to the company. We believe China needs
the 737, air traffic is growing globally, and replacement demand will add further demand over the decade.
Credit Market Opportunities
Investment opportunities in the credit
markets, absent during times of super low savings rates, are now reappearing and we are seeking out investment grade companies
moving from being cash flow negative to cash flow positive, often with yields 200-300 basis points above U.S. Treasuries. We feel
there are also opportunities along the capital structure to add lower grade fixed income securities. Even in a recession, falling
profits do not necessarily impair a firm’s ability to service debt, and paying down debt is increasingly a major objective
of CEOs.
Carnival Corp, the most popular cruise
franchise, has outstanding senior guaranteed bonds with double digit coupons and yields in the mid-teens because of the balance
sheet erosion which occurred when the company was closed by COVID. Demand is strong and free cash flow is building. The company
can cover all 2023 maturities with current liquidity of $8.1 billion and $300 million in free cash flow. It recently announced
the strongest first quarter bookings ever at the highest prices ever. Its market is growing; the average age of its customers pre-COVID
has moved down from over 55 years to 30-40 years today, and it has saleable assets. Debt has peaked and we think will decline through
2024. We believe an investment grade weighting will be likely in 2026.
Short Positions
The Funds hold short positions in a major
domestic automobile manufacturer and two of the large auto dealer chains. This is an industry which faces two challenges to profitability.
One is a cyclical profit decline as supply restrictions ease, volumes rise, pent-up demand becomes sated, and discounts replace
high vehicle prices. The second is a more secular profit squeeze as electric vehicles (“EVs”) displace cars powered
by internal combustion engines (“ICEs”).
Inventories of ICE vehicles are building
as supply chains open, buying incentives are returning, profit margins are peaking cyclically, and U.S. auto companies announce
growing losses on EV sales. Automobile deliveries are running 78% higher than a year ago, just as high interest rates depress affordability.
And now, U.S. auto manufacturers face heavy development costs to redesign and build out their EV fleets. It is not clear to us
that U.S. auto manufacturers can build profitable EV ventures; few will reach the scale necessary to achieve profitability. We
think Tesla Inc. will always be the domestic price leader in EVs, and all manufacturers will face a flood of new EV introductions.
These are global businesses so even U.S. auto companies will be facing intensive Chinese competition globally.
Given their lack of scale and technology
amidst persistent declines in ICE sales, it is highly doubtful that traditional mainstream auto manufacturers will gain the scale
necessary to grow profitability as prices decline and battery and other costs accelerate. Tesla lost money for a decade and invested
billions of dollars when it was virtually alone in the marketplace. Over 25% of new vehicles sold in China are EVs, an indication
of how competitive the world will become in the space; sales of internal combustion vehicles fell 13%.
The Funds are also short two auto dealer
chains with large exposure to used car sales. The huge rise in used car prices increased the average gross margins on vehicle sales
from $2000 to $5000. Some have added leverage to buy back expensive stock. And now customers find used car loans are tougher to
get. As the industry normalizes and gross margins return to average levels, we think profitability will sharply decline. The profit
margin decline will be aggravated by the fact that electric vehicles, which require far less maintenance than those powered by
ICEs will reduce a critical source of dealer profits.
As always, please don’t hesitate to reach out to us with
any questions or comments.
Sincerely,

Charles I Clough, Jr.

William Whelan
Clough Global Funds
SHAREHOLDER LETTER
April 30, 2023 (Continued) (Unaudited)
This letter is provided for informational
purposes only and is not an offer to purchase or sell shares. Clough Global Dividend and Income Fund, Clough Global Equity Fund,
and Clough Global Opportunities Fund (the “Funds”) are closed-end funds, which are traded on the NYSE American LLC,
and do not continuously issue shares for sale as open-end mutual funds do. The market price of a closed-end fund is based on the
market’s value.
Although not generally stated throughout,
the information in this letter reflects the opinions of the individual portfolio managers, which opinion is subject to change,
and is not intended to be a forecast of future events, a guarantee of future results or investment advice.
The Morningstar Global Allocation Index
represents a multi-asset class portfolio of 60% global equities and 40% global bonds. The asset allocation within each class is
driven by Morningstar asset allocation methodology. To maintain broad global exposure and diversification, the index consists of
equities & fixed income and utilizes global, float-weighted index methodology to determine allocation to U.S. and non-U.S.
The MSCI World
Index is a free float-adjusted market capitalization weighted index that is designed to measure the equity market performance
of 23 developed markets countries. Both indices referenced herein reflect the reinvestment of dividends. Effective July 31, 2010,
the MSCI World Index returns prior to January 1, 2002 were revised to reflect the total returns, with dividends reinvested, reported
by MSCI. The MSCI information may only be used for your internal use, may not be reproduced or redisseminated in any form and
may not be used as a basis for or a component of any financial instruments or products or indices. None of the MSCI
information is intended to constitute investment advice or a recommendation to make (or refrain from making) any kind of investment
decision and may not be relied on as such. Historical data and analysis should not be taken as an. indication or guarantee of
any future performance analysis, forecast or prediction. The MSCI information is provided on an “as is” basis and
the user of this information assumes the entire risk of any use made of this information. MSCI, each of its affiliates and each
other person involved in or related to compiling, computing or creating any MSCI information (collectively, the “MSCI Parties”)
expressly disclaims all warranties (including, without limitation, any warranties of originality, accuracy, completeness, timeliness,
non-infringement, merchantability and fitness for a particular purpose) with respect to this information. Without limiting any
of the foregoing, in no event shall any MSCI Party have any liability for any direct, indirect, special, incidental, punitive,
consequential (including, without limitation, lost profits) or any other damages (www.msci.com).
The performance of the indices referenced
herein is used for informational purposes only. One cannot invest directly in an index. Indices are not subject to any of the fees
or expenses to which the Funds are subject, and there are significant differences between the Funds’ investments and the
components of the indices referenced.
The net asset value (“NAV”)
of a closed-end fund is the market price of the underlying investments (i.e., stocks and bonds) in the Funds’ portfolios,
minus liabilities, divided by the total number of fund shares outstanding. However, the Fund also has a market price; the value
of which it trades on an exchange. This market price can be more or less than its NAV
RISKS
An investor should consider investment
objectives, risks, charges and expenses carefully before investing. To obtain an annual report or semiannual report which contains
this and other information visit www.cloughglobal.com or call 1-855-425-6844. Read them carefully before investing.
The Funds’ distribution policies
will, under certain circumstances, have certain adverse consequences to the Funds and their shareholders because it may result
in a return of capital resulting in less of a shareholder’s assets being invested in the Funds and, over time, increase the
Funds’ expense ratios.
Distributions may be paid from sources
of income other than ordinary income, such as net realized short-term capital gains, net realized long-term capital gains and return
of capital. Based on current estimates, we anticipate the most recent distribution has been paid from short-term and long-term
capital gains. The actual amounts and sources of the amounts for tax reporting purposes will depend upon the Funds’ investment
experiences during the remainder of its fiscal year and may be subject to changes based on tax regulations. If a distribution includes
anything other than net investment income, the Funds provide a Section 19(a) notice of the best estimate of its distribution sources
at that time. These estimates may not match the final tax characterization (for the full year’s distributions) contained
in shareholders’ 1099-DIV forms after the end of the year. For the fiscal year 2022, the Funds’ distribution policies
resulted in distributions of capital in the amount of $13,720,430 in the Clough Global Equity Fund and $21,501,359 in the Clough
Global Opportunities Fund.
The Funds’ investments in securities
of foreign issuers are subject to risks not usually associated with owning securities of U.S. issuers. These risks can include
fluctuations in foreign currencies, foreign currency exchange controls, social, political and economic instability, differences
in securities regulation and trading, expropriation or nationalization of assets, and foreign taxation issues.
The Funds’ investments in preferred
stocks and bonds of below investment grade quality (commonly referred to as “high yield” or “junk bonds”),
if any, are predominately speculative because of the credit risk of their issuers.
An investment by the Funds in real estate
investment trusts (“REITs”) will subject it to various risks. The first, real estate industry risk, is the risk that
the REIT share prices will decline because of adverse developments affecting the real estate industry and real property values.
In general, real estate values can be affected by a variety of factors, including supply and demand for properties, the economic
health of the country or of different regions, and the strength of specific industries that rent properties. The second, investment
style risk, is the risk that returns from REITs—which typically are small or medium capitalization stocks—will trail
returns from the overall stock market. The third, interest rate risk, is the risk that changes in interest rates may hurt real
estate values or make REIT shares less attractive than other income-producing investments. Credit risk is the risk that an issuer
of a preferred or debt security will become unable to meet its obligation to make dividend, interest and principal payments.
Interest rate
risk is the risk that preferred stocks paying fixed dividend rates and fixed-rate debt securities will decline in value because
of changes in market interest rates. When interest rates rise the value of such securities generally will fall. Derivative transactions
(such as futures contracts and options thereon, options, swaps, and short sales) subject the Funds to increased risk of principal
loss due to imperfect correlation or unexpected price or interest rate movements. Compared to investment companies
that focus only on large companies, the Funds’ share price may be more volatile because it also invests in small and medium
capitalization companies. Past performance is neither a guarantee, nor necessarily indicative, of future results, which may be
significantly affected by changes in economic and other conditions.
Clough Global Dividend and Income Fund
PORTFOLIO ALLOCATION
April 30, 2023 (Unaudited)
Growth of $10,000 Investment
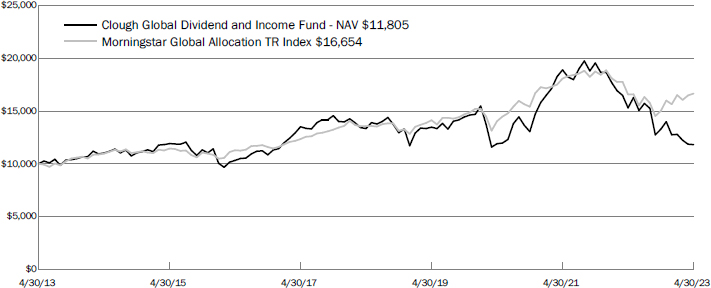
The graph shown above represents
historical performance of a hypothetical investment of $10,000 in the Fund since inception. Past performance does not guarantee
future results. All returns reflect reinvested dividends, but do not reflect the deduction of taxes that a shareholder would pay
on Fund distributions or the redemption of Fund shares
Total Return as of April 30, 2023(a)
| |
6 months |
1 Year |
3 years |
5 years |
10 years |
Annualized
Since
Inception
(7/28/2004) |
| Clough Global Dividend and Income Fund - NAV(b) |
1.07% |
-9.25% |
1.91% |
-0.49% |
2.34% |
4.88% |
| Clough Global Dividend and Income Fund - Market Price(c) |
-11.04% |
-22.84% |
-0.15% |
-2.63% |
1.56% |
3.46% |
| Morningstar Global Allocation TR Index |
10.99% |
0.50% |
5.86% |
4.18% |
5.23% |
6.36% |
| (a) | Total returns assume reinvestment of all distributions. |
| (b) | Performance returns are net of management fees and other Fund expenses. |
| (c) | Market price is the value at which the Fund trades on an exchange. This market price can be
more or less than its NAV. |
Distribution to Common Shareholders
The Fund intends
to make monthly distributions to common shareholders according to its managed distribution policy. The Fund’s managed distribution
policy is to set the monthly distribution rate at an amount equal to one twelfth of 10% of the Fund’s adjusted year-ending
net asset value per share (“NAV”), which will be the average of the NAVs as of the last five business days of the
prior calendar year. The Board of Directors approve the distribution and may adjust it from time to time. The monthly distribution
amount paid from November 1, 2022 to December 31, 2022 was $0.0906 per share and the Fund paid $0.0597 per share monthly between
January 1, 2023 and April 30, 2023. At times, to maintain a stable level of distributions, the Fund may pay out less than all
of its net investment income or pay out accumulated undistributed income, or return of capital, in addition to current net investment
income.
Clough Global Dividend and Income Fund
PORTFOLIO ALLOCATION
April 30, 2023 (Continued) (Unaudited)
| Global Securities Holdings |
% of Total
Portfolio(a) |
| United States of America |
60.84% |
| US Multinational(b) |
30.58% |
| France |
3.17% |
| India |
2.10% |
| Sweden |
1.38% |
| China |
1.04% |
| Japan |
1.01% |
| South Korea |
0.47% |
| Denmark |
0.27% |
| Hong Kong |
0.20% |
| Canada |
-0.08% |
| Spain |
-0.11% |
| Germany |
-0.19% |
| Chile |
-0.34% |
| Italy |
-0.38% |
| Other |
0.04% |
| TOTAL INVESTMENTS |
100.00% |
| Asset Allocation |
% of Total Portfolio(a) |
| Common Stock - US |
80.68% |
| Common Stock - Foreign |
6.76% |
| Closed-End Funds |
1.98% |
| Preferred Stock |
0.97% |
| Exchange Traded Funds |
-3.95% |
| Total Return Swap Contracts |
-0.45% |
| Total Equities |
85.99% |
| |
|
| Corporate Bonds |
11.73% |
| U.S. Treasury Obligations |
0.63% |
| Asset-Backed Securities |
0.02% |
| Total Fixed Income |
12.38% |
| |
|
| Purchased Options |
1.78% |
| Money Market Funds |
0.70% |
| Cash |
0.04% |
| Futures |
-0.04% |
| Written Options |
-0.85% |
| |
|
| TOTAL INVESTMENTS |
100.00% |
| (a) | Percentages calculated based on total portfolio, including securities sold short, cash balances,
market value of futures, and notional value of return swaps. |
| (b) | U.S. Multinationals includes companies organized or located in the United States that have more
than 50% of revenues derived outside of the United States. |
Clough Global Equity Fund
PORTFOLIO ALLOCATION
April 30, 2023 (Unaudited)
Growth of $10,000 Investment
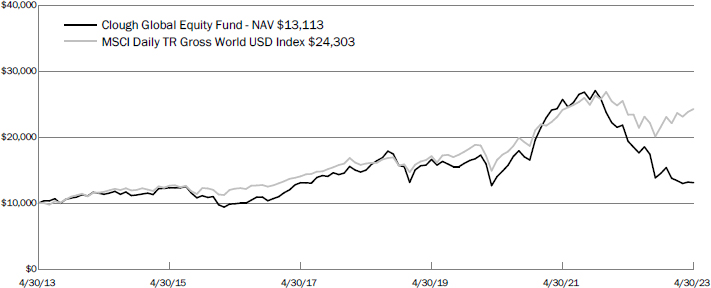
The graph shown above represents
historical performance of a hypothetical investment of $10,000 in the Fund since inception. Past performance does not guarantee
future results. All returns reflect reinvested dividends, but do not reflect the deduction of taxes that a shareholder would pay
on Fund distributions or the redemption of Fund shares
Total Return as of April 30, 2023(a)
| |
6 months |
1 Year |
3 years |
5 years |
10 years |
Annualized
Since
Inception
(4/27/2005) |
| Clough Global Equity Fund - NAV(b) |
0.74% |
-17.32% |
-0.42% |
-0.46% |
3.46% |
5.12% |
| Clough Global Equity Fund - Market Price(c) |
-9.71% |
-32.43% |
-2.15% |
-2.99% |
2.59% |
3.63% |
| MSCI Daily TR Gross World USD Index |
12.57% |
3.72% |
13.64% |
8.69% |
9.29% |
7.92% |
| (a) | Total returns assume reinvestment of all distributions. |
| (b) | Performance returns are net of management fees and other Fund expenses. |
| (c) | Market price is the value at which the Fund trades on an exchange. This market price can be
more or less than its NAV. |
Distribution to Common Shareholders
The Fund intends
to make monthly distributions to common shareholders according to its managed distribution policy. The Fund’s managed distribution
policy is to set the monthly distribution rate at an amount equal to one twelfth of 10% of the Fund’s adjusted year-ending
net asset value per share (“NAV”), which will be the average of the NAVs as of the last five business days of the
prior calendar year. The Board of Directors approve the distribution and may adjust it from time to time. The monthly distribution
amount paid from November 1, 2022 to December 31, 2022 was $0.1162 per share and the Fund paid $0.0599 per share monthly between
January 1, 2023 and April 30, 2023. At times, to maintain a stable level of distributions, the Fund may pay out less than all
of its net investment income or pay out accumulated undistributed income, or return of capital, in addition to current net investment
income.
Clough Global Equity Fund
PORTFOLIO ALLOCATION
April 30, 2023 (Continued) (Unaudited)
| Global Securities Holdings |
% of Total
Portfolio(a) |
| United States of America |
57.72% |
| US Multinational(b) |
33.44% |
| India |
3.75% |
| China |
2.44% |
| France |
2.16% |
| Hong Kong |
0.56% |
| South Korea |
0.45% |
| Denmark |
0.44% |
| Switzerland |
0.44% |
| Canada |
-0.07% |
| Spain |
-0.12% |
| Germany |
-0.18% |
| Japan |
-0.31% |
| Chile |
-0.32% |
| Italy |
-0.42% |
| Other |
0.02% |
| TOTAL INVESTMENTS |
100.00% |
| Asset Allocation |
% of Total Portfolio(a) |
| Common Stock - US |
72.23% |
| Common Stock - Foreign |
8.54% |
| Closed-End Funds |
1.46% |
| Preferred Stock |
0.20% |
| Exchange Traded Funds |
0.81% |
| Total Return Swap Contracts |
-0.44% |
| Total Equities |
82.80% |
| |
|
| U.S. Treasury Obligations |
10.55% |
| Corporate Bonds |
3.55% |
| Convertible Corporate Bonds |
0.02% |
| Total Fixed Income |
14.12% |
| |
|
| Money Market Funds |
1.76% |
| Purchased Options |
1.70% |
| Warrants |
0.46% |
| Cash |
0.02% |
| Futures |
-0.05% |
| Written Options |
-0.81% |
| |
|
| TOTAL INVESTMENTS |
100.00% |
| (a) | Percentages calculated based on total portfolio, including securities sold short, cash balances,
market value of futures, and notional value of return swaps. |
| (b) | U.S. Multinationals includes companies organized or located in the United States that have more
than 50% of revenues derived outside of the United States. |
Clough Global Opportunities Fund
PORTFOLIO ALLOCATION
April 30, 2023 (Unaudited)
Growth of $10,000 Investment
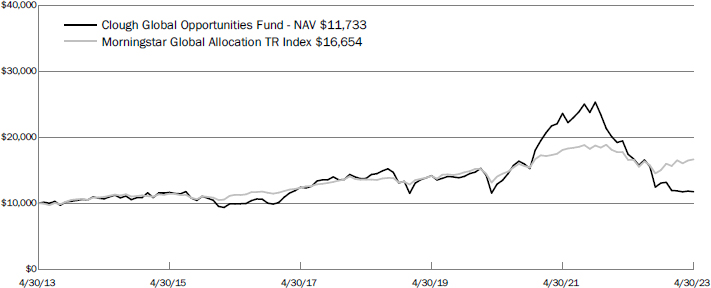
The graph shown above represents
historical performance of a hypothetical investment of $10,000 in the Fund since inception. Past performance does not guarantee
future results. All returns reflect reinvested dividends, but do not reflect the deduction of taxes that a shareholder would pay
on Fund distributions or the redemption of Fund shares
Total Return as of April 30, 2023(a)
| |
6 months |
1 Year |
3 years |
5 years |
10 years |
Annualized
Since
Inception
(4/25/2006) |
| Clough Global Opportunities Fund - NAV(b) |
0.63% |
-18.00% |
-1.59% |
-1.42% |
2.41% |
3.34% |
| Clough Global Opportunities Fund - Market Price(c) |
-10.06% |
-32.66% |
-2.87% |
-3.01% |
1.67% |
1.94% |
| Morningstar Global Allocation TR Index |
10.99% |
0.50% |
5.86% |
4.18% |
5.23% |
5.35% |
| (a) | Total returns assume reinvestment of all distributions. |
| (b) | Performance returns are net of management fees and other Fund expenses. |
| (c) | Market price is the value at which the Fund trades on an exchange. This market price can be
more or less than its NAV. |
Distribution to Common Shareholders
The Fund intends
to make monthly distributions to common shareholders according to its managed distribution policy. The Fund’s managed distribution
policy is to set the monthly distribution rate at an amount equal to one twelfth of 10% of the Fund’s adjusted year-ending
net asset value per share (“NAV”), which will be the average of the NAVs as of the last five business days of the
prior calendar year. The Board of Directors approve the distribution and may adjust it from time to time. The monthly distribution
amount paid from November 1, 2022 to December 31, 2022 was $0.0943 per share and the Fund paid $0.0483 per share monthly between
January 1, 2023 and April 30, 2023. At times, to maintain a stable level of distributions, the Fund may pay out less than all
of its net investment income or pay out accumulated undistributed income, or return of capital, in addition to current net investment
income.
Clough Global Opportunities Fund
PORTFOLIO ALLOCATION
April 30, 2023 (Continued) (Unaudited)
| Global Securities Holdings |
% of Total
Portfolio(a) |
| United States of America |
57.35% |
| US Multinational(b) |
33.52% |
| India |
3.76% |
| France |
2.24% |
| China |
1.49% |
| Canada |
1.10% |
| Hong Kong |
0.56% |
| South Korea |
0.45% |
| Denmark |
0.44% |
| Switzerland |
0.43% |
| Spain |
-0.12% |
| Germany |
-0.18% |
| Japan |
-0.31% |
| Chile |
-0.32% |
| Italy |
-0.43% |
| Other |
0.02% |
| TOTAL INVESTMENTS |
100.00% |
| Asset Allocation |
% of Total Portfolio(a) |
| Common Stock - US |
69.61% |
| Common Stock - Foreign |
8.37% |
| Closed-End Funds |
1.47% |
| Preferred Stock |
0.37% |
| Exchange Traded Funds |
0.11% |
| Total Return Swap Contracts |
-0.44% |
| Total Equities |
79.49% |
| |
|
| Corporate Bonds |
8.85% |
| U.S. Treasury Obligations |
8.23% |
| Convertible Corporate Bonds |
0.02% |
| Total Fixed Income |
17.10% |
| |
|
| Money Market Funds |
2.08% |
| Purchased Options |
1.70% |
| Warrants |
0.47% |
| Cash |
0.02% |
| Futures |
-0.05% |
| Written Options |
-0.81% |
| |
|
| TOTAL INVESTMENTS |
100.00% |
| (a) | Percentages calculated based on total portfolio, including securities sold short, cash balances,
market value of futures, and notional value of return swaps. |
| (b) | U.S. Multinationals includes companies organized or
located in the United States that have more than 50% of revenues derived outside of the United States. |
Clough
Global Dividend and Income Fund
SCHEDULE
OF INVESTMENTS
April
30, 2023 (Unaudited)
| | |
Shares | | |
Value | |
| COMMON STOCKS - 120.69% | |
| | | |
| | |
| Communication Services - 6.97% | |
| | | |
| | |
| AT&T, Inc.(a)(b) | |
| 128,500 | | |
$ | 2,270,595 | |
| Comcast Corp., Class A(b) | |
| 51,800 | | |
| 2,142,966 | |
| NetEase, Inc. - ADR | |
| 3,370 | | |
| 300,368 | |
| Paramount Global(b) | |
| 17,000 | | |
| 396,610 | |
| Verizon Communications, Inc.(b) | |
| 26,900 | | |
| 1,044,527 | |
| | |
| | | |
| 6,155,066 | |
| | |
| | | |
| | |
| Consumer Discretionary - 13.00% | |
| | | |
| | |
| Autoliv, Inc.(b) | |
| 17,450 | | |
| 1,497,384 | |
| D.R. Horton, Inc. | |
| 2,600 | | |
| 285,532 | |
| Home Depot, Inc.(a)(b) | |
| 9,200 | | |
| 2,764,968 | |
| McDonald's Corp.(b) | |
| 8,500 | | |
| 2,513,875 | |
| Meritage Homes Corp. | |
| 2,100 | | |
| 268,905 | |
| Newell Brands, Inc.(b) | |
| 50,200 | | |
| 609,930 | |
| PulteGroup, Inc. | |
| 4,300 | | |
| 288,745 | |
| Starbucks Corp.(a)(b) | |
| 19,100 | | |
| 2,182,939 | |
| Wynn Resorts, Ltd.(b)(c) | |
| 9,330 | | |
| 1,066,232 | |
| | |
| | | |
| 11,478,510 | |
| | |
| | | |
| | |
| Consumer Staples - 10.28% | |
| | | |
| | |
| Coca-Cola Co.(b) | |
| 30,550 | | |
| 1,959,783 | |
| General Mills, Inc.(b) | |
| 14,400 | | |
| 1,276,272 | |
| Kraft Heinz Co.(b) | |
| 23,700 | | |
| 930,699 | |
| PepsiCo, Inc.(b) | |
| 6,800 | | |
| 1,298,052 | |
| Procter & Gamble Co.(b) | |
| 15,900 | | |
| 2,486,442 | |
| Walgreens Boots Alliance, Inc.(b) | |
| 32,000 | | |
| 1,128,000 | |
| | |
| | | |
| 9,079,248 | |
| | |
| | | |
| | |
| Energy - 6.70% | |
| | | |
| | |
| Chevron Corp.(a)(b) | |
| 10,200 | | |
| 1,719,516 | |
| Exxon Mobil Corp.(a)(b) | |
| 20,890 | | |
| 2,472,123 | |
| Kinder Morgan, Inc.(b) | |
| 100,300 | | |
| 1,720,145 | |
| | |
| | | |
| 5,911,784 | |
| | |
| | | |
| | |
| Financials - 15.63% | |
| | | |
| | |
| Bank of America Corp.(a)(b) | |
| 62,500 | | |
| 1,830,000 | |
| Blackstone Mortgage Trust, Inc.(b) | |
| 26,100 | | |
| 476,064 | |
| Blackstone Secured Lending Fund(a)(b) | |
| 28,300 | | |
| 730,140 | |
| Charles Schwab Corp. | |
| 8,500 | | |
| 444,040 | |
| Comerica, Inc. | |
| 15,500 | | |
| 672,235 | |
| Golub Capital BDC, Inc.(b) | |
| 26,100 | | |
| 351,828 | |
| HDFC Bank Ltd. - ADR(a)(b) | |
| 19,000 | | |
| 1,326,200 | |
| ICICI Bank Ltd. - Sponsored ADR(a)(b) | |
| 41,600 | | |
| 946,400 | |
| JPMorgan Chase & Co.(b) | |
| 13,100 | | |
| 1,810,944 | |
| KeyCorp(b) | |
| 53,700 | | |
| 604,662 | |
| M&T Bank Corp.(b) | |
| 5,480 | | |
| 689,384 | |
| Morgan Stanley(a)(b) | |
| 22,750 | | |
| 2,046,818 | |
| Prudential Financial, Inc.(b) | |
| 4,000 | | |
| 348,000 | |
| Starwood Property Trust, Inc.(b) | |
| 35,100 | | |
| 627,939 | |
| Visa, Inc.(b) | |
| 3,900 | | |
| 907,647 | |
| | |
| | | |
| 13,812,301 | |
| | |
Shares | | |
Value | |
| Health Care - 18.50% | |
| | | |
| | |
| AbbVie, Inc.(a)(b) | |
| 3,500 | | |
$ | 528,920 | |
| Amgen, Inc.(b) | |
| 3,400 | | |
| 815,116 | |
| Baxter International, Inc.(b) | |
| 25,300 | | |
| 1,206,304 | |
| Bristol-Myers Squibb Co.(b) | |
| 20,700 | | |
| 1,382,139 | |
| Encompass Health Corp.(b) | |
| 11,800 | | |
| 756,970 | |
| Gilead Sciences, Inc.(a)(b) | |
| 7,700 | | |
| 633,017 | |
| Johnson & Johnson(b) | |
| 16,640 | | |
| 2,723,968 | |
| Medtronic PLC(a)(b) | |
| 31,900 | | |
| 2,901,305 | |
| Merck & Co., Inc.(a)(b) | |
| 15,700 | | |
| 1,812,879 | |
| Novo Nordisk A/S - Sponsored ADR(b) | |
| 1,730 | | |
| 289,066 | |
| Pfizer, Inc.(a)(b) | |
| 41,660 | | |
| 1,620,157 | |
| Select Medical Holdings Corp.(b) | |
| 25,000 | | |
| 762,500 | |
| UnitedHealth Group, Inc.(a)(b) | |
| 1,875 | | |
| 922,669 | |
| | |
| | | |
| 16,355,010 | |
| | |
| | | |
| | |
| Industrials - 16.19% | |
| | | |
| | |
| 3M Co.(b) | |
| 15,000 | | |
| 1,593,300 | |
| Airbus SE | |
| 30,434 | | |
| 4,263,684 | |
| Illinois Tool Works, Inc.(b) | |
| 2,200 | | |
| 532,268 | |
| Johnson Controls International PLC | |
| 8,200 | | |
| 490,688 | |
| Lockheed Martin Corp.(b) | |
| 1,000 | | |
| 464,450 | |
| Northrop Grumman Corp.(b) | |
| 7,810 | | |
| 3,602,519 | |
| Raytheon Technologies Corp.(a)(b) | |
| 28,690 | | |
| 2,866,131 | |
| United Parcel Service, Inc., Class B(b) | |
| 2,700 | | |
| 485,487 | |
| | |
| | | |
| 14,298,527 | |
| | |
| | | |
| | |
| Information Technology - 21.08% | |
| | | |
| | |
| Accenture PLC(b) | |
| 3,800 | | |
| 1,065,102 | |
| Analog Devices, Inc.(b) | |
| 13,400 | | |
| 2,410,392 | |
| Apple, Inc.(b) | |
| 12,540 | | |
| 2,127,787 | |
| Broadcom, Inc.(a)(b) | |
| 5,000 | | |
| 3,132,500 | |
| Cisco Systems, Inc.(b) | |
| 63,700 | | |
| 3,009,825 | |
| Lam Research Corp.(b) | |
| 2,970 | | |
| 1,556,518 | |
| Marvell Technology, Inc.(b) | |
| 10,600 | | |
| 418,488 | |
| Microsoft Corp.(a)(b) | |
| 10,505 | | |
| 3,227,766 | |
| Samsung Electronics Co., Ltd. | |
| 10,483 | | |
| 513,028 | |
| Texas Instruments, Inc.(b) | |
| 6,900 | | |
| 1,153,680 | |
| | |
| | | |
| 18,615,086 | |
| | |
| | | |
| | |
| Materials - 3.21% | |
| | | |
| | |
| Dow, Inc.(b) | |
| 38,300 | | |
| 2,083,520 | |
| International Paper Co.(b) | |
| 22,800 | | |
| 754,908 | |
| | |
| | | |
| 2,838,428 | |
| | |
| | | |
| | |
| Real Estate - 4.78% | |
| | | |
| | |
| American Tower Corp.(a)(b) | |
| 11,620 | | |
| 2,375,012 | |
| Crown Castle, Inc. | |
| 3,970 | | |
| 488,667 | |
| Simon Property Group, Inc.(b) | |
| 5,900 | | |
| 668,588 | |
| VICI Properties, Inc.(b) | |
| 20,200 | | |
| 685,588 | |
| | |
| | | |
| 4,217,855 | |
See
Notes to Financial Statements.
Clough
Global Dividend and Income Fund
SCHEDULE
OF INVESTMENTS
April
30, 2023 (Continued) (Unaudited)
| | |
Shares | | |
Value | |
| Utilities - 4.35% | |
| | | |
| | |
| AES Corp.(b) | |
| 44,100 | | |
$ | 1,043,406 | |
| Duke Energy Corp.(b) | |
| 12,800 | | |
| 1,265,664 | |
| Exelon Corp.(b) | |
| 36,200 | | |
| 1,536,328 | |
| | |
| | | |
| 3,845,398 | |
| | |
| | | |
| | |
| TOTAL COMMON STOCKS | |
| | | |
| | |
| (Cost $99,200,975) | |
| | | |
| 106,607,213 | |
| | |
| | | |
| | |
| CLOSED-END FUNDS - 2.43% | |
| | | |
| | |
| BlackRock Capital Allocation Trust(b) | |
| 34,300 | | |
| 518,616 | |
| Blackrock Innovation and Growth Trust(b) | |
| 154,100 | | |
| 1,146,504 | |
| Mainstay CBRE Global Infrastructure Megatrends Fund(b) | |
| 33,400 | | |
| 482,630 | |
| | |
| | | |
| 2,147,750 | |
| | |
| | | |
| | |
| TOTAL CLOSED-END FUNDS | |
| | | |
| | |
| (Cost $2,008,758) | |
| | | |
| 2,147,750 | |
| | |
| | | |
| | |
| EXCHANGE-TRADED FUNDS - 0.94% | |
| | | |
| | |
| iShares MSCI China ETF(b) | |
| 17,400 | | |
| 830,328 | |
| | |
| | | |
| | |
| TOTAL EXCHANGE-TRADED FUNDS | |
| | | |
| | |
| (Cost $908,082) | |
| | | |
| 830,328 | |
| | |
| | | |
| | |
| Description/Maturity Date/Rate | |
| | | |
| | |
| PREFERRED STOCKS - 1.19% | |
| | | |
| | |
| Gabelli Equity Trust, Inc., Perpetual Maturity, 5.000%(b)(d) | |
| 21,200 | | |
| 484,657 | |
| Trinity Capital, Inc., 1/16/2025, 7.000%(b) | |
| 22,400 | | |
| 567,840 | |
| | |
| | | |
| 1,052,497 | |
| | |
| | | |
| | |
| TOTAL PREFERRED STOCKS | |
| | | |
| | |
| (Cost $1,090,000) | |
| | | |
| 1,052,497 | |
| Underlying Security/Expiration Date/Exercise Price/Notional
Amount | |
Contracts | | |
Value | |
| PURCHASED OPTIONS - 2.18% | |
| | | |
| | |
| Put Options Purchased - 2.18% | |
| | | |
| | |
| 3 Month SOFR Future | |
| | | |
| | |
| 12/15/2023, $97, $764,400,000 | |
| 3,200 | | |
$ | 1,620,000 | |
| S&P 500 Index | |
| | | |
| | |
| 6/16/2023, $3,950, $29,186,360 | |
| 70 | | |
| 215,950 | |
| S&P 500 Index | |
| | | |
| | |
| 6/16/2023, $4,050, $8,338,960 | |
| 20 | | |
| 92,500 | |
| | |
| | | |
| 1,928,450 | |
| | |
| | | |
| | |
| TOTAL PURCHASED OPTIONS | |
| | | |
| | |
| (Cost $2,330,634) | |
| | | |
| 1,928,450 | |
| Description/Maturity Date/Rate | |
Principal
Amount | | |
| |
| CORPORATE BONDS - 14.39% | |
| | | |
| | |
| Consumer Discretionary - 3.39% | |
| | | |
| | |
| Carnival Corp. | |
| | | |
| | |
| 3/1/2026, 7.625%(e)(f) | |
$ | 970,000 | | |
| 888,006 | |
| Melco Resorts Finance Ltd. | |
| | | |
| | |
| 7/21/2028, 5.750%(b)(e)(f) | |
| 250,000 | | |
| 218,125 | |
| PulteGroup, Inc. | |
| | | |
| | |
| 1/15/2027, 5.000%(a)(b) | |
| 500,000 | | |
| 501,066 | |
| Toyota Motor Corp. | |
| | | |
| | |
| 3/25/2026, 1.339%(a)(b) | |
| 1,500,000 | | |
| 1,381,702 | |
| | |
| | | |
| 2,988,899 | |
| | |
| | | |
| | |
| Consumer Staples - 0.48% | |
| | | |
| | |
| Pilgrim's Pride Corp. | |
| | | |
| | |
| 9/30/2027, 5.875%(e)(f) | |
| 430,000 | | |
| 428,351 | |
| | |
| | | |
| | |
| Energy - 2.52% | |
| | | |
| | |
| Exxon Mobil Corp. | |
| | | |
| | |
| 3/19/2025, 2.992%(a)(b) | |
| 1,000,000 | | |
| 974,355 | |
| NGL Energy Operating LLC | |
| | | |
| | |
| 2/1/2026, 7.500%(e)(f) | |
| 440,000 | | |
| 422,310 | |
| Transocean, Inc. | |
| | | |
| | |
| 1/15/2026, 7.500%(e)(f) | |
| 900,000 | | |
| 831,321 | |
| | |
| | | |
| 2,227,986 | |
| | |
| | | |
| | |
| Financials - 0.48% | |
| | | |
| | |
| Trinity Capital, Inc. | |
| | | |
| | |
| 8/24/2026, 4.375%(b) | |
| 500,000 | | |
| 426,388 | |
| | |
| | | |
| | |
| Government - 0.65% | |
| | | |
| | |
| Federal Home Loan Banks | |
| | | |
| | |
| 2/27/2026, 5.250% | |
| 580,000 | | |
| 578,925 | |
See
Notes to Financial Statements.
Clough
Global Dividend and Income Fund
SCHEDULE
OF INVESTMENTS
April
30, 2023 (Continued) (Unaudited)
| Description/Maturity Date/Rate | |
Principal
Amount | | |
Value | |
| Health Care - 0.99% | |
| | | |
| | |
| Tenet Healthcare Corp. | |
| | | |
| | |
| 10/1/2028, 6.125% | |
$ | 900,000 | | |
$ | 874,268 | |
| | |
| | | |
| | |
| Industrials - 3.56% | |
| | | |
| | |
| Avis Budget Car Rental, LLC | |
| | | |
| | |
| 7/15/2027, 5.750%(e)(f) | |
| 450,000 | | |
| 422,144 | |
| Boeing Co. | |
| | | |
| | |
| 2/4/2026, 2.196%(b) | |
| 490,000 | | |
| 455,670 | |
| TransDigm, Inc. | |
| | | |
| | |
| 11/15/2027, 5.500%(b) | |
| 880,000 | | |
| 845,910 | |
| United Airlines 2020-1 Class B Pass Through Trust | |
| | | |
| | |
| 1/15/2026, 4.875% | |
| 397,300 | | |
| 385,554 | |
| US Airways 2012-2 Class A Pass Through Trust | |
| | | |
| | |
| 6/3/2025, 4.625%(a)(b) | |
| 644,044 | | |
| 611,453 | |
| US Airways 2013-1 Class A Pass Through Trust | |
| | | |
| | |
| 11/15/2025, 3.950%(a)(b) | |
| 443,831 | | |
| 418,278 | |
| | |
| | | |
| 3,139,009 | |
| | |
| | | |
| | |
| Information Technology - 2.32% | |
| | | |
| | |
| Apple, Inc. | |
| | | |
| | |
| 5/6/2024, 3.450%(b) | |
| 1,000,000 | | |
| 986,063 | |
| Broadcom, Inc. | |
| | | |
| | |
| 11/15/2025, 3.150%(b) | |
| 1,100,000 | | |
| 1,056,057 | |
| | |
| | | |
| 2,042,120 | |
| | |
| | | |
| | |
| TOTAL CORPORATE BONDS | |
| | | |
| | |
| (Cost $12,939,418) | |
| | | |
| 12,705,946 | |
| | |
| | | |
| | |
| ASSET-BACKED SECURITIES - 0.03% |
| United States Small Business Administration 12/1/2028, 6.220%(a)(b) | |
| 25,595 | | |
| 25,860 | |
| | |
| | | |
| | |
| TOTAL ASSET-BACKED SECURITIES | |
| | | |
| | |
| (Cost $25,595) | |
| | | |
| 25,860 | |
| | |
| | | |
| | |
| U.S. TREASURY OBLIGATIONS - 0.77% | |
| | | |
| | |
| Treasury Notes | |
| | | |
| | |
| 2/15/2053, 3.625% | |
| 170,000 | | |
| 168,605 | |
| 2/15/2043, 3.875% | |
| 180,000 | | |
| 181,955 | |
| 2/15/2026, 4.000%(b) | |
| 330,000 | | |
| 331,921 | |
| | |
| | | |
| 682,481 | |
| | |
| | | |
| | |
| TOTAL U.S. TREASURY OBLIGATIONS | |
| | | |
| | |
| (Cost $678,354) | |
| | | |
| 682,481 | |
| | |
Shares | | |
Value | |
| MONEY MARKET FUNDS - 0.85% | |
| | | |
| | |
| BlackRock Liquidity Funds, T-Fund Portfolio, Institutional Class, 4.710% (7-day yield) | |
| 754,218 | | |
$ | 754,218 | |
| | |
| | | |
| | |
| TOTAL MONEY MARKET FUNDS | |
| | | |
| | |
| (Cost $754,218) | |
| | | |
| 754,218 | |
| | |
| | | |
| | |
| TOTAL INVESTMENTS - 143.47% | |
| | | |
| | |
| (Cost $119,936,034) | |
| | | |
| 126,734,743 | |
| | |
| | | |
| | |
| Other Liabilities in Excess of Assets- (43.47)%(g) | |
| | | |
| (38,401,012 | ) |
| | |
| | | |
| | |
| NET ASSETS - 100.00% | |
| | | |
$ | 88,333,731 | |
| SCHEDULE OF SECURITIES SOLD SHORT | |
Shares | | |
Value | |
| COMMON STOCKS - (13.47)% | |
| | | |
| | |
| Communication Services - (0.33)% | |
| | | |
| | |
| SoftBank Group Corp. | |
| (7,700 | ) | |
| (287,892 | ) |
| | |
| | | |
| | |
| Consumer Discretionary - (4.53)% | |
| | | |
| | |
| Asbury Automotive Group, Inc.(c) | |
| (4,280 | ) | |
| (828,009 | ) |
| AutoNation, Inc.(c) | |
| (6,800 | ) | |
| (895,560 | ) |
| Ford Motor Co. | |
| (64,560 | ) | |
| (766,973 | ) |
| Harley-Davidson, Inc. | |
| (20,000 | ) | |
| (742,000 | ) |
| Macy's, Inc. | |
| (19,300 | ) | |
| (315,362 | ) |
| YETI Holdings, Inc.(c) | |
| (11,400 | ) | |
| (449,730 | ) |
| | |
| | | |
| (3,997,634 | ) |
| | |
| | | |
| | |
| Financials - (1.73)% | |
| | | |
| | |
| BNP Paribas | |
| (5,439 | ) | |
| (351,145 | ) |
| Credit Agricole S.A. | |
| (28,071 | ) | |
| (342,845 | ) |
| Deutsche Bank AG | |
| (18,300 | ) | |
| (201,483 | ) |
| Intesa Sanpaolo SpA | |
| (69,163 | ) | |
| (181,725 | ) |
| Societe Generale S.A. | |
| (5,689 | ) | |
| (138,069 | ) |
| Toast, Inc.(c) | |
| (3,700 | ) | |
| (67,340 | ) |
| UniCredit SpA | |
| (11,616 | ) | |
| (229,627 | ) |
| | |
| | | |
| (1,512,234 | ) |
| | |
| | | |
| | |
| Health Care - (1.14)% | |
| | | |
| | |
| AMN Healthcare Services, Inc.(c) | |
| (5,370 | ) | |
| (463,699 | ) |
| Cross Country Healthcare, Inc.(c) | |
| (25,000 | ) | |
| (549,500 | ) |
| | |
| | | |
| (1,013,199 | ) |
See
Notes to Financial Statements.
Clough
Global Dividend and Income Fund
SCHEDULE
OF INVESTMENTS
April
30, 2023 (Continued) (Unaudited)
| | |
Shares | | |
Value | |
| Industrials - (3.33)% | |
| | | |
| | |
| AMETEK, Inc. | |
| (1,800 | ) | |
$ | (248,274 | ) |
| Caterpillar, Inc. | |
| (1,100 | ) | |
| (240,680 | ) |
| Eaton Corp. PLC | |
| (1,500 | ) | |
| (250,680 | ) |
| General Electric Co. | |
| (2,700 | ) | |
| (267,219 | ) |
| Honeywell International, Inc. | |
| (1,300 | ) | |
| (259,792 | ) |
| Jacobs Solutions, Inc. | |
| (2,200 | ) | |
| (254,012 | ) |
| Rockwell Automation, Inc. | |
| (900 | ) | |
| (255,069 | ) |
| Shoals Technologies Group, Inc.(c) | |
| (19,400 | ) | |
| (405,266 | ) |
| Textron, Inc. | |
| (3,700 | ) | |
| (247,678 | ) |
| Trane Technologies PLC | |
| (1,400 | ) | |
| (260,134 | ) |
| Xylem, Inc. | |
| (2,600 | ) | |
| (269,984 | ) |
| | |
| | | |
| (2,958,788 | ) |
| | |
| | | |
| | |
| Information Technology - (1.89)% | |
| | | |
| | |
| Elastic N.V.(c) | |
| (2,200 | ) | |
| (125,950 | ) |
| International Business Machines Corp. | |
| (6,120 | ) | |
| (773,629 | ) |
| ON Semiconductor Corp.(c) | |
| (3,100 | ) | |
| (223,076 | ) |
| Palantir Technologies, Inc.(c) | |
| (17,300 | ) | |
| (134,075 | ) |
| Shopify, Inc.(c) | |
| (1,700 | ) | |
| (82,365 | ) |
| Smartsheet, Inc.(c) | |
| (4,600 | ) | |
| (188,002 | ) |
| UiPath, Inc.(c) | |
| (10,400 | ) | |
| (146,432 | ) |
| | |
| | | |
| (1,673,529 | ) |
| | |
| | | |
| | |
| Materials - (0.52)% | |
| | | |
| | |
| O-I Glass, Inc.(c) | |
| (20,300 | ) | |
| (456,141 | ) |
| | |
| | | |
| | |
TOTAL COMMON STOCKS | |
| | | |
| | |
| (Proceeds $11,540,052) | |
| | | |
| (11,899,417 | ) |
| | |
| | | |
| | |
| EXCHANGE-TRADED FUNDS - (5.78)% | |
| | | |
| | |
| Consumer Staples Select Sector SPDR Fund | |
| (10,300 | ) | |
| (797,632 | ) |
| iShares U.S. Industrials ETF | |
| (8,400 | ) | |
| (837,564 | ) |
| iShares U.S. Real Estate ETF | |
| (13,400 | ) | |
| (1,148,112 | ) |
| iShares U.S. Financials ETF | |
| (16,200 | ) | |
| (1,185,354 | ) |
| Utilities Select Sector SPDR Fund | |
| (16,500 | ) | |
| (1,138,170 | ) |
| | |
| | | |
| (5,106,832 | ) |
| | |
| | | |
| | |
| TOTAL EXCHANGE-TRADED FUNDS | |
| | | |
| | |
| (Proceeds $4,839,120) | |
| | | |
| (5,106,832 | ) |
| | |
| | | |
| | |
| TOTAL SECURITIES SOLD SHORT | |
| | | |
| | |
| (Proceeds $16,379,172) | |
| | | |
| (17,006,249 | ) |
Investment
Abbreviations:
ADR
- American Depository Receipt
SOFR
- Secured Overnight Financing Rate
FEDEF
Rates:
1D
FEDEF - 1 day effective Federal Funds Rate as of April 30, 2023 was 4.83%
| (a) | Loaned
security; a portion or all of the security is on loan as of April 30,
2023. |
| (b) | Pledged
security; a portion or all of the security is pledged as collateral for securities sold
short or borrowings. As of April 30, 2023, the aggregate value of those securities was
$110,854,744, representing 125.50% of net assets. (Note 1 & Note 6) |
| (c) | Non-income
producing security. |
| (d) | This
security has no contractual maturity date, is not redeemable and contractually pays an
indefinite stream of interest. |
| (e) | Restricted
security. (Note 1) |
| (f) | All
or a portion of the security is exempt from registration of the Securities
Act of 1933. These securities may be resold in transactions exempt from registration under Rule 144A, normally to qualified institutional
buyers. As of April 30, 2023, these securities had an aggregate value of $3,210,257 or 3.64% of net assets. |
| (g) | Includes
cash which is being held as collateral for securities sold short. |
For
Fund compliance purposes, the Fund’s sector classifications refer to any one of the sector sub-classifications used by one
or more widely recognized market indexes, and/or as defined by Fund management. This definition may not apply for purposes of
this report, which may combine sector sub-classifications for reporting ease. Sectors are shown as a percent of net assets. These
sector classifications are unaudited.
See
Notes to Financial Statements.
Clough
Global Dividend and Income Fund
SCHEDULE
OF INVESTMENTS
April
30, 2023 (Continued) (Unaudited)
Futures
Contracts
| Description | |
Counterparty | |
Position | | |
Contracts | | |
Expiration Date | |
Notional Value | | |
Value | | |
Unrealized
Depreciation | |
| 3 Month SOFR | |
Morgan Stanley | |
Long | | |
99 | | |
December 2023 | |
$ | 23,648,625 | | |
$ | (27,408 | ) | |
$ | (27,408 | ) |
| 3 Month SOFR | |
Morgan Stanley | |
Long | | |
13 | | |
December 2024 | |
| 3,152,175 | | |
| (8,672 | ) | |
| (8,672 | ) |
| 3 Month SOFR | |
Morgan Stanley | |
Long | | |
45 | | |
September 2023 | |
| 10,704,937 | | |
| (8,056 | ) | |
| (8,056 | ) |
| | |
| |
| | |
| | |
| |
$ | 37,505,737 | | |
$ | (44,136 | ) | |
$ | (44,136 | ) |
Call
Options Written
| Underlying Security | |
Counterparty | |
Expiration
Date | |
Strike Price | | |
Contracts | | |
Notional Amount | | |
Value | |
| 3 Month SOFR Future | |
Morgan Stanley | |
12/15/2023 | |
$ | 98 | | |
| (3,200 | ) | |
$ | (764,400,000 | ) | |
$ | (780,000 | ) |
| | |
| |
| |
| | | |
| | | |
$ | (764,400,000 | ) | |
$ | (780,000 | ) |
Put
Options Written
| Underlying Security | |
Counterparty | |
Expiration
Date | |
Strike Price | | |
Contracts | | |
Notional Amount | | |
Value | |
| S&P 500 Index | |
Morgan Stanley | |
6/16/2023 | |
$ | 3,750 | | |
| (70 | ) | |
$ | (29,186,360 | ) | |
$ | (96,950 | ) |
| S&P 500 Index | |
Morgan Stanley | |
6/16/2023 | |
| 3,850 | | |
| (20 | ) | |
| (8,338,960 | ) | |
| (41,000 | ) |
| | |
| |
| |
| | | |
| | | |
$ | (37,525,320 | ) | |
$ | (137,950 | ) |
Total
Return Swap Contracts
| Reference Entity/Obligation | |
Counterparty | |
Floating Rate
Received by the
Fund(a) | |
Termination Date | |
Notional
Amount | | |
Value | | |
Net Unrealized
Appreciation | |
| Sociedad Quimica y Minera de Chile S.A. - ADR | |
Morgan Stanley | |
1D FEDEF - 58 bps | |
1/3/2024 | |
$ | (367,185 | ) | |
$ | (317,156 | ) | |
$ | 50,029 | |
| | |
| |
| |
| |
$ | (367,185 | ) | |
$ | (317,156 | ) | |
$ | 50,029 | |
| Reference Entity/Obligation | |
Counterparty | |
Floating Rate
Received by the
Fund(a) | |
Termination Date | |
Notional
Amount | | |
Value | | |
Net Unrealized
Depreciation | |
| Banco Bilbao Vizcaya Argenta | |
Morgan Stanley | |
1D FEDEF - 50 bps | |
10/2/2024 | |
$ | (118,014 | ) | |
$ | (191,362 | ) | |
$ | (73,348 | ) |
| | |
| |
| |
| |
$ | (118,014 | ) | |
$ | (191,362 | ) | |
$ | (73,348 | ) |
| (a) | Payment
received when swap contract closes. |
See
Notes to Financial Statements.
Clough
Global Equity Fund
SCHEDULE
OF INVESTMENTS
April
30, 2023 (Unaudited)
| | |
Shares | | |
Value | |
| COMMON STOCKS - 120.06% | |
| | | |
| | |
| Communication Services - 7.97% | |
| | | |
| | |
| Alphabet, Inc.(a)(b)(c) | |
| 55,980 | | |
$ | 6,058,156 | |
| NetEase, Inc. - ADR | |
| 7,470 | | |
| 665,801 | |
| T-Mobile US, Inc.(a)(c) | |
| 16,310 | | |
| 2,347,009 | |
| Walt Disney Co.(a)(c) | |
| 19,300 | | |
| 1,978,250 | |
| | |
| | | |
| 11,049,216 | |
| | |
| | | |
| | |
| Consumer Discretionary - 12.70% | |
| | | |
| | |
| Amazon.com, Inc.(a)(b)(c) | |
| 42,210 | | |
| 4,451,044 | |
| Booking Holdings, Inc.(a)(c) | |
| 400 | | |
| 1,074,524 | |
| BYD Co. Ltd. | |
| 58,000 | | |
| 1,743,772 | |
| D.R. Horton, Inc. | |
| 4,100 | | |
| 450,262 | |
| DraftKings, Inc.(a) | |
| 33,600 | | |
| 736,176 | |
| Home Depot, Inc.(b)(c) | |
| 3,405 | | |
| 1,023,339 | |
| Marriott International, Inc.(c) | |
| 3,100 | | |
| 524,954 | |
| Melco
Resorts & Entertainment Ltd. - ADR(a)(c) | |
| 72,400 | | |
| 987,536 | |
| Meritage Homes Corp. | |
| 3,300 | | |
| 422,565 | |
| Norwegian Cruise Line Holdings Ltd.(a)(c) | |
| 27,200 | | |
| 363,120 | |
| PulteGroup, Inc. | |
| 6,700 | | |
| 449,905 | |
| Royal Caribbean Cruises Ltd.(a)(b)(c) | |
| 47,620 | | |
| 3,115,777 | |
| Trip.com Group Ltd. - ADR(a) | |
| 18,400 | | |
| 653,384 | |
| Wynn Resorts, Ltd.(a)(c) | |
| 14,090 | | |
| 1,610,205 | |
| | |
| | | |
| 17,606,563 | |
| | |
| | | |
| | |
| Consumer Staples - 5.13% | |
| | | |
| | |
| Coca-Cola Co.(c) | |
| 11,900 | | |
| 763,385 | |
| General Mills, Inc.(c) | |
| 11,100 | | |
| 983,793 | |
| Kraft Heinz Co.(c) | |
| 20,800 | | |
| 816,816 | |
| Kroger Co.(c) | |
| 17,100 | | |
| 831,573 | |
| Procter & Gamble Co.(c) | |
| 17,500 | | |
| 2,736,650 | |
| Walgreens Boots Alliance, Inc.(c) | |
| 27,800 | | |
| 979,950 | |
| | |
| | | |
| 7,112,167 | |
| | |
| | | |
| | |
| Energy - 5.51% | |
| | | |
| | |
| Cheniere Energy, Inc.(b)(c) | |
| 6,960 | | |
| 1,064,880 | |
| Exxon Mobil Corp.(c) | |
| 24,390 | | |
| 2,886,313 | |
| Kinder Morgan, Inc.(b)(c) | |
| 108,900 | | |
| 1,867,635 | |
| Schlumberger N.V.(c) | |
| 16,000 | | |
| 789,600 | |
| Transocean Ltd.(a)(c) | |
| 173,500 | | |
| 1,023,650 | |
| | |
| | | |
| 7,632,078 | |
| | |
Shares | | |
Value | |
| Financials - 16.74% | |
| | | |
| | |
| Bank of America Corp.(b)(c) | |
| 51,000 | | |
$ | 1,493,280 | |
| Berkshire Hathaway, Inc.(a)(c) | |
| 4 | | |
| 2,011,520 | |
| Blackstone Mortgage Trust, Inc.(c) | |
| 36,900 | | |
| 673,056 | |
| Blackstone Secured Lending Fund(b)(c) | |
| 44,900 | | |
| 1,158,420 | |
| Charles Schwab Corp. | |
| 13,300 | | |
| 694,792 | |
| Comerica, Inc.(c) | |
| 15,600 | | |
| 676,572 | |
| HDFC Bank Ltd. - ADR(b)(c) | |
| 52,700 | | |
| 3,678,460 | |
| ICICI Bank Ltd. - Sponsored ADR(b)(c) | |
| 128,600 | | |
| 2,925,650 | |
| JPMorgan Chase & Co.(c) | |
| 18,100 | | |
| 2,502,144 | |
| KeyCorp(c) | |
| 54,300 | | |
| 611,418 | |
| M&T Bank Corp.(c) | |
| 5,560 | | |
| 699,448 | |
| Mastercard, Inc.(c) | |
| 6,500 | | |
| 2,470,195 | |
| Starwood Property Trust, Inc.(c) | |
| 27,900 | | |
| 499,131 | |
| Visa, Inc.(b)(c) | |
| 13,250 | | |
| 3,083,673 | |
| | |
| | | |
| 23,177,759 | |
| | |
| | | |
| | |
| Health Care - 24.96% | |
| | | |
| | |
| 2Seventy Bio, Inc.(a)(c) | |
| 171,400 | | |
| 1,630,014 | |
| Acadia Healthcare Co., Inc.(a)(c) | |
| 7,800 | | |
| 563,862 | |
| Amphivena
Therapeutics, Inc. Series C(a)(d)(e)(f)(g)(h) | |
| 334,425 | | |
| 391,411 | |
| Apellis Pharmaceuticals, Inc.(a)(b)(c) | |
| 14,477 | | |
| 1,207,816 | |
| Arcellx, Inc.(a)(b)(c) | |
| 39,764 | | |
| 1,697,128 | |
| Ascendis Pharma A/S - ADR(a) | |
| 4,800 | | |
| 335,808 | |
| Baxter International, Inc.(c) | |
| 39,400 | | |
| 1,878,592 | |
| Boston Scientific Corp.(a)(b)(c) | |
| 12,900 | | |
| 672,348 | |
| Bristol-Myers Squibb Co.(c) | |
| 21,100 | | |
| 1,408,847 | |
| Centrexion Therapeutics Corp.(a)(e)(f)(g)(h) | |
| 4,336 | | |
| 23,371 | |
| Cigna Group(c) | |
| 1,900 | | |
| 481,251 | |
| CRISPR Therapeutics AG(a)(b)(c) | |
| 15,710 | | |
| 768,847 | |
| Elevance Health, Inc.(c) | |
| 1,800 | | |
| 843,570 | |
| Eli Lilly and Co.(b)(c) | |
| 3,205 | | |
| 1,268,731 | |
| Encompass Health Corp.(c) | |
| 18,300 | | |
| 1,173,945 | |
| Halozyme Therapeutics, Inc.(a)(c) | |
| 18,100 | | |
| 581,553 | |
| HCA Healthcare, Inc.(c) | |
| 4,830 | | |
| 1,387,804 | |
| Hologic, Inc.(a)(c) | |
| 10,000 | | |
| 860,100 | |
| Illumina, Inc.(a)(c) | |
| 8,345 | | |
| 1,715,398 | |
| Jazz Pharmaceuticals PLC(a)(b)(c) | |
| 9,320 | | |
| 1,309,180 | |
| Johnson & Johnson(c) | |
| 26,470 | | |
| 4,333,139 | |
| Legend Biotech Corp. - ADR(a)(b)(c) | |
| 12,300 | | |
| 845,133 | |
| Merck & Co., Inc.(b)(c) | |
| 15,260 | | |
| 1,762,072 | |
| Novo Nordisk A/S - Sponsored ADR(c) | |
| 2,600 | | |
| 434,434 | |
| Select Medical Holdings Corp.(c) | |
| 38,900 | | |
| 1,186,450 | |
| Surgery Partners, Inc.(a)(b)(c) | |
| 21,600 | | |
| 856,656 | |
| Tenet Healthcare Corp.(a)(b)(c) | |
| 11,370 | | |
| 833,648 | |
| UnitedHealth Group, Inc.(b)(c) | |
| 2,390 | | |
| 1,176,095 | |
| Veracyte, Inc.(a)(b)(c) | |
| 32,100 | | |
| 726,744 | |
| Vertex Pharmaceuticals, Inc.(a)(c) | |
| 3,945 | | |
| 1,344,180 | |
| Zimmer Biomet Holdings, Inc.(c) | |
| 6,170 | | |
| 854,175 | |
| | |
| | | |
| 34,552,302 | |
See
Notes to Financial Statements.
Clough
Global Equity Fund
SCHEDULE
OF INVESTMENTS
April
30, 2023 (Continued) (Unaudited)
| | |
Shares | | |
Value | |
| Industrials - 18.76% | |
| | | |
| | |
| Airbus SE | |
| 37,902 | | |
$ | 5,309,922 | |
| Boeing Co.(a)(b)(c) | |
| 18,990 | | |
| 3,926,752 | |
| Deere & Co.(c) | |
| 1,200 | | |
| 453,624 | |
| Hertz Global Holdings, Inc.(a)(b)(c) | |
| 21,500 | | |
| 358,620 | |
| Lockheed Martin Corp.(c) | |
| 1,000 | | |
| 464,450 | |
| Northrop Grumman Corp.(c) | |
| 14,045 | | |
| 6,478,537 | |
| Raytheon Technologies Corp.(b)(c) | |
| 47,530 | | |
| 4,748,247 | |
| TransDigm Group, Inc.(b)(c) | |
| 5,587 | | |
| 4,274,055 | |
| | |
| | | |
| 26,014,207 | |
| | |
| | | |
| | |
| Information Technology - 19.80% | |
| | | |
| | |
| Accenture PLC(c) | |
| 5,800 | | |
| 1,625,682 | |
| Amphenol Corp.(c) | |
| 6,700 | | |
| 505,649 | |
| Analog Devices, Inc.(c) | |
| 19,200 | | |
| 3,453,696 | |
| Apple, Inc.(b)(c) | |
| 20,620 | | |
| 3,498,802 | |
| Broadcom, Inc.(b)(c) | |
| 5,800 | | |
| 3,633,700 | |
| Cisco Systems, Inc.(c) | |
| 26,500 | | |
| 1,252,125 | |
| Lam Research Corp.(b)(c) | |
| 6,090 | | |
| 3,191,647 | |
| Marvell Technology, Inc.(c) | |
| 16,000 | | |
| 631,680 | |
| Microsoft Corp.(b)(c) | |
| 18,095 | | |
| 5,559,870 | |
| Palo Alto Networks, Inc.(a)(b)(c) | |
| 6,270 | | |
| 1,144,024 | |
| Qualcomm, Inc.(b)(c) | |
| 18,600 | | |
| 2,172,480 | |
| Samsung Electronics Co., Ltd. | |
| 16,231 | | |
| 794,330 | |
| | |
| | | |
| 27,463,685 | |
| | |
| | | |
| | |
| Materials - 2.50% | |
| | | |
| | |
| Air Products and Chemicals, Inc.(c) | |
| 2,900 | | |
| 853,644 | |
| Linde PLC(c) | |
| 4,900 | | |
| 1,810,305 | |
| Sherwin-Williams Co.(c) | |
| 3,300 | | |
| 783,882 | |
| | |
| | | |
| 3,447,831 | |
| | |
| | | |
| | |
| Real Estate - 3.21% | |
| | | |
| | |
| American Tower Corp.(b)(c) | |
| 13,760 | | |
| 2,812,406 | |
| Crown Castle, Inc.(c) | |
| 6,160 | | |
| 758,234 | |
| Prologis, Inc.(c) | |
| 3,700 | | |
| 463,425 | |
| Simon Property Group, Inc.(c) | |
| 3,700 | | |
| 419,284 | |
| | |
| | | |
| 4,453,349 | |
| | |
| | | |
| | |
| Utilities - 2.78% | |
| | | |
| | |
| AES Corp.(c) | |
| 42,300 | | |
| 1,000,818 | |
| Duke Energy Corp.(c) | |
| 12,400 | | |
| 1,226,112 | |
| Exelon Corp.(c) | |
| 38,400 | | |
| 1,629,696 | |
| | |
| | | |
| 3,856,626 | |
| | |
| | | |
| | |
| TOTAL COMMON STOCKS | |
| | | |
| | |
| (Cost $153,717,379) | |
| | | |
| 166,365,783 | |
| | |
Shares | | |
Value | |
| CLOSED-END FUNDS - 1.86% | |
| | | |
| | |
| BlackRock Capital Allocation Trust(c) | |
| 52,200 | | |
$ | 789,264 | |
| Blackrock
Innovation and Growth Trust(b)(c) | |
| 142,900 | | |
| 1,063,176 | |
| Mainstay CBRE Global Infrastructure Megatrends Fund(c) | |
| 50,400 | | |
| 728,280 | |
| | |
| | | |
| 2,580,720 | |
| | |
| | | |
| | |
| TOTAL CLOSED-END FUNDS | |
| | | |
| | |
| (Cost $2,392,188) | |
| | | |
| 2,580,720 | |
| | |
| | | |
| | |
| EXCHANGE-TRADED FUNDS - 1.03% | |
| | | |
| | |
| iShares MSCI China ETF(c) | |
| 26,000 | | |
| 1,240,720 | |
| United States Natural Gas Fund, LP(a)(b)(c) | |
| 26,500 | | |
| 185,765 | |
| | |
| | | |
| 1,426,485 | |
| | |
| | | |
| | |
| TOTAL EXCHANGE-TRADED FUNDS | |
| | | |
| | |
| (Cost $1,872,419) | |
| | | |
| 1,426,485 | |
| Description/Maturity Date/Rate | |
| | |
| |
| PREFERRED STOCKS - 0.26% | |
| | | |
| | |
| Centrexion
Therapeutics Corp. Series D Preferred, Perpetual Maturity, (a)(d)(e)(f)(g)(h)(i) | |
| 66,719 | | |
| 359,616 | |
| | |
| | | |
| | |
| TOTAL PREFERRED STOCKS | |
| | | |
| | |
| (Cost $701,250) | |
| | | |
| 359,616 | |
| | |
| | | |
| | |
| WARRANTS - 0.58% | |
| | | |
| | |
| Hertz Global Holdings, Inc. Strike Price $13.80, Expires 6/30/2051(a) | |
| 85,790 | | |
| 806,426 | |
| | |
| | | |
| | |
| TOTAL WARRANTS | |
| | | |
| | |
| (Cost $1,375,740) | |
| | | |
| 806,426 | |
| Underlying Security/Expiration Date/Exercise Price/Notional Amount | |
Contracts | | |
| |
| PURCHASED OPTIONS - 2.17% | |
| | | |
| | |
| Put Options Purchased - 2.17% | |
| | | |
| | |
| 3 Month SOFR Future | |
| | | |
| | |
| 12/15/2023, $97, $1,194,375,000 | |
| 5,000 | | |
| 2,531,250 | |
| S&P 500 Index | |
| | | |
| | |
| 6/16/2023, $3,950, $41,694,800 | |
| 100 | | |
| 308,500 | |
| S&P 500 Index | |
| | | |
| | |
| 6/16/2023, $4,050, $14,593,180 | |
| 35 | | |
| 161,875 | |
| | |
| | | |
| 3,001,625 | |
| | |
| | | |
| | |
| TOTAL PURCHASED OPTIONS | |
| | | |
| | |
| (Cost $3,563,086) | |
| | | |
| 3,001,625 | |
See
Notes to Financial Statements.
Clough
Global Equity Fund
SCHEDULE
OF INVESTMENTS
April
30, 2023 (Continued) (Unaudited)
| Description/Maturity Date/Rate | |
Principal
Amount | | |
Value | |
| CORPORATE BONDS - 4.52% | |
| | | |
| | |
| Consumer Discretionary - 0.99% | |
| | | |
| | |
| Carnival Corp. | |
| | | |
| | |
| 3/1/2026, 7.625%(b)(c)(d)(f) | |
$ | 1,500,000 | | |
$ | 1,373,206 | |
| | |
| | | |
| | |
| Energy - 0.97% | |
| | | |
| | |
| Transocean, Inc. | |
| | | |
| | |
| 1/15/2026, 7.500%(b)(c)(d)(f) | |
| 1,450,000 | | |
| 1,339,350 | |
| | |
| | | |
| | |
| Government - 0.64% | |
| | | |
| | |
| Federal Home Loan Banks | |
| | | |
| | |
| 2/27/2026, 5.250% | |
| 890,000 | | |
| 888,350 | |
| | |
| | | |
| | |
| Industrials - 1.92% | |
| | | |
| | |
| Boeing Co. | |
| | | |
| | |
| 2/4/2026, 2.196%(b)(c) | |
| 740,000 | | |
| 688,155 | |
| TransDigm, Inc. | |
| | | |
| | |
| 11/15/2027, 5.500%(b)(c) | |
| 1,360,000 | | |
| 1,307,315 | |
| US Airways 2013-1 Class A Pass Through Trust | |
| | | |
| | |
| 11/15/2025, 3.950%(c) | |
| 710,130 | | |
| 669,246 | |
| | |
| | | |
| 2,664,716 | |
| | |
| | | |
| | |
| TOTAL CORPORATE BONDS | |
| | | |
| | |
| (Cost $6,238,050) | |
| | | |
| 6,265,622 | |
| | |
| | | |
| | |
CONVERTIBLE CORPORATE BONDS - 0.02% | |
| | | |
| | |
| Health Care - 0.02% | |
| | | |
| | |
| Amphivena
Convertible Note PP 12/31/2049(a)(d)(e)(f)(g)(h) | |
| 108,750 | | |
| 32,625 | |
| | |
| | | |
| | |
| TOTAL CONVERTIBLE CORPORATE BONDS | |
| | | |
| | |
| (Cost $108,750) | |
| | | |
| 32,625 | |
| | |
| | | |
| | |
| U.S. TREASURY OBLIGATIONS - 13.43% | |
| | | |
| | |
| Treasury Notes | |
| | | |
| | |
| 2/15/2053, 3.625% | |
| 3,380,000 | | |
| 3,352,273 | |
| 2/15/2043, 3.875% | |
| 3,700,000 | | |
| 3,740,180 | |
| 2/15/2026, 4.000%(c) | |
| 2,820,000 | | |
| 2,836,413 | |
| 1/31/2025, 4.125%(c) | |
| 2,820,000 | | |
| 2,815,869 | |
| 11/15/2042, 4.000% | |
| 2,800,000 | | |
| 2,884,875 | |
| 11/15/2052, 4.000% | |
| 2,800,000 | | |
| 2,973,688 | |
| | |
| | | |
| 18,603,298 | |
| | |
| | | |
| | |
| TOTAL U.S. TREASURY OBLIGATIONS | |
| | | |
| | |
| (Cost $18,519,613) | |
| | | |
| 18,603,298 | |
| | |
Shares | | |
Value | |
| MONEY MARKET FUNDS - 2.24% | |
| | | |
| | |
| BlackRock Liquidity Funds, T-Fund Portfolio, Institutional Class, 4.710% (7-day yield) | |
| 3,108,064 | | |
$ | 3,108,064 | |
| | |
| | | |
| | |
| TOTAL MONEY MARKET FUNDS | |
| | | |
| | |
| (Cost $3,108,064) | |
| | | |
| 3,108,064 | |
| | |
| | | |
| | |
| TOTAL INVESTMENTS - 146.17% | |
| | | |
| | |
| (Cost $191,596,539) | |
| | | |
| 202,550,264 | |
| | |
| | | |
| | |
| Other Liabilities in Excess of Assets- (46.17)%(j) | |
| | | |
| (63,975,857 | ) |
| | |
| | | |
| | |
| NET ASSETS - 100.00% | |
| | | |
$ | 138,574,407 | |
| SCHEDULE OF SECURITIES SOLD SHORT | |
Shares | | |
Value | |
| COMMON STOCKS - (17.31)% | |
| | | |
| | |
| Communication Services - (0.39)% | |
| | | |
| | |
| SoftBank Group Corp. | |
| (14,600 | ) | |
| (545,873 | ) |
| | |
| | | |
| | |
| Consumer Discretionary - (5.36)% | |
| | | |
| | |
| Asbury Automotive Group, Inc.(a) | |
| (6,580 | ) | |
| (1,272,967 | ) |
| AutoNation, Inc.(a) | |
| (10,450 | ) | |
| (1,376,265 | ) |
| Ford Motor Co. | |
| (128,280 | ) | |
| (1,523,966 | ) |
| Harley-Davidson, Inc. | |
| (37,300 | ) | |
| (1,383,830 | ) |
| Macy's, Inc. | |
| (72,100 | ) | |
| (1,178,114 | ) |
| YETI Holdings, Inc.(a) | |
| (17,700 | ) | |
| (698,265 | ) |
| | |
| | | |
| (7,433,407 | ) |
| | |
| | | |
| | |
| Financials - (1.92)% | |
| | | |
| | |
| BNP Paribas | |
| (9,800 | ) | |
| (632,693 | ) |
| Credit Agricole S.A. | |
| (50,875 | ) | |
| (621,362 | ) |
| Deutsche Bank AG | |
| (28,100 | ) | |
| (309,381 | ) |
| Intesa Sanpaolo SpA | |
| (124,563 | ) | |
| (327,288 | ) |
| Societe Generale S.A. | |
| (10,239 | ) | |
| (248,495 | ) |
| Toast, Inc.(a) | |
| (5,600 | ) | |
| (101,920 | ) |
| UniCredit SpA | |
| (21,040 | ) | |
| (415,922 | ) |
| | |
| | | |
| (2,657,061 | ) |
| | |
| | | |
| | |
| Health Care - (2.59)% | |
| | | |
| | |
| AmerisourceBergen Corp. | |
| (4,300 | ) | |
| (717,455 | ) |
| AMN Healthcare Services, Inc.(a) | |
| (8,210 | ) | |
| (708,934 | ) |
| Cross Country Healthcare, Inc.(a) | |
| (38,900 | ) | |
| (855,022 | ) |
| Danaher Corp. | |
| (2,700 | ) | |
| (639,657 | ) |
| STERIS PLC | |
| (3,500 | ) | |
| (659,925 | ) |
| | |
| | | |
| (3,580,993 | ) |
See
Notes to Financial Statements.
Clough
Global Equity Fund
SCHEDULE
OF INVESTMENTS
April
30, 2023 (Continued) (Unaudited)
| | |
Shares | | |
Value | |
| Industrials - (4.37)% | |
| | | |
| | |
| AMETEK, Inc. | |
| (2,800 | ) | |
$ | (386,204 | ) |
| Caterpillar, Inc. | |
| (1,800 | ) | |
| (393,840 | ) |
| Eaton Corp. PLC | |
| (2,400 | ) | |
| (401,088 | ) |
| General Electric Co. | |
| (4,300 | ) | |
| (425,571 | ) |
| Honeywell International, Inc. | |
| (2,100 | ) | |
| (419,664 | ) |
| Jacobs Solutions, Inc. | |
| (3,500 | ) | |
| (404,110 | ) |
| Paychex, Inc. | |
| (6,000 | ) | |
| (659,160 | ) |
| Rockwell Automation, Inc. | |
| (1,400 | ) | |
| (396,774 | ) |
| Shoals Technologies Group, Inc.(a) | |
| (30,000 | ) | |
| (626,700 | ) |
| Textron, Inc. | |
| (5,800 | ) | |
| (388,252 | ) |
| Trane Technologies PLC | |
| (2,100 | ) | |
| (390,201 | ) |
| Waste Management, Inc. | |
| (4,500 | ) | |
| (747,225 | ) |
| Xylem, Inc. | |
| (4,000 | ) | |
| (415,360 | ) |
| | |
| | | |
| (6,054,149 | ) |
| | |
| | | |
| | |
| Information Technology - (2.17)% | |
| | | |
| | |
| Elastic N.V.(a) | |
| (3,500 | ) | |
| (200,375 | ) |
| International Business Machines Corp. | |
| (6,240 | ) | |
| (788,798 | ) |
| ON Semiconductor Corp.(a) | |
| (5,800 | ) | |
| (417,368 | ) |
| Palantir Technologies, Inc.(a) | |
| (27,000 | ) | |
| (209,250 | ) |
| Roper Technologies, Inc. | |
| (1,600 | ) | |
| (727,648 | ) |
| Shopify, Inc.(a) | |
| (2,700 | ) | |
| (130,815 | ) |
| Smartsheet, Inc.(a) | |
| (7,300 | ) | |
| (298,351 | ) |
| UiPath, Inc.(a) | |
| (16,300 | ) | |
| (229,504 | ) |
| | |
| | | |
| (3,002,109 | ) |
| | |
| | | |
| | |
| Materials - (0.51)% | |
| | | |
| | |
| O-I Glass, Inc.(a) | |
| (31,500 | ) | |
| (707,805 | ) |
| | |
| | | |
| | |
| TOTAL COMMON STOCKS | |
| | | |
| | |
| (Proceeds $23,416,642) | |
| | | |
| (23,981,397 | ) |
| | |
| | | |
| | |
| TOTAL SECURITIES SOLD SHORT | |
| | | |
| | |
| (Proceeds $23,416,642) | |
| | | |
| (23,981,397 | ) |
Investment
Abbreviations:
ADR
- American Depository Receipt
SOFR
- Secured Overnight Financing Rate
FEDEF
Rates:
1D
FEDEF - 1 day effective Federal Funds Rate as of April 30, 2023 was 4.83%
| (a) | Non-income
producing security. |
| (b) | Loaned
security; a portion or all of the security is on loan as of April 30,
2023. |
| (c) | Pledged
security; a portion or all of the security is pledged as collateral for securities sold
short or borrowings. As of April 30, 2023, the aggregate value of those securities was
$168,731,043, representing 121.79% of net assets. (Note 1 & Note 6) |
| (d) | All
or a portion of the security is exempt from registration of the Securities Act of 1933. These securities may be resold in transactions
exempt from registration under Rule 144A, normally to qualified institutional buyers. As of April 30, 2023, these securities had
an aggregate value of $3,496,208 or 2.52% of net assets. |
| (e) | As
a result of the use of significant unobservable inputs to determine fair value, these
investments have been classified as Level 3 assets (Note 1) |
| (f) | Restricted
security. (Note 1) |
| (g) | Fair
valued security; valued in accordance with procedures approved by the Board. As of April
30, 2023, these securities had an aggregate value of $807,023 or 0.58% of total net assets.
|
| (h) | Private
Placement; these securities may only be resold in transactions exempt from registration
under the Securities Act of 1933. As of April 30, 2023, these securities had an aggregate
value of $807,023 or 0.58% of net assets. |
| (i) | This
security has no contractual maturity date, is not redeemable and contractually pays an
indefinite stream of interest. |
| (j) | Includes
cash which is being held as collateral for securities sold short. |
For
Fund compliance purposes, the Fund’s sector classifications refer to any one of the sector sub-classifications used by one
or more widely recognized market indexes, and/or as defined by Fund management. This definition may not apply for purposes of
this report, which may combine sector sub-classifications for reporting ease. Sectors are shown as a percent of net assets. These
sector classifications are unaudited.
See
Notes to Financial Statements.
Clough
Global Equity Fund
SCHEDULE
OF INVESTMENTS
April
30, 2023 (Continued) (Unaudited)
Futures
Contracts
| Description | |
Counterparty | |
Position | |
Contracts | | |
Expiration Date | |
Notional Value | | |
Value | | |
Unrealized
Depreciation | |
| 3 Month SOFR | |
Morgan Stanley | |
Long | |
| 189 | | |
December 2023 | |
$ | 45,147,375 | | |
$ | (52,326 | ) | |
$ | (52,326 | ) |
| 3 Month SOFR | |
Morgan Stanley | |
Long | |
| 20 | | |
December 2024 | |
| 4,849,500 | | |
| (13,341 | ) | |
| (13,341 | ) |
| 3 Month SOFR | |
Morgan Stanley | |
Long | |
| 85 | | |
September 2023 | |
| 20,220,437 | | |
| (15,217 | ) | |
| (15,217 | ) |
| | |
| |
| |
| | | |
| |
$ | 70,217,312 | | |
$ | (80,884 | ) | |
$ | (80,884 | ) |
Call
Options Written
| Underlying Security | |
Counterparty | |
Expiration
Date | |
Strike Price | | |
Contracts | | |
Notional Amount | | |
Value | |
| 3 Month SOFR Future | |
Morgan Stanley | |
12/15/2023 | |
$ | 98 | | |
| (5,000 | ) | |
$ | (1,194,375,000 | ) | |
$ | (1,218,750 | ) |
| | |
| |
| |
| | | |
| | | |
$ | (1,194,375,000 | ) | |
$ | (1,218,750 | ) |
Put
Options Written
| Underlying Security | |
Counterparty | |
Expiration
Date | |
Strike Price | | |
Contracts | | |
Notional Amount | | |
Value | |
| S&P 500 Index | |
Morgan Stanley | |
6/16/2023 | |
$ | 3,750 | | |
| (100 | ) | |
$ | (41,694,800 | ) | |
$ | (138,500 | ) |
| S&P 500 Index | |
Morgan Stanley | |
6/16/2023 | |
| 3,850 | | |
| (35 | ) | |
| (14,593,180 | ) | |
| (71,750 | ) |
| | |
| |
| |
| | | |
| | | |
$ | (56,287,980 | ) | |
$ | (210,250 | ) |
Total
Return Swap Contracts
| Reference Entity/Obligation | |
Counterparty | |
Floating Rate
Received by the
Fund(a) | |
Termination Date | |
Notional
Amount | | |
Value | | |
Net Unrealized
Appreciation | |
| Sociedad Quimica y Minera de Chile S.A. - ADR | |
Morgan Stanley | |
1D FEDEF - 58 bps | |
1/3/2024 | |
$ | (562,239 | ) | |
$ | (485,856 | ) | |
$ | 76,383 | |
| | |
| |
| |
| |
$ | (562,239 | ) | |
$ | (485,856 | ) | |
$ | 76,383 | |
| Reference Entity/Obligation | |
Counterparty | |
Floating Rate
Received by the
Fund(a) | |
Termination Date | |
Notional
Amount | | |
Value | | |
Net Unrealized
Depreciation | |
| Banco Bilbao Vizcaya Argenta | |
Morgan Stanley | |
1D FEDEF - 50 bps | |
10/2/2024 | |
$ | (213,058 | ) | |
$ | (345,477 | ) | |
$ | (132,419 | ) |
| | |
| |
| |
| |
$ | (213,058 | ) | |
$ | (345,477 | ) | |
$ | (132,419 | ) |
| (a) | Payment
received when swap contract closes. |
See
Notes to Financial Statements.
Clough
Global Opportunities Fund
SCHEDULE
OF INVESTMENTS
April
30, 2023 (Unaudited)
| | |
Shares | | |
Value | |
| COMMON STOCKS - 116.44% | |
| | | |
| | |
| Communication Services - 6.93% | |
| | | |
| | |
| Alphabet, Inc.(a)(b)(c) | |
| 102,890 | | |
$ | 11,134,756 | |
| NetEase, Inc. - ADR | |
| 8,710 | | |
| 776,322 | |
| T-Mobile US, Inc.(a)(b)(c) | |
| 30,030 | | |
| 4,321,317 | |
| Walt Disney Co.(a)(c) | |
| 12,700 | | |
| 1,301,750 | |
| | |
| | | |
| 17,534,145 | |
| | |
| | | |
| | |
| Consumer Discretionary - 12.56% | |
| | | |
| | |
| Amazon.com, Inc.(a)(b)(c) | |
| 77,430 | | |
| 8,164,993 | |
| Booking Holdings, Inc.(a)(c) | |
| 700 | | |
| 1,880,417 | |
| BYD Co. Ltd. | |
| 107,500 | | |
| 3,231,991 | |
| D.R. Horton, Inc.(c) | |
| 7,400 | | |
| 812,668 | |
| DraftKings, Inc.(a)(c) | |
| 61,200 | | |
| 1,340,892 | |
| Home Depot, Inc.(c) | |
| 6,230 | | |
| 1,872,364 | |
| Marriott International, Inc.(c) | |
| 5,600 | | |
| 948,304 | |
| Melco
Resorts & Entertainment Ltd. - ADR(a)(c) | |
| 132,800 | | |
| 1,811,392 | |
| Meritage Homes Corp. | |
| 6,000 | | |
| 768,300 | |
| Norwegian Cruise Line Holdings Ltd.(a)(c) | |
| 49,800 | | |
| 664,830 | |
| PulteGroup, Inc. | |
| 12,100 | | |
| 812,515 | |
| Royal Caribbean Cruises Ltd.(a)(b)(c) | |
| 88,247 | | |
| 5,774,001 | |
| Trip.com Group Ltd. - ADR(a) | |
| 21,500 | | |
| 763,465 | |
| Wynn Resorts, Ltd.(a)(c) | |
| 25,820 | | |
| 2,950,710 | |
| | |
| | | |
| 31,796,842 | |
| | |
| | | |
| | |
| Consumer Staples - 5.14% | |
| | | |
| | |
| Coca-Cola Co.(c) | |
| 21,800 | | |
| 1,398,470 | |
| General Mills, Inc.(c) | |
| 20,000 | | |
| 1,772,600 | |
| Kraft Heinz Co.(c) | |
| 38,200 | | |
| 1,500,114 | |
| Kroger Co.(c) | |
| 31,400 | | |
| 1,526,982 | |
| Procter & Gamble Co.(c) | |
| 32,100 | | |
| 5,019,798 | |
| Walgreens Boots Alliance, Inc.(b)(c) | |
| 50,800 | | |
| 1,790,700 | |
| | |
| | | |
| 13,008,664 | |
| | |
| | | |
| | |
| Energy - 5.50% | |
| | | |
| | |
| Cheniere Energy, Inc.(c) | |
| 12,635 | | |
| 1,933,155 | |
| Exxon Mobil Corp.(b)(c) | |
| 44,420 | | |
| 5,256,663 | |
| Kinder Morgan, Inc.(b)(c) | |
| 198,534 | | |
| 3,404,858 | |
| Schlumberger N.V.(c) | |
| 29,300 | | |
| 1,445,955 | |
| Transocean Ltd.(a)(c) | |
| 318,000 | | |
| 1,876,200 | |
| | |
| | | |
| 13,916,831 | |
| | |
Shares | | |
Value | |
| Financials
- 16.17% | |
| | | |
| | |
| Bank
of America Corp.(c) | |
| 92,700 | | |
$ | 2,714,256 | |
| Berkshire
Hathaway, Inc.(a)(c) | |
| 9 | | |
| 4,525,920 | |
| Blackstone
Mortgage Trust, Inc.(c) | |
| 67,573 | | |
| 1,232,532 | |
| Blackstone
Secured Lending Fund(b)(c) | |
| 83,480 | | |
| 2,153,784 | |
| Charles
Schwab Corp.(c) | |
| 24,200 | | |
| 1,264,208 | |
| Comerica,
Inc.(c) | |
| 28,500 | | |
| 1,236,045 | |
| HDFC
Bank Ltd. - ADR(b)(c) | |
| 96,275 | | |
| 6,719,995 | |
| ICICI
Bank Ltd. - Sponsored ADR(b)(c) | |
| 235,100 | | |
| 5,348,525 | |
| JPMorgan
Chase & Co.(c) | |
| 33,000 | | |
| 4,561,920 | |
| KeyCorp(c) | |
| 99,000 | | |
| 1,114,740 | |
| M&T
Bank Corp.(c) | |
| 10,130 | | |
| 1,274,354 | |
| Mastercard,
Inc.(c) | |
| 5,900 | | |
| 2,242,177 | |
| Starwood
Property Trust, Inc.(c) | |
| 50,873 | | |
| 910,118 | |
| Visa,
Inc.(b)(c) | |
| 24,140 | | |
| 5,618,102 | |
| | |
| | | |
| 40,916,676 | |
| | |
| | | |
| | |
| Health
Care - 23.02% | |
| | | |
| | |
| 2Seventy
Bio, Inc.(a)(c) | |
| 312,400 | | |
| 2,970,924 | |
| Acadia
Healthcare Co., Inc.(a)(c) | |
| 14,300 | | |
| 1,033,747 | |
| Amphivena
Therapeutics, Inc. Series C (a)(d)(e)(f)(g)(h) | |
| 780,326 | | |
| 913,294 | |
| Apellis
Pharmaceuticals, Inc.(a)(b)(c) | |
| 26,466 | | |
| 2,208,058 | |
| Arcellx,
Inc.(a)(b)(c) | |
| 79,706 | | |
| 3,401,852 | |
| Ascendis
Pharma A/S - ADR(a) | |
| 8,700 | | |
| 608,652 | |
| Baxter
International, Inc.(c) | |
| 71,900 | | |
| 3,428,192 | |
| Boston
Scientific Corp.(a)(c) | |
| 23,700 | | |
| 1,235,244 | |
| Centrexion
Therapeutics Corp.(a)(e)(f)(g)(h) | |
| 14,166 | | |
| 76,355 | |
| CRISPR
Therapeutics AG(a)(c) | |
| 28,151 | | |
| 1,377,710 | |
| Elevance
Health, Inc.(c) | |
| 3,200 | | |
| 1,499,680 | |
| Eli
Lilly and Co.(c) | |
| 5,840 | | |
| 2,311,822 | |
| Encompass
Health Corp.(c) | |
| 33,400 | | |
| 2,142,610 | |
| Halozyme
Therapeutics, Inc.(a)(c) | |
| 32,900 | | |
| 1,057,077 | |
| HCA
Healthcare, Inc.(c) | |
| 8,830 | | |
| 2,537,124 | |
| Hologic,
Inc.(a)(b)(c) | |
| 18,390 | | |
| 1,581,724 | |
| Illumina,
Inc.(a)(c) | |
| 15,250 | | |
| 3,134,790 | |
| Jazz
Pharmaceuticals PLC(a)(b)(c) | |
| 16,980 | | |
| 2,385,181 | |
| Johnson
& Johnson(c) | |
| 35,815 | | |
| 5,862,916 | |
| Legend
Biotech Corp. - ADR(a)(c) | |
| 22,700 | | |
| 1,559,717 | |
| Merck
& Co., Inc.(c) | |
| 27,800 | | |
| 3,210,066 | |
| Novo
Nordisk A/S - Sponsored ADR(c) | |
| 4,770 | | |
| 797,019 | |
| Select
Medical Holdings Corp.(c) | |
| 70,900 | | |
| 2,162,450 | |
| Surgery
Partners, Inc.(a)(b)(c) | |
| 39,846 | | |
| 1,580,292 | |
| Tenet
Healthcare Corp.(a)(b)(c) | |
| 20,920 | | |
| 1,533,854 | |
| UnitedHealth
Group, Inc.(b)(c) | |
| 4,320 | | |
| 2,125,829 | |
| Veracyte,
Inc.(a)(b)(c) | |
| 58,700 | | |
| 1,328,968 | |
| Vertex
Pharmaceuticals, Inc.(a)(b)(c) | |
| 7,235 | | |
| 2,465,182 | |
| Zimmer
Biomet Holdings, Inc.(c) | |
| 11,340 | | |
| 1,569,910 | |
| | |
| | | |
| 58,100,239 | |
See
Notes to Financial Statements.
Clough
Global Opportunities Fund
SCHEDULE
OF INVESTMENTS
April
30, 2023 (Continued) (Unaudited)
| | |
Shares | | |
Value | |
| Industrials - 19.00% | |
| | | |
| | |
| Airbus SE | |
| 70,865 | | |
$ | 9,927,909 | |
| Boeing Co.(a)(c) | |
| 35,725 | | |
| 7,387,215 | |
| Deere & Co.(c) | |
| 2,300 | | |
| 869,446 | |
| Hertz Global Holdings, Inc.(a)(b)(c) | |
| 39,800 | | |
| 663,864 | |
| Lockheed Martin Corp.(c) | |
| 1,900 | | |
| 882,455 | |
| Northrop Grumman Corp.(c) | |
| 25,630 | | |
| 11,822,350 | |
| Raytheon Technologies Corp.(b)(c) | |
| 87,020 | | |
| 8,693,298 | |
| TransDigm Group, Inc.(b)(c) | |
| 10,188 | | |
| 7,793,820 | |
| | |
| | | |
| 48,040,357 | |
| | |
| | | |
| | |
| Information Technology - 19.61% | |
| | | |
| | |
| Accenture PLC(c) | |
| 10,700 | | |
| 2,999,103 | |
| Analog Devices, Inc.(b)(c) | |
| 35,000 | | |
| 6,295,800 | |
| Apple, Inc.(b)(c) | |
| 37,700 | | |
| 6,396,936 | |
| Broadcom, Inc.(b)(c) | |
| 10,800 | | |
| 6,766,200 | |
| Cisco Systems, Inc.(c) | |
| 48,200 | | |
| 2,277,450 | |
| Lam Research Corp.(b)(c) | |
| 11,230 | | |
| 5,885,418 | |
| Marvell Technology, Inc.(c) | |
| 29,400 | | |
| 1,160,712 | |
| Microsoft Corp.(c) | |
| 33,225 | | |
| 10,208,714 | |
| Palo Alto Networks, Inc.(a)(b)(c) | |
| 11,590 | | |
| 2,114,711 | |
| Qualcomm, Inc.(b)(c) | |
| 33,900 | | |
| 3,959,520 | |
| Samsung Electronics Co., Ltd. | |
| 29,714 | | |
| 1,454,175 | |
| | |
| | | |
| 49,518,739 | |
| | |
| | | |
| | |
| Materials - 2.50% | |
| | | |
| | |
| Air Products and Chemicals, Inc.(c) | |
| 5,300 | | |
| 1,560,108 | |
| Linde PLC(c) | |
| 9,000 | | |
| 3,325,050 | |
| Sherwin-Williams Co.(c) | |
| 6,000 | | |
| 1,425,240 | |
| | |
| | | |
| 6,310,398 | |
| | |
| | | |
| | |
| Real Estate - 3.22% | |
|
| |
|
|
|
|
| American Tower Corp.(c) | |
|
25,140 | |
|
|
5,138,365 |
|
| Crown Castle, Inc.(c) | |
|
11,205 | |
|
|
1,379,223 |
|
| Prologis, Inc.(c) | |
|
6,800 | |
|
|
851,700 |
|
| Simon Property Group, Inc.(c) | |
|
6,800 | |
|
|
770,576 |
|
| | |
|
| |
|
|
8,139,864 |
|
| | |
|
| |
|
|
|
|
| Utilities - 2.79% | |
|
| |
|
|
|
|
| AES Corp.(c) | |
|
77,400 | |
|
|
1,831,284 |
|
| Duke Energy Corp.(c) | |
|
22,800 | |
|
|
2,254,464 |
|
| Exelon Corp.(c) | |
|
70,200 | |
|
|
2,979,288 |
|
| | |
|
| |
|
|
7,065,036 |
|
| | |
|
| |
|
|
|
|
| TOTAL COMMON STOCKS | |
| | |
| |
| (Cost $271,922,111) | |
| | | |
| 294,347,791 | |
| | |
Shares | | |
Value | |
| CLOSED-END FUNDS - 1.87% | |
| | | |
| | |
| BlackRock Capital Allocation Trust(c) | |
| 95,700 | | |
$ | 1,446,984 | |
| Blackrock Innovation and Growth Trust(c) | |
| 262,600 | | |
| 1,953,744 | |
| Mainstay CBRE Global Infrastructure Megatrends
Fund(c) | |
| 92,400 | | |
| 1,335,180 | |
| | |
| | | |
| 4,735,908 | |
| | |
| | | |
| | |
| TOTAL CLOSED-END FUNDS | |
| | | |
| | |
| (Cost $4,389,933) | |
| | | |
| 4,735,908 | |
| | |
| | | |
| | |
| EXCHANGE-TRADED FUNDS - 0.14% | |
| | | |
| | |
| United States Natural Gas Fund, LP(a)(c) | |
| 48,600 | | |
| 340,686 | |
| | |
| | | |
| | |
| TOTAL EXCHANGE-TRADED FUNDS | |
| | | |
| | |
| (Cost $945,459) | |
| | | |
| 340,686 | |
| | |
| | | |
| | |
| Description/Maturity Date/Rate | |
| | | |
| | |
| PREFERRED STOCKS - 0.46% | |
| | | |
| | |
| Centrexion Therapeutics
Corp. Series D Preferred, Perpetual Maturity, (a)(d)(e)(f)(g)(h)(i) | |
| 217,952 | | |
| 1,174,761 | |
| | |
| | | |
| | |
| TOTAL PREFERRED STOCKS | |
| | |
| |
| (Cost $2,290,759) | |
| | |
1,174,761 | |
| | |
| | |
| |
| WARRANTS - 0.59% | |
| | | |
| | |
| Hertz
Global Holdings, Inc. Strike Price $13.80, Expires 6/30/2051(a)(b)(c) | |
| 159,034 | | |
| 1,494,920 | |
| | |
| | | |
| | |
| TOTAL WARRANTS | |
| | | |
| | |
| (Cost $2,549,805) | |
| | | |
| 1,494,920 | |
| Underlying
Security/Expiration Date/Exercise Price/Notional Amount | |
| Contracts | | |
| | |
| PURCHASED OPTIONS - 2.16% | |
| | | |
| | |
| Put Options Purchased - 2.16% | |
| | | |
| | |
| 3 Month SOFR Future | |
| | | |
| | |
| 12/15/2023, $97, $2,149,875,000 | |
| 9,000 | | |
| 4,556,250 | |
| S&P 500 Index | |
| | | |
| | |
| 6/16/2023, $3,950, $83,389,600 | |
| 200 | | |
| 617,000 | |
| S&P 500 Index | |
| | | |
| | |
| 6/16/2023, $4,050, $26,684,672 | |
| 64 | | |
| 296,000 | |
| | |
| | | |
| 5,469,250 | |
| TOTAL PURCHASED OPTIONS | |
| | | |
| | |
| (Cost $6,654,735) | |
| | | |
| 5,469,250 | |
See
Notes to Financial Statements.
Clough
Global Opportunities Fund
SCHEDULE
OF INVESTMENTS
April
30, 2023 (Continued) (Unaudited)
| Description/Maturity Date/Rate | |
Principal Amount | |
| Value | |
| CORPORATE BONDS - 11.24% | |
|
| |
| |
| |
| Consumer Discretionary - 1.01% | |
|
| |
| |
| |
| Carnival Corp. | |
|
| |
| |
| |
| 3/1/2026, 7.625%(c)(d)(f) | |
$ |
2,800,000 | |
| $ |
2,563,317 | |
| | |
|
| |
| |
| |
| Consumer Staples - 0.49% | |
|
| |
| |
| |
| Pilgrim's Pride Corp. | |
|
| |
| |
| |
| 9/30/2027, 5.875%(c)(d)(f) | |
|
1,240,000 | |
| |
1,235,245 | |
| | |
|
| |
| |
| |
| Energy - 1.46% | |
|
| |
| |
| |
| NGL Energy Operating LLC | |
|
| |
| |
| |
| 2/1/2026, 7.500%(c)(d)(f) | |
|
1,230,000 | |
| |
1,180,548 | |
| Transocean, Inc. | |
|
| |
| |
| |
| 1/15/2026, 7.500%(c)(d)(f) | |
|
2,700,000 | |
| |
2,493,963 | |
| | |
|
| |
| |
3,674,511 | |
| | |
|
| |
| |
| |
| Government - 0.65% | |
|
| |
| |
| |
| Federal Home Loan Banks | |
|
| |
| |
| |
| 2/27/2026, 5.250% | |
|
1,640,000 | |
| |
1,636,960 | |
| | |
|
| |
| |
| |
| Health Care - 0.98% | |
|
| |
| |
| |
| Tenet Healthcare Corp. | |
|
| |
| |
| |
| 10/1/2028, 6.125%(c) | |
|
2,560,000 | |
| |
2,486,805 | |
| | |
|
| |
| |
| |
| Industrials - 5.89% | |
|
| |
| |
| |
| Air Canada 2013-1 Class A Pass Through Trust | |
|
| |
| |
| |
| 5/15/2025, 4.125%(b)(c)(d)(f) | |
|
3,995,257 | |
| |
3,776,347 | |
| American Airlines 2019-1 Class A Pass Through
Trust | |
|
| |
| |
| |
| 2/15/2032, 3.500%(b)(c) | |
|
3,684,056 | |
| |
3,034,739 | |
| Avis Budget Car Rental, LLC | |
|
| |
| |
| |
| 7/15/2027, 5.750%(c)(d)(f) | |
|
1,280,000 | |
| |
1,200,766 | |
| Boeing Co. | |
|
| |
| |
| |
| 2/4/2026, 2.196%(c) | |
|
1,360,000 | |
| |
1,264,718 | |
| Hexcel Corp. | |
|
| |
| |
| |
| 8/15/2025, 4.950%(b)(c) | |
|
1,000,000 | |
| |
982,948 | |
| TransDigm, Inc. | |
|
| |
| |
| |
| 11/15/2027, 5.500%(c) | |
|
2,500,000 | |
| |
2,403,153 | |
| United Airlines 2020-1 Class B Pass Through
Trust | |
|
| |
| |
| |
| 1/15/2026, 4.875% | |
|
1,096,000 | |
| |
1,063,598 | |
| US Airways 2013-1 Class A Pass Through Trust | |
|
| |
| |
| |
| 11/15/2025, 3.950%(b)(c) | |
|
1,242,727 | |
| |
1,171,179 | |
| | |
|
| |
| |
14,897,448 | |
| Description/Maturity Date/Rate | |
Principal Amount | | |
Value | |
| Information Technology - 0.76% | |
| | |
| |
| Broadcom, Inc. | |
| | |
| |
| 11/15/2025, 3.150%(c) | |
$ |
2,000,000 | | |
$ |
1,920,104 | |
| | |
|
| | |
|
| |
| TOTAL CORPORATE BONDS |
| (Cost $28,773,184) | |
| | |
28,414,390 | |
| | |
| | |
| |
| CONVERTIBLE CORPORATE BONDS - 0.03% |
| Health Care - 0.03% | |
| | | |
| | |
| Amphivena Convertible Note PP | |
| | | |
| | |
| 12/31/2049(a)(d)(e)(f)(g)(h) | |
| 253,750 | | |
| 76,125 | |
| | |
| | | |
| | |
| TOTAL CONVERTIBLE CORPORATE BONDS |
| (Cost $253,750) | |
| | | |
| 76,125 | |
| | |
| | | |
| | |
| U.S. TREASURY OBLIGATIONS - 10.45% |
| Treasury Notes | |
| | | |
| | |
| 2/15/2053, 3.625%(c) | |
| 6,770,000 | | |
| 6,714,465 | |
| 2/15/2043, 3.875% | |
| 7,370,000 | | |
| 7,450,034 | |
| 2/15/2026, 4.000%(c) | |
| 6,230,000 | | |
| 6,266,260 | |
| 1/31/2025, 4.125%(c) | |
| 6,000,000 | | |
| 5,991,211 | |
| | |
| | | |
| 26,421,970 | |
| | |
| | | |
| | |
| TOTAL U.S. TREASURY OBLIGATIONS |
| (Cost $26,321,836) | |
| | | |
| 26,421,970 | |
| | |
Shares | | |
| | |
| MONEY MARKET FUNDS - 2.65% |
| BlackRock Liquidity Funds, T-Fund Portfolio, Institutional Class, 4.710% (7-day yield) | |
| 6,692,999 | | |
| 6,692,999 | |
| | |
| | | |
| | |
| TOTAL MONEY MARKET FUNDS |
| (Cost $6,692,999) | |
| | | |
| 6,692,999 | |
| | |
| | | |
| | |
| TOTAL INVESTMENTS - 146.03% |
| (Cost $350,794,571) | |
| | | |
| 369,168,800 | |
| | |
| | | |
| | |
| Other Liabilities in Excess of Assets- (46.03)%(j) | |
| | | |
| (116,374,006 | ) |
| | |
| | | |
| | |
| NET ASSETS - 100.00% | |
| | | |
$ | 252,794,794 | |
| SCHEDULE OF SECURITIES SOLD SHORT | |
| Shares | | |
| Value | |
| COMMON STOCKS - (17.38)% | |
| | | |
| | |
| Communication Services - (0.40)% | |
| | | |
| | |
| SoftBank Group Corp. | |
| (26,800 | ) | |
| (1,002,012 | ) |
See
Notes to Financial Statements.
Clough
Global Opportunities Fund
SCHEDULE
OF INVESTMENTS
April
30, 2023 (Continued) (Unaudited)
| | |
Shares | | |
Value | |
| Consumer
Discretionary - (5.40)% | |
| | | |
| | |
| Asbury
Automotive Group, Inc.(a) | |
| (12,080 | ) | |
$ | (2,336,997 | ) |
| AutoNation,
Inc.(a) | |
| (19,180 | ) | |
| (2,526,006 | ) |
| Ford
Motor Co. | |
| (233,520 | ) | |
| (2,774,217 | ) |
| Harley-Davidson,
Inc. | |
| (69,300 | ) | |
| (2,571,030 | ) |
| Macy's,
Inc. | |
| (133,200 | ) | |
| (2,176,488 | ) |
| YETI
Holdings, Inc.(a) | |
| (32,200 | ) | |
| (1,270,290 | ) |
| | |
| | | |
| (13,655,028 | ) |
| | |
| | | |
| | |
| Financials
- (1.92)% | |
| | | |
| | |
| BNP
Paribas | |
| (17,970 | ) | |
| (1,160,153 | ) |
| Credit
Agricole S.A. | |
| (92,565 | ) | |
| (1,130,543 | ) |
| Deutsche
Bank AG | |
| (51,700 | ) | |
| (569,217 | ) |
| Intesa
Sanpaolo SpA | |
| (229,253 | ) | |
| (602,360 | ) |
| Societe
Generale S.A. | |
| (18,790 | ) | |
| (456,023 | ) |
| Toast,
Inc.(a) | |
| (10,300 | ) | |
| (187,460 | ) |
| UniCredit
SpA | |
| (38,679 | ) | |
| (764,613 | ) |
| | |
| | | |
| (4,870,369 | ) |
| | |
| | | |
| | |
| Health
Care - (2.61)% | |
| | | |
| | |
| AmerisourceBergen
Corp. | |
| (8,000 | ) | |
| (1,334,800 | ) |
| AMN
Healthcare Services, Inc.(a) | |
| (15,200 | ) | |
| (1,312,520 | ) |
| Cross
Country Healthcare, Inc.(a) | |
| (70,800 | ) | |
| (1,556,184 | ) |
| Danaher
Corp. | |
| (4,900 | ) | |
| (1,160,859 | ) |
| STERIS
PLC | |
| (6,500 | ) | |
| (1,225,575 | ) |
| | |
| | | |
| (6,589,938 | ) |
| | |
| | | |
| | |
| Industrials
- (4.36)% | |
| | | |
| | |
| AMETEK,
Inc. | |
| (5,100 | ) | |
| (703,443 | ) |
| Caterpillar,
Inc. | |
| (3,200 | ) | |
| (700,160 | ) |
| Eaton
Corp. PLC | |
| (4,300 | ) | |
| (718,616 | ) |
| General
Electric Co. | |
| (7,800 | ) | |
| (771,966 | ) |
| Honeywell
International, Inc. | |
| (3,800 | ) | |
| (759,392 | ) |
| Jacobs
Solutions, Inc. | |
| (6,300 | ) | |
| (727,398 | ) |
| Paychex,
Inc. | |
| (11,000 | ) | |
| (1,208,460 | ) |
| Rockwell
Automation, Inc. | |
| (2,500 | ) | |
| (708,525 | ) |
| Shoals
Technologies Group, Inc.(a) | |
| (54,700 | ) | |
| (1,142,683 | ) |
| Textron,
Inc. | |
| (10,500 | ) | |
| (702,870 | ) |
| Trane
Technologies PLC | |
| (3,900 | ) | |
| (724,659 | ) |
| Waste
Management, Inc. | |
| (8,300 | ) | |
| (1,378,215 | ) |
| Xylem,
Inc. | |
| (7,300 | ) | |
| (758,032 | ) |
| | |
| | | |
| (11,004,419 | ) |
| | |
| | | |
| | |
| Information
Technology - (2.18)% | |
| | | |
| | |
| Elastic
N.V.(a) | |
| (6,300 | ) | |
| (360,675 | ) |
| International
Business Machines Corp. | |
| (11,280 | ) | |
| (1,425,905 | ) |
| ON
Semiconductor Corp.(a) | |
| (10,900 | ) | |
| (784,364 | ) |
| Palantir
Technologies, Inc.(a) | |
| (49,500 | ) | |
| (383,625 | ) |
| Roper
Technologies, Inc. | |
| (3,000 | ) | |
| (1,364,340 | ) |
| Shopify,
Inc.(a) | |
| (5,100 | ) | |
| (247,095 | ) |
| Smartsheet,
Inc.(a) | |
| (13,300 | ) | |
| (543,571 | ) |
| UiPath,
Inc.(a) | |
| (29,900 | ) | |
| (420,992 | ) |
| | |
| | | |
| (5,530,567 | ) |
| | |
Shares | | |
Value | |
| Materials - (0.51)% | |
| | | |
| | |
| O-I Glass, Inc.(a) | |
| (57,400 | ) | |
$ | (1,289,779) | |
| | |
| | | |
| | |
| TOTAL COMMON STOCKS | |
| | | |
| | |
| (Proceeds $42,906,045) | |
| | | |
| (43,942,112) | |
| | |
| | | |
| | |
| TOTAL SECURITIES SOLD SHORT | |
| | | |
| | |
| (Proceeds $42,906,045) | |
| | | |
| (43,942,112) | |
Investment
Abbreviations:
ADR
- American Depository Receipt
SOFR
- Secured Overnight Financing Rate
FEDEF
Rates:
1D
FEDEF - 1 day effective Federal Funds Rate as of April 30, 2023 was 4.83%
| (a) | Non-income
producing security. |
| (b) | Loaned
security; a portion or all of the security is on loan as of April 30,
2023. |
| (c) | Pledged
security; a portion or all of the security is pledged as collateral for securities sold
short or borrowings. As of April 30, 2023, the aggregate value of those securities was
$326,272,095, representing 129.06% of net assets. (Note 1 & Note 6) |
| (d) | All
or a portion of the security is exempt from registration of the Securities
Act of 1933. These securities may be resold in transactions exempt from registration under Rule 144A, normally to qualified institutional
buyers. As of April 30, 2023, these securities had an aggregate value of $14,614,366 or 5.78% of net assets. |
| (e) | As
a result of the use of significant unobservable inputs to determine fair value, these
investments have been classified as Level 3 assets (Note 1) |
| (f) | Restricted
security. (Note 1) |
| (g) | Fair
valued security; valued in accordance with procedures approved by the Board. As of April
30, 2023, these securities had an aggregate value of $2,240,535 or 0.88% of total net
assets. |
| (h) | Private
Placement; these securities may only be resold in transactions exempt from registration
under the Securities Act of 1933. As of April 30, 2023, these securities had an aggregate
value of $2,240,535 or 0.88% of net assets. |
| (i) | This
security has no contractual maturity date, is not redeemable and contractually pays an
indefinite stream of interest. |
| (j) | Includes
cash which is being held as collateral for securities sold short. |
For
Fund compliance purposes, the Fund’s sector classifications refer to any one of the sector sub-classifications used by one
or more widely recognized market indexes, and/or as defined by Fund management. This definition may not apply for purposes of
this report, which may combine sector sub-classifications for reporting ease. Sectors are shown as a percent of net assets. These
sector classifications are unaudited.
See
Notes to Financial Statements.
Clough
Global Opportunities Fund
SCHEDULE
OF INVESTMENTS
April
30, 2023 (Continued) (Unaudited)
| Futures Contracts | |
| |
| | |
| | |
| |
| | |
| | |
| |
| Description | |
Counterparty | |
Position | | |
Contracts | | |
Expiration Date | |
Notional Value | | |
Value | | |
Unrealized Depreciation | |
| 3 Month SOFR | |
Morgan Stanley | |
Long | | |
| 344 | | |
December 2023 | |
$ | 82,173,000 | | |
$ | (95,238 | ) | |
$ | (95,238 | ) |
| 3 Month SOFR | |
Morgan Stanley | |
Long | | |
| 36 | | |
December 2024 | |
| 8,729,100 | | |
| (24,014 | ) | |
| (24,014 | ) |
| 3 Month SOFR | |
Morgan Stanley | |
Long | | |
| 155 | | |
September 2023 | |
| 36,872,563 | | |
| (27,749 | ) | |
| (27,749 | ) |
| | |
| |
| | |
| | | |
| |
$ | 127,774,663 | | |
$ | (147,001 | ) | |
$ | (147,001 | ) |
| Call Options Written Underlying Security | |
Counterparty | |
Expiration Date | |
Strike Price | | |
Contracts | | |
Notional Amount | | |
Value | |
| 3 Month SOFR Future | |
Morgan Stanley | |
12/15/2023 | |
$ | 98 | | |
| (9,000 | ) | |
$ | (2,149,875,000 | ) | |
$ | (2,193,750 | ) |
| | |
| |
| |
| | | |
| | | |
$ | (2,149,875,000 | ) | |
$ | (2,193,750 | ) |
| Put Options Written Underlying Security | |
Counterparty | |
Expiration Date | |
Strike Price | | |
Contracts | | |
Notional Amount | | |
Value | |
| S&P 500 Index | |
Morgan Stanley | |
6/16/2023 | |
$ | 3,750 | | |
| (200 | ) | |
$ | (83,389,600 | ) | |
$ | (277,000 | ) |
| S&P 500 Index | |
Morgan Stanley | |
6/16/2023 | |
| 3,850 | | |
| (64 | ) | |
| (26,684,672 | ) | |
| (131,200 | ) |
| | |
| |
| |
| | | |
| | | |
$ | (110,074,272 | ) | |
$ | (408,200 | ) |
Total
Return Swap Contracts
| Reference Entity/Obligation | |
Counterparty | |
Floating Rate Received by the Fund(a) | |
Termination Date | |
Notional Amount | | |
Value | | |
Net Unrealized Appreciation |
|
| Sociedad Quimica y Minera de Chile S.A. - ADR | |
Morgan Stanley | |
1D FEDEF - 58 bps | |
1/3/2024 | |
$ | (1,030,802 | ) | |
$ | (890,736 | ) | |
$ |
140,066 |
|
| | |
| |
| |
| |
$ | (1,030,802 | ) | |
$ | (890,736 | ) | |
$ |
140,066 |
|
| Reference Entity/Obligation | |
Counterparty | |
Floating Rate Received by the Fund(a) | |
Termination Date | |
Notional Amount | | |
Value | | |
Net Unrealized Depreciation | |
| Banco Bilbao Vizcaya Argenta | |
Morgan Stanley | |
1D FEDEF - 50 bps | |
10/2/2024 | |
$ | (392,973 | ) | |
$ | (637,213 | ) | |
$ | (244,240 | ) |
| | |
| |
| |
| |
$ | (392,973 | ) | |
$ | (637,213 | ) | |
$ | (244,240 | ) |
| (a) | Payment
received when swap contract closes. |
See
Notes to Financial Statements.
Clough
Global Funds
STATEMENTS
OF ASSETS AND LIABILITIES
April
30, 2023 (Unaudited)
| | |
Clough Global Dividend and
Income Fund | | |
Clough Global Equity Fund | | |
Clough Global
Opportunities Fund | |
| ASSETS: | |
| | | |
| | | |
| | |
| Investments, at value* | |
$ | 126,734,743 | | |
$ | 202,550,264 | | |
$ | 369,168,800 | |
| Foreign currencies, at value | |
| 38,680 | | |
| 41,012 | | |
| 77,403 | |
| Variation margin receivable for futures contracts | |
| 6,113 | | |
| 10,913 | | |
| 19,813 | |
| Deposit with broker for futures contracts | |
| 1,036,969 | | |
| 1,741,525 | | |
| 3,189,038 | |
| Deposit with broker for written options | |
| 1,833,344 | | |
| 2,971,176 | | |
| 5,394,754 | |
| Deposit with broker for total return swap contracts | |
| 174,696 | | |
| 280,700 | | |
| 515,576 | |
| Deposit with broker for securities sold short | |
| 18,262,937 | | |
| 23,804,197 | | |
| 43,735,267 | |
| Dividends receivable | |
| 151,554 | | |
| 101,665 | | |
| 162,434 | |
| Interest receivable | |
| 229,065 | | |
| 435,105 | | |
| 853,879 | |
| Receivable for investments sold | |
| 685,577 | | |
| — | | |
| — | |
| Receivable for total return swap contracts | |
| 7,973 | | |
| 12,931 | | |
| 23,761 | |
| Unrealized appreciation on total return swap contracts | |
| 50,029 | | |
| 76,383 | | |
| 140,066 | |
| Total Assets | |
| 149,211,680 | | |
| 232,025,871 | | |
| 423,280,791 | |
| LIABILITIES: | |
| | | |
| | | |
| | |
| Loan payable | |
| 40,000,000 | | |
| 62,000,000 | | |
| 112,000,000 | |
| Interest on loan payable | |
| 213,493 | | |
| 315,410 | | |
| 594,562 | |
| Securities sold short, at value | |
| 17,006,249 | | |
| 23,981,397 | | |
| 43,942,112 | |
| Written options, at value | |
| 917,950 | | |
| 1,429,000 | | |
| 2,601,950 | |
| Payable for investments purchased | |
| 2,544,924 | | |
| 5,350,670 | | |
| 10,670,437 | |
| Unrealized depreciation on total return swap contracts | |
| 73,348 | | |
| 132,419 | | |
| 244,240 | |
| Dividends payable - short sales | |
| 12,247 | | |
| 23,759 | | |
| 43,195 | |
| Accrued investment advisory fee | |
| 87,798 | | |
| 172,781 | | |
| 349,705 | |
| Accrued administration fee | |
| 10,775 | | |
| 15,820 | | |
| 29,618 | |
| Accrued trustees fee | |
| 6,773 | | |
| 6,773 | | |
| 6,773 | |
| Other payables and accrued expenses | |
| 4,392 | | |
| 23,435 | | |
| 3,405 | |
| Total Liabilities | |
| 60,877,949 | | |
| 93,451,464 | | |
| 170,485,997 | |
| NET ASSETS | |
$ | 88,333,731 | | |
$ | 138,574,407 | | |
$ | 252,794,794 | |
| | |
| | | |
| | | |
| | |
| COMPOSITION OF NET ASSETS: | |
| | | |
| | | |
| | |
| Paid in capital | |
$ | 109,023,673 | | |
$ | 215,698,325 | | |
$ | 405,359,420 | |
| Distributable earnings/(Accumulated loss) | |
| (20,689,942 | ) | |
| (77,123,918 | ) | |
| (152,564,626 | ) |
| NET ASSETS | |
$ | 88,333,731 | | |
$ | 138,574,407 | | |
$ | 252,794,794 | |
| | |
| | | |
| | | |
| | |
| Shares outstanding, unlimited shares authorized | |
| 12,709,583 | | |
| 19,124,621 | | |
| 43,545,722 | |
| Net Asset Value, per share | |
$ | 6.95 | | |
$ | 7.25 | | |
$ | 5.81 | |
| | |
| | | |
| | | |
| | |
| INVESTMENTS, AT COST | |
$ | 119,936,034 | | |
$ | 191,596,539 | | |
$ | 350,794,571 | |
| FOREIGN CURRENCIES, AT COST | |
| 38,699 | | |
| 41,033 | | |
| 77,441 | |
| PROCEEDS OF SECURITIES SOLD SHORT | |
| 16,379,172 | | |
| 23,416,642 | | |
| 42,906,045 | |
| PREMIUMS RECEIVED ON WRITTEN OPTIONS | |
| 1,056,013 | | |
| 1,602,325 | | |
| 3,020,336 | |
| | |
| | | |
| | | |
| | |
| * SECURITIES LOANED, AT VALUE | |
$ | 34,663,985 | | |
$ | 57,569,628 | | |
$ | 100,466,531 | |
See
Notes to Financial Statements.
Clough
Global Funds
STATEMENTS
OF OPERATIONS
For
the six months ended April 30, 2023 (Unaudited)
| | |
Clough Global Dividend and Income Fund | | |
Clough Global Equity Fund | | |
Clough Global Opportunities Fund | |
| INVESTMENT INCOME: | |
| | | |
| | | |
| | |
| Dividends* | |
$ | 1,791,371 | | |
$ | 1,469,206 | | |
$ | 2,667,682 | |
| Interest and other income | |
| 840,853 | | |
| 1,340,656 | | |
| 2,627,422 | |
| Hypothecated securities income (Note 6) | |
| 11,200 | | |
| 26,202 | | |
| 80,637 | |
| Total Income | |
| 2,643,424 | | |
| 2,836,064 | | |
| 5,375,741 | |
| EXPENSES: | |
| | | |
| | | |
| | |
| Investment advisory fee | |
| 580,113 | | |
| 1,177,723 | | |
| 2,395,870 | |
| Administration fee | |
| 241,416 | | |
| 420,852 | | |
| 766,215 | |
| Interest on loan | |
| 1,362,526 | | |
| 2,307,751 | | |
| 4,247,636 | |
| Trustees' fees | |
| 76,957 | | |
| 76,957 | | |
| 76,957 | |
| Dividend expense - short sales | |
| 177,715 | | |
| 208,474 | | |
| 382,433 | |
| Total Expenses | |
| 2,446,052 | | |
| 4,202,288 | | |
| 7,885,812 | |
| NET INVESTMENT INCOME/(LOSS) | |
| 197,372 | | |
| (1,366,224 | ) | |
| (2,510,071 | ) |
| Net realized gain/(loss) on: | |
| | | |
| | | |
| | |
| Investment securities | |
| (8,077,041 | ) | |
| (19,125,079 | ) | |
| (36,506,454 | ) |
| Futures contracts | |
| (458,111 | ) | |
| (839,212 | ) | |
| (1,528,057 | ) |
| Securities sold short | |
| (2,366,058 | ) | |
| (5,323,908 | ) | |
| (9,795,238 | ) |
| Total return swap contracts | |
| (82,804 | ) | |
| (114,598 | ) | |
| (212,063 | ) |
| Written options | |
| 2,433,877 | | |
| 4,038,601 | | |
| 7,441,248 | |
| Foreign currency related transactions | |
| (27,200 | ) | |
| (56,016 | ) | |
| (102,805 | ) |
| Net Realized Loss | |
| (8,577,337 | ) | |
| (21,420,212 | ) | |
| (40,703,369 | ) |
| Net change in unrealized appreciation/(depreciation) on: | |
| | | |
| | | |
| | |
| Investment securities | |
| 7,870,015 | | |
| 20,532,788 | | |
| 38,523,749 | |
| Futures contracts | |
| 388,174 | | |
| 742,910 | | |
| 1,350,783 | |
| Securities sold short | |
| 914,054 | | |
| 2,067,535 | | |
| 3,817,419 | |
| Total return swap contracts | |
| 25,685 | | |
| 32,319 | | |
| 59,083 | |
| Written options | |
| (430,514 | ) | |
| (858,292 | ) | |
| (1,511,082 | ) |
| Foreign currency related translations | |
| 381 | | |
| 827 | | |
| 1,865 | |
| Net Change In Unrealized Appreciation | |
| 8,767,795 | | |
| 22,518,087 | | |
| 42,241,817 | |
| NET REALIZED AND UNREALIZED GAIN ON INVESTMENTS | |
| 190,458 | | |
| 1,097,875 | | |
| 1,538,448 | |
| NET INCREASE/(DECREASE) IN NET ASSETS RESULTING FROM OPERATIONS | |
$ | 387,830 | | |
$ | (268,349 | ) | |
$ | (971,623 | ) |
| *Foreign taxes withheld on dividends | |
$ | 12,560 | | |
$ | 16,615 | | |
$ | 30,870 | |
See
Notes to Financial Statements.
Clough
Global Funds
STATEMENTS
OF CHANGES IN NET ASSETS
April
30, 2023
| Clough Global Dividend and Income Fund | |
| | |
| |
| | |
Six Months Ended April 30, 2023 (Unaudited) | | |
Year Ended October 31, 2022 | |
| OPERATIONS | |
| | | |
| | |
| Net investment income/(loss) | |
$ | 197,372 | | |
$ | (184,420 | ) |
| Net realized loss | |
| (8,577,337 | ) | |
| (13,494,914 | ) |
| Net change in unrealized appreciation/depreciation | |
| 8,767,795 | | |
| (17,283,546 | ) |
| Net increase/decrease in net assets resulting from operations | |
| 387,830 | | |
| (30,962,880 | ) |
| DISTRIBUTIONS TO COMMON SHAREHOLDERS | |
| | | |
| | |
| From distributable earnings | |
| (5,338,025 | ) | |
| – | |
| Tax return of capital | |
| – | | |
| (13,197,196 | ) |
| Net decrease in net assets from distributions | |
| (5,338,025 | ) | |
| (13,197,196 | ) |
| CAPITAL SHARE TRANSACTIONS | |
| | | |
| | |
| Proceeds from sales of shares | |
$ | – | | |
$ | 12,228,308 | |
| Reinvestment of dividends | |
| – | | |
| 687,408 | |
| Offering Costs | |
| – | | |
| 42,881 | |
| Net increase in net assets derived from capital share transactions | |
| – | | |
| 12,958,597 | |
| Net decrease in net assets Attributable to Common Shares | |
| (4,950,195 | ) | |
| (31,201,479 | ) |
| NET ASSETS ATTRIBUTABLE TO COMMON SHARES | |
| | | |
| | |
| Beginning of period | |
| 93,283,926 | | |
| 124,485,405 | |
| End of period | |
$ | 88,333,731 | | |
$ | 93,283,926 | |
| Clough Global Equity Fund | |
| | |
| |
| | |
Six Months Ended April 30, 2023 (Unaudited) | | |
Year Ended October 31, 2022 | |
| OPERATIONS | |
| | | |
| | |
| Net investment loss | |
$ | (1,366,224 | ) | |
$ | (4,554,404 | ) |
| Net realized loss | |
| (21,420,212 | ) | |
| (49,490,363 | ) |
| Net change in unrealized appreciation/depreciation | |
| 22,518,087 | | |
| (54,718,133 | ) |
| Net decrease in net assets resulting from operations | |
| (268,349 | ) | |
| (108,762,900 | ) |
| DISTRIBUTIONS TO COMMON SHAREHOLDERS | |
| | | |
| | |
| From distributable earnings | |
| (9,026,821 | ) | |
| (13,720,430 | ) |
| Tax return of capital | |
| – | | |
| (12,601,657 | ) |
| Net decrease in net assets from distributions | |
| (9,026,821 | ) | |
| (26,322,087 | ) |
| CAPITAL SHARE TRANSACTIONS | |
| | | |
| | |
| Proceeds from sales of shares | |
$ | – | | |
$ | 14,074,176 | |
| Reinvestment of dividends | |
| – | | |
| 1,121,300 | |
| Offering Costs | |
| – | | |
| 84,431 | |
| Net increase in net assets derived from capital share transactions | |
| – | | |
| 15,279,907 | |
| Net decrease in net assets Attributable to Common Shares | |
| (9,295,170 | ) | |
| (119,805,080 | ) |
| NET ASSETS ATTRIBUTABLE TO COMMON SHARES | |
| | | |
| | |
| Beginning of period | |
| 147,869,577 | | |
| 267,674,657 | |
| End of period | |
$ | 138,574,407 | | |
$ | 147,869,577 | |
See
Notes to Financial Statements.
Clough
Global Funds
STATEMENTS
OF CHANGES IN NET ASSETS
April
30, 2023
| Clough Global Opportunities Fund | |
| | |
| |
| | |
Six Months Ended April 30, 2023 (Unaudited) | | |
Year Ended October 31, 2022 | |
| OPERATIONS | |
| | | |
| | |
| Net investment loss | |
$ | (2,510,071 | ) | |
$ | (7,552,691 | ) |
| Net realized loss | |
| (40,703,369 | ) | |
| (99,827,657 | ) |
| Net change in unrealized appreciation/depreciation | |
| 42,241,817 | | |
| (99,575,453 | ) |
| Net decrease in net assets resulting from operations | |
| (971,623 | ) | |
| (206,955,801 | ) |
| DISTRIBUTIONS TO COMMON SHAREHOLDERS | |
| | | |
| | |
| From distributable earnings | |
| (16,625,757 | ) | |
| (21,501,359 | ) |
| Tax return of capital | |
| – | | |
| (26,881,540 | ) |
| Net decrease in net assets from distributions | |
| (16,625,757 | ) | |
| (48,382,899 | ) |
| CAPITAL SHARE TRANSACTIONS | |
| | | |
| | |
| Proceeds from sales of shares | |
$ | – | | |
$ | 27,463,006 | |
| Reinvestment of dividends | |
| – | | |
| 2,423,018 | |
| Offering Costs | |
| – | | |
| 110,811 | |
| Net increase in net assets derived from capital share transactions | |
| – | | |
| 29,996,835 | |
| Net decrease in net assets Attributable to Common Shares | |
| (17,597,380 | ) | |
| (225,341,865 | ) |
| NET ASSETS ATTRIBUTABLE TO COMMON SHARES | |
| | | |
| | |
| Beginning of period | |
| 270,392,174 | | |
| 495,734,039 | |
| End of period | |
$ | 252,794,794 | | |
$ | 270,392,174 | |
See
Notes to Financial Statements.
Clough
Global Funds
STATEMENTS
OF CASH FLOWS
April
30, 2023 (Unaudited)
| | |
Clough Global Dividend and Income Fund | | |
Clough Global Equity Fund | | |
Clough Global Opportunities Fund | |
| CASH FLOWS FROM OPERATING ACTIVITIES: | |
| | |
| | |
| |
| Net increase/(decrease) in net assets from operations | |
$ | 387,830 | | |
$ | (268,349 | ) | |
$ | (971,623 | ) |
| Purchase of investment securities | |
| (49,507,851 | ) | |
| (143,826,329 | ) | |
| (253,228,126 | ) |
| Net sales/purchases of short-term investment securities | |
| (754,218 | ) | |
| (3,097,360 | ) | |
| 2,938,052 | |
| Proceeds from disposition of investment securities | |
| 97,421,722 | | |
| 222,722,587 | | |
| 393,114,533 | |
| Amortization of premium and accretion of discount on investments | |
| (1,048 | ) | |
| (87,528 | ) | |
| (51,313 | ) |
| Proceeds from securities sold short transactions | |
| 23,750,596 | | |
| 39,811,629 | | |
| 72,836,273 | |
| Cover securities sold short transactions | |
| (32,734,024 | ) | |
| (65,513,843 | ) | |
| (120,049,762 | ) |
| Purchased options transactions | |
| (6,703,303 | ) | |
| (10,534,180 | ) | |
| (19,408,501 | ) |
| Proceeds from purchased options transactions | |
| 2,502,898 | | |
| 4,359,405 | | |
| 8,038,444 | |
| Premiums paid on closing written options transactions | |
| (513,451 | ) | |
| (833,168 | ) | |
| (1,533,757 | ) |
| Premiums received from written options transactions | |
| 3,222,109 | | |
| 5,058,798 | | |
| 9,351,353 | |
| Net realized (gain)/loss on: | |
| 0 | | |
| | | |
| | |
| Investments | |
| 8,077,041 | | |
| 19,125,079 | | |
| 36,506,454 | |
| Securities sold short | |
| 2,366,058 | | |
| 5,323,908 | | |
| 9,795,238 | |
| Written options | |
| (2,433,877 | ) | |
| (4,038,601 | ) | |
| (7,441,248 | ) |
| Net change in unrealized appreciation/depreciation on: | |
| | | |
| | | |
| | |
| Investments | |
| (7,870,015 | ) | |
| (20,532,788 | ) | |
| (38,523,749 | ) |
| Securities sold short | |
| (914,054 | ) | |
| (2,067,535 | ) | |
| (3,817,419 | ) |
| Written options | |
| 430,514 | | |
| 858,292 | | |
| 1,511,082 | |
| Total return swap contracts | |
| (25,685 | ) | |
| (32,319 | ) | |
| (59,084 | ) |
| (Increase)/Decrease in assets: | |
| | | |
| | | |
| | |
| Dividends receivable | |
| (32,521 | ) | |
| 79,399 | | |
| 173,780 | |
| Interest receivable | |
| 79,553 | | |
| (95,765 | ) | |
| 15,428 | |
| Receivable from affiliated fund | |
| – | | |
| 1,600,000 | | |
| – | |
| Total return swap contracts receivable | |
| (7,539 | ) | |
| (12,931 | ) | |
| (23,761 | ) |
| Variation margin receivable for futures contracts | |
| (6,113 | ) | |
| (10,913 | ) | |
| (19,813 | ) |
| Increase/(Decrease) in liabilities: | |
| | | |
| | | |
| | |
| Administration fees payable | |
| (31,079 | ) | |
| (66,015 | ) | |
| (120,025 | ) |
| Interest due on loan payable | |
| 1,359 | | |
| (118,922 | ) | |
| (200,115 | ) |
| Investment advisory fees payable | |
| (14,803 | ) | |
| (59,914 | ) | |
| (123,825 | ) |
| Payable to affiliated fund | |
| – | | |
| – | | |
| (1,600,000 | ) |
| Short sales dividends payable | |
| 5,841 | | |
| 11,701 | | |
| 21,105 | |
| Total return swap contracts payable | |
| – | | |
| (35,253 | ) | |
| (65,246 | ) |
| Trustees' fees and expenses payable | |
| (1,595 | ) | |
| (1,595 | ) | |
| (1,595 | ) |
| Variation margin payable for futures contracts | |
| (23,512 | ) | |
| (44,888 | ) | |
| (81,700 | ) |
| Accrued expenses and other payables | |
| (35,674 | ) | |
| (8,638 | ) | |
| (55,486 | ) |
| Net Cash Provided by Operating Activities | |
| 36,635,159 | | |
| 47,663,964 | | |
| 86,925,594 | |
| Repayment of loan payable | |
| (13,000,000 | ) | |
| (48,000,000 | ) | |
| (92,000,000 | ) |
| Cash distributions paid | |
| (5,338,025 | ) | |
| (9,026,821 | ) | |
| (16,625,757 | ) |
| Payable due to custodian | |
| (21,315,272 | ) | |
| (7,357,884 | ) | |
| (10,525,666 | ) |
| Net Cash Used in Financing Activities | |
| (39,653,297 | ) | |
| (64,384,705 | ) | |
| (119,151,423 | ) |
| Effect of exchange rates on cash | |
| (18 | ) | |
| (21 | ) | |
| (43 | ) |
| Net decrease in cash | |
| (3,018,156 | ) | |
| (16,720,762 | ) | |
| (32,225,872 | ) |
| Cash and restricted cash, beginning balance | |
| 24,364,782 | | |
| 45,559,372 | | |
| 85,137,910 | |
| Cash and restricted cash, ending balance | |
$ | 21,346,626 | | |
$ | 28,838,610 | | |
$ | 52,912,038 | |
| | |
| | | |
| | | |
| | |
| SUPPLEMENTAL DISCLOSURE OF CASH FLOW INFORMATION: | |
| | | |
| | | |
| | |
| Cash paid during the year for interest from loan payable: | |
$ | 1,361,167 | | |
$ | 2,426,673 | | |
$ | 4,447,751 | |
| | |
| | | |
| | | |
| | |
| RECONCILIAITION OF BEGINNING BALANCE OF RESTRICTED AND UNRESTRICTED CASH TO STATEMENT OF ASSETS
AND LIABILITIES | |
| | | |
| | | |
| | |
| Cash | |
$ | – | | |
$ | – | | |
$ | – | |
| Foreign currencies, at value | |
| 6 | | |
| – | | |
| 5 | |
| Deposits with broker | |
| | | |
| | | |
| | |
| Futures | |
| 133,198 | | |
| 255,154 | | |
| 462,831 | |
| Securities sold short | |
| 24,131,221 | | |
| 45,123,269 | | |
| 84,340,725 | |
| Total return swaps | |
| 100,357 | | |
| 180,949 | | |
| 334,349 | |
See
Notes to Financial Statements.
Clough
Global Funds
STATEMENTS
OF CASH FLOWS
April
30, 2023 (Unaudited) (Continued)
| | |
Clough Global Dividend and Income Fund | | |
Clough Global Equity Fund | | |
Clough Global Opportunities Fund | |
| RECONCILIAITION OF ENDING BALANCE OF RESTRICTED AND UNRESTRICTED CASH TO STATEMENT OF ASSETS AND LIABILITIES | |
| | |
| | |
| |
| Cash | |
$ | – | | |
$ | – | | |
$ | – | |
| Foreign currencies, at value | |
| 38,680 | | |
| 41,012 | | |
| 77,403 | |
| Deposits with broker | |
| | | |
| | | |
| | |
| Futures | |
| 1,036,969 | | |
| 1,741,525 | | |
| 3,189,038 | |
| Securities sold short | |
| 18,262,937 | | |
| 23,804,197 | | |
| 43,735,267 | |
| Total return swaps | |
| 174,696 | | |
| 280,700 | | |
| 515,576 | |
| Written Options | |
| 1,833,344 | | |
| 2,971,176 | | |
| 5,394,754 | |
See
Notes to Financial Statements.
Clough
Global Dividend and Income Fund
FINANCIAL
HIGHLIGHTS
April
30, 2023
| | |
For the
Six Months
Ended
April 30, 2023
(Unaudited) | | |
For the Year
Ended
October 31, 2022 | | |
For the Year
Ended
October 31, 2021 | | |
For the Year
Ended
October 31, 2020 | |
| PER COMMON SHARE OPERATING PERFORMANCE: | |
| | |
| | |
| | |
| |
| Net Asset Value, Beginning of Period | |
$ | 7.34 | | |
$ | 11.02 | | |
$ | 10.23 | | |
$ | 12.21 | |
| | |
| | | |
| | | |
| | | |
| | |
| INCOME FROM INVESTMENT OPERATIONS: | |
| | | |
| | | |
| | | |
| | |
| Net investment income/(loss)(c) | |
| 0.02 | | |
| (0.02 | ) | |
| 0.06 | | |
| 0.12 | |
| Net realized and unrealized gain/(loss) on investments | |
| 0.01 | | |
| (2.59 | ) | |
| 2.28 | | |
| (0.89 | ) |
| Total from Investment Operations | |
| 0.03 | | |
| (2.61 | ) | |
| 2.34 | | |
| (0.77 | ) |
| | |
| | | |
| | | |
| | | |
| | |
| DISTRIBUTIONS TO COMMON SHAREHOLDERS FROM: | |
| | | |
| | | |
| | | |
| | |
| Net investment income | |
| (0.42 | ) | |
| – | | |
| – | | |
| (0.20 | ) |
| Net realized gains | |
| – | | |
| – | | |
| (0.41 | ) | |
| – | |
| Tax return of capital | |
| – | | |
| (1.10 | ) | |
| (0.76 | ) | |
| (1.01 | ) |
| Total Distributions to Common Shareholders | |
| (0.42 | ) | |
| (1.10 | ) | |
| (1.17 | ) | |
| (1.21 | ) |
| | |
| | | |
| | | |
| | | |
| | |
| CAPITAL SHARE TRANSACTIONS: | |
| | | |
| | | |
| | | |
| | |
| Impact of capital share transactions | |
| – | | |
| 0.03 | | |
| (0.38 | ) | |
| – | |
| Total Capital Share Transactions | |
| – | | |
| 0.03 | | |
| (0.38 | ) | |
| – | |
| Net Increase/(Decrease) in net asset value | |
| (0.39 | ) | |
| (3.68 | ) | |
| 0.79 | | |
| (1.98 | ) |
| Net Asset Value - End of Period | |
$ | 6.95 | | |
$ | 7.34 | | |
$ | 11.02 | | |
$ | 10.23 | |
| Market Value - End of Period | |
$ | 5.70 | | |
$ | 6.84 | | |
$ | 11.43 | | |
$ | 8.73 | |
| | |
| | | |
| | | |
| | | |
| | |
| Total Investment Return - Net Asset Value(e) | |
| 1.07 | % | |
| (24.49 | %) | |
| 23.34 | % | |
| (4.91 | %) |
| Total Investment Return - Market Price(f) | |
| (11.04 | %) | |
| (32.14 | %) | |
| 49.90 | % | |
| (9.59 | %) |
| | |
| | | |
| | | |
| | | |
| | |
| RATIOS AND SUPPLEMENTAL DATA:(g) | |
| | | |
| | | |
| | | |
| | |
| Net Assets, end of period (000s) | |
$ | 88,334 | | |
$ | 93,284 | | |
$ | 124,485 | | |
$ | 86,016 | |
| Ratios to average net assets attributable to common shareholders: | |
| | | |
| | | |
| | | |
| | |
| Total expense ratio | |
| 5.47 | %(h) | |
| 3.58 | % | |
| 2.38 | % | |
| 2.98 | % |
| Total expense ratio excluding interest expense and dividends on short sales
expense | |
| 2.02 | %(h) | |
| 1.91 | % | |
| 1.78 | % | |
| 1.89 | % |
| Ratio of net investment income/(loss) | |
| 0.44 | %(h) | |
| (0.17 | %) | |
| 0.49 | % | |
| 1.10 | % |
| Portfolio turnover rate(i) | |
| 77 | % | |
| 199 | % | |
| 147 | % | |
| 229 | % |
| BORROWINGS AT END OF PERIOD: | |
| | | |
| | | |
| | | |
| | |
| Aggregate Amount Outstanding (000s) | |
$ | 40,000 | | |
$ | 53,000 | | |
$ | 61,500 | | |
$ | 50,500 | |
| Asset Coverage Per $1,000(j) | |
| 3,208 | | |
| 2,760 | | |
| 3,024 | | |
| 2,703 | |
| (a) | Effective
July 31, 2016, the Clough Global Allocation Fund name changed to Clough Global Dividend
and Income Fund. |
| (b) | The
Board announced, on September 12, 2014, approval to change the fiscal year-end of the
Fund from March 31 to October 31. |
| (c) | Calculated
based on the average number of common shares outstanding during each fiscal period. |
| (d) | Amount
represents less than $0.005 per common share. |
| (e) | Total
investment return - Net Asset Value is calculated based on the funds calculated net asset
value, assuming a purchase of a common share at the opening on the first day and a sale
at the closing on the last day of each period reported and that all rights in the Fund's
rights offering were exercised. Dividends and distributions, if any, are assumed for
purposes of this calculation to be reinvested at price obtained under the Fund's dividend
reinvestment plan. Total investment returns do not reflect brokerage commissions on the
purchase or sale of the Fund's common shares. Past performance is not a guarantee of
future results. Total returns for the period indicated are not annualized. Total returns
include adjustments in accordance with accounting principles generally accepted in the
United States of America for financial reporting purposes and may differ from those reported
to the market. |
| (f) | Total
investment return - Market Price is calculated based on where the fund is trading in
the market, assuming a purchase of a common share at the opening on the first day and
a sale at the closing on the last day of each period reported. Total investment returns
do not reflect brokerage commissions on the purchase or sale of the Fund's common shares.
Past performance is not a guarantee of future results. Total returns for the period indicated
are not annualized |
| (g) | Ratios
do not reflect the proportionate share of income and expenses of the underlying investee
funds (i.e. those listed under Money Market Funds or Closed-End Funds on the Schedule
of Investments). |
| (i) | Portfolio
turnover rate for periods less than one full year have not been annualized. |
See
Notes to Financial Statements.
Clough
Global Dividend and Income Fund
FINANCIAL
HIGHLIGHTS
April
30, 2023
For the Year
Ended
October 31, 2019 | | |
For the Year
Ended
October 31, 2018 | | |
For the Year
Ended
October
31, 2017 | | |
For the Year
Ended
October
31, 2016(a) | | |
For the Year
Ended
October 31, 2015 | | |
For the Period
Ended
October
31, 2014(b) | | |
For the Year
Ended
March 31, 2014 | |
| | | |
| | |
| | |
| | |
| | |
| | |
| |
| $ | 12.54 | | |
$ | 14.76 | | |
$ | 13.79 | | |
$ | 15.65 | | |
$ | 16.96 | | |
$ | 17.51 | | |
$ | 17.38 | |
| | | | |
| | | |
| | | |
| | | |
| | | |
| | | |
| | |
| | 0.16 | | |
| 0.22 | | |
| 0.12 | | |
| (0.01 | ) | |
| (0.27 | ) | |
| (0.12 | ) | |
| 0.26 | |
| | 1.08 | | |
| (1.15 | ) | |
| 2.14 | | |
| (0.46 | ) | |
| 0.38 | | |
| 0.31 | | |
| 1.90 | |
| | 1.24 | | |
| (0.93 | ) | |
| 2.26 | | |
| (0.47 | ) | |
| 0.11 | | |
| 0.19 | | |
| 1.64 | |
| | | | |
| | | |
| | | |
| | | |
| | | |
| | | |
| | |
| | (0.06 | ) | |
| – | | |
| (0.37 | ) | |
| – | | |
| (0.07 | ) | |
| (0.14 | ) | |
| (0.24 | ) |
| | (0.53 | ) | |
| (0.17 | ) | |
| – | | |
| (0.59 | ) | |
| (1.34 | ) | |
| (0.60 | ) | |
| (1.27 | ) |
| | (0.64 | ) | |
| (1.23 | ) | |
| (0.92 | ) | |
| (0.80 | ) | |
| – | | |
| – | | |
| – | |
| | (1.23 | ) | |
| (1.40 | ) | |
| (1.29 | ) | |
| (1.39 | ) | |
| (1.41 | ) | |
| (0.74 | ) | |
| (1.51 | ) |
| | | | |
| | | |
| | | |
| | | |
| | | |
| | | |
| | |
| | (0.34 | ) | |
| 0.11 | | |
| (0.00 | )(d) | |
| – | | |
| (0.01 | ) | |
| – | | |
| – | |
| | (0.34 | ) | |
| 0.11 | | |
| (0.00 | )(d) | |
| – | | |
| (0.01 | ) | |
| – | | |
| – | |
| | (0.33 | ) | |
| (2.22 | ) | |
| 0.97 | | |
| (1.86 | ) | |
| (1.31 | ) | |
| (0.55 | ) | |
| 0.13 | |
| $ | 12.21 | | |
$ | 12.54 | | |
$ | 14.76 | | |
$ | 13.79 | | |
$ | 15.65 | | |
$ | 16.96 | | |
$ | 17.51 | |
| $ | 10.96 | | |
$ | 11.28 | | |
$ | 14.16 | | |
$ | 11.62 | | |
$ | 13.60 | | |
$ | 14.60 | | |
$ | 15.18 | |
| | | | |
| | | |
| | | |
| | | |
| | | |
| | | |
| | |
| | 11.75 | % | |
| (5.18 | %) | |
| 17.89 | % | |
| (1.14 | %) | |
| 1.61 | % | |
| 1.68 | % | |
| 11.14 | % |
| | 11.51 | % | |
| (11.10 | %) | |
| 34.22 | % | |
| (4.14 | %) | |
| 2.57 | % | |
| 0.97 | % | |
| 11.12 | % |
| | | | |
| | | |
| | | |
| | | |
| | | |
| | | |
| | |
| $ | 102,670 | | |
$ | 87,880 | | |
$ | 153,233 | | |
$ | 143,319 | | |
$ | 162,651 | | |
$ | 176,968 | | |
$ | 182,737 | |
| | | | |
| | | |
| | | |
| | | |
| | | |
| | | |
| | |
| | 3.66 | % | |
| 3.48 | % | |
| 2.94 | % | |
| 3.65 | % | |
| 3.95 | % | |
| 3.25 | %(h) | |
| 3.34 | % |
| | | | |
| | | |
| | | |
| | | |
| | | |
| | | |
| | |
| | 1.85 | % | |
| 1.84 | % | |
| 1.99 | % | |
| 2.09 | % | |
| 2.17 | % | |
| 2.00 | %(h) | |
| 1.94 | % |
| | 1.30 | % | |
| 1.55 | % | |
| 0.87 | % | |
| (0.08 | %) | |
| (1.58 | %) | |
| (1.15 | %)(h) | |
| (1.47 | %) |
| | 253 | % | |
| 109 | % | |
| 149 | % | |
| 205 | % | |
| 172 | % | |
| 110 | % | |
| 179 | % |
| | | | |
| | | |
| | | |
| | | |
| | | |
| | | |
| | |
| $ | 49,500 | | |
$ | 55,000 | | |
$ | 72,000 | | |
$ | 72,000 | | |
$ | 93,300 | | |
$ | 93,300 | | |
$ | 93,300 | |
| | 3,074 | | |
| 2,598 | | |
| 3,128 | | |
| 2,291 | | |
| 2,743 | | |
| 2,897 | | |
| 2,959 | |
| (j) | Calculated
by subtracting the Fund's total liabilities (excluding the principal amount of Leverage
Facility) from the Fund's total assets and dividing by the principal amount of the Leverage
Facility and then multiplying by $1,000. |
See
Notes to Financial Statements.
Clough
Global Equity Fund
FINANCIAL
HIGHLIGHTS
April
30, 2023
| | |
For the
Six Months
Ended
April 30, 2023
(Unaudited) | | |
For the Year
Ended
October 31, 2022 | | |
For the Year
Ended
October 31, 2021 | | |
For the Year
Ended
October 31, 2020 | |
| PER COMMON SHARE OPERATING PERFORMANCE: | |
| | |
| | |
| | |
| |
| Net Asset Value, Beginning of Period | |
$ | 7.73 | | |
$ | 15.11 | | |
$ | 12.81 | | |
$ | 12.95 | |
| | |
| | | |
| | | |
| | | |
| | |
| INCOME FROM INVESTMENT OPERATIONS: | |
| | | |
| | | |
| | | |
| | |
| Net investment income/(loss)(b) | |
| (0.07 | ) | |
| (0.25 | ) | |
| (0.19 | ) | |
| (0.09 | ) |
| Net realized and unrealized gain/(loss) on investments | |
| 0.06 | | |
| (5.71 | ) | |
| 4.72 | | |
| 1.27 | |
| Total from Investment Operations | |
| (0.01 | ) | |
| (5.96 | ) | |
| 4.53 | | |
| 1.18 | |
| | |
| | | |
| | | |
| | | |
| | |
| DISTRIBUTIONS TO COMMON SHAREHOLDERS FROM: | |
| | | |
| | | |
| | | |
| | |
| Net investment income | |
| (0.47 | ) | |
| – | | |
| (0.12 | ) | |
| (0.60 | ) |
| Net realized gains | |
| – | | |
| (0.75 | ) | |
| (1.44 | ) | |
| (0.72 | ) |
| Tax return of capital | |
| – | | |
| (0.68 | ) | |
| – | | |
| – | |
| Total Distributions to Common Shareholders | |
| (0.47 | ) | |
| (1.43 | ) | |
| (1.56 | ) | |
| (1.32 | ) |
| | |
| | | |
| | | |
| | | |
| | |
| CAPITAL SHARE TRANSACTIONS: | |
| | | |
| | | |
| | | |
| | |
| Impact of capital share transactions | |
| – | | |
| 0.01 | | |
| (0.67 | ) | |
| – | |
| Total Capital Share Transactions | |
| – | | |
| 0.01 | | |
| (0.67 | ) | |
| – | |
| Net Increase/(Decrease) in net asset value | |
| (0.48 | ) | |
| (7.38 | ) | |
| 2.30 | | |
| (0.14 | ) |
| Net Asset Value - End of Period | |
$ | 7.25 | | |
$ | 7.73 | | |
$ | 15.11 | | |
$ | 12.81 | |
| Market Value - End of Period | |
$ | 5.96 | | |
$ | 7.09 | | |
$ | 15.27 | | |
$ | 10.78 | |
| | |
| | | |
| | | |
| | | |
| | |
| Total Investment Return - Net Asset Value(d) | |
| 0.74 | % | |
| (40.97 | %) | |
| 36.34 | % | |
| 11.47 | % |
| Total Investment Return - Market Price(e) | |
| (9.71 | %) | |
| (46.43 | %) | |
| 63.73 | % | |
| 3.21 | % |
| | |
| | | |
| | | |
| | | |
| | |
| RATIOS AND SUPPLEMENTAL DATA:(f) | |
| | | |
| | | |
| | | |
| | |
| Net Assets, end of period (000s) | |
$ | 138,574 | | |
$ | 147,870 | | |
$ | 267,675 | | |
$ | 169,542 | |
| Ratios to average net assets attributable to common shareholders: | |
| | | |
| | | |
| | | |
| | |
| Total expense ratio | |
| 6.10 | %(g) | |
| 4.39 | % | |
| 2.64 | % | |
| 3.23 | % |
| Total expense ratio excluding interest expense and dividends on short sales
expense | |
| 2.45 | %(g) | |
| 2.44 | % | |
| 2.07 | % | |
| 2.20 | % |
| Ratio of net investment income/(loss) | |
| (1.98 | %)(g) | |
| (2.31 | %) | |
| (1.21 | %) | |
| (0.70 | %) |
| Portfolio turnover rate(h) | |
| 141 | % | |
| 198 | % | |
| 194 | % | |
| 256 | % |
| BORROWINGS AT END OF PERIOD: | |
| | | |
| | | |
| | | |
| | |
| Aggregate Amount Outstanding (000s) | |
$ | 62,000 | | |
$ | 110,000 | | |
$ | 131,500 | | |
$ | 92,000 | |
| Asset Coverage Per $1,000(i) | |
| 3,235 | | |
| 2,344 | | |
| 3,036 | | |
| 2,843 | |
| (a) | The
Board announced, on September 12, 2014, approval to change the fiscal year-end of the
Fund from March 31 to October 31. |
| (b) | Calculated
based on the average number of common shares outstanding during each fiscal period. |
| (c) | Amount
represents less than $0.005 per common share. |
| (d) | Total
investment return - Net Asset Value is calculated based on the funds calculated net asset
value, assuming a purchase of a common share at the opening on the first day and a sale
at the closing on the last day of each period reported and that all rights in the Fund's
rights offering were exercised. Dividends and distributions, if any, are assumed for
purposes of this calculation to be reinvested at price obtained under the Fund's dividend
reinvestment plan. Total investment returns do not reflect brokerage commissions on the
purchase or sale of the Fund's common shares. Past performance is not a guarantee of
future results. Total returns for the period indicated are not annualized. Total returns
include adjustments in accordance with accounting principles generally accepted in the
United States of America for financial reporting purposes and may differ from those reported
to the market. |
| (e) | Total
investment return - Market Price is calculated based on where the fund is trading in
the market, assuming a purchase of a common share at the opening on the first day and
a sale at the closing on the last day of each period reported. Total investment returns
do not reflect brokerage commissions on the purchase or sale of the Fund's common shares.
Past performance is not a guarantee of future results. Total returns for the period indicated
are not annualized |
| (f) | Ratios
do not reflect the proportionate share of income and expenses of the underlying investee
funds (i.e. those listed under Money Market Funds or Closed-End Funds on the Schedule
of Investments). |
| (h) | Portfolio
turnover rate for periods less than one full year have not been annualized. |
See
Notes to Financial Statements.
Clough
Global Equity Fund
FINANCIAL
HIGHLIGHTS
April
30, 2023
For the Year
Ended
October 31, 2019 | | |
For the Year
Ended
October 31, 2018 | | |
For the Year
Ended
October 31, 2017 | | |
For the Year
Ended
October 31, 2016 | | |
For the Year
Ended
October 31, 2015 | | |
For the Period
Ended
October 31, 2014(a) | | |
For the Year
Ended
March 31, 2014 | |
| | | |
| | |
| | |
| | |
| | |
| | |
| |
| $ | 13.55 | | |
$ | 14.50 | | |
$ | 12.70 | | |
$ | 15.10 | | |
$ | 16.47 | | |
$ | 17.15 | | |
$ | 16.63 | |
| | | | |
| | | |
| | | |
| | | |
| | | |
| | | |
| | |
| | (0.06 | ) | |
| 0.01 | | |
| (0.02 | ) | |
| (0.23 | ) | |
| (0.45 | ) | |
| (0.17 | ) | |
| (0.33 | ) |
| | 1.15 | | |
| 0.41 | | |
| 3.06 | | |
| (0.84 | ) | |
| 0.46 | | |
| 0.23 | | |
| 2.33 | |
| | 1.09 | | |
| 0.42 | | |
| 3.04 | | |
| (1.07 | ) | |
| (0.01 | ) | |
| 0.06 | | |
| 2.00 | |
| | | | |
| | | |
| | | |
| | | |
| | | |
| | | |
| | |
| | – | | |
| – | | |
| (0.13 | ) | |
| – | | |
| (0.04 | ) | |
| (0.08 | ) | |
| (0.38 | ) |
| | (1.34 | ) | |
| (1.50 | ) | |
| – | | |
| (0.90 | ) | |
| (1.32 | ) | |
| (0.66 | ) | |
| (1.10 | ) |
| | – | | |
| – | | |
| (1.11 | ) | |
| (0.43 | ) | |
| – | | |
| – | | |
| – | |
| | (1.34 | ) | |
| (1.50 | ) | |
| (1.24 | ) | |
| (1.33 | ) | |
| (1.36 | ) | |
| (0.74 | ) | |
| (1.48 | ) |
| | | | |
| | | |
| | | |
| | | |
| | | |
| | | |
| | |
| | (0.35 | ) | |
| 0.13 | | |
| (0.00 | )(c) | |
| – | | |
| (0.02 | ) | |
| – | | |
| – | |
| | (0.35 | ) | |
| 0.13 | | |
| (0.00 | )(c) | |
| – | | |
| (0.02 | ) | |
| – | | |
| – | |
| | (0.60 | ) | |
| (0.95 | ) | |
| 1.80 | | |
| (2.40 | ) | |
| (1.37 | ) | |
| (0.68 | ) | |
| 0.52 | |
| $ | 12.95 | | |
$ | 13.55 | | |
$ | 14.50 | | |
$ | 12.70 | | |
$ | 15.10 | | |
$ | 16.47 | | |
$ | 17.15 | |
| $ | 11.77 | | |
$ | 13.21 | | |
$ | 13.66 | | |
$ | 10.69 | | |
$ | 12.92 | | |
$ | 14.34 | | |
$ | 15.42 | |
| | | | |
| | | |
| | | |
| | | |
| | | |
| | | |
| | |
| | 9.40 | % | |
| 3.99 | % | |
| 25.99 | % | |
| (5.36 | %) | |
| 0.76 | % | |
| 0.86 | % | |
| 13.57 | % |
| | 1.99 | % | |
| 7.62 | % | |
| 41.01 | % | |
| (6.90 | %) | |
| (0.98 | %) | |
| (2.33 | %) | |
| 15.52 | % |
| | | | |
| | | |
| | | |
| | | |
| | | |
| | | |
| | |
| $ | 171,337 | | |
$ | 149,379 | | |
$ | 255,870 | | |
$ | 224,187 | | |
$ | 266,576 | | |
$ | 293,829 | | |
$ | 305,958 | |
| | | | |
| | | |
| | | |
| | | |
| | | |
| | | |
| | |
| | 3.94 | % | |
| 3.63 | % | |
| 3.14 | % | |
| 4.21 | % | |
| 4.56 | % | |
| 3.68 | %(g) | |
| 3.76 | % |
| | | | |
| | | |
| | | |
| | | |
| | | |
| | | |
| | |
| | 2.18 | % | |
| 2.13 | % | |
| 2.21 | % | |
| 2.59 | % | |
| 2.77 | % | |
| 2.42 | %(g) | |
| 2.36 | % |
| | (0.45 | %) | |
| 0.06 | % | |
| (0.14 | %) | |
| (1.70 | %) | |
| (27.30 | %) | |
| (1.68 | %)(g) | |
| (1.95 | %) |
| | 297 | % | |
| 115 | % | |
| 141 | % | |
| 182 | % | |
| 154 | % | |
| 102 | % | |
| 166 | % |
| | | | |
| | | |
| | | |
| | | |
| | | |
| | | |
| | |
| $ | 84,500 | | |
$ | 85,000 | | |
$ | 113,000 | | |
$ | 113,000 | | |
$ | 156,000 | | |
$ | 156,000 | | |
$ | 156,000 | |
| | 3,028 | | |
| 2,757 | | |
| 3,264 | | |
| 2,984 | | |
| 2,709 | | |
| 2,884 | | |
| 2,961 | |
| (i) | Calculated
by subtracting the Fund's total liabilities (excluding the principal amount of Leverage
Facility) from the Fund's total assets and dividing by the principal amount of the Leverage
Facility and then multiplying by $1,000. |
See
Notes to Financial Statements.
Clough
Global Opportunities Fund
FINANCIAL
HIGHLIGHTS
April
30, 2023
| | |
For the
Six Months
Ended
April 30, 2023
(Unaudited) | | |
For the Year
Ended
October 31, 2022 | | |
For the Year
Ended
October 31, 2021 | | |
For the Year
Ended
October 31, 2020 | |
| PER COMMON SHARE OPERATING PERFORMANCE: | |
| | |
| | |
| | |
| |
| Net Asset Value, Beginning of Period | |
$ | 6.21 | | |
$ | 12.37 | | |
$ | 10.48 | | |
$ | 10.56 | |
| | |
| | | |
| | | |
| | | |
| | |
| INCOME FROM INVESTMENT OPERATIONS: | |
| | | |
| | | |
| | | |
| | |
| Net investment (loss)(b) | |
| (0.06 | ) | |
| (0.18 | ) | |
| (0.16 | ) | |
| (0.08 | ) |
| Net realized and unrealized gain/(loss) on investments | |
| 0.04 | | |
| (4.83 | ) | |
| 3.60 | | |
| 1.07 | |
| Total from Investment Operations | |
| (0.02 | ) | |
| (5.01 | ) | |
| 3.44 | | |
| 0.99 | |
| | |
| | | |
| | | |
| | | |
| | |
| DISTRIBUTIONS TO COMMON SHAREHOLDERS FROM: | |
| | | |
| | | |
| | | |
| | |
| Net investment income | |
| (0.38 | ) | |
| – | | |
| – | | |
| (0.71 | ) |
| Net realized gains | |
| – | | |
| (0.52 | ) | |
| (1.27 | ) | |
| (0.14 | ) |
| Tax return of capital | |
| – | | |
| (0.64 | ) | |
| – | | |
| (0.22 | ) |
| Total Distributions to Common Shareholders | |
| (0.38 | ) | |
| (1.16 | ) | |
| (1.27 | ) | |
| (1.07 | ) |
| | |
| | | |
| | | |
| | | |
| | |
| CAPITAL SHARE TRANSACTIONS: | |
| | | |
| | | |
| | | |
| | |
| Impact of capital share transactions | |
| – | | |
| 0.01 | | |
| (0.28 | ) | |
| – | |
| Total Capital Share Transactions | |
| – | | |
| 0.01 | | |
| (0.28 | ) | |
| – | |
| Net Increase/(Decrease) in net asset value | |
| (0.40 | ) | |
| (6.16 | ) | |
| 1.89 | | |
| (0.08 | ) |
| Net Asset Value - End of Period | |
$ | 5.81 | | |
$ | 6.21 | | |
$ | 12.37 | | |
$ | 10.48 | |
| Market Value - End of Period | |
$ | 4.80 | | |
$ | 5.74 | | |
$ | 12.87 | | |
$ | 8.84 | |
| | |
| | | |
| | | |
| | | |
| | |
| Total Investment Return - Net Asset Value(d) | |
| 0.63 | % | |
| (42.06 | %) | |
| 34.71 | % | |
| 11.91 | % |
| Total Investment Return - Market Price(e) | |
| (10.06 | %) | |
| (48.53 | %) | |
| 66.16 | % | |
| 8.46 | % |
| | |
| | | |
| | | |
| | | |
| | |
| RATIOS AND SUPPLEMENTAL DATA:(f) | |
| | | |
| | | |
| | | |
| | |
| Net Assets, end of period (000s) | |
$ | 252,795 | | |
$ | 270,392 | | |
$ | 495,734 | | |
$ | 337,761 | |
| Ratios to average net assets attributable to common shareholders: | |
| | | |
| | | |
| | | |
| | |
| Total expense ratio | |
| 6.25 | %(g) | |
| 4.57 | % | |
| 2.78 | % | |
| 3.42 | % |
| Total expense ratio excluding interest expense and
dividends on short sales expense | |
| 2.58 | %(g) | |
| 2.60 | % | |
| 2.20 | % | |
| 2.35 | % |
| Ratio of net investment (loss) | |
| (1.99 | %)(g) | |
| (2.09 | %) | |
| (1.26 | %) | |
| (0.73 | %) |
| Portfolio turnover rate(h) | |
| 134 | % | |
| 212 | % | |
| 209 | % | |
| 261 | % |
| BORROWINGS AT END OF PERIOD: | |
| | | |
| | | |
| | | |
| | |
| Aggregate Amount Outstanding (000s) | |
$ | 112,000 | | |
$ | 204,000 | | |
$ | 245,500 | | |
$ | 182,500 | |
| Asset Coverage Per $1,000(i) | |
| 3,257 | | |
| 2,325 | | |
| 3,019 | | |
| 2,851 | |
| (a) | The
Board announced, on September 12, 2014, approval to change the fiscal year-end of the
Fund from March 31 to October 31. |
| (b) | Calculated
based on the average number of common shares outstanding during each fiscal period. |
| (c) | Amount
represents less than $0.005 per common share. |
| (d) | Total
investment return - Net Asset Value is calculated based on the funds calculated net asset
value, assuming a purchase of a common share at the opening on the first day and a sale
at the closing on the last day of each period reported and that all rights in the Fund's
rights offering were exercised. Dividends and distributions, if any, are assumed for
purposes of this calculation to be reinvested at price obtained under the Fund's dividend
reinvestment plan. Total investment returns do not reflect brokerage commissions on the
purchase or sale of the Fund's common shares. Past performance is not a guarantee of
future results. Total returns for the period indicated are not annualized. Total returns
include adjustments in accordance with accounting principles generally accepted in the
United States of America for financial reporting purposes and may differ from those reported
to the market. |
| (e) | Total
investment return - Market Price is calculated based on where the fund is trading in
the market, assuming a purchase of a common share at the opening on the first day and
a sale at the closing on the last day of each period reported. Total investment returns
do not reflect brokerage commissions on the purchase or sale of the Fund's common shares.
Past performance is not a guarantee of future results. Total returns for the period indicated
are not annualized |
| (f) | Ratios
do not reflect the proportionate share of income and expenses of the underlying investee
funds (i.e. those listed under Money Market Funds or Closed-End Funds on the Schedule
of Investments). |
| (h) | Portfolio
turnover rate for periods less than one full year have not been annualized. |
See
Notes to Financial Statements.
Clough
Global Opportunities Fund
FINANCIAL
HIGHLIGHTS
April
30, 2023
For the Year
Ended
October 31, 2019 | | |
For the Year
Ended
October 31, 2018 | | |
For the Year
Ended
October 31, 2017 | | |
For the Year
Ended
October 31, 2016 | | |
For the Year
Ended
October 31, 2015 | | |
For the Period
Ended
October 31, 2014(a) | | |
For the Year
Ended
March 31, 2014 | |
| | | |
| | |
| | |
| | |
| | |
| | |
| |
| $ | 10.63 | | |
$ | 12.09 | | |
$ | 11.07 | | |
$ | 12.92 | | |
$ | 14.11 | | |
$ | 14.67 | | |
$ | 14.64 | |
| | | | |
| | | |
| | | |
| | | |
| | | |
| | | |
| | |
| | (0.04 | ) | |
| (0.01 | ) | |
| (0.02 | ) | |
| (0.15 | ) | |
| (0.35 | ) | |
| (0.15 | ) | |
| (0.32 | ) |
| | 1.03 | | |
| (0.35 | ) | |
| 2.11 | | |
| (0.54 | ) | |
| 0.36 | | |
| 0.26 | | |
| 1.72 | |
| | 0.99 | | |
| (0.36 | ) | |
| 2.09 | | |
| (0.69 | ) | |
| 0.01 | | |
| 0.11 | | |
| 1.40 | |
| | | | |
| | | |
| | | |
| | | |
| | | |
| | | |
| | |
| | – | | |
| – | | |
| (0.14 | ) | |
| – | | |
| – | | |
| – | | |
| (0.11 | ) |
| | (0.71 | ) | |
| (0.76 | ) | |
| – | | |
| (0.18 | ) | |
| (1.19 | ) | |
| (0.67 | ) | |
| (1.26 | ) |
| | (0.35 | ) | |
| (0.45 | ) | |
| (0.93 | ) | |
| (0.98 | ) | |
| – | | |
| – | | |
| – | |
| | (1.06 | ) | |
| (1.21 | ) | |
| (1.07 | ) | |
| (1.16 | ) | |
| (1.19 | ) | |
| (0.67 | ) | |
| (1.37 | ) |
| | | | |
| | | |
| | | |
| | | |
| | | |
| | | |
| | |
| | – | | |
| 0.11 | | |
| (0.00 | )(c) | |
| – | | |
| (0.01 | ) | |
| – | | |
| – | |
| | – | | |
| 0.11 | | |
| (0.00 | )(c) | |
| – | | |
| (0.01 | ) | |
| – | | |
| – | |
| | (0.07 | ) | |
| (1.46 | ) | |
| 1.09 | | |
| (1.85 | ) | |
| (1.19 | ) | |
| (0.56 | ) | |
| 0.03 | |
| $ | 10.56 | | |
$ | 10.63 | | |
$ | 12.09 | | |
$ | 11.07 | | |
$ | 12.92 | | |
$ | 14.11 | | |
$ | 14.67 | |
| $ | 9.19 | | |
$ | 9.56 | | |
$ | 11.42 | | |
$ | 9.04 | | |
$ | 11.25 | | |
$ | 12.18 | | |
$ | 12.75 | |
| | | | |
| | | |
| | | |
| | | |
| | | |
| | | |
| | |
| | 11.08 | % | |
| (1.78 | %) | |
| 20.99 | % | |
| (3.48 | %) | |
| 1.13 | % | |
| 1.39 | % | |
| 11.26 | % |
| | 7.49 | % | |
| (6.48 | %) | |
| 39.95 | % | |
| (9.46 | %) | |
| 1.93 | % | |
| 0.70 | % | |
| 9.99 | % |
| | | | |
| | | |
| | | |
| | | |
| | | |
| | | |
| | |
| $ | 340,278 | | |
$ | 342,584 | | |
$ | 623,361 | | |
$ | 570,931 | | |
$ | 666,588 | | |
$ | 729,855 | | |
$ | 759,084 | |
| | | | |
| | | |
| | | |
| | | |
| | | |
| | | |
| | |
| | 4.14 | % | |
| 3.81 | % | |
| 3.23 | % | |
| 4.32 | % | |
| 4.62 | % | |
| 3.86 | %(g) | |
| 3.97 | % |
| | | | |
| | | |
| | | |
| | | |
| | | |
| | | |
| | |
| | 2.33 | % | |
| 2.26 | % | |
| 2.27 | % | |
| 2.73 | % | |
| 2.82 | % | |
| 2.60 | %(g) | |
| 2.55 | % |
| | (0.39 | %) | |
| (0.05 | %) | |
| (0.16 | %) | |
| (1.33 | %) | |
| (2.47 | %) | |
| (1.76 | %)(g) | |
| (2.15 | %) |
| | 306 | % | |
| 120 | % | |
| 165 | % | |
| 191 | % | |
| 176 | % | |
| 111 | % | |
| 178 | % |
| | | | |
| | | |
| | | |
| | | |
| | | |
| | | |
| | |
| $ | 178,000 | | |
$ | 207,000 | | |
$ | 292,000 | | |
$ | 292,000 | | |
$ | 388,900 | | |
$ | 388,900 | | |
$ | 388,900 | |
| | 2,912 | | |
| 2,655 | | |
| 3,135 | | |
| 2,955 | | |
| 2,714 | | |
| 2,877 | | |
| 2,952 | |
| (i) | Calculated
by subtracting the Fund's total liabilities (excluding the principal amount of Leverage
Facility) from the Fund's total assets and dividing by the principal amount of the Leverage
Facility and then multiplying by $1,000. |
See
Notes to Financial Statements.
Clough
Global Funds
NOTES
TO FINANCIAL STATEMENTS
April
30, 2023 (Unaudited)
NOTE
1 - ORGANIZATION AND SIGNIFICANT ACCOUNTING AND OPERATING POLICIES
Clough
Global Dividend and Income Fund, Clough Global Equity Fund, and Clough Global Opportunities Fund (each a “Fund”, collectively
the “Funds”), are closed-end management investment companies registered under the Investment Company Act of 1940 (the
“1940 Act”). The Funds were organized under the laws of the state of Delaware on April 27, 2004, January 25, 2005,
and January 12, 2006, respectively for Clough Global Dividend and Income Fund, Clough Global Equity Fund, and Clough Global Opportunities
Fund. The Funds were previously registered as non-diversified investment companies. As a result of ongoing operations, each of
the Funds became a diversified company. The Funds may not resume operating in a non-diversified manner without first obtaining
shareholder approval. Each Fund’s investment objective is to provide a high level of total return. Each Declaration of Trust
provides that the Board of Trustees (the “Board”) may authorize separate classes of shares of beneficial interest.
The common shares of Clough Global Dividend and Income Fund, Clough Global Equity Fund, and Clough Global Opportunities Fund are
listed on the NYSE American LLC and trade under the ticker symbols “GLV”, “GLQ” and “GLO”
respectively.
The
following is a summary of significant accounting policies followed by the Funds. These policies are in conformity with U.S. generally
accepted accounting principles (“GAAP”). The preparation of financial statements in accordance with GAAP requires
management to make estimates and assumptions that affect the reported amounts and disclosures, including the disclosure of contingent
assets and liabilities, in the financial statements during the reporting period. Management believes the estimates and security
valuations are appropriate; however, actual results may differ from those estimates, and the security valuations reflected in
the financial statements may differ from the value the Funds ultimately realize upon sale of the securities. Each Fund is considered
an investment company for financial reporting purposes under GAAP and follows the accounting and reporting guidance applicable
to investment companies as codified in Accounting Standards Codification (“ASC”) Topic 946, Financial Services –
Investment Companies.
The
net asset value (“NAV”) per share of each Fund is determined no less frequently than daily, on each day that the New
York Stock Exchange (“NYSE” or the “Exchange”) is open for trading, as of the close of regular trading
on the Exchange (normally 4:00 p.m. New York time). Trading may take place in foreign issues held by a Fund at times when the
Fund is not open for business. As a result, each Fund’s NAV may change at times when it is not possible to purchase or sell
shares of that Fund.
Investment
Valuation – Securities, held by each Fund, for which exchange quotations are readily available, are valued at the last
sale price, or if no sale price or if traded on the over-the-counter market, at the mean of the bid and asked prices on such day.
Money market funds are valued based on the closing NAV. Most securities listed on a foreign exchange are valued at the last sale
price at the close of the exchange on which the security is primarily traded. In certain countries market maker prices are used
since they are the most representative of the daily trading activity. Market maker prices are usually the mean between the bid
and ask prices. Certain markets are not closed at the time that the Funds price their portfolio securities. In these situations,
snapshot prices are provided by the individual pricing services or other alternate sources at the close of the NYSE as appropriate.
Securities not traded on a particular day are valued at the mean between the last reported bid and the asked quotes, or the last
sale price when appropriate; otherwise fair value will be determined by the Board-appointed fair valuation committee. Debt securities
for which the over-the-counter market is the primary market are normally valued on the basis of prices furnished by one or more
pricing services or dealers at the mean between the latest available bid and asked prices. As authorized by the Board, debt securities
(including short-term obligations that will mature in 60 days or less) may be valued on the basis of valuations furnished by a
pricing service which determines valuations based upon market transactions for normal, institutional-size trading units of securities
or a matrix method which considers yield or price of comparable bonds provided by a pricing service. Over-the-counter options
are valued at the mean between bid and asked prices provided by dealers. Exchange-traded options are valued at closing settlement
prices. Total return swaps are priced based on valuations provided by a Board approved independent third party pricing agent.
If a total return swap price cannot be obtained from an independent third party pricing agent the Fund shall seek to obtain a
bid price from at least one independent and/or executing broker. Futures are valued at settlement prices.
If
the price of a security is unavailable, or the price of a security is unreliable, e.g., due to the occurrence of a significant
event, the security may be valued at its fair value determined the valuation designee. Pursuant to Rule 2a-5 under the 1940 Act,
the Board has designated the Fund's investment adviser, Clough Capital Partners L.P. ("Clough" or the "Adviser"),
as the valuation designee with respect to the fair valuation of each Fund's portfolio securities, subject to oversight by and
periodic reporting to the Board. For this purpose, fair value is the price that a Fund reasonably expects to receive on a current
sale of the security. Due to the number of variables affecting the price of a security, however; it is possible that the fair
value of a security may not accurately reflect the price that a Fund could actually receive on a sale of the security.
A
three-tier hierarchy has been established to classify fair value measurements for disclosure purposes. Inputs refer broadly to
the assumptions that market participants would use in pricing the asset or liability, including assumptions about risk. Inputs
may be observable or unobservable. Observable inputs are inputs that reflect the assumptions market participants would use in
pricing the asset or liability that are developed based on market data obtained from sources independent of the reporting entity.
Unobservable inputs are inputs that reflect the reporting entity’s own assumptions about the assumptions market participants
would use in pricing the asset or liability that are developed based on the best information available.
Various
inputs are used in determining the value of each Fund’s investments as of the reporting period end. These inputs are categorized
in the following hierarchy under applicable financial accounting standards:
Level
1 – Unadjusted quoted prices in active markets for identical, unrestricted assets or liabilities that a Fund has the ability
to access at the measurement date;
Level
2 – Quoted prices which are not active, quoted prices for similar assets or liabilities in active markets or inputs other
than quoted prices that are observable (either directly or indirectly) for substantially the full term of the asset or liability;
and
Level
3 – Significant unobservable prices or inputs (including the Fund’s own assumptions in determining the fair value
of investments) where there is little or no market activity for the asset or liability at the measurement date
Clough
Global Funds
NOTES
TO FINANCIAL STATEMENTS
April
30, 2023 (Continued) (Unaudited)
The
following is a summary of the inputs used as of April 30, 2023, in valuing each Fund’s investments carried at value.
Clough
Global Dividend and Income Fund
| Investments in Securities at Value(a) | |
Level 1 -
Unadjusted Quoted
Prices | | |
Level 2 -
Other Significant
Observable Inputs | | |
Level 3 -
Significant
Unobservable Inputs | | |
Total | |
| Common Stocks | |
$ | 106,607,213 | | |
$ | – | | |
$ | – | | |
$ | 106,607,213 | |
| Closed-End Funds | |
| 2,147,750 | | |
| – | | |
| – | | |
| 2,147,750 | |
| Exchange-Traded Funds | |
| 830,328 | | |
| – | | |
| – | | |
| 830,328 | |
| Preferred Stocks | |
| 1,052,497 | | |
| – | | |
| – | | |
| 1,052,497 | |
| Purchased Options | |
| 1,928,450 | | |
| – | | |
| – | | |
| 1,928,450 | |
| Corporate Bonds | |
| – | | |
| 12,705,946 | | |
| – | | |
| 12,705,946 | |
| Asset-Backed Securities | |
| – | | |
| 25,860 | | |
| – | | |
| 25,860 | |
| U.S. Treasury Obligations | |
| – | | |
| 682,481 | | |
| – | | |
| 682,481 | |
| Money Market Funds | |
| 754,218 | | |
| – | | |
| – | | |
| 754,218 | |
| Total | |
$ | 113,320,456 | | |
$ | 13,414,287 | | |
$ | – | | |
$ | 126,734,743 | |
| | |
| | |
| | |
| | |
| |
| Other Financial Instruments(b) | |
| | |
| | |
| | |
| |
| Assets | |
| | |
| | |
| | |
| |
| Total Return Swaps(c) | |
$ | – | | |
$ | 50,029 | | |
$ | – | | |
$ | 50,029 | |
| Liabilities | |
| | | |
| | | |
| | | |
| | |
| Securities Sold Short | |
| | | |
| | | |
| | | |
| | |
| Common Stocks | |
| (11,899,417 | ) | |
| – | | |
| – | | |
| (11,899,417 | ) |
| Exchange-Traded Funds | |
| (5,106,832 | ) | |
| – | | |
| – | | |
| (5,106,832 | ) |
| Written Options | |
| (917,950 | ) | |
| – | | |
| – | | |
| (917,950 | ) |
| Futures(c) | |
| (44,136 | ) | |
| – | | |
| – | | |
| (44,136 | ) |
| Total Return Swaps(c) | |
| – | | |
| (73,348 | ) | |
| – | | |
| (73,348 | ) |
| Total | |
$ | (17,968,335 | ) | |
$ | (23,319 | ) | |
$ | – | | |
$ | (17,991,654 | ) |
Clough Global Equity Fund
| Investments in Securities at Value | |
Level 1 -
Unadjusted Quoted
Prices | | |
Level 2 -
Other Significant
Observable Inputs | | |
Level 3 -
Significant
Unobservable Inputs |
| |
Total | |
| Common Stocks | |
| | |
| | |
|
| |
| |
| Communication Services | |
$ |
11,049,216 | | |
$ |
– | | |
$ |
– |
| |
$ |
11,049,216 | |
| Consumer Discretionary | |
17,606,563 | | |
– | | |
– |
| |
17,606,563 | |
| Consumer Staples | |
7,112,167 | | |
– | | |
– |
| |
7,112,167 | |
| Energy | |
7,632,078 | | |
– | | |
– |
| |
7,632,078 | |
| Financials | |
23,177,759 | | |
– | | |
– |
| |
23,177,759 | |
| Health Care | |
34,137,520 | | |
– | | |
414,782 |
| |
34,552,302 | |
| Industrials | |
26,014,207 | | |
– | | |
– |
| |
26,014,207 | |
| Information Technology | |
27,463,685 | | |
– | | |
– |
| |
27,463,685 | |
| Materials | |
3,447,831 | | |
– | | |
– |
| |
3,447,831 | |
| Real Estate | |
4,453,349 | | |
– | | |
– |
| |
4,453,349 | |
| Utilities | |
3,856,626 | | |
– | | |
– |
| |
3,856,626 | |
| Closed-End Funds | |
2,580,720 | | |
– | | |
– |
| |
2,580,720 | |
| Exchange-Traded Funds | |
1,426,485 | | |
– | | |
– |
| |
1,426,485 | |
| Preferred Stocks | |
– | | |
– | | |
359,616 |
| |
359,616 | |
| Warrants | |
806,426 | | |
– | | |
– |
| |
806,426 | |
| Purchased Options | |
3,001,625 | | |
– | | |
– |
| |
3,001,625 | |
| Corporate Bonds | |
– | | |
6,265,622 | | |
– |
| |
6,265,622 | |
| Convertible Corporate Bonds | |
– | | |
– | | |
32,625 |
| |
32,625 | |
| U.S. Treasury Obligations | |
– | | |
18,603,298 | | |
– |
| |
18,603,298 | |
| Money Market Funds | |
3,108,064 | | |
– | | |
– |
| |
3,108,064 | |
| Total | |
$ | 176,874,321 | | |
$ | 24,868,920 | | $ |
807,023 |
| |
$ | 202,550,264 | |
| | |
| | | |
| | | |
|
| |
| | |
| Other Financial Instruments(a) | |
| | | |
| | | |
|
| |
| | |
| Assets | |
| | | |
| | | |
|
| |
| | |
| Total Return Swaps(b) | |
$ | – | | |
$ | 76,383 | | $ |
– |
| |
$ | 76,383 | |
| Liabilities | |
| | | |
| | | |
|
| |
| | |
| Securities Sold Short | |
| | | |
| | | |
|
| |
| | |
| Common Stocks | |
| (23,981,397 | ) | |
| – | | |
– |
| |
| (23,981,397 | ) |
| Written Options | |
| (1,429,000 | ) | |
| – | | |
– |
| |
| (1,429,000 | ) |
| Futures(b) | |
| (80,884 | ) | |
| – | | |
– |
| |
| (80,884 | ) |
| Total Return Swaps(b) | |
| – | | |
| (132,419 | ) | |
– |
| |
| (132,419 | ) |
| Total | |
$ | (25,491,281 | ) | |
$ | (56,036 | ) | $ |
– |
| |
$ | (25,547,317 | ) |
Clough
Global Funds
NOTES
TO FINANCIAL STATEMENTS
April
30, 2023 (Continued) (Unaudited)
Clough
Global Opportunities Fund
| Investments in Securities at Value | |
Level 1 -
Unadjusted Quoted
Prices | | |
Level 2 -
Other Significant
Observable Inputs | | |
Level 3 -
Significant
Unobservable Inputs | | |
Total | |
| Common Stocks | |
| | | |
| | | |
| | | |
| | |
| Communication Services | |
$ | 17,534,145 | | |
$ | – | | |
$ | – | | |
$ | 17,534,145 | |
| Consumer Discretionary | |
| 31,796,842 | | |
| – | | |
| – | | |
| 31,796,842 | |
| Consumer Staples | |
| 13,008,664 | | |
| – | | |
| – | | |
| 13,008,664 | |
| Energy | |
| 13,916,831 | | |
| – | | |
| – | | |
| 13,916,831 | |
| Financials | |
| 40,916,676 | | |
| – | | |
| – | | |
| 40,916,676 | |
| Health Care | |
| 57,110,590 | | |
| – | | |
| 989,649 | | |
| 58,100,239 | |
| Industrials | |
| 48,040,357 | | |
| – | | |
| – | | |
| 48,040,357 | |
| Information Technology | |
| 49,518,739 | | |
| – | | |
| – | | |
| 49,518,739 | |
| Materials | |
| 6,310,398 | | |
| – | | |
| – | | |
| 6,310,398 | |
| Real Estate | |
| 8,139,864 | | |
| – | | |
| – | | |
| 8,139,864 | |
| Utilities | |
| 7,065,036 | | |
| – | | |
| – | | |
| 7,065,036 | |
| Closed-End Funds | |
| 4,735,908 | | |
| – | | |
| – | | |
| 4,735,908 | |
| Exchange-Traded Funds | |
| 340,686 | | |
| – | | |
| – | | |
| 340,686 | |
| Preferred Stocks | |
| – | | |
| – | | |
| 1,174,761 | | |
| 1,174,761 | |
| Warrants | |
| 1,494,920 | | |
| – | | |
| – | | |
| 1,494,920 | |
| Purchased Options | |
| 5,469,250 | | |
| – | | |
| – | | |
| 5,469,250 | |
| Corporate Bonds | |
| – | | |
| 28,414,390 | | |
| – | | |
| 28,414,390 | |
| Convertible Corporate Bonds | |
| – | | |
| – | | |
| 76,125 | | |
| 76,125 | |
| U.S. Treasury Obligations | |
| – | | |
| 26,421,970 | | |
| – | | |
| 26,421,970 | |
| Money Market Funds | |
| 6,692,999 | | |
| – | | |
| – | | |
| 6,692,999 | |
| Total | |
$ | 312,091,905 | | |
$ | 54,836,360 | | |
$ | 2,240,535 | | |
$ | 369,168,800 | |
| | |
| | | |
| | | |
| | | |
| | |
| Other
Financial Instruments(a) | |
| | | |
| | | |
| | | |
| | |
| Assets | |
| | | |
| | | |
| | | |
| | |
| Total Return Swaps(b) | |
$ | – | | |
$ | 140,066 | | |
$ | – | | |
$ | 140,066 | |
| Liabilities | |
| | | |
| | | |
| | | |
| | |
| Securities Sold Short | |
| | | |
| | | |
| | | |
| | |
| Common Stocks | |
| (43,942,112 | ) | |
| – | | |
| – | | |
| (43,942,112 | ) |
| Written Options | |
| (2,601,950 | ) | |
| – | | |
| – | | |
| (2,601,950 | ) |
| Futures(b) | |
| (147,001 | ) | |
| – | | |
| – | | |
| (147,001 | ) |
| Total Return Swaps(b) | |
| – | | |
| (244,240 | ) | |
| – | | |
| (244,240 | ) |
| Total | |
$ | (46,691,063 | ) | |
$ | (104,174 | ) | |
$ | – | | |
$ | (46,795,237 | ) |
| (a) | For
detailed descriptions and other security classifications, see the accompanying Schedules
of Investments. |
| (b) | Other
financial instruments are derivative instruments reflected in the Schedules of Investments. |
| (c) | Futures
contracts and swap contracts are reported at their unrealized appreciation/(depreciation)
at measurement date, which represents the change in the contract's value from trade date. |
In
the event an independent pricing service is unable to provide an evaluated price for a security or the Adviser believes the price
provided is not reliable, securities of each Fund may be valued at fair value as described above. In these instances the Adviser
may seek to find an alternative independent source, such as a broker/dealer to provide a price quote, or by using evaluated pricing
models similar to the techniques and models used by the independent pricing service. These fair value measurement techniques may
utilize unobservable inputs (Level 3).
The
following is a reconciliation of the investments in which significant unobservable inputs (Level 3) were used in determining fair
value:
Clough
Global Funds
NOTES
TO FINANCIAL STATEMENTS
April
30, 2023 (Continued) (Unaudited)
| Asset
Type | |
Balance
as of October
31, 2022 | | |
Accrued
Discount/
Premium | | |
Return
of
Capital | | |
Realized
Gain/(Loss) | | |
Change
in
Unrealized
Appreciation/
Depreciation | | |
Purchases | | |
Sales
Proceeds | | |
Transfer
Into
Level 3 | | |
Transfer
Out
of Level 3 | | |
Balance
as
of April 30,
2023 | | |
Net
change
in unrealized
appreciation/
(depreciation)
included in the
Statements
of Operations
attributable
to
Level 3
investments
held at April
30, 2023 | |
| Common Stocks | |
$ | 2,039,424 | | |
$ | – | | |
$ | – | | |
$ | – | | |
$ | (1,265,026 | ) | |
$ | – | | |
$ | – | | |
$ | – | | |
$ | (359,616 | ) | |
$ | 414,782 | | |
$ | (862,311 | ) |
| Preferred Stocks | |
| – | | |
| – | | |
| – | | |
| – | | |
| – | | |
| – | | |
| – | | |
| 359,616 | | |
| – | | |
| 359,616 | | |
| (402,716 | ) |
| Convertible Corporate Bonds | |
| 36,975 | | |
| – | | |
| – | | |
| – | | |
| (4,350 | ) | |
| – | | |
| – | | |
| – | | |
| – | | |
| 32,625 | | |
| (4,350 | ) |
| | |
$ | 2,076,399 | | |
$ | – | | |
$ | – | | |
$ | – | | |
$ | (1,269,376 | ) | |
$ | – | | |
$ | – | | |
$ | 359,616 | | |
$ | (359,615 | ) | |
$ | 807,023 | | |
$ | (1,269,377 | ) |
| | |
| | |
| | |
| | |
| | |
| | |
| | |
| | |
| | |
| | |
| | |
| |
| Asset
Type | |
Balance
as of October
31, 2022 | | |
Accrued
Discount/
Premium | | |
Return
of
Capital | | |
Realized
Gain/(Loss) | | |
Change
in
Unrealized
Appreciation/
Depreciation | | |
Purchases | | |
Sales
Proceeds | | |
Transfer
Into
Level 3 | | |
Transfer
Out
of Level 3 | | |
Balance
as
of April 30,
2023 | | |
Net
change
in unrealized
appreciation/
(depreciation)
included in the
Statements
of Operations
attributable
to
Level 3
investments
held at April
30, 2023 | |
| Common Stocks | |
$ | 5,516,468 | | |
$ | – | | |
$ | – | | |
$ | – | | |
$ | (3,352,058 | ) | |
$ | – | | |
$ | – | | |
$ | – | | |
$ | (1,174,761 | ) | |
$ | 989,649 | | |
$ | (2,036,500 | ) |
| Preferred Stocks | |
| – | | |
| – | | |
| – | | |
| – | | |
| – | | |
| – | | |
| – | | |
| 1,174,761 | | |
| – | | |
| 1,174,761 | | |
| (1,315,559 | ) |
| Convertible Corporate Bonds | |
| 86,275 | | |
| – | | |
| – | | |
| – | | |
| (10,150 | ) | |
| – | | |
| – | | |
| – | | |
| – | | |
| 76,125 | | |
| (10,150 | ) |
| | |
$ | 5,602,743 | | |
$ | – | | |
$ | – | | |
$ | – | | |
$ | (3,362,208 | ) | |
$ | – | | |
$ | – | | |
$ | 1,174,761 | | |
$ | (1,174,761 | ) | |
$ | 2,240,535 | | |
$ | (3,362,209 | ) |
The
Fund's policy for recording transfers out of level 3 is as of the end of the reporting period.
The
following is a summary of valuation techniques and quantitative information used in determining the fair value of each Fund’s
Level 3 investments at April 30, 2023:
| Fund | |
Sector | |
Fair Value | | |
Valuation Technique | |
Unobservable Input(a) | |
Premium/Discount |
| Clough Global Equity Fund | |
Health Care | |
$ | 807,023 | | |
Accomplishment & Goals and Index Performance Methods | |
Transaction Price | |
N/A |
| Clough Global Opportunities Fund | |
Health Care | |
$ | 2,240,535 | | |
Accomplishment & Goals and Index Performance Methods | |
Transaction Price | |
N/A |
| (a) | A
change to the unobservable input may result in a significant change to the value of the
investment as follows: |
| Unobservable
Input |
Impact
to Value if Input Increases |
Impact
to Value if Input Decreases |
| Transaction Price |
Increase |
Decrease |
Foreign
Securities – Each Fund may invest a portion of its assets in foreign securities. In the event that a Fund executes a
foreign security transaction, the Fund will generally enter into a foreign currency spot contract to settle the foreign security
transaction. Foreign securities may carry more risk than U.S. securities, such as political, market and currency risks.
Clough
Global Funds
NOTES TO FINANCIAL STATEMENTS
April 30, 2023 (Continued) (Unaudited)
The
accounting records of each Fund are maintained in U.S. dollars. Prices of securities denominated in foreign currencies are translated
into U.S. dollars at the closing rates of exchange at period end. Amounts related to the purchase and sale of foreign securities
and investment income are translated at the rates of exchange prevailing on the respective dates of such transactions. Although
the net assets and the values are presented at the foreign exchange rates at market close, the Funds do not isolate the portion
of the results of operations resulting from changes in foreign exchange rates on investments from the fluctuations arising from
changes in prices of securities held.
The
effect of changes in foreign currency exchange rates on investments is reported with investment securities realized and unrealized
gains and losses in the Funds’ Statements of Operations.
A
foreign currency spot contract is a commitment to purchase or sell a foreign currency at a future date, at a negotiated rate.
Each Fund may enter into foreign currency spot contracts to settle specific purchases or sales of securities denominated in a
foreign currency and for protection from adverse exchange rate fluctuation. Risks to a Fund include the potential inability of
the counterparty to meet the terms of the contract.
The
net U.S. dollar value of foreign currency underlying all contractual commitments held by a Fund and the resulting unrealized appreciation
or depreciation are determined using prevailing forward foreign currency exchange rates. Unrealized appreciation and depreciation
on foreign currency spot contracts are reported in the Funds’ Statements of Assets and Liabilities as a receivable for investments
sold or a payable for investments purchased and in the Funds’ Statements of Operations with the change in unrealized appreciation
or depreciation on translation of assets and liabilities denominated in foreign currencies. These spot contracts are used by the
broker to settle investments denominated in foreign currencies.
A
Fund may realize a gain or loss upon the closing or settlement of the foreign transactions. Such realized gains and losses are
reported with all other foreign currency gains and losses in the Statements of Operations.
Exchange
Traded Funds – Each Fund may invest in Exchange Traded Funds (“ETFs”), which are funds whose shares are
traded on a national exchange. ETFs may be based on underlying equity or fixed income securities, as well as commodities or currencies.
ETFs do not sell individual shares directly to investors and only issue their shares in large blocks known as “creation
units.” The investor purchasing a creation unit then sells the individual shares on a secondary market. Although similar
diversification benefits may be achieved through an investment in another investment company, ETFs generally offer greater liquidity
and lower expenses. Because an ETF incurs its own fees and expenses, shareholders of a Fund investing in an ETF will indirectly
bear those costs. Such Funds will also incur brokerage commissions and related charges when purchasing or selling shares of an
ETF. Unlike typical investment company shares, which are valued once daily, shares in an ETF may be purchased or sold on a securities
exchange throughout the trading day at market prices that are generally close to the NAV of the ETF.
Short
Sales – Each Fund may sell a security it does not own in anticipation of a decline in the fair value of that security.
When a Fund sells a security short, it must borrow the security sold short and deliver it to the broker-dealer through which it
made the short sale. A gain, limited to the price at which a Fund sold the security short, or a loss, unlimited in size, will
be recognized upon the termination of the short sale.
Each
Fund's obligation to replace the borrowed security will be secured by collateral deposited with the broker-dealer, usually cash,
U.S. government securities or other liquid securities. Each Fund will also be required to designate on its books and records similar
collateral with its custodian to the extent, if any, necessary so that the aggregate collateral value is at all times at least
equal to the current value of the security sold short. The cash amount is reported on the Statements of Assets and Liabilities
as Deposit with broker for securities sold short which is held with one counterparty. Each Fund is obligated to pay interest to
the broker for any debit balance of the margin account relating to short sales. The interest incurred by the Funds is reported
on the Statements of Operations as Interest expense – margin account. Interest amounts payable, if any, are reported
on the Statements of Assets and Liabilities as Interest payable – margin account.
Each
Fund may also sell a security short if it owns at least an equal amount of the security sold short or another security convertible
or exchangeable for an equal amount of the security sold short without payment of further compensation (a short sale against-the-box).
In a short sale against-the-box, the short seller is exposed to the risk of being forced to deliver stock that it holds to close
the position if the borrowed stock is called in by the lender, which would cause gain or loss to be recognized on the delivered
stock. Each Fund expects normally to close its short sales against-the-box by delivering newly acquired stock. Since the Funds
intend to hold securities sold short for the short term, these securities are excluded from the purchases and sales of investment
securities in Note 4 and each Fund’s Portfolio Turnover in the Financial Highlights.
Derivatives
Instruments and Hedging Activities – The following discloses the Funds’ use of derivative instruments and hedging
activities.
The
Funds’ investment objectives not only permit the Funds to purchase investment securities, they also allow the Funds to enter
into various types of derivative contracts, including, but not limited to, purchased and written options, swaps, futures and warrants.
In doing so, the Funds will employ strategies in differing combinations to permit them to increase, decrease, or change the level
or types of exposure to market factors. Central to those strategies are features inherent to derivatives that make them more attractive
for this purpose than equity securities; they require little or no initial cash investment, they can focus exposure on only certain
selected risk factors, and they may not require the ultimate receipt or delivery of the underlying security (or securities) to
the contract. This may allow the Funds to pursue their objectives more quickly and efficiently than if they were to make direct
purchases or sales of securities capable of affecting a similar response to market factors.
Risk
of Investing in Derivatives - The Funds’ use of derivatives can result in losses due to unanticipated changes in the market
risk factors and the overall market. In instances where the Funds are using derivatives to decrease or hedge exposures to market
risk factors for securities held by the Funds, there are also risks that those derivatives may not perform as expected, resulting
in losses for the combined or hedged positions.
Derivatives
may have little or no initial cash investment relative to their market value exposure and therefore can produce significant gains
or losses in excess of their cost. This use of embedded leverage allows the Funds to increase their market value exposure relative
to their net assets and can substantially increase the volatility of the Funds’ performance.
Additional
associated risks from investing in derivatives also exist and potentially could have significant effects on the valuation of the
derivative and the Funds. Typically, the associated risks are not the risks that the Funds are attempting to increase or decrease
exposure to, per their investment objectives, but are the additional risks from investing in derivatives.
Clough
Global Funds
NOTES TO FINANCIAL STATEMENTS
April 30, 2023 (Continued) (Unaudited)
Examples
of these associated risks are liquidity risk, which is the risk that the Funds will not be able to sell the derivative in the
open market in a timely manner, and counterparty credit risk, which is the risk that the counterparty will not fulfill its obligation
to the Funds. Associated risks can be different for each type of derivative and are discussed by each derivative type in the notes
that follow.
Each
Fund may acquire put and call options and options on stock indices and enter into stock index futures contracts, certain credit
derivatives transactions and short sales in connection with its equity investments. In connection with a Fund's investments in
debt securities, it may enter into related derivatives transactions such as interest rate futures, swaps and options thereon and
certain credit derivatives transactions. Derivatives transactions of the types described above subject a Fund to increased risk
of principal loss due to imperfect correlation or unexpected price or interest rate movements. Each Fund also will be subject
to credit risk with respect to the counterparties to the derivatives contracts purchased by a Fund. If a counterparty becomes
bankrupt or otherwise fails to perform its obligations under a derivatives contract due to financial difficulties, each Fund may
experience significant delays in obtaining any recovery under the derivatives contract in a bankruptcy or other reorganization
proceeding. Each Fund may obtain only a limited recovery or may obtain no recovery in such circumstances.
Market
Risk Factors – In addition, in pursuit of their investment objectives, certain Funds may seek to use derivatives, which
may increase or decrease exposure to the following market risk factors:
Equity
Risk: Equity risk relates to the change in value of equity securities as they relate to increases or decreases in the general
market.
Foreign
Exchange Rate Risk: Foreign exchange rate risk relates to the change in the U.S. dollar value of a security held that is denominated
in a foreign currency. The value of a foreign currency denominated security will decrease as the dollar appreciates against the
currency, while the value of the foreign currency denominated security will increase as the dollar depreciates against the currency.
Option
Writing/Purchasing - Each Fund may purchase or write (sell) put and call options. One of the risks associated with purchasing
an option among others, is that a Fund pays a premium whether or not the option is exercised. Additionally, a Fund bears the risk
of loss of premium and change in value should the counterparty not perform under the contract. The cost of securities acquired
through the exercise of call options is increased by premiums paid. The proceeds from securities sold through the exercise of
put options are decreased by the premiums paid. Each Fund is obligated to pay interest to the broker for any debit balance of
the margin account relating to options. Each Fund pledges cash or liquid assets as collateral to satisfy the current obligations
with respect to written options. The interest incurred, if any, on the Funds is reported on the Statements of Operations as Interest
expense – margin account. Interest amounts payable by the Funds, if any, are reported on the Statements of Assets and Liabilities
as Interest payable – margin account.
When
a Fund writes an option, an amount equal to the premium received by a Fund is recorded as a liability and is subsequently adjusted
to the current value of the option written. Premiums received from writing options that expire unexercised are treated by a Fund
on the expiration date as realized gains. The difference between the premium received and the amount paid on effecting a closing
purchase transaction, including brokerage commissions, is recorded as a realized gain or loss. If a call option is exercised,
the premium is added to the proceeds from the sale of the underlying security or currency in determining whether a Fund has realized
a gain or loss. If a put option is exercised, the premium reduces the cost basis of the securities purchased by a Fund. Each Fund,
as writer of an option, bears the market risk of an unfavorable change in the price of the security underlying the written option.
The Funds engaged in purchased and written options during the period ended April 30, 2023.
Futures
Contracts: Each Fund may enter into futures contracts. A futures contract is an agreement to buy or sell a security or currency
(or to deliver a final cash settlement price in the case of a contract relating to an index or otherwise not calling for physical
delivery at the end of trading in the contract) for a set price at a future date. If a Fund buys a security futures contract,
the Fund enters into a contract to purchase the underlying security and is said to be "long" under the contract. If
a Fund sells a security futures contact, the Fund enters into a contract to sell the underlying security and is said to be "short"
under the contract. The price at which the contract trades (the "contract price") is determined by relative buying and
selling interest on a regulated exchange. Futures contracts are marked to market daily and an appropriate payable or receivable
for the change in value (“variation margin”) is recorded by the Fund. Such payables or receivables, if any, are recorded
for financial statement purposes as variation margin payable or variation margin receivable by each Fund. Each Fund pledges cash
or liquid assets as collateral to satisfy the current obligations with respect to futures contracts. The cash amount, if any,
is reported on the Statements of Assets and Liabilities as Deposit with broker for futures contracts which is held with one counterparty.
Management has reviewed the futures agreement under which the futures contracts are traded and has determined that the Funds do
not have the right to set-off, and therefore the futures contracts are not subject to enforceable netting arrangements.
The
Funds enter into such transactions for hedging and other appropriate risk-management purposes or to increase return. While a Fund
may enter into futures contracts for hedging purposes, the use of futures contracts might result in a poorer overall performance
for the Fund than if it had not engaged in any such transactions. If, for example, the Fund had insufficient cash, it might have
to sell a portion of its underlying portfolio of securities in order to meet daily variation margin requirements on its futures
contracts or options on futures contracts at a time when it might be disadvantageous to do so. There may be an imperfect correlation
between the Funds’ portfolio holdings and futures contracts entered into by the Fund, which may prevent the Fund from achieving
the intended hedge or expose the Fund to risk of loss.
Futures
contract transactions may result in losses substantially in excess of the variation margin. There can be no guarantee that there
will be a correlation between price movements in the hedging vehicle and in the portfolio securities being hedged. An incorrect
correlation could result in a loss on both the hedged securities in a Fund and the hedging vehicle so that the portfolio return
might have been greater had hedging not been attempted. There can be no assurance that a liquid market will exist at a time when
the Fund seeks to close out a futures contract. Lack of a liquid market for any reason may prevent a Fund from liquidating an
unfavorable position, and the Fund would remain obligated to meet margin requirements until the position is closed. In addition,
the Fund could be exposed to risk if the counterparties to the contracts are unable to meet the terms of their contracts. With
exchange-traded-futures contracts, there is minimal counterparty credit risk to the Funds since futures contracts are exchange-traded
and the exchange’s clearinghouse, as counterparty to all exchange-traded futures contracts, guarantees the futures contracts
against default. The Funds engaged in futures contracts during the period ended April 30, 2023.
Swaps:
A swap is an agreement that obligates two parties to exchange a series of cash flows at specified intervals based upon or calculated
by reference to changes in specified prices or rates for a specified amount of an underlying asset. Each Fund may utilize swap
agreements as a means to gain exposure to certain assets and/or to “hedge” or protect the Fund from adverse movements
in securities prices or interest rates. Each Fund is subject to equity risk and interest rate risk in the normal course of pursuing
its investment objective through investments in swap contracts. Swap agreements entail the risk that a party will default on its
payment obligation to a Fund. If the other party to a swap defaults, a Fund would risk the loss of the net amount of the payments
that it contractually is entitled to receive. If each Fund utilizes a swap at the wrong time or judges market conditions incorrectly,
the swap may result in a loss to the Fund and reduce the Fund’s total return.
Clough
Global Funds
NOTES TO FINANCIAL STATEMENTS
April 30, 2023 (Continued) (Unaudited)
Total
return swaps involve an exchange by two parties in which one party makes payments based on a set rate, either fixed or variable,
while the other party makes payments based on the return of an underlying asset, which includes both the income it generates and
any capital gains over the payment period. A Fund’s maximum risk of loss from counterparty risk or credit risk is the discounted
value of the payments to be received from/paid to the counterparty over the contract’s remaining life, to the extent that
the amount is positive. The risk is mitigated by having a netting arrangement between a Fund and the counterparty and by the posting
of collateral to a Fund to cover the Fund’s exposure to the counterparty. Each Fund pledges cash or liquid assets as collateral
to satisfy the current obligations with respect to swap contracts. The cash amount is reported on the Statements of Assets and
Liabilities as Deposit with broker for total return swap contracts which is held with one counterparty.
International
Swaps and Derivatives Association, Inc. Master Agreements (“ISDA Master Agreements”) govern OTC financial derivative
transactions entered into by a Fund and those counterparties. The ISDA Master Agreements maintain provisions for general obligations,
representations, agreements, collateral and events of default or termination. Events of termination include conditions that may
entitle counterparties to elect to terminate early and cause settlement of all outstanding transactions under the applicable ISDA
Master Agreement. Any election to early terminate could be material to the financial statements. During the period April 30, 2023,
the Funds invested in swap agreements consistent with the Funds’ investment strategies to gain exposure to certain markets
or indices.
Warrants/Rights:
Each Fund may purchase or otherwise receive warrants or rights. Warrants and rights generally give the holder the right to receive,
upon exercise, a security of the issuer at a set price. Funds typically use warrants and rights in a manner similar to their use
of purchased options on securities, as described in options above. Risks associated with the use of warrants and rights are generally
similar to risks associated with the use of purchased options. However, warrants and rights often do not have standardized terms,
and may have longer maturities and may be less liquid than exchange-traded options. In addition, the terms of warrants or rights
may limit each Fund’s ability to exercise the warrants or rights at such times and in such quantities as each Fund would
otherwise wish. As of and during the period ended April 30, 2023, Clough Global Equity Fund and Clough Global Opportunities Fund
held warrants, and Clough Global Dividend and Income Fund did not hold warrants. Each Fund held no rights.
The
effect of derivatives instruments on each Fund’s Statement of Assets and Liabilities as of April 30, 2023:
| Clough Global Dividend and Income Fund Risk Exposure | |
Statements of Assets and Liabilities Location | |
Fair Value | |
| Asset Derivatives | |
| |
| | |
| Equity Contracts (Purchased Options) | |
Investments, at value | |
$ | 308,450 | |
| Equity Contracts (Total Return Swaps) | |
Unrealized appreciation on total return swap contracts | |
| 50,029 | |
| Interest Rate Contracts (Purchased Options) | |
Investments, at value | |
| 1,620,000 | |
| Total | |
| |
$ | 1,978,479 | |
| Liability Derivatives | |
| |
| | |
| Equity Contracts (Written Options) | |
Written Options, at value | |
$ | (137,950 | ) |
| Equity Contracts (Total Return Swaps) | |
Unrealized depreciation on total return swap contracts | |
| (73,347 | ) |
| Interest Rate Contracts (Futures) | |
Unrealized depreciation on futures contracts | |
| (44,136 | )(a) |
| Interest Rate Contracts (Written Options) | |
Written Options, at value | |
| (780,000 | ) |
| Total | |
| |
$ | (1,035,433 | ) |
| Clough Global Equity Fund Risk Exposure | |
Statements of Assets and Liabilities Location | |
Fair Value | |
| Asset Derivatives | |
| |
| | |
| Equity Contracts (Warrants) | |
Investments, at value | |
$ | 806,426 | |
| Equity Contracts (Purchased Options) | |
Investments, at value | |
| 470,375 | |
| Equity Contracts (Total Return Swaps) | |
Unrealized appreciation on total return swap contracts | |
| 76,383 | |
| Interest Rate Contracts (Purchased Options) | |
Investments, at value | |
| 2,531,250 | |
| Total | |
| |
$ | 3,884,434 | |
| Liability Derivatives | |
| |
| | |
| Equity Contracts (Written Options) | |
Written Options, at value | |
$ | (210,250 | ) |
| Equity Contracts (Total Return Swaps) | |
Unrealized depreciation on total return swap contracts | |
| (132,419 | ) |
| Interest Rate Contracts (Futures) | |
Unrealized depreciation on futures contracts | |
| (80,884 | )(a) |
| Interest Rate Contracts (Written Options) | |
Written Options, at value | |
| (1,218,750 | ) |
| Total | |
| |
$ | (1,642,303 | ) |
Clough
Global Funds
NOTES TO FINANCIAL STATEMENTS
April 30, 2023 (Continued) (Unaudited)
Clough Global Opportunities Fund
Risk Exposure | |
Statements of Assets and Liabilities Location | |
Fair Value | |
| Asset Derivatives | |
| |
| | |
| Equity Contracts (Warrants) | |
Investments, at value | |
$ | 1,494,920 | |
| Equity Contracts (Purchased Options) | |
Investments, at value | |
| 913,000 | |
| Equity Contracts (Total Return Swaps) | |
Unrealized appreciation on total return swap contracts | |
| 140,066 | |
| Interest Rate Contracts (Purchased Options) | |
Investments, at value | |
| 4,556,250 | |
| Total | |
| |
$ | 7,104,236 | |
| Liability Derivatives | |
| |
| | |
| Equity Contracts (Written Options) | |
Written Options, at value | |
$ | (408,200 | ) |
| Equity Contracts (Total Return Swaps) | |
Unrealized depreciation on total return swap contracts | |
| (244,240 | ) |
| Interest Rate Contracts (Futures) | |
Unrealized depreciation on futures contracts | |
| (147,001 | )(a) |
| Interest Rate Contracts (Written Options) | |
Written Options, at value | |
| (2,193,750 | ) |
| Total | |
| |
$ | (2,993,191 | ) |
| (a) | Includes
cumulative appreciation/(depreciation) of futures contracts as reported in the Statements of Investments. Only the current day's
net variation margin is reported within the Statements of Assets and Liabilities. |
The
effect of derivatives instruments on each Fund's Statement of Operations for the period ended April 30, 2023:
| Clough Global Dividend and Income Fund | |
| |
| | |
| |
| | |
| |
| | |
| |
Risk
Exposure | |
Statement
of Operations Location | |
Realized
Gain/ (Loss) on Derivatives | | |
Change
in Unrealized Appreciation/ (Depreciation) on Derivatives | |
| Equity Contracts (Written Options) | |
Net realized gain/(loss) on written options/Net change in unrealized appreciation/(depreciation) on written options | |
$ | 2,433,877 | | |
$ | (167,000 | ) |
| Equity Contracts (Purchased Options) | |
Net realized gain/(loss) on investment securities/Net change in unrealized appreciation/(depreciation) on investment securities | |
$ | (4,356,268 | ) | |
$ | (151,719 | ) |
| Equity Contracts (Total Return Swaps) | |
Net realized gain/(loss) on total return swap contracts/Net change in unrealized appreciation/(depreciation) on total return swap contracts | |
$ | (82,804 | ) | |
$ | 25,685 | |
| Equity Contracts (Futures) | |
Net realized gain/(loss) on futures contracts/Net change in unrealized appreciation/(depreciation) on futures contracts | |
$ | (129,363 | ) | |
$ | – | |
| Foreign Currency Contracts (Futures) | |
Net realized gain/(loss) on futures contracts/Net change in unrealized appreciation/(depreciation) on futures contracts | |
$ | (184,576 | ) | |
$ | 432,310 | |
| Interest Rate Contracts (Futures) | |
Net realized gain/(loss) on futures contracts/Net change in unrealized appreciation/(depreciation) on futures contracts | |
$ | (144,172 | ) | |
$ | (44,136 | ) |
| Interest Rate Contracts (Purchased Options) | |
Net realized gain/(loss) on investment securities/Net change in unrealized appreciation/(depreciation) on investment securities | |
$ | – | | |
$ | 268,268 | |
| Interest Rate Contracts (Written Options) | |
Net realized gain/(loss) on written options/Net change in unrealized appreciation/(depreciation) on written options | |
$ | – | | |
$ | (263,514 | ) |
| Total | |
| |
$ | (2,463,306 | ) | |
$ | 99,894 | |
Clough
Global Funds
NOTES TO FINANCIAL STATEMENTS
April 30, 2023 (Continued) (Unaudited)
| Clough Global Equity Fund |
| | |
| |
| | |
| |
Risk
Exposure | |
Statement
of Operations Location | |
Realized
Gain/ (Loss) on Derivatives | | |
Change
in Unrealized Appreciation/ (Depreciation) on Derivatives | |
| Equity Contracts (Written Options) | |
Net realized gain/(loss) on written options/Net change in unrealized appreciation/(depreciation) on written options | |
$ | 4,038,601 | | |
$ | (446,542 | ) |
| Equity Contracts (Warrants) | |
Net realized gain/(loss) on investment securities/Net change in unrealized appreciation/(depreciation) on investment securities | |
$ | – | | |
$ | (569,314 | ) |
| Equity Contracts (Purchased Options) | |
Net realized gain/(loss) on investment securities/Net change in unrealized appreciation/(depreciation) on investment securities | |
$ | (7,068,088 | ) | |
$ | (62,608 | ) |
| Equity Contracts (Total Return Swaps) | |
Net realized gain/(loss) on total return swap contracts/Net change in unrealized appreciation/(depreciation) on total return swap contracts | |
$ | (114,598 | ) | |
$ | 32,319 | |
| Equity Contracts (Futures) | |
Net realized gain/(loss) on futures contracts/Net change in unrealized appreciation/(depreciation) on futures contracts | |
$ | (190,119 | ) | |
$ | – | |
| Foreign Currency Contracts (Futures) | |
Net realized gain/(loss) on futures contracts/Net change in unrealized appreciation/(depreciation) on futures contracts | |
$ | (354,432 | ) | |
$ | 823,794 | |
| Interest Rate Contracts (Futures) | |
Net realized gain/(loss) on futures contracts/Net change in unrealized appreciation/(depreciation) on futures contracts | |
$ | (294,661 | ) | |
$ | (80,884 | ) |
| Interest Rate Contracts (Purchased Options) | |
Net realized gain/(loss) on investment securities/Net change in unrealized appreciation/(depreciation) on investment securities | |
$ | – | | |
$ | 419,176 | |
| Interest Rate Contracts (Written Options) | |
Net realized gain/(loss) on written options/Net change in unrealized appreciation/(depreciation) on written options | |
$ | – | | |
$ | (411,750 | ) |
| Total | |
| |
$ | (3,983,297 | ) | |
$ | (295,809 | ) |
Clough
Global Funds
NOTES TO FINANCIAL STATEMENTS
April 30, 2023 (Continued) (Unaudited)
| Clough Global Opportunities Fund |
| | |
| |
| | |
| |
Risk Exposure | |
Statement
of Operations Location | |
Realized
Gain/ (Loss) on Derivatives | | |
Change
in Unrealized Appreciation/ (Depreciation) on Derivatives | |
| Equity Contracts (Written Options) | |
Net realized gain/(loss) on written options/Net change in unrealized appreciation/(depreciation) on written options | |
$ | 7,441,248 | | |
$ | (769,952 | ) |
| Equity Contracts (Warrants) | |
Net realized gain/(loss) on investment securities/Net change in unrealized appreciation/(depreciation) on investment securities | |
$ | – | | |
$ | (1,054,886 | ) |
| Equity Contracts (Purchased Options) | |
Net realized gain/(loss) on investment securities/Net change in unrealized appreciation/(depreciation) on investment securities | |
$ | (12,986,483 | ) | |
$ | (233,770 | ) |
| Equity Contracts (Total Return Swaps) | |
Net realized gain/(loss) on total return swap contracts/Net change in unrealized appreciation/(depreciation) on total return swap contracts | |
$ | (212,063 | ) | |
$ | 59,083 | |
| Equity Contracts (Futures) | |
Net realized gain/(loss) on futures contracts/Net change in unrealized appreciation/(depreciation) on futures contracts | |
$ | (350,204 | ) | |
$ | – | |
| Foreign Currency Contracts (Futures) | |
Net realized gain/(loss) on futures contracts/Net change in unrealized appreciation/(depreciation) on futures contracts | |
$ | (642,349 | ) | |
$ | 1,497,784 | |
| Interest Rate Contracts (Futures) | |
Net realized gain/(loss) on futures contracts/Net change in unrealized appreciation/(depreciation) on futures contracts | |
$ | (535,504 | ) | |
$ | (147,001 | ) |
| Interest Rate Contracts (Purchased Options) | |
Net realized gain/(loss) on investment securities/Net change in unrealized appreciation/(depreciation) on investment securities | |
$ | – | | |
$ | 754,464 | |
| Interest Rate Contracts (Written Options) | |
Net realized gain/(loss) on written options/Net change in unrealized appreciation/(depreciation) on written options | |
$ | – | | |
$ | (741,130 | ) |
| Total | |
| |
$ | 7,285,355 | | |
$ | 635,408 | |
The
average total return swap contracts notional amount during the period ended April 30, 2023, is noted below for each of the Funds.
| Fund | |
Average Total Return Swap Contracts Notional Amount | |
| Clough Global Dividend and Income Fund | |
$ | 440,215 | |
| Clough Global Equity Fund | |
| 488,564 | |
| Clough Global Opportunities Fund | |
| 596,644 | |
The
average monthly notional value of options contracts outstanding during the period ended April 30, 2023, is noted below for each
of the Funds.
Fund | |
Average
Purchased Option Contract Notional
Amount | | |
Average
Written Option Contract Notional
Amount | |
| Clough Global Dividend and Income Fund | |
$ | 761,978,869 | | |
$ | 759,135,789 | |
| Clough Global Equity Fund | |
| 1,122,830,724 | | |
| 1,121,283,754 | |
| Clough Global Opportunities Fund | |
| 2,027,827,729 | | |
| 2,024,984,649 | |
The
average monthly notional value of futures contracts outstanding during the period ended April 30, 2023, is noted below for each
of the Funds.
| Fund | |
Average Futures Contracts Notional Amount | |
| Clough Global Dividend and Income Fund | |
$ | 49,889,994 | |
| Clough Global Equity Fund | |
| 55,341,923 | |
| Clough Global Opportunities Fund | |
| 64,934,815 | |
Clough
Global Funds
NOTES TO FINANCIAL STATEMENTS
April 30, 2023 (Continued) (Unaudited)
The
average notional amount of warrants during the period ended April 30, 2023, is noted below for each of the Funds.
| Fund | |
Average Warrants Notional Amount | |
| Clough Global Equity Fund | |
$ | 772,896 | |
| Clough Global Opportunities Fund | |
| 1,432,764 | |
Certain
derivative contracts are executed under either standardized netting agreements or, for exchange-traded derivatives, the relevant
contracts for a particular exchange which contain enforceable netting provisions. A derivative netting arrangement creates an
enforceable right of set-off that becomes effective, and affects the realization of settlement on individual assets, liabilities
and collateral amounts, only following a specified event of default or early termination. Default events may include the failure
to make payments or deliver securities timely, material adverse changes in financial condition or insolvency, the breach of minimum
regulatory capital requirements, or loss of license, charter or other legal authorization necessary to perform under the contract.
| Offsetting of Derivatives Assets |
| |
| | |
| | |
| | |
| | |
| | |
Gross
Amounts Not Offset in the Statements of Assets and Liabilities | | |
| |
| | |
Gross
Amounts of Recognized Liabilities | | |
Gross
Amounts Offset in the Statements of
Assets and Liabilities | | |
Net Amounts Presented in the Statements of Assets and Liabilities | | |
Financial
Instruments(a) | | |
Cash
Collateral Pledged(a) | | |
Net
Amount | |
| Clough Global Dividend and Income Fund |
| Total Return Swap Contracts | |
$ | 50,029 | | |
$ | – | | |
$ | 50,029 | | |
$ | (50,029 | ) | |
$ | – | | |
$ | – | |
| Clough Global Equity Fund |
| Total Return Swap Contracts | |
$ | 76,383 | | |
$ | – | | |
$ | 76,383 | | |
$ | (76,383 | ) | |
$ | – | | |
$ | – | |
| Clough Global Opportunities Fund |
| Total Return Swap Contracts | |
$ | 140,066 | | |
$ | – | | |
$ | 140,066 | | |
$ | (140,066 | ) | |
$ | – | | |
$ | – | |
| Offsetting of Derivatives Liabilities |
| |
| | |
| | |
| | |
| | |
| | |
Gross
Amounts Not Offset in the Statements of Assets and Liabilities | | |
| |
| | |
Gross
Amounts of Recognized Liabilities | | |
Gross
Amounts Offset in the Statements of
Assets and Liabilities | | |
Net Amounts Presented in the Statements of Assets and Liabilities | | |
Financial
Instruments(a) | | |
Cash
Collateral Pledged(a) | | |
Net
Amount | |
| Clough Global Dividend and Income Fund |
| Total Return Swap Contracts | |
$ | 73,348 | | |
$ | – | | |
$ | 73,348 | | |
$ | (50,029 | ) | |
$ | – | | |
$ | 23,319 | |
| Clough Global Equity Fund |
| Total Return Swap Contracts | |
$ | 132,419 | | |
$ | – | | |
$ | 132,419 | | |
$ | (76,383 | ) | |
$ | – | | |
$ | 56,036 | |
| Clough Global Opportunities Fund |
| Total Return Swap Contracts | |
$ | 244,240 | | |
$ | – | | |
$ | 244,240 | | |
$ | (140,066 | ) | |
$ | – | | |
$ | 104,174 | |
| (a) | These
amounts are limited to the derivative asset/liability balance and, accordingly, do not include excess collateral received/pledged,
which is disclosed in the Statements of Investments. |
Clough
Global Funds
NOTES TO FINANCIAL STATEMENTS
April 30, 2023 (Continued) (Unaudited)
Restricted
Securities: Although the Funds will invest primarily in publicly traded securities, they may invest a portion of their assets
(up to 10% of its value) in restricted securities. Restricted securities are securities that may not be sold to the public without
an effective registration statement under the Securities Act of 1933, as amended (the "Securities Act") or, if they
are unregistered, may be sold only in a privately negotiated transaction or pursuant to an exemption from registration.
Restricted
securities as of April 30, 2023, were as follows.
| Clough Global Dividend and Income Fund | |
| | |
| |
| | |
| | |
| |
| Security | |
% of Net Assets | | |
Acquisition
Date | |
Principal
Amount | | |
Cost | | |
Value | |
| Avis Budget Car Rental, LLC | |
| 0.48 | % | |
3/2/2023 | |
$ | 450,000 | | |
$ | 428,732 | | |
$ | 422,144 | |
| Carnival Corp. | |
| 1.01 | | |
1/31/2023 | |
| 970,000 | | |
| 884,125 | | |
| 888,006 | |
| Melco Resorts Finance Ltd. | |
| 0.25 | | |
9/21/2020 | |
| 250,000 | | |
| 257,504 | | |
| 218,125 | |
| NGL Energy Operating LLC | |
| 0.48 | | |
3/2/2023 | |
| 440,000 | | |
| 424,275 | | |
| 422,310 | |
| Pilgrim's Pride Corp. | |
| 0.48 | | |
3/2/2023 | |
| 430,000 | | |
| 423,566 | | |
| 428,351 | |
| Transocean, Inc. | |
| 0.94 | | |
1/25/2023 | |
| 900,000 | | |
| 840,501 | | |
| 831,321 | |
| TOTAL | |
| 3.64 | % | |
| |
$ | 3,440,000 | | |
$ | 3,258,703 | | |
$ | 3,210,257 | |
| Clough Global Equity Fund | |
| | |
| |
| | |
| | |
| |
| Security | |
% of Net Assets | | |
Acquisition
Date | |
Principal
Amount | | |
Cost | | |
Value | |
| Amphivena Convertible Note PP | |
| 0.02 | % | |
8/27/2021 | |
$ | 108,750 | | |
$ | 108,750 | | |
$ | 32,625 | |
| Amphivena Therapeutics, Inc. Series C | |
| 0.28 | | |
4/8/2019 | |
| 334,425 | | |
| 1,199,997 | | |
| 391,411 | |
| Carnival Corp. | |
| 0.99 | | |
1/31/2023 | |
| 1,500,000 | | |
| 1,372,230 | | |
| 1,373,206 | |
| Centrexion Therapeutics Corp. | |
| 0.02 | | |
3/19/2019 | |
| 4,336 | | |
| 48,741 | | |
| 23,371 | |
| Centrexion Therapeutics Corp. Series D Preferred | |
| 0.26 | | |
12/18/2017 | |
| 66,719 | | |
| 701,250 | | |
| 359,616 | |
| Transocean, Inc. | |
| 0.97 | | |
1/25/2023 | |
| 1,450,000 | | |
| 1,354,284 | | |
| 1,339,350 | |
| TOTAL | |
| 2.54 | % | |
| |
$ | 3,464,230 | | |
$ | 4,785,252 | | |
$ | 3,519,579 | |
| Clough Global Opportunities Fund | |
| | |
| |
| | |
| | |
| |
| Security | |
% of Net Assets | | |
Acquisition
Date | |
Principal
Amount | | |
Cost | | |
Value | |
| Air Canada 2013-1 Class A Pass Through Trust | |
| 1.49 | % | |
5/3/2022 | |
$ | 3,995,257 | | |
$ | 3,898,645 | | |
$ | 3,776,347 | |
| Amphivena Convertible Note PP | |
| 0.03 | | |
8/27/2021 | |
| 253,750 | | |
| 253,750 | | |
| 76,125 | |
| Amphivena Therapeutics, Inc. Series C | |
| 0.36 | | |
4/8/2019 | |
| 780,326 | | |
| 2,799,997 | | |
| 913,294 | |
| Avis Budget Car Rental, LLC | |
| 0.47 | | |
3/2/2023 | |
| 1,280,000 | | |
| 1,219,505 | | |
| 1,200,766 | |
| Carnival Corp. | |
| 1.01 | | |
1/31/2023 | |
| 2,800,000 | | |
| 2,552,103 | | |
| 2,563,317 | |
| Centrexion Therapeutics Corp. | |
| 0.03 | | |
3/19/2019 | |
| 14,166 | | |
| 159,240 | | |
| 76,355 | |
| Centrexion Therapeutics Corp. Series D Preferred | |
| 0.46 | | |
12/18/2017 | |
| 217,952 | | |
| 2,290,759 | | |
| 1,174,761 | |
| NGL Energy Operating LLC | |
| 0.47 | | |
3/2/2023 | |
| 1,230,000 | | |
| 1,186,042 | | |
| 1,180,548 | |
| Pilgrim's Pride Corp. | |
| 0.49 | | |
3/2/2023 | |
| 1,240,000 | | |
| 1,221,450 | | |
| 1,235,245 | |
| Transocean, Inc. | |
| 0.99 | | |
1/25/2023 | |
| 2,700,000 | | |
| 2,521,761 | | |
| 2,493,963 | |
| TOTAL | |
| 5.80 | % | |
| |
$ | 14,511,451 | | |
$ | 18,103,252 | | |
$ | 14,690,721 | |
Income
Taxes: Each Fund’s policy is to comply with the provisions of the Internal Revenue Code applicable to regulated investment
companies and to distribute all of its taxable income to its shareholders. Therefore, no federal income tax provision is required.
As of and during the period ended April 30, 2023, the Funds did not have a liability for any unrecognized tax benefits. The Funds
recognize the interest and penalties, if any, related to the unrecognized tax benefits as income tax expense in the Statements
of Operations. During the period ended April 30, 2023, the Funds did not incur any interest or penalties.
The
Funds file U.S. federal, state, and local tax returns as required. The Funds’ tax returns are subject to examination by
the relevant tax authorities until expiration of the applicable statute of limitations, which is generally three years after the
filing of the tax return. Tax returns for open years have incorporated no uncertain tax positions that require a provision for
income taxes.
Distributions
to Shareholders: Each Fund intends to make a dividend distribution each month to Common Shareholders after payment of interest
on any outstanding borrowings. Any net capital gains earned by a Fund are distributed at least annually to the extent necessary
to avoid federal income and excise taxes. Distributions to shareholders are recorded by each Fund on the ex-dividend date. Each
Fund has received approval from the Securities and Exchange Commission (the “Commission”) for exemption from Section
19(b) of the 1940 Act, and Rule 19b-1 there under permitting each Fund to make periodic distributions of long-term capital gains,
provided that the distribution policy of a Fund with respect to its Common Shares calls for periodic (e.g. quarterly/monthly)
distributions in an amount equal to a fixed percentage of each Fund’s average NAV over a specified period of time or market
price per common share at or about the time of distributions or pay-out of a level dollar amount.
Effective
August 2017, each Fund’s Board approved a managed dividend distribution rate of 10% of each Fund’s prior month average
NAV. Subject to certain conditions, these distribution policies remained in effect through July 2019. Effective August 2019, each
Fund's Board agreed that the Fund would pay monthly distributions in an amount not less than the average distribution rate of
a peer group of closed-end funds selected by the Board. Each Fund's current managed distribution policy is to set the monthly
distribution rate at an amount equal to one twelfth of 10% of each Fund's adjusted year-ending NAV, which is the average of the
NAVs as of the last five business days of the prior calendar year.
Clough
Global Funds
NOTES TO FINANCIAL STATEMENTS
April 30, 2023 (Continued) (Unaudited)
Securities
Transactions and Investment Income: Investment security transactions are accounted for on a trade date basis. Dividend income
and dividend expense-short sales are recorded on the ex-dividend date. Certain dividend income from foreign securities will be
recorded, in the exercise of reasonable diligence, as soon as a Fund is informed of the dividend if such information is obtained
subsequent to the ex-dividend date and may be subject to withholding taxes in these jurisdictions. Withholding taxes on foreign
dividends are paid (a portion of which may be reclaimable) or provided for in accordance with the applicable country’s tax
rules and rates and are disclosed in the Statements of Operations. Interest income, which includes amortization of premium and
accretion of discount, is recorded on the accrual basis. Realized gains and losses from securities transactions and unrealized
appreciation and depreciation of securities are determined using the identified cost basis for both financial reporting and income
tax purposes.
Foreign
Taxes: The Funds may be subject to foreign taxes related to foreign income received (a portion of which may be reclaimable),
capital gains on the sale of securities and certain foreign currency transactions. All foreign taxes are recorded in accordance
with the applicable regulations and rates that exist in the foreign jurisdictions in which the Funds invest.
Certain
foreign countries impose a capital gains tax which is accrued by the Funds based on the unrealized appreciation, if any, on affected
securities. Any accrual would reduce a Fund’s NAV. The tax is paid when the gain is realized and is included in capital
gains tax in the Statements of Operations.
Counterparty
Risk: Each of the Funds run the risk that the issuer or guarantor of a fixed income security, the counterparty to an over-the-counter
derivatives contract, a borrower of each Fund’s securities or the obligor of an obligation underlying an asset-backed security
will be unable or unwilling to make timely principal, interest, or settlement payments or otherwise honor its obligations. In
addition, to the extent that each of the Funds use over-the-counter derivatives, and/or has significant exposure to a single counterparty,
this risk will be particularly pronounced for each of the Funds.
Other
Risk Factors: Investing in the Funds may involve certain risks including, but not limited to, the following:
Unforeseen
developments in market conditions may result in the decline of prices of, and the income generated by, the securities held by
the Funds. These events may have adverse effects on the Funds such as a decline in the value and liquidity of many securities
held by the Funds, and a decrease in NAV. Such unforeseen developments may limit or preclude the Funds’ ability to achieve
their investment objective.
Investing
in stocks may involve larger price fluctuation and greater potential for loss than other types of investments. This may result
in the securities held by the Funds being subject to larger short-term declines in value compared to other types of investments.
The
Funds may have elements of risk due to their investments in foreign issuers located in various countries outside the U.S. Such
investments may subject the Funds to additional risks resulting from future political or economic conditions and/or possible impositions
of adverse foreign governmental laws or currency exchange restrictions. Investments in securities of non-U.S. issuers have unique
risks not present in securities of U.S. issuers, such as greater price volatility and less liquidity.
Fixed
income securities are subject to credit risk, which is the possibility that a security could have its credit rating downgraded
or that the issuer of the security could fail to make timely payments or default on payments of interest or principal. Additionally,
fixed income securities are subject to interest rate risk, meaning the decline in the price of debt securities that accompanies
a rise in interest rates. Bonds with longer maturities are subject to greater price fluctuations than bonds with shorter maturities.
The
Funds invest in bonds which are rated below investment grade. These high yield bonds may be more susceptible than higher grade
bonds to real or perceived adverse economic or industry conditions. The secondary market, on which high yield bonds are traded,
may also be less liquid than the market for higher grade bonds.
A
novel coronavirus and the resulting COVID-19 respiratory infection have resulted in a global pandemic and major disruption to
economies and markets around the world. The pandemic has led to extreme short-term market volatility and may have adverse long-term
effects on U.S. and world economies. Liquidity for many instruments has been reduced, and some sectors of the economy and individual
issuers have experienced particularly large losses. The economic impacts of the global pandemic may adversely impact the Funds’
ability to reach their investment objectives and may adversely affect the value and liquidity of the Funds’ investments.
Because of uncertainties in valuation, values reflected in these financial statements may differ from the value received upon
sales of those investments. These circumstances may continue for an extended period of time, and may adversely affect the value
and liquidity of the Funds’ investments.
NOTE
2 - FEDERAL INCOME TAXES
Classification
of Distributions: Net investment income/(loss) and net realized gain/(loss) may differ for financial statement and tax purposes.
The character of distributions made during the year from net investment income or net realized gains may differ from its ultimate
characterization for federal income tax purposes. Also, due to the timing of dividend distributions, the fiscal year in which
amounts are distributed may differ from the fiscal year in which the income or realized gain was recorded by the Funds. The amounts
and characteristics of tax basis distributions and composition of distributable earnings/(accumulated losses) are finalized at
fiscal year-end; accordingly, tax basis balances have not been determined as of April 30, 2023.
The
tax character of the distributions paid by the Funds during the year ended October 31, 2022, were as follows:
Fund | |
Ordinary
Income | | |
Long-Term
Capital Gains | | |
Return
of Capital | | |
Total | |
| Clough Global Dividend and Income Fund | |
$ | – | | |
$ | – | | |
$ | 13,197,196 | | |
$ | 13,197,196 | |
| Clough Global Equity Fund | |
| – | | |
| 13,720,430 | | |
| 12,601,657 | | |
| 26,322,087 | |
| Clough Global Opportunities Fund | |
| – | | |
| 21,501,359 | | |
| 26,881,540 | | |
| 48,382,899 | |
Clough
Global Funds
NOTES TO FINANCIAL STATEMENTS
April 30, 2023 (Continued) (Unaudited)
Tax
Basis of Investments: Net unrealized appreciation/(depreciation) of investments based on federal tax cost as of April 30,
2023, were as follows:
| | |
Gross
Appreciation (excess of value over
tax cost) | | |
Gross
Depreciation (excess of tax cost
over value) | | |
Net
Appreciation/ (Depreciation) of
Foreign Currency | | |
Net
Unrealized Appreciation/ (Depreciation) | | |
Cost
of Investments for Income Tax Purposes(a) | |
| Clough Global Dividend and Income Fund | |
$ | 8,706,947 | | |
$ | (3,249,751 | ) | |
$ | (218 | ) | |
$ | 5,456,978 | | |
$ | 121,277,547 | |
| Clough Global Equity Fund | |
| 17,107,661 | | |
| (8,256,566 | ) | |
| (490 | ) | |
| 8,850,605 | | |
| 193,699,169 | |
| Clough Global Opportunities Fund | |
| 30,601,666 | | |
| (16,318,149 | ) | |
| (1,012 | ) | |
| 14,282,505 | | |
| 354,885,283 | |
| (a) | Represents
cost for federal income tax purposes and differs from the cost for financial reporting purposes due to various book-to-tax differences. |
The
difference between book and tax basis unrealized appreciation is attributable primarily to wash sales, passive foreign investment
companies, notional principal contracts and accelerated recognition of unrealized gain or loss on certain derivatives.
NOTE
3 - CAPITAL TRANSACTIONS
Common
Shares: There are an unlimited number of no par value common shares of beneficial interest authorized for each Fund.
The
Funds have filed registration statements with the SEC authorizing the Funds to issue additional common shares through one or more
equity shelf programs (“Shelf Offerings”). Under the Shelf Offerings, the Funds, subject to market conditions, may
raise additional equity capital by issuing additional common shares from time to time in varying amounts and by different offering
methods at a net price at or above the Fund’s NAV per common share. In the event the Fund’s Shelf Offering registration
statement is no longer current, the Funds may not issue additional common shares until a post-effective amendment to the registration
statement has been filed with the SEC.
Transactions
in common shares were as follows:
| | |
Six
Months Ended April
30, 2023 | | |
Year
Ended October
31, 2022 | |
| Clough Global Dividend and Income Fund | |
| | | |
| | |
| Common shares outstanding - beginning of period | |
| 12,709,583 | | |
| 11,301,293 | |
| Common shares issued as reinvestment of dividends | |
| – | | |
| 75,779 | |
| Sale of shares | |
| – | | |
| 1,332,511 | |
| Common shares outstanding - end of period | |
| 12,709,583 | | |
| 12,709,583 | |
| Clough Global Equity Fund | |
| | | |
| | |
| Common shares outstanding - beginning of period | |
| 19,124,621 | | |
| 17,716,078 | |
| Common shares issued as reinvestment of dividends | |
| – | | |
| 106,111 | |
| Sale of shares | |
| – | | |
| 1,302,432 | |
| Common shares outstanding - end of period | |
| 19,124,621 | | |
| 19,124,621 | |
| Clough Global Opportunities Fund | |
| | | |
| | |
| Common shares outstanding - beginning of period | |
| 43,545,722 | | |
| 40,086,612 | |
| Common shares issued as reinvestment of dividends | |
| – | | |
| 286,712 | |
| Sale of shares | |
| – | | |
| 3,172,398 | |
| Common shares outstanding - end of period | |
| 43,545,722 | | |
| 43,545,722 | |
Clough
Global Funds
NOTES
TO FINANCIAL STATEMENTS
April
30, 2023 (Continued) (Unaudited)
NOTE
4 - PORTFOLIO SECURITIES
Purchases
and sales of investment securities, excluding securities sold short intended to be held for less than one year and short-term
securities, for the period ended April 30, 2023, are listed in the table below.
| Fund |
| |
Cost of
Investments
Purchased |
| |
Proceeds from
Investments Sold |
| |
Purchases of
Long-Term U.S.
Government
Obligations |
| |
Proceeds
from Sales of
Long-Term U.S.
Government
Obligations |
|
| Clough Global Dividend and Income Fund |
| |
$ |
49,939,854 |
| |
$ |
62,546,200 |
| |
$ |
1,921,577 |
| |
$ |
12,242,179 |
|
| Clough Global Equity Fund |
| |
|
115,387,926 |
| |
|
136,844,983 |
| |
|
33,622,904 |
| |
|
77,054,289 |
|
| Clough Global Opportunities Fund |
| |
|
208,141,572 |
| |
|
276,748,210 |
| |
|
55,446,369 |
| |
|
100,301,804 |
|
NOTE
5 - INVESTMENT ADVISORY AND ADMINISTRATION AGREEMENTS
Clough
serves as each Fund’s investment adviser pursuant to an Investment Advisory Agreement (each an “Advisory Agreement”
and collectively, the “Advisory Agreements”) with each Fund. As compensation for its services to the Fund, Clough
receives an annual investment advisory fee of 0.70%, 0.90% and 1.00% based on Clough Global Dividend and Income Fund’s,
Clough Global Equity Fund’s and Clough Global Opportunities Fund’s, respectively, average daily total assets, computed
daily and payable monthly.
Effective
April 17, 2023, Paralel Technologies LLC (“Paralel”) serves as each Fund’s administrator pursuant to an administration
and fund accounting agreement with each Fund. As compensation for its services to each Fund, Paralel receives a monthly administration
fee based on each Fund’s average daily total assets, computed daily and payable monthly. Paralel will pay all routine operating
expenses of the Funds, except the following: advisory fees; taxes and governmental fees; expenses related to portfolio transactions
and management of the portfolio (inclusive of leverage costs); expenses associated with secondary offerings of shares (including
costs related to the offering, redemption and/or maintenance of preferred shares or similar instruments); trustee fees and retainers;
expenses associated with tender offers and other share repurchases; and other extraordinary expenses as may arise, including,
without limit, litigation, claims, and indemnification expenses.
Prior
to April 17, 2023, ALPS Fund Services, Inc. (“ALPS”) served as each Fund’s administrator.
NOTE
6 - COMMITTED FACILITY AGREEMENT AND LENDING AGREEMENT
Each
Fund entered into a financing package that includes a Committed Facility Agreement (the “Agreement”) dated
January 16, 2009, as amended, between each Fund and BNP Paribas Prime Brokerage, Inc. (“BNP”) that allows
each Fund to borrow funds from BNP. Each Fund entered a Special Custody and Pledge Agreement (the “Pledge
Agreement”) dated December 9, 2013, as amended, between each Fund, the Funds’ custodian, and BNP. As of October
31, 2016, the Pledge Agreement was assigned from BNP to BNP Paribas Prime Brokerage International, Ltd. Per the Pledge
Agreement, borrowings under the Agreement are secured by assets of each Fund that are held by the Fund’s custodian in a
separate account (the “pledged collateral”). On April 30, 2023, the pledged collateral was valued at
$101,190,361, $151,257,726 and $290,981,537 for the Clough Global Dividend and Income Fund, Clough Global Equity Fund and
Clough Global Opportunities Fund, respectively. Each Fund may, with 30 day’s notice, reduce the Maximum Commitment
Financing (Initial Limit amount plus the increased borrowing amount in excess of the Initial Limit) to a lesser amount if
drawing on the full amount would result in a violation of the applicable asset coverage requirement of Section 18 of the 1940
Act. Interest is charged at the three month Overnight Banking Fund Rate (“OBFR”) plus 0.90% on the amount
borrowed.
The
Maximum Commitment Financing allowed under the Agreement is $40,000,000, $62,000,000 and $112,000,000 for the Clough Global Dividend
and Income Fund, Clough Global Equity Fund and the Clough Global Opportunities Fund, respectively. For the period ended April
30, 2023, the average borrowings outstanding for Clough Global Dividend and Income Fund, Clough Global Equity Fund and Clough
Global Opportunities Fund under the agreement were $51,639,402, $87,902,217, and $161,747,371, respectively, and the average interest
rate for the borrowings was 5.26%. As of April 30, 2023, the outstanding borrowings for Clough Global Dividend and Income Fund,
Clough Global Equity Fund and Clough Global Opportunities Fund were $40,000,000, $62,000,000 and $112,000,000, respectively. The
interest rate applicable to the borrowings of Clough Global Dividend and Income Fund, Clough Global Equity Fund and Clough Global
Opportunities Fund on April 30, 2023, was 5.71%.
The
Lending Agreement is a separate side-agreement between each Fund and BNP pursuant to which BNP may borrow a portion of the pledged
collateral (the “Lent Securities”) in an amount not to exceed the outstanding borrowings owed by a Fund to BNP under
the Agreement. The Lending Agreement is intended to permit each Fund to significantly reduce the cost of its borrowings under
the Agreement. BNP has the ability to re-register the Lent Securities in its own name or in another name other than the Fund to
pledge, re-pledge, sell, lend or otherwise transfer or use the collateral with all attendant rights of ownership. (It is each
Fund’s understanding that BNP will perform due diligence to determine the creditworthiness of any party that borrows Lent
Securities from BNP.) Each Fund may designate any security within the pledged collateral as ineligible to be a Lent Security,
provided there are eligible securities within the pledged collateral in an amount equal to the outstanding borrowing owed by a
Fund. During the year in which the Lent Securities are outstanding, BNP must remit payment to each Fund equal to the amount of
all dividends, interest or other distributions earned or made by the Lent Securities.
Under
the terms of the Lending Agreement, the Lent Securities are marked to market daily, and if the value of the Lent Securities
exceeds the value of the then-outstanding borrowings owed by a Fund to BNP under the Agreement (the “Current
Borrowings”), BNP must, on that day, either (1) return Lent Securities to each Fund’s custodian in an
amount sufficient to cause the value of the outstanding Lent Securities to equal the Current Borrowings; or (2) post cash
collateral with each Fund’s custodian equal to the difference between the value of the Lent Securities and the value of
the Current Borrowings. If BNP fails to perform either of these actions as required, each Fund will recall securities, as
discussed below, in an amount sufficient to cause the value of the outstanding Lent Securities to equal the Current
Borrowings. Each Fund can recall any of the Lent Securities and BNP shall, to the extent commercially possible, return such
security or equivalent security to each Fund’s custodian no later than three business days after such request. If a
Fund recalls a Lent Security pursuant to the Lending Agreement, and BNP fails to return the Lent Securities or equivalent
securities in a timely fashion, BNP shall remain liable for the ultimate delivery to each Fund’s custodian of such Lent
Securities, or equivalent securities, and for any buy-in costs that the executing broker for the sales transaction may impose
with respect to the failure to deliver. Should the borrower of the securities fail financially, the Funds have the right to
reduce the outstanding amount of the Current Borrowings against which the pledged collateral has been secured. Although risk
is mitigated by the collateral, the Funds could experience a delay in recovering their securities and possible loss of income
or value if the borrower fails to return the borrowed securities. Under the terms of the Lending Agreement, each Fund shall
have the right to apply and set-off an amount equal to one hundred percent (100%) of the then current fair value of such Lent
Securities against the Current Borrowings. As of April 30, 2023, the value of the Lent Securities for Clough Global Dividend
and Income Fund, Clough Global Equity Fund and Clough Global Opportunities Fund were $34,663,985, $57,569,628, and
$100,466,531, respectively.
Clough
Global Funds
NOTES
TO FINANCIAL STATEMENTS
April
30, 2023 (Continued) (Unaudited)
The
Board has approved each Agreement and the Lending Agreement. No violations of the Agreement or the Lending Agreement have occurred
during the period ended April 30, 2023.
Each
Fund receives income from BNP based on the value of the Lent Securities. This income is recorded as Hypothecated securities income
on the Statements of Operations. The interest incurred on borrowed amounts is recorded as Interest on loan in the Statements of
Operations, a part of Total Expenses.
NOTE
7 - SUBSEQUENT EVENT
On
June 2, 2023, the Board, advised by Clough, announced that each Fund has approved a share repurchase program under which it may
purchase, over a one-year period beginning on June 5, 2023, up to 5% of its outstanding common shares in open market transactions.
Clough
Global Funds
ADDITIONAL
INFORMATION
April
30, 2023 (Unaudited)
FUND
PROXY VOTING POLICIES AND PROCEDURES
Each
Fund’s policies and procedures used in determining how to vote proxies relating to portfolio securities are available on
the Funds’ website at http://www. cloughglobal.com. Information regarding how each Fund voted proxies relating to portfolio
securities held by each Fund for the period ended June 30, are available without charge, upon request, by contacting the Funds
at 1-855-425-6844 and on the Commission’s website at http://www.sec.gov.
PORTFOLIO
HOLDINGS
The
Funds file their complete schedule of portfolio holdings with the Commission for each fiscal quarter on Form N-PORT within
60 days after the end of the period. Copies of the Funds’ Form N-PORT are available without a charge, upon request, by
contacting the Funds at 1- 855-425-6844 and on the Commission’s website at http://www.sec.gov.
NOTICE
Notice
is hereby given in accordance with Section 23(c) of the Investment Company Act of 1940 that each Fund may purchase at market prices
from time to time shares of its common stock in the open market.
SECTION
19(A) NOTICES
The
following table sets forth the estimated amount of the sources of distribution for purposes of Section 19 of the Investment Company
Act of 1940, as amended, and the related rules adopted there under. Each Fund estimates the following percentages, of the total
distribution amount per share, attributable to (i) current and prior fiscal year net investment income, (ii) net realized short-term
capital gain, (iii) net realized long-term capital gain and (iv) return of capital or other capital source as a percentage of
the total distribution amount. These percentages are disclosed for the fiscal year-to-date cumulative distribution amount per
share for each Fund.
The
amounts and sources of distributions reported in these 19(a) notices are only estimates and not for tax reporting purposes. The
actual amounts and sources of the amounts for tax reporting purposes will depend upon the Fund’s investment experience during
the remainder of its fiscal year and may be subject to changes based on tax regulations. The Fund will send you a Form 1099-DIV
for the calendar year that will tell you how to report these distributions for federal income tax purposes.
| | |
Total Cumulative Distributions for the six
months ended April 30, 2023 | | |
% Breakdown of the Total Cumulative
Distributions for the six months ended April 30,
2023 | |
| | |
Net
Investment | | |
Net
Realized
Capital
Gains | | |
Return of
Capital | | |
Total Per
Common
Share | | |
Net
Investment
Income | | |
Net
Realized
Capital
Gains | | |
Return of
Capital | | |
Total Per
Common
Share | |
| Clough Global Dividend and Income Fund | |
$ | 0.0157 | | |
$ | – | | |
$ | 0.4043 | | |
$ | 0.4200 | | |
| 3.74 | % | |
| – | | |
| 96.26 | % | |
| 100.00 | % |
| Clough Global Equity Fund | |
$ | – | | |
$ | – | | |
$ | 0.4720 | | |
$ | 0.4720 | | |
| – | | |
| – | | |
| 100.00 | % | |
| 100.00 | % |
| Clough Global Opportunities Fund | |
$ | – | | |
$ | – | | |
$ | 0.3818 | | |
$ | 0.3818 | | |
| – | | |
| – | | |
| 100.00 | % | |
| 100.00 | % |
Each
Fund’s dividend policy is to distribute all or a portion of its net investment income to its shareholders on a monthly basis.
In order to provide shareholders with a more stable level of dividend distributions, each Fund may at times pay out less than
the entire amount of net investment income earned in any particular month and may at times in any particular month pay out such
accumulated but undistributed income in addition to net investment income earned in that month. As a result, the dividends paid
by each Fund for any particular month may be more or less than the amount of net investment income earned by the Fund during such
month. Each Fund’s current accumulated but undistributed net investment income, if any, is disclosed in the Statements of
Assets and Liabilities, which comprises part of the financial information included in this report.
You
should not draw any conclusions about each Fund’s investment performance from the amount of the distributions or from the
terms of each Fund’s plan.
Clough
Global Funds
DIVIDEND
REINVESTMENT PLAN
April
30, 2023 (Unaudited)
Unless
the registered owner of Common Shares elects to receive cash by contacting DST Systems, Inc. (the “Plan Administrator”),
all dividends declared on Common Shares will be automatically reinvested by the Plan Administrator for shareholders in each Fund’s
Dividend Reinvestment Plan (the “Plan”), in additional Common Shares. Shareholders who elect not to participate in
the Plan will receive all dividends and other distributions in cash paid by check mailed directly to the shareholder of record
(or, if the Common Shares are held in street or other nominee name, then to such nominee) by the Plan Administrator as dividend
disbursing agent. You may elect not to participate in the Plan and to receive all dividends in cash by contacting the Plan Administrator,
as dividend disbursing agent, at the address set forth below. Participation in the Plan is completely voluntary and may be terminated
or resumed at any time without penalty by notice if received and processed by the Plan Administrator prior to the dividend record
date; otherwise such termination or resumption will be effective with respect to any subsequently declared dividend or other distribution.
Some brokers may automatically elect to receive cash on your behalf and may re–invest that cash in additional Common Shares
for you. If you wish for all dividends declared on your Common Shares to be automatically reinvested pursuant to the Plan, please
contact your broker.
The
Plan Administrator will open an account for each Common Shareholder under the Plan in the same name in which such Common
Shareholder’s Common Shares are registered. Whenever a Fund declares a dividend or other distribution (together, a
“Dividend”) payable in cash, non–participants in the Plan will receive cash and participants in the Plan
will receive the equivalent in Common Shares. The Common Shares will be acquired by the Plan Administrator for the
participants’ accounts, depending upon the circumstances described below, either (i) through receipt of additional
unissued but authorized Common Shares from a Fund (“Newly Issued Common Shares”) or (ii) by purchase of
outstanding Common Shares on the open market (“Open–Market Purchases”) on the American Stock Exchange or
elsewhere. If, on the payment date for any Dividend, the closing market price plus estimated brokerage commissions per Common
Share is equal to or greater than the net asset value per Common Share, the Plan Administrator will invest the Dividend
amount in Newly Issued Common Shares on behalf of the participants. The number of Newly Issued Common Shares to be credited
to each participant’s account will be determined by dividing the dollar amount of the Dividend by the net asset value
per Common Share on the payment date; provided that, if the net asset value is less than or equal to 95% of the closing
market value on the payment date, the dollar amount of the Dividend will be divided by 95% of the closing market price per
Common Share on the payment date. If, on the payment date for any Dividend, the net asset value per Common Share is
greater than the closing market value plus estimated brokerage commissions, the Plan Administrator will invest the Dividend
amount in Common Shares acquired on behalf of the participants in Open–Market Purchases. In the event of a market
discount on the payment date for any Dividend, the Plan Administrator will have until the last business day before the next
date on which the Common Shares trade on an “ex–dividend” basis or 30 days after the payment date for such
Dividend, whichever is sooner (the “Last Purchase Date”), to invest the Dividend amount in Common Shares acquired
in Open–Market Purchases. If, before the Plan Administrator has completed its Open–Market Purchases, the market
price per Common Share exceeds the net asset value per Common Share, the average per Common Share purchase price paid by the
Plan Administrator may exceed the net asset value of the Common Shares, resulting in the acquisition of fewer Common Shares
than if the Dividend had been paid in Newly Issued Common Shares on the Dividend payment date. Because of the
foregoing difficulty with respect to Open–Market Purchases, the Plan provides that if the Plan Administrator is unable
to invest the full Dividend amount in Open–Market Purchases during the purchase period or if the market discount shifts
to a market premium during the purchase period, the Plan Administrator may cease making Open–Market Purchases and may
invest the uninvested portion of the Dividend amount in Newly Issued Common Shares at the net asset value per Common Share at
the close of business on the Last Purchase Date provided that, if the net asset value is less than or equal to 95% of the
then current market price per Common Share; the dollar amount of the Dividend will be divided by 95% of the market price on
the payment date.
The
Plan Administrator maintains all shareholders’ accounts in the Plan and furnishes written confirmation of all transactions
in the accounts, including information needed by shareholders for tax records. Common Shares in the account of each Plan participant
will be held by the Plan Administrator on behalf of the Plan participant, and each shareholder proxy will include those shares
purchased or received pursuant to the Plan. The Plan Administrator will forward all proxy solicitation materials to participants
and vote proxies for shares held under the Plan in accordance with the instructions of the participants.
In
the case of Common Shareholders such as banks, brokers or nominees which hold shares for others who are the beneficial owners,
the Plan Administrator will administer the Plan on the basis of the number of Common Shares certified from time to time by the
record shareholder’s name and held for the account of beneficial owners who participate in the Plan.
There
will be no brokerage charges with respect to Common Shares issued directly by a Fund. However, each participant will pay a pro
rata share of brokerage commissions incurred in connection with Open–Market Purchases. The automatic reinvestment of Dividends
will not relieve participants of any federal, state or local income tax that may be payable (or required to be withheld) on such
Dividends. Participants that request a sale of Common Shares through the Plan Administrator are subject to brokerage commissions.
Each
Fund reserves the right to amend or terminate the Plan. There is no direct service charge to participants with regard to purchases
in the Plan; however, each Fund reserves the right to amend the Plan to include a service charge payable by the participants.
All
correspondence or questions concerning the Plan should be directed to the Plan Administrator, DST Systems, Inc., 430 W 7th Street
Kansas City, MO 64105.
Clough
Global Funds
INVESTMENT
ADVISORY AGREEMENT APPROVAL
April
30, 2023 (Unaudited)
On
April 13, 2023, the Board of Trustees (the “Board” or the “Trustees”) of each of Clough Global
Dividend and Income Fund (“GLV”), Clough Global Equity Fund (“GLQ”) and Clough Global Opportunities
Fund (“GLO” and together with GLV and GLQ, each, a “Fund” and collectively, the “Funds”)
met to, among other things, review and consider the renewal of the Investment Advisory Agreements between each Fund and
Clough (each, an “Advisory Agreement” and collectively, the “Advisory Agreements”). During their
review of each Advisory Agreement, the Trustees, including the Trustees who are not “interested persons” of the
Fund (the “Independent Trustees”), as that term is defined in the Investment Company Act of 1940, as
amended (the “1940 Act”), considered all factors that it believed to be relevant, including those discussed
below. The Board did not identify any one factor as dispositive, and each Board member may have attributed different weights
to the factors considered.
Prior
to the beginning of their review of the Advisory Agreements, counsel to the Funds, who also serves as independent counsel to the
Independent Trustees, discussed with the Trustees their role and fiduciary responsibilities in general and also specifically under
the 1940 Act with respect to the renewal of each Advisory Agreement.
Representatives
from Clough discussed Clough’s materials relating to the Trustees’ consideration of renewal of the Advisory Agreements.
It was noted that included in the Board materials were responses by Clough to a request letter prepared by legal counsel on behalf
of the Independent Trustees to the Funds to assist the Board in evaluating whether to renew the Advisory Agreements (the “15(c)
Materials”). It was also noted that the 15(c) Materials were extensive, and included information relating to: each Fund’s
investment results, portfolio composition, advisory fee and expense comparisons and profitability to Clough; financial information
regarding Clough; descriptions of policies, including compliance monitoring and portfolio trading practices; information about
the personnel providing investment management services to the Funds; and the nature of services provided under each Advisory Agreement.
In addition, the Independent Trustees considered information provided to them at prior Board meetings in presentations from Clough
Capital representatives.
The
Board considered the organizational structure and business operations of Clough. The Board also considered the
qualifications of Clough and its principals to act as each Fund’s investment adviser. The Board considered the
professional experience of the portfolio manager, Charles I. Clough, Jr. (the “Portfolio Manager”), emphasizing
that the Portfolio Manager had substantial experience as an investment professional. The Trustees acknowledged their
familiarity with the expertise and standing in the investment community of the Portfolio Manager, and their satisfaction with
the expertise of Clough and the services provided by Clough to the Funds. The Trustees concluded that the portfolio
management team was well qualified to serve the Funds in those functions.
The
Board considered various investment products managed by Clough other than the Funds. The Board also considered the adequacy of
Clough’s facilities. The Trustees concluded that Clough appeared to have adequate procedures and personnel in place to ensure
compliance by Clough with applicable law and with each Fund’s investment objectives and restrictions.
The
Board considered materials regarding the comparability of the investment advisory fees of the Funds with the investment advisory
fees of other investment companies (each, an “Expense Group”), which had been prepared by Strategic Insight, an affiliate
of ISS Market Intelligence (“Strategic Insight”). The Trustees considered the fees charged by Clough to other clients
for which it provides comparable service, Clough’s balance sheet for the year ended December 31, 2022, and a profit and
loss analysis as it relates to Clough’s advisory business. The Board also considered the net total expense ratio, excluding
investment related expenses, compared with the expense ratios for funds in the Expense Group, as reported by Strategic Insight.
The
Board considered Clough’s procedures relating to compliance and oversight, a copy of which was included in the Board materials.
The Board further considered information provided by Clough on whether Clough has experienced or anticipates it may experience
conflicts of interest in managing the Funds. The Board considered that the materials contained information regarding Clough’s
business continuity and disaster recovery plans as well as steps Clough has undertaken to reasonably detect and prevent cybersecurity
crimes. The Board also considered information related to Clough’s trading activities and how Clough monitors best execution.
The Board considered the possible benefits Clough may accrue because of its relationship with the Funds as well as potential benefits
that accrue to the Funds because of their relationship with Clough. The Board considered that, other than soft dollar arrangements,
Clough does not realize any direct benefits due to the allocation of brokerage and related transactions on behalf of the Funds.
The
Board considered information in the Strategic Insight report regarding each Fund’s investment performance as well as comparisons
of each Fund’s performance with the performance during similar periods of other funds in its Expense Group and comparisons
of cost and expense structures of each Fund with the cost and expense structures of other funds in the relevant Expense Group,
and related matters. The Trustees took into consideration each Fund’s performance as compared to the performance of each
Fund’s Expense Group for the one year ended February 23, 2023. The Trustees also considered each Fund’s performance
as compared to the performance of each Fund’s Expense Group for the one year ended December 31, 2022. In addition, the Board
considered each Fund’s performance in comparable market cycles.
The
Board considered that the usefulness of performance comparisons may be affected by a number of factors, including different investment
policies and limitations applicable to the Funds and comparison funds, as well as the end date selected. The Board also considered
each Fund’s performance in light of overall financial market conditions and the impact of COVID-19 government actions.
The
Board took into consideration that the Funds may be unique in the registered fund marketplace and that Strategic Insight had
a difficult time presenting a large peer group for comparison. For each Fund, the Board considered fees from other leveraged
closed-end investment companies that Strategic Insight classified as “global funds” (as well as funds that
Clough recommended be included) versus fees paid by Clough Global Dividend and Income Fund, Clough Global Equity Fund and
Clough Global Opportunities Fund as part of the expense group (the “Expense Group”).
The
Board considered the extent to which each Fund utilizes leverage and short sales, thereby increasing its investment-related expenses
and concluded that the use of leverage and short sales is an important part of each Fund’s investment strategy to attempt
to meet each Fund’s investment objective. The Board also considered that investment related expenses should be viewed as
operational in nature and should not be considered a management expense. The Board further considered that Strategic Insight defined
investment related expenses to include, but not be limited to, dividends on securities sold short, interest expense, reverse repurchase
agreements, swaps, tender costs, and auction fees.
The
Trustees also considered the profit and loss information on each Fund provided by Clough.
Clough
Global Funds
INVESTMENT
ADVISORY AGREEMENT APPROVAL
April
30, 2023 (Continued) (Unaudited)
The
Independent Trustees met in executive session and with the assistance of legal counsel reviewed and discussed in more detail the
information that had been presented relating to Clough, the Advisory Agreements and Clough’s profitability.
After
executive session, the Board of Trustees of each Fund, present in person, with the Independent Trustees present in person voting
separately, unanimously concluded that the investment advisory fee of 0.70% of Clough Global Dividend and Income Fund’s
total assets, 0.90% of Clough Global Equity Fund’s total assets and 1.00% of Clough Global Opportunities Fund’s total
assets are fair and reasonable for each respective Fund and that the renewal of each Advisory Agreement is in the best interests
of each respective Fund and its shareholders.

INVESTMENT
ADVISOR
Clough
Capital Partners L.P.
53
State Street, 27th Floor
Boston,
MA 02109
INDEPENDENT
REGISTERED PUBLIC ACCOUNTING FIRM
Cohen & Company, Ltd.
1350
Euclid Avenue, Suite 800
Cleveland,
OH 44115
LEGAL
COUNSEL
K&L
Gates LLP
1601
K Street NW
Washington
DC 20006
ADMINISTRATOR
AND ACCOUNTANT
Paralel
Technologies LLC
1700
Broadway, Suite 1850
Denver,
CO 80290
TRANSFER
AGENT AND DIVIDEND DISBURSING AGENT
DST
Systems, Inc.
430 W 7th Street
Kansas
City, MO 64105
CUSTODIAN
State
Street Bank and Trust
One
Congress Street, Suite 1
Boston,
MA 02114-2016
Must
be accompanied or preceded by a prospectus.
(b)
Not applicable.
Item
2. Code of Ethics.
Not
applicable to semi-annual report.
Item
3. Audit Committee Financial Expert.
Not
applicable to semi-annual report.
Item
4. Principal Accountant Fees and Services.
Not
applicable to semi-annual report.
Item
5. Audit Committee of Listed Registrants.
Not
applicable to semi-annual report.
Item
6. Investments.
| (a) | Schedule
I – Investments in securities of unaffiliated issuers is included as part of the
Report to Stockholders filed under Item 1(a) of this form. |
| (b) | Not
applicable to the Registrant. |
Item
7. Disclosure of Proxy Voting Policies and Procedures for Closed-End Management Investment Companies.
Not
applicable to semi-annual report.
Item
8. Portfolio Managers of Closed-End Management Investment Companies.
As
of July 10, 2023, William Whelan is a named Co-Portfolio Manager of the Fund. Information on Mr. Whelan is shown below:
| Name |
Title |
Length
of Service |
Business
Experience 5 Years |
| William
Whelan |
Co-Portfolio
Manager |
Since
January 2023 |
Mr.
Whelan is an income partner who joined Clough Capital in 2014 and has over 17 years of experience in the investment management
industry. Previously, Mr. Whelan was an Investment Principal at Partners Capital, a private investment office focused on multi-asset
class investing. Prior to joining Partners Capital, Mr. Whelan was an equity research analyst at Millennium Management, a
multi-strategy hedge fund and at Fidelity Management and Research. |
Other
accounts managed by the Registrant’s Portfolio Manager as of May 31, 2023:
| Portfolio
Managers Name |
Registered
Investment
Companies |
Other
Pooled
Investment
Vehicles (1) |
Other
Accounts(2) |
Material
Conflicts
If
Any |
| Willliam
Whelan |
2
Accounts
$366.3
million
Total Assets |
0
Accounts
0
Total Assets
|
1
Account
$281.9
million
Total Assets |
See
below (3) |
| (1) | The
advisory fees are based in part on the performance for each account. |
| (2) | The
advisory fee is based in part on the performance for the account. |
Material
conflicts of interest may arise as a result of the fact that the Portfolio Managers also have day-to-day management responsibilities
with respect to both the Registrant and the various accounts listed above (collectively with the Registrant, the “Accounts”).
These potential conflicts include:
Limited
Resources. The Portfolio Managers cannot devote their full time and attention to the management of each of the Accounts. Accordingly,
the Portfolio Managers may be limited in their ability to identify investment opportunities for each of the Accounts that are
as attractive as might be the case if the Portfolio Managers were to devote substantially more attention to the management of
a single Account. The effects of this potential conflict may be more pronounced where the Accounts have different investment strategies.
Limited
Investment Opportunities. If the Portfolio Managers identify a limited investment opportunity that may be appropriate for
more than one Account, the investment opportunity may be allocated among several Accounts. This could limit any single Account’s
ability to take full advantage of an investment opportunity that might not be limited if the Portfolio Managers did not provide
investment advice to other Accounts.
Different
Investment Strategies. The Accounts managed by the Portfolio Managers have differing investment strategies. If the Portfolio
Managers determine that an investment opportunity may be appropriate for only some of the Accounts or decide that certain of the
Accounts should take different positions with respect to a particular security, the Portfolio Managers may effect transactions
for one or more Accounts which may affect the market price of the security or the execution of the transaction, or both, to the
detriment or benefit of one or more other Accounts.
Variation
in Compensation. A conflict of interest may arise where Clough or Clough Associates, LLC, as applicable, is compensated differently
by the Accounts that are managed by the Portfolio Managers. If certain Accounts pay higher management fees or performance-based
incentive fees, the Portfolio Managers might be motivated to prefer certain Accounts over others. The Portfolio Managers might
also be motivated to favor Accounts in which they have a greater ownership interest or Accounts that are more likely to enhance
the Portfolio Managers’ performance record or to otherwise benefit the Portfolio Managers.
Selection
of Brokers. The Portfolio Managers select the brokers that execute securities transactions for the Accounts that they supervise.
In addition to executing trades, some brokers provide the Portfolio Managers with research and other services which may require
the payment of higher brokerage fees than might otherwise be available. The Portfolio Managers’ decision as to the selection
of brokers could yield disproportionate costs and benefits among the Accounts that they manage, since the research and other services
provided by brokers may be more beneficial to some Accounts than to others.
Portfolio
Manager Compensation
William
Whelan is an income partner of Clough. He receives a fixed base salary determined based on market factors. Additionally, Clough
distributes substantially all of its annual net profits to its partners with Mr. Whelan receiving a minority share with the remainder
being divided between Charles I. Clough, Jr., the James Chanty Trust of 2012, with an additional smaller share allocated to two
additional income partners.
Dollar
Range of Securities Owned as of May 31, 2023
| Portfolio
Managers |
Dollar
Range of the Registrant’s Securities
Owned by the Portfolio Managers |
William
Whelan |
$50,001
- $100,000 |
| Item 9. | Purchases
of Equity Securities by Closed-End Management Investment Companies and Affiliated Purchasers. |
None.
Item
10. Submission of Matters to a Vote of Security Holders.
There
have been no material changes by which shareholders may recommend nominees to the Board of Trustees.
Item
11. Controls and Procedures.
| (a) | The
Registrant’s principal executive officer and principal financial officer have concluded
that the Registrant’s disclosure controls and procedures (as defined in Rule 30a-3(c)
under the Investment Company Act of 1940, as amended) are effective based on their evaluation
of these controls and procedures as of a date within 90 days of the filing date of this
document. |
| (b) | There
was no change in the Registrant's internal control over financial reporting (as
defined in Rule 30a-3(d) under the Investment Company Act of 1940, as amended) during
the period covered by this report that has materially affected, or is reasonably likely
to materially affect, the Registrant's internal control over financial reporting. |
Item
12. Disclosure of Securities Lending Activities for Closed-End Management Investment Companies.
Not
applicable to semi-annual report.
Item
13. Exhibits.
(a)(1)
Not applicable to semi-annual report.
(a)(2) The certifications required by Rule 30a-2(a) of the Investment Company Act of 1940, as amended are attached hereto as Ex-99.Cert.
(b) A certification for the Registrant’s Principal Executive Officer and Principal Financial Officer, as required by Rule 30a-2(b) of the Investment Company Act of 1940, as amended, and Section 906 of the Sarbanes-Oxley Act of 2002 are attached hereto as Ex-99.906Cert.
(c) Pursuant to the Securities and Exchange Commission’s Order granting relief from Section 19(b) of the Investment Company Act of 1940 dated September 21, 2009, the form of 19(a) Notices to Beneficial Owners are attached hereto as Exhibit 13(c).
SIGNATURES
Pursuant
to the requirements of the Securities Exchange Act of 1934 and the Investment Company Act of 1940, the Registrant has duly caused
this report to be signed on its behalf by the undersigned, thereunto duly authorized.
CLOUGH
GLOBAL OPPORTUNITIES FUND
| By: | /s/
Jeremy May | |
| | Jeremy
May | |
| | President/Principal
Executive Officer | |
Pursuant
to the requirements of the Securities Exchange Act of 1934 and the Investment Company Act of 1940, this report has been signed
below by the following persons on behalf of the Registrant and in the capacities and on the dates indicated.
CLOUGH
GLOBAL OPPORTUNITIES FUND
| By: | /s/
Jeremy May | |
| | Jeremy
May | |
| | President/Principal
Executive Officer | |
| By: | /s/
Jill Kerschen | |
| | Jill
Kerschen | |
| | Treasurer/Principal
Financial Officer | |
Ex.
99.Cert
I,
Jeremy May, President and Principal Executive Officer of the Clough Global Opportunities Fund, certify that:
| 1. | I
have reviewed this report on Form N-CSR of the Clough Global Opportunities Fund; |
| 2. | Based
on my knowledge, this report does not contain any untrue statement of a material fact
or omit to state a material fact necessary to make the statements made, in light of the
circumstances under which such statements were made, not misleading with respect to the
period covered by this report; |
| 3. | Based
on my knowledge, the financial statements, and other financial information included in
this report, fairly present in all material respects the financial condition, results
of operations, changes in net assets, and cash flows (if the financial statements are
required to include a statement of cash flows) of the Registrant as of, and for, the
periods presented in this report; |
| 4. | The
Registrant’s other certifying officer and I are responsible for establishing and
maintaining disclosure controls and procedures (as defined in Rule 30a-3(c) under the
Investment Company Act of 1940) and internal control over financial reporting (as defined
in Rule 30a-3(d) under the Investment Company Act of 1940) for the Registrant and have: |
| a. | Designed
such disclosure controls and procedures, or caused such disclosure controls and procedures
to be designed under our supervision, to ensure that material information relating to
the Registrant, including its consolidated subsidiaries, is made known to us by others
within those entities, particularly during the period in which this report is being prepared; |
| b. | Designed
such internal control over financial reporting, or caused such internal control over
financial reporting to be designed under our supervision, to provide reasonable assurance
regarding the reliability of financial reporting and the preparation of financial statements
for external purposes in accordance with generally accepted accounting principles; |
| c. | Evaluated
the effectiveness of the Registrant’s disclosure controls and procedures and presented
in this report our conclusions about the effectiveness of the disclosure controls and
procedures, as of a date within 90 days prior to the filing date of this report based
on such evaluation; and |
| d. | Disclosed
in this report any change in the Registrant’s internal control over financial reporting
that occurred during the period covered by this report that has materially affected,
or is reasonably likely to materially affect, the Registrant’s internal control
over financial reporting; and |
| 5. | The
Registrant’s other certifying officer and I have disclosed to the Registrant’s
auditors and the audit committee of the Registrant’s board of directors (or persons
performing the equivalent functions); |
| a. | all
significant deficiencies and material weaknesses in the design or operation of internal
control over financial reporting which are reasonably likely to adversely affect the
Registrant’s ability to record, process, summarize, and report financial information;
and |
| b. | any
fraud, whether or not material, that involves management or other employees who have
a significant role in the Registrant’s internal control over financial reporting. |
| By: | /s/
Jeremy May | |
| | Jeremy May | |
| | President/Principal
Executive Officer | |
I,
Jill Kerschen, Treasurer and Principal Financial Officer of the Clough Global Opportunities Fund, certify that:
| 1. | I
have reviewed this report on Form N-CSR of the Clough Global Opportunities Fund; |
| 2. | Based
on my knowledge, this report does not contain any untrue statement of a material fact
or omit to state a material fact necessary to make the statements made, in light of the
circumstances under which such statements were made, not misleading with respect to the
period covered by this report; |
| 3. | Based
on my knowledge, the financial statements, and other financial information included in
this report, fairly present in all material respects the financial condition, results
of operations, changes in net assets, and cash flows (if the financial statements are
required to include a statement of cash flows) of the Registrant as of, and for, the
periods presented in this report; |
| 4. | The
Registrant’s other certifying officer and I are responsible for establishing and
maintaining disclosure controls and procedures (as defined in Rule 30a-3(c) under the
Investment Company Act of 1940) and internal control over financial reporting (as defined
in Rule 30a-3(d) under the Investment Company Act of 1940) for the Registrant and have: |
| a. | Designed
such disclosure controls and procedures, or caused such disclosure controls and procedures
to be designed under our supervision, to ensure that material information relating to
the Registrant, including its consolidated subsidiaries, is made known to us by others
within those entities, particularly during the period in which this report is being prepared; |
| b. | Designed
such internal control over financial reporting, or caused such internal control over
financial reporting to be designed under our supervision, to provide reasonable assurance
regarding the reliability of financial reporting and the preparation of financial statements
for external purposes in accordance with generally accepted accounting principles; |
| c. | Evaluated
the effectiveness of the Registrant’s disclosure controls and procedures and presented
in this report our conclusions about the effectiveness of the disclosure controls and
procedures, as of a date within 90 days prior to the filing date of this report based
on such evaluation; and |
| d. | Disclosed
in this report any change in the Registrant’s internal control over financial reporting
that occurred during the period covered by this report that has materially affected,
or is reasonably likely to materially affect, the Registrant’s internal control
over financial reporting; and |
| 5. | The
Registrant’s other certifying officer and I have disclosed to the Registrant’s
auditors and the audit committee of the Registrant’s board of directors (or persons
performing the equivalent functions); |
| a. | all
significant deficiencies and material weaknesses in the design or operation of internal
control over financial reporting which are reasonably likely to adversely affect the
Registrant’s ability to record, process, summarize, and report financial information;
and |
| b. | any
fraud, whether or not material, that involves management or other employees who have
a significant role in the Registrant’s internal control over financial reporting. |
| By: | /s/
Jill Kerschen | |
| | Jill Kerschen | |
| | Treasurer/Principal
Financial Officer | |
Exhibit
99.906Cert
This
certification is furnished pursuant to Section 906 of the Sarbanes-Oxley Act of 2002, 18 U.S.C. § 1350, and accompanies the
report on Form N-CSR for the period ended April 30, 2023 (the “Report”) of the Clough Global Opportunities Fund (the
“Company”).
I,
Jeremy May, the President and Principal Executive Officer of the Company, certify that:
| (i) | the
Report fully complies with the requirements of Section 13(a) or Section 15(d), as applicable,
of the Securities Exchange Act of 1934 (15 U.S.C. 78m or 78o(d)); and |
| (ii) | the
information contained in the Report fairly presents, in all material respects, the financial
condition and results of operations of the Company. |
| Date:
July 10, 2023 |
/s/
Jeremy May |
|
| |
Jeremy
May, President |
|
| |
(Principal
Executive Officer) |
|
This
certification is furnished pursuant to Section 906 of the Sarbanes-Oxley Act of 2002, 18 U.S.C. § 1350, and accompanies the
report on Form N-CSR for the period ended April 30, 2023 (the “Report”) of the Clough Global Opportunities Fund (the
“Company”).
I,
Jill Kerschen, the Treasurer and Principal Financial Officer of the Company, certify that:
| (i) | the
Report fully complies with the requirements of Section 13(a) or Section 15(d), as applicable
of the Securities Exchange Act of 1934 (15 U.S.C. 78m or 78o(d)); and |
| (ii) | the
information contained in the Report fairly presents, in all material respects, the financial
condition and results of operations of the Company. |
| Date:
July 10, 2023 |
/s/
Jill Kerschen |
|
| |
Jill
Kerschen, Treasurer |
|
| |
(Principal
Financial Officer) |
|
CLOUGH
GLOBAL OPPORTUNITIES FUND SECTION 19(a) NOTICE
Statement
Pursuant to Section 19(a) of the Investment Company Act of 1940
Denver,
Colorado – November 30, 2022 - Today, the Clough Global Opportunities Fund (NYSE MKT: GLO) (the “Fund”),
a closed-end fund, paid a monthly distribution on its common stock of $0.0943 per share to shareholders of record at the close
of business on November 18, 2022.
The
following table sets forth the estimated amount of the sources of distribution for purposes of Section 19 of the Investment Company
Act of 1940, as amended, and the related rules adopted thereunder. The Fund estimates the following percentages, of the total
distribution amount per share, attributable to (i) current and prior fiscal year net investment income, (ii) net realized short-term
capital gain, (iii) net realized long-term capital gain and (iv) return of capital or other capital source as a percentage of
the total distribution amount. These percentages are disclosed for the current distribution as well as the fiscal year-to-date
cumulative distribution amount per share for the Fund.
| Current
Distribution from: |
|
|
| |
Per
Share ($) |
% |
| Net Investment Income |
0.0000 |
0.00% |
| Net Realized Short-Term Capital
Gain |
0.0000 |
0.00% |
| Net Realized Long-Term Capital
Gain |
0.0000 |
0.00% |
| Return of Capital or other Capital
Source |
0.0943 |
100.00% |
| Total (per common share) |
0.0943 |
100.00% |
| Fiscal Year-to-Date
Cumulative Distributions from: |
|
|
| |
Per
Share ($) |
% |
| Net Investment Income |
0.0000 |
0.00% |
| Net Realized Short-Term Capital
Gain |
0.0000 |
0.00% |
| Net Realized Long-Term Capital
Gain |
0.0000 |
0.00% |
| Return of Capital or other Capital
Source |
0.0943 |
100.00% |
| Total (per common share) |
0.0943 |
100.00% |
The
amounts and sources of distributions reported in this 19(a) Notice are only estimates and not for tax reporting purposes. The
actual amounts and sources of the amounts for tax reporting purposes will depend upon the Fund’s investment experience during
the remainder of its fiscal year and may be subject to changes based on tax regulations. The Fund will send you a Form 1099-DIV
for the calendar year that will tell you how to report these distributions for federal income tax purposes. The Fund estimates
that it has distributed more than its income and net realized capital gains; therefore, a portion of your distribution may be
a return of capital. A return of capital may occur for example, when some or all of the money that you invested in the Fund is
paid back to you. A return of capital distribution does not necessarily reflect the Fund’s investment performance and should
not be confused with ‘yield’ or ‘income.’
Presented
below are return figures, based on the change in the Fund’s Net Asset Value per share (“NAV”), compared to the
annualized distribution rate for this current distribution as a percentage of the NAV on the last business day of the month prior
to distribution record date.
| Fund Performance
& Distribution Information |
|
| |
|
| Fiscal Year to Date (11/01/2021
through 10/31/2022) |
|
| Annualized Distribution Rate as
a Percentage of NAV^ |
18.22% |
| Cumulative Distribution Rate on
NAV^+ |
1.52% |
| Cumulative Total Return on NAV* |
-42.06% |
| Average Annual Total Return
on NAV for the 5 Year Period Ending 10/31/2022** |
-0.96% |
Past
performance is not indicative of future results.
| ^ | Based
on the Fund’s NAV as of October 31, 2022. |
| + | Cumulative
distribution rate is based on distributions paid to date for the period November 1, 2022 through November 30, 2022. |
| * | Cumulative
fiscal year-to-date return is based on the change in NAV including distributions paid and assuming reinvestment of these distributions
and that all rights in the Fund’s rights offering were exercised, for the period November 1, 2021 through October 31, 2022. |
| ** | The
5 year average annual total return is based on change in NAV including distributions paid and assuming reinvestment of these distributions
and that all rights in the Fund’s rights offering were exercised, as of the last business day of the month prior to the
month of the current distribution record date. |
While
the NAV performance may be indicative of the Fund’s investment performance, it does not measure the value of a shareholder’s
investment in the Fund. The value of a shareholder’s investment in the Fund is determined by the Fund’s market price,
which is based on the supply and demand for the Fund’s shares in the open market.
Shareholders
should not draw any conclusions about the Fund’s investment performance from the amount of this distribution or from the
terms of the Fund’s Managed Distribution Plan.
Furthermore,
the Board of Trustees reviews the amount of any potential distribution and the income, capital gain or capital available. The
Board of Trustees will continue to monitor the Fund’s distribution level, taking into consideration the Fund’s net
asset value and the financial market environment. The Fund’s distribution policy is subject to modification by the Board
of Trustees at any time. The distribution rate should not be considered the dividend yield or total return on an investment in
the Fund.
ALPS
Portfolio Solutions Distributor, Inc. FINRA Member Firm.
CLOUGH
GLOBAL OPPORTUNITIES FUND SECTION 19(a) NOTICE
Statement
Pursuant to Section 19(a) of the Investment Company Act of 1940
Denver,
Colorado – December 30, 2022 - Today, the Clough Global Opportunities Fund (NYSE MKT: GLO) (the “Fund”),
a closed-end fund, paid a monthly distribution on its common stock of $0.0943 per share to shareholders of record at the close
of business on December 20, 2022.
The
following table sets forth the estimated amount of the sources of distribution for purposes of Section 19 of the Investment Company
Act of 1940, as amended, and the related rules adopted thereunder. The Fund estimates the following percentages, of the total
distribution amount per share, attributable to (i) current and prior fiscal year net investment income, (ii) net realized short-term
capital gain, (iii) net realized long-term capital gain and (iv) return of capital or other capital source as a percentage of
the total distribution amount. These percentages are disclosed for the current distribution as well as the fiscal year-to-date
cumulative distribution amount per share for the Fund.
| Current
Distribution from: |
|
|
| |
Per
Share ($) |
% |
| Net Investment Income |
0.0000 |
0.00% |
| Net Realized Short-Term Capital
Gain |
0.0000 |
0.00% |
| Net Realized Long-Term Capital
Gain |
0.0000 |
0.00% |
| Return of Capital or other Capital
Source |
0.0943 |
100.00% |
| Total (per common share) |
0.0943 |
100.00% |
| Fiscal Year-to-Date
Cumulative Distributions from: |
|
|
| |
Per
Share ($) |
% |
| Net Investment Income |
0.0000 |
0.00% |
| Net Realized Short-Term Capital
Gain |
0.0000 |
0.00% |
| Net Realized Long-Term Capital
Gain |
0.0000 |
0.00% |
| Return of Capital or other Capital
Source |
0.1886 |
100.00% |
| Total (per common share) |
0.1886 |
100.00% |
The
amounts and sources of distributions reported in this 19(a) Notice are only estimates and not for tax reporting purposes. The
actual amounts and sources of the amounts for tax reporting purposes will depend upon the Fund’s investment experience during
the remainder of its fiscal year and may be subject to changes based on tax regulations. The Fund will send you a Form 1099-DIV
for the calendar year that will tell you how to report these distributions for federal income tax purposes. The Fund estimates
that it has distributed more than its income and net realized capital gains; therefore, a portion of your distribution may be
a return of capital. A return of capital may occur for example, when some or all of the money that you invested in the Fund is
paid back to you. A return of capital distribution does not necessarily reflect the Fund’s investment performance and should
not be confused with ‘yield’ or ‘income.’
Presented
below are return figures, based on the change in the Fund’s Net Asset Value per share (“NAV”), compared to the
annualized distribution rate for this current distribution as a percentage of the NAV on the last business day of the month prior
to distribution record date.
| Fund Performance
& Distribution Information |
|
| |
|
| Fiscal Year to Date (11/01/2022
through 11/30/2022) |
|
| Annualized Distribution Rate as
a Percentage of NAV^ |
18.11% |
| Cumulative Distribution Rate on
NAV^+ |
3.02% |
| Cumulative Total Return on NAV* |
2.26% |
| Average Annual Total Return
on NAV for the 5 Year Period Ending 11/30/2022** |
-0.70% |
Past
performance is not indicative of future results.
| ^ | Based
on the Fund’s NAV as of November 30, 2022. |
| + | Cumulative
distribution rate is based on distributions paid to date for the period November 1, 2022 through December 31, 2022. |
| * | Cumulative
fiscal year-to-date return is based on the change in NAV including distributions paid and assuming reinvestment of these distributions
and that all rights in the Fund’s rights offering were exercised, for the period November 1, 2022 through November 30, 2022. |
| ** | The
5 year average annual total return is based on change in NAV including distributions paid and assuming reinvestment of these distributions
and that all rights in the Fund’s rights offering were exercised, as of the last business day of the month prior to the
month of the current distribution record date. |
While
the NAV performance may be indicative of the Fund’s investment performance, it does not measure the value of a shareholder’s
investment in the Fund. The value of a shareholder’s investment in the Fund is determined by the Fund’s market price,
which is based on the supply and demand for the Fund’s shares in the open market.
Shareholders
should not draw any conclusions about the Fund’s investment performance from the amount of this distribution or from the
terms of the Fund’s Managed Distribution Plan.
Furthermore,
the Board of Trustees reviews the amount of any potential distribution and the income, capital gain or capital available. The
Board of Trustees will continue to monitor the Fund’s distribution level, taking into consideration the Fund’s net
asset value and the financial market environment. The Fund’s distribution policy is subject to modification by the Board
of Trustees at any time. The distribution rate should not be considered the dividend yield or total return on an investment in
the Fund.
ALPS
Portfolio Solutions Distributor, Inc. FINRA Member Firm.
CLOUGH
GLOBAL OPPORTUNITIES FUND SECTION 19(a) NOTICE
Statement
Pursuant to Section 19(a) of the Investment Company Act of 1940
Denver,
Colorado – January 31, 2023 - Today, the Clough Global Opportunities Fund (NYSE MKT: GLO) (the “Fund”),
a closed-end fund, paid a monthly distribution on its common stock of $0.0483 per share to shareholders of record at the close
of business on January 20, 2023.
The
following table sets forth the estimated amount of the sources of distribution for purposes of Section 19 of the Investment Company
Act of 1940, as amended, and the related rules adopted thereunder. The Fund estimates the following percentages, of the total
distribution amount per share, attributable to (i) current and prior fiscal year net investment income, (ii) net realized short-term
capital gain, (iii) net realized long-term capital gain and (iv) return of capital or other capital source as a percentage of
the total distribution amount. These percentages are disclosed for the current distribution as well as the fiscal year-to-date
cumulative distribution amount per share for the Fund.
| Current
Distribution from: |
|
|
| |
Per
Share ($) |
% |
| Net Investment Income |
0.0000 |
0.00% |
| Net Realized Short-Term Capital
Gain |
0.0000 |
0.00% |
| Net Realized Long-Term Capital
Gain |
0.0000 |
0.00% |
| Return of Capital or other Capital
Source |
0.0483 |
100.00% |
| Total (per common share) |
0.0483 |
100.00% |
| Fiscal Year-to-Date
Cumulative Distributions from: |
|
|
| |
Per Share ($) |
% |
| Net Investment Income |
0.0000 |
0.00% |
| Net Realized Short-Term Capital
Gain |
0.0000 |
0.00% |
| Net Realized Long-Term Capital
Gain |
0.0000 |
0.00% |
| Return of Capital or other Capital
Source |
0.2369 |
100.00% |
| Total (per common share) |
0.2369 |
100.00% |
The
amounts and sources of distributions reported in this 19(a) Notice are only estimates and not for tax reporting purposes. The
actual amounts and sources of the amounts for tax reporting purposes will depend upon the Fund’s investment experience during
the remainder of its fiscal year and may be subject to changes based on tax regulations. The Fund will send you a Form 1099-DIV
for the calendar year that will tell you how to report these distributions for federal income tax purposes. The Fund estimates
that it has distributed more than its income and net realized capital gains; therefore, a portion of your distribution may be
a return of capital. A return of capital may occur for example, when some or all of the money that you invested in the Fund is
paid back to you. A return of capital distribution does not necessarily reflect the Fund’s investment performance and should
not be confused with ‘yield’ or ‘income.’
Presented
below are return figures, based on the change in the Fund’s Net Asset Value per share (“NAV”), compared to the
annualized distribution rate for this current distribution as a percentage of the NAV on the last business day of the month prior
to distribution record date.
| Fund Performance
& Distribution Information |
|
| |
|
| Fiscal Year to Date (11/01/2022
through 12/31/2022) |
|
| Annualized Distribution Rate as
a Percentage of NAV^ |
9.99% |
| Cumulative Distribution Rate on
NAV^+ |
4.08% |
| Cumulative Total Return on NAV* |
-3.37% |
| Average Annual Total Return
on NAV for the 5 Year Period Ending 12/31/2022** |
-2.03% |
Past
performance is not indicative of future results.
| ^ | Based
on the Fund’s NAV as of December 31, 2022. |
| + | Cumulative
distribution rate is based on distributions paid to date for the period November 1, 2022 through January 31, 2023. |
| * | Cumulative
fiscal year-to-date return is based on the change in NAV including distributions paid and assuming reinvestment of these distributions
and that all rights in the Fund’s rights offering were exercised, for the period November 1, 2022 through December 31, 2022. |
| ** | The
5 year average annual total return is based on change in NAV including distributions paid and assuming reinvestment of these distributions
and that all rights in the Fund’s rights offering were exercised, as of the last business day of the month prior to the
month of the current distribution record date. |
While
the NAV performance may be indicative of the Fund’s investment performance, it does not measure the value of a shareholder’s
investment in the Fund. The value of a shareholder’s investment in the Fund is determined by the Fund’s market price,
which is based on the supply and demand for the Fund’s shares in the open market.
Shareholders
should not draw any conclusions about the Fund’s investment performance from the amount of this distribution or from the
terms of the Fund’s Managed Distribution Plan.
Furthermore,
the Board of Trustees reviews the amount of any potential distribution and the income, capital gain or capital available. The
Board of Trustees will continue to monitor the Fund’s distribution level, taking into consideration the Fund’s net
asset value and the financial market environment. The Fund’s distribution policy is subject to modification by the Board
of Trustees at any time. The distribution rate should not be considered the dividend yield or total return on an investment in
the Fund.
ALPS
Portfolio Solutions Distributor, Inc. FINRA Member Firm.
CLOUGH
GLOBAL OPPORTUNITIES FUND SECTION 19(a) NOTICE
Statement
Pursuant to Section 19(a) of the Investment Company Act of 1940
Denver,
Colorado – February 28, 2023 - Today, the Clough Global Opportunities Fund (NYSE MKT: GLO) (the “Fund”),
a closed-end fund, paid a monthly distribution on its common stock of $0.0483 per share to shareholders of record at the close
of business on February 17, 2023.
The
following table sets forth the estimated amount of the sources of distribution for purposes of Section 19 of the Investment Company
Act of 1940, as amended, and the related rules adopted thereunder. The Fund estimates the following percentages, of the total
distribution amount per share, attributable to (i) current and prior fiscal year net investment income, (ii) net realized short-term
capital gain, (iii) net realized long-term capital gain and (iv) return of capital or other capital source as a percentage of
the total distribution amount. These percentages are disclosed for the current distribution as well as the fiscal year-to-date
cumulative distribution amount per share for the Fund.
| Current
Distribution from: |
|
|
| |
Per
Share ($) |
% |
| Net Investment Income |
0.0000 |
0.00% |
| Net Realized Short-Term Capital
Gain |
0.0000 |
0.00% |
| Net Realized Long-Term Capital
Gain |
0.0000 |
0.00% |
| Return of Capital or other Capital
Source |
0.0483 |
100.00% |
| Total (per common share) |
0.0483 |
100.00% |
| Fiscal Year-to-Date
Cumulative Distributions from: |
|
|
| |
Per
Share ($) |
% |
| Net Investment Income |
0.0000 |
0.00% |
| Net Realized Short-Term Capital
Gain |
0.0000 |
0.00% |
| Net Realized Long-Term Capital
Gain |
0.0000 |
0.00% |
| Return of Capital or other Capital
Source |
0.2852 |
100.00% |
| Total (per common share) |
0.2852 |
100.00% |
The
amounts and sources of distributions reported in this 19(a) Notice are only estimates and not for tax reporting purposes. The
actual amounts and sources of the amounts for tax reporting purposes will depend upon the Fund’s investment experience during
the remainder of its fiscal year and may be subject to changes based on tax regulations. The Fund will send you a Form 1099-DIV
for the calendar year that will tell you how to report these distributions for federal income tax purposes. The Fund estimates
that it has distributed more than its income and net realized capital gains; therefore, a portion of your distribution may be
a return of capital. A return of capital may occur for example, when some or all of the money that you invested in the Fund is
paid back to you. A return of capital distribution does not necessarily reflect the Fund’s investment performance and should
not be confused with ‘yield’ or ‘income.’
Presented
below are return figures, based on the change in the Fund’s Net Asset Value per share (“NAV”), compared to the
annualized distribution rate for this current distribution as a percentage of the NAV on the last business day of the month prior
to distribution record date.
| Fund Performance
& Distribution Information |
|
| |
|
| Fiscal Year to Date (11/01/2022
through 1/31/2023) |
|
| Annualized Distribution Rate as
a Percentage of NAV^ |
9.92% |
| Cumulative Distribution Rate on
NAV^+ |
4.88% |
| Cumulative Total Return on NAV* |
-1.77% |
| Average Annual Total Return
on NAV for the 5 Year Period Ending 1/31/2023** |
-2.72% |
Past
performance is not indicative of future results.
| ^ | Based
on the Fund’s NAV as of January 31, 2023. |
| + | Cumulative
distribution rate is based on distributions paid to date for the period November 1, 2022 through February 28, 2023. |
| * | Cumulative
fiscal year-to-date return is based on the change in NAV including distributions paid and assuming reinvestment of these distributions
and that all rights in the Fund’s rights offering were exercised, for the period November 1, 2022 through January 31, 2023. |
| ** | The
5 year average annual total return is based on change in NAV including distributions paid and assuming reinvestment of these distributions
and that all rights in the Fund’s rights offering were exercised, as of the last business day of the month prior to the
month of the current distribution record date. |
While
the NAV performance may be indicative of the Fund’s investment performance, it does not measure the value of a shareholder’s
investment in the Fund. The value of a shareholder’s investment in the Fund is determined by the Fund’s market price,
which is based on the supply and demand for the Fund’s shares in the open market.
Shareholders
should not draw any conclusions about the Fund’s investment performance from the amount of this distribution or from the
terms of the Fund’s Managed Distribution Plan.
Furthermore,
the Board of Trustees reviews the amount of any potential distribution and the income, capital gain or capital available. The
Board of Trustees will continue to monitor the Fund’s distribution level, taking into consideration the Fund’s net
asset value and the financial market environment. The Fund’s distribution policy is subject to modification by the Board
of Trustees at any time. The distribution rate should not be considered the dividend yield or total return on an investment in
the Fund.
ALPS
Portfolio Solutions Distributor, Inc. FINRA Member Firm.
CLOUGH
GLOBAL OPPORTUNITIES FUND SECTION 19(a) NOTICE
Statement
Pursuant to Section 19(a) of the Investment Company Act of 1940
Denver,
Colorado – March 31, 2023 - Today, the Clough Global Opportunities Fund (NYSE MKT: GLO) (the “Fund”), a
closed-end fund, paid a monthly distribution on its common stock of $0.0483 per share to shareholders of record at the close of
business on March 17, 2023.
The
following table sets forth the estimated amount of the sources of distribution for purposes of Section 19 of the Investment Company
Act of 1940, as amended, and the related rules adopted thereunder. The Fund estimates the following percentages, of the total
distribution amount per share, attributable to (i) current and prior fiscal year net investment income, (ii) net realized short-term
capital gain, (iii) net realized long-term capital gain and (iv) return of capital or other capital source as a percentage of
the total distribution amount. These percentages are disclosed for the current distribution as well as the fiscal year-to-date
cumulative distribution amount per share for the Fund.
| Current
Distribution from: |
|
|
| |
Per
Share ($) |
% |
| Net Investment Income |
0.0000 |
0.00% |
| Net Realized Short-Term Capital
Gain |
0.0000 |
0.00% |
| Net Realized Long-Term Capital
Gain |
0.0000 |
0.00% |
| Return of Capital or other Capital
Source |
0.0483 |
100.00% |
| Total (per common share) |
0.0483 |
100.00% |
| Fiscal Year-to-Date
Cumulative Distributions from: |
|
|
| |
Per
Share ($) |
% |
| Net Investment Income |
0.0000 |
0.00% |
| Net Realized Short-Term Capital
Gain |
0.0000 |
0.00% |
| Net Realized Long-Term Capital
Gain |
0.0000 |
0.00% |
| Return of Capital or other Capital
Source |
0.3335 |
100.00% |
| Total (per common share) |
0.3335 |
100.00% |
The
amounts and sources of distributions reported in this 19(a) Notice are only estimates and not for tax reporting purposes. The
actual amounts and sources of the amounts for tax reporting purposes will depend upon the Fund’s investment experience during
the remainder of its fiscal year and may be subject to changes based on tax regulations. The Fund will send you a Form 1099-DIV
for the calendar year that will tell you how to report these distributions for federal income tax purposes. The Fund estimates
that it has distributed more than its income and net realized capital gains; therefore, a portion of your distribution may be
a return of capital. A return of capital may occur for example, when some or all of the money that you invested in the Fund is
paid back to you. A return of capital distribution does not necessarily reflect the Fund’s investment performance and should
not be confused with ‘yield’ or ‘income.’
Presented
below are return figures, based on the change in the Fund’s Net Asset Value per share (“NAV”), compared to the
annualized distribution rate for this current distribution as a percentage of the NAV on the last business day of the month prior
to distribution record date.
| Fund Performance
& Distribution Information |
|
| |
|
| Fiscal Year to Date (11/01/2022
through 2/28/2023) |
|
| Annualized Distribution Rate as
a Percentage of NAV^ |
10.37% |
| Cumulative Distribution Rate on
NAV^+ |
5.97% |
| Cumulative Total Return on NAV* |
-5.06% |
| Average Annual Total Return
on NAV for the 5 Year Period Ending 2/28/2023** |
-2.89% |
Past
performance is not indicative of future results.
| ^ | Based
on the Fund’s NAV as of February 28, 2023. |
| + | Cumulative
distribution rate is based on distributions paid to date for the period November 1, 2022 through March 31, 2023. |
| * | Cumulative
fiscal year-to-date return is based on the change in NAV including distributions paid and assuming reinvestment of these distributions
and that all rights in the Fund’s rights offering were exercised, for the period November 1, 2022 through February 28, 2023. |
| ** | The
5 year average annual total return is based on change in NAV including distributions paid and assuming reinvestment of these distributions
and that all rights in the Fund’s rights offering were exercised, as of the last business day of the month prior to the
month of the current distribution record date. |
While
the NAV performance may be indicative of the Fund’s investment performance, it does not measure the value of a shareholder’s
investment in the Fund. The value of a shareholder’s investment in the Fund is determined by the Fund’s market price,
which is based on the supply and demand for the Fund’s shares in the open market.
Shareholders
should not draw any conclusions about the Fund’s investment performance from the amount of this distribution or from the
terms of the Fund’s Managed Distribution Plan.
Furthermore,
the Board of Trustees reviews the amount of any potential distribution and the income, capital gain or capital available. The
Board of Trustees will continue to monitor the Fund’s distribution level, taking into consideration the Fund’s net
asset value and the financial market environment. The Fund’s distribution policy is subject to modification by the Board
of Trustees at any time. The distribution rate should not be considered the dividend yield or total return on an investment in
the Fund.
ALPS
Portfolio Solutions Distributor, Inc. FINRA Member Firm.
CLOUGH
GLOBAL OPPORTUNITIES FUND SECTION 19(a) NOTICE
Statement
Pursuant to Section 19(a) of the Investment Company Act of 1940
Denver,
Colorado – April 28, 2023 - Today, the Clough Global Opportunities Fund (NYSE American: GLO) (the “Fund”),
a closed-end fund, paid a monthly distribution on its common stock of $0.0483 per share to shareholders of record at the close
of business on April 21, 2023.
The
following table sets forth the estimated amount of the sources of distribution for purposes of Section 19 of the Investment Company
Act of 1940, as amended, and the related rules adopted thereunder. The Fund estimates the following percentages, of the total
distribution amount per share, attributable to (i) current and prior fiscal year net investment income, (ii) net realized short-term
capital gain, (iii) net realized long-term capital gain and (iv) return of capital or other capital source as a percentage of
the total distribution amount. These percentages are disclosed for the current distribution as well as the fiscal year-to-date
cumulative distribution amount per share for the Fund.
| Current
Distribution from: |
|
|
| |
Per
Share ($) |
% |
| Net Investment Income |
0.00000 |
0.00% |
| Net Realized Short-Term Capital
Gain |
0.00000 |
0.00% |
| Net Realized Long-Term Capital
Gain |
0.00000 |
0.00% |
| Return of Capital or other Capital
Source |
0.04830 |
100.00% |
| Total (per common share) |
0.04830 |
100.00% |
| Fiscal Year-to-Date
Cumulative Distributions from: |
|
|
| |
Per
Share ($) |
% |
| Net Investment Income |
0.00000 |
0.00% |
| Net Realized Short-Term Capital
Gain |
0.00000 |
0.00% |
| Net Realized Long-Term Capital
Gain |
0.00000 |
0.00% |
| Return of Capital or other Capital
Source |
0.38180 |
100.00% |
| Total (per common share) |
0.38180 |
100.00% |
The
amounts and sources of distributions reported in this 19(a) Notice are only estimates and not for tax reporting purposes. The
actual amounts and sources of the amounts for tax reporting purposes will depend upon the Fund’s investment experience during
the remainder of its fiscal year and may be subject to changes based on tax regulations. The Fund will send you a Form 1099-DIV
for the calendar year that will tell you how to report these distributions for federal income tax purposes. The Fund estimates
that it has distributed more than its income and net realized capital gains; therefore, a portion of your distribution may be
a return of capital. A return of capital may occur for example, when some or all of the money that you invested in the Fund is
paid back to you. A return of capital distribution does not necessarily reflect the Fund’s investment performance and should
not be confused with ‘yield’ or ‘income.’
Presented
below are return figures, based on the change in the Fund’s Net Asset Value per share (“NAV”), compared to the
annualized distribution rate for this current distribution as a percentage of the NAV on the last business day of the month prior
to distribution record date.
| Fund Performance
& Distribution Information |
|
| |
|
| Fiscal Year to Date (11/01/2022
through 3/31/2023) |
|
| Annualized
Distribution Rate as a Percentage of NAV^ |
10.13% |
| Cumulative
Distribution Rate on NAV^+ |
6.67% |
| Cumulative
Total Return on NAV* |
-1.90% |
| Average Annual Total Return
on NAV for the 5 Year Period Ending 3/31/2023** |
-2.05% |
Past
performance is not indicative of future results.
| ^ | Based
on the Fund’s NAV as of March 31, 2023. |
| + | Cumulative
distribution rate is based on distributions paid to date for the period November 1, 2022
through April 30, 2023. |
| * | Cumulative
fiscal year-to-date return is based on the change in NAV including distributions paid
and assuming reinvestment of these distributions and that all rights in the Fund’s
rights offering were exercised, for the period November 1, 2022 through March 31, 2023. |
| ** | The
5 year average annual total return is based on change in NAV including distributions
paid and assuming reinvestment of these distributions and that all rights in the Fund’s
rights offering were exercised, as of the last business day of the month prior to the
month of the current distribution record date. |
While
the NAV performance may be indicative of the Fund’s investment performance, it does not measure the value of a shareholder’s
investment in the Fund. The value of a shareholder’s investment in the Fund is determined by the Fund’s market price,
which is based on the supply and demand for the Fund’s shares in the open market.
Shareholders
should not draw any conclusions about the Fund’s investment performance from the amount of this distribution or from the
terms of the Fund’s Managed Distribution Plan.
Furthermore,
the Board of Trustees reviews the amount of any potential distribution and the income, capital gain or capital available. The
Board of Trustees will continue to monitor the Fund’s distribution level, taking into consideration the Fund’s net
asset value and the financial market environment. The Fund’s distribution policy is subject to modification by the Board
of Trustees at any time. The distribution rate should not be considered the dividend yield or total return on an investment in
the Fund.
Contact
Info:
Website:
https://www.cloughglobal.com/
Email:
cloughclientinquiries@paralel.com
Clough Global Opportunit... (AMEX:GLO)
Graphique Historique de l'Action
De Mar 2024 à Avr 2024

Clough Global Opportunit... (AMEX:GLO)
Graphique Historique de l'Action
De Avr 2023 à Avr 2024
