Dogecoin Price May Explode By 10,200% Based On Classic Chart Pattern: Expert
12 Novembre 2024 - 4:00PM
NEWSBTC
Henrik Zeberg, a prominent macroeconomist known for his expertise
in business cycles and Head Macro Economist at Swissblock, released
a technical analysis for the Dogecoin price by popular demand.
Within the monthly chart of DOGE/USD, Zeberg highlights potential
future prices based on Fibonacci extensions and a specific chart
pattern known as the “Rounding Bottom.” Will Dogecoin Price Hit
$29? Zeberg’s technical approach draws heavily on the historical
performance of Dogecoin, suggesting that its price might follow a
bullish trajectory mirrored in previous cycles. In his analysis, he
points out, “DOGE seems to develop a Rounding Bottom structure in
each Cycle. We observe how each cycle has produced higher and
higher levels into the Euphoria phase.” The Rounding Bottom is a
proven chart pattern often seen in financial markets which signals
a reversal or a significant shift from a downward trend to an
upward trend. The pattern is recognized by its gradual, rounded
recovery from a low point, resembling the shape of a bowl or a
saucer. This pattern indicates a slow and steady accumulation phase
among buyers, followed by a gradual increase in price and demand.
Related Reading: Dogecoin Price To $1 Soon? Textbook Weekly Golden
Cross Shows What’s Coming Next The formation of a Rounding Bottom
begins when an asset hits a new low and then slowly starts to
recover, with buyers gradually entering the market, wary of the
downtrend but starting to gain confidence as prices stabilize. As
the asset’s price ascends, it reflects increased buying pressure
and a decline in selling pressure, suggesting a shift in market
sentiment from bearish to bullish. To confirm a Rounding Bottom,
the price must break through the resistance level that initially
led to the pattern’s formation, often marked by the highest point
of the curve before the asset’s price began to fall. For the
Dogecoin price, this is the price level around $0.49 which Zeberg
identifies as the first price target. The breakout typically needs
to be accompanied by an increase in volume and can signal a
long-term bullish trend. If DOGE manages to break this resistance
in the coming days, the future could be massively bullish. Related
Reading: Dogecoin Descending Triangle Could Hint At Next
Destination For DOGE Zeberg utilized Fibonacci levels to provide
specific future price targets for Dogecoin. The Fibonacci extension
levels specifically marked on the chart for Dogecoin include the
1.27 Fib ($0.4924) which Zeberg labels as target 1 with a potential
gain of 75%. The next price target for the Dogecoin price is the
1.618 Fib at $0.08030 which is referred to as target 2 with an
anticipated increase of 180% by Zeberg. The 2.618 Fib at $3.2738 is
marked as target 3, an ambitious goal representing an 8x increase.
Moreover, the 3.618 Fib at $13.3641 and 4.618 at $54.4064 are also
marked, though not explicitly linked to immediate targets,
indicating very optimistic long-term possibilities should the
market enter another phase of euphoria akin to past cycles. In
discussing these targets, Zeberg cautions, “Could we see even more
crazy development? Nothing is certain – but the setup looks like a
repetition of what we have seen in earlier phases.” This statement
refers to Zeberg’s main target for this bull run, which stands
between the 3.618 and 4.618 Fibonacci levels at $29, assuming the
entire market remains in a mania phase for an extended period. In
this scenario, Dogecoin would achieve a gain of 10,200%. At press
time, DOGE traded at $0.41. Featured image created with DALL.E,
chart from TradingView.com
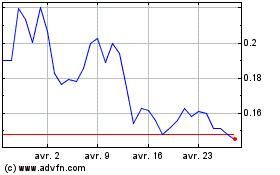
Dogecoin (COIN:DOGEUSD)
Graphique Historique de l'Action
De Déc 2024 à Jan 2025

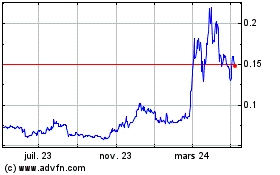
Dogecoin (COIN:DOGEUSD)
Graphique Historique de l'Action
De Jan 2024 à Jan 2025
