The current geographical profile of Group profits before
exceptional items at current local rates of tax would result in an
underlying blended tax rate of just under 29%. However, there are
still tax losses in the USA with a current tax value of GBP2.2
million and in the UK with a current tax value of GBP0.3 million,
not yet recognised in the balance sheet. The opportunity to
recognise and utilise these as profitability is sustained and
improves, will suppress the actual tax rate for some time to
come.
Profit for the year
Net profit for the year was down 8.5% to GBP3.7 million (2013:
GBP4.1 million). However, this was after charging GBP1.9 million
(2013: GBP1.3 million) in respect of exceptional items, with the
current year element all relating to the investment and consequent
restructuring in our manufacturing facilities in Wales and GBP0.1
million in respect of the new LTIP scheme (2013: nil).
Earnings per share and dividends
Basic earnings per share were 5.2p (2013: 6.0p). After removing
the effect of exceptional items, the adjusted earnings per share
increased to 8.5p (2013: 8.1p) representing an increase of
4.9%.
Employee share options of 1.8 million had vested but not yet
been exercised as at 31 March 2014. As these are exercised,
earnings per share will trend towards the fully diluted level and
the Company targets growth in this fully diluted metric (before
exceptional items) as a primary goal. In addition the Company
introduced a new long term incentive plan during the year and this
approach of targeting fully diluted earnings per share (before
exceptional items) will accommodate that scheme as and when any of
the new "performance shares" vest. Details of share plans can be
found in note 25 to the financial statements. Fully diluted
earnings per share (stated before exceptional items) were 8.3p, up
6.4% on the prior year (2013: 7.8p), and ahead of plan.
No dividend was paid during the year (2013: GBPnil) and the
Board does not propose a final dividend for the year. The other
primary focus remains the reduction of leverage from the current
level of 2.4 times EBITDA (2013: 2.8 times) to below 2.0 times
EBITDA. At this point, the Board will consider whether it is
appropriate to resume dividends.
Balance sheet and cash flow
Net debt at 31 March 2014 was much improved at GBP36.9 million
(2013: GBP42.1 million) and leverage fell accordingly to 2.4 times
from 2.8 times in the prior year. Weaker exchange rates helped in
this regard and net debt at like for like rates would have been
GBP1.4 million higher. Nonetheless this is a very strong
performance and well ahead of our plan in a year in which capital
expenditure of GBP8.3 million (2013: GBP1.9 million) exceeded
depreciation by GBP3.3 million. Notes 17 and 26 to the financial
statements provide further information.
Year-end net debt included amounts denominated in US Dollars of
$25.5 million (2013: $22.6 million) and in Euros of EUR5.8 million
(2013: EUR12.4 million). The year-end exchange rates were $1.67
(2013: $1.52) and EUR1.21 (2012: EUR1.19). Allowing for this, debt
stated at constant exchange rates would have been GBP1.4 million
higher.
Working capital management continues to be a priority.
Outstanding debtors are monitored closely, both to maximise cash
but also to reduce our credit risk. Trade debtors reduced to
GBP16.1 million (2013: GBP18.8 million) at the year end, more than
reversing last year's increase, which related to specific customer
circumstances but in the 2013/14 year also reflecting lower Q4
sales in the USA following the extraordinarily adverse weather
conditions.
The charge for bad and doubtful debts in the year was GBP0.1
million or less than 0.1% of turnover.
Net stock levels after provisioning for older stock reduced by
3.3% from GBP50.1 million to GBP48.5 million. Stock levels only
increased in the USA, again related to lower sales as a result of
the poor weather conditions in Q4.
Older stock (measured as over 15 months since last purchase)
increased slightly from GBP5.1 million to GBP5.8 million (at March
2014 exchange rates) but provisioning remains adequate and our
businesses consistently achieve in excess of 100% recovery against
written down values of old stock.
Group cash generated from operations was more than double that
of the prior year at GBP15.2 million (2013: GBP7.5 million),
reflecting full conversion of operating profits into cash flow and
assisted by a small net reduction in working capital of GBP0.7
million (2013: increase of GBP5.7 million).
As noted above, investment in capital expenditure was very
substantial at GBP8.3 million (2013: GBP1.9 million), well above
depreciation and the prior year. This reflects the investment in
two new state-of-the-art printing presses and associated facilities
at our gift wrap manufacturing operation in Wales, matching the
equivalent capability installed in Europe in 2012 that is now
yielding such strong results. During the year we also invested in
further automation at our manufacturing facilities in China and the
USA, which mitigates against the twin challenges of availability
and cost of labour.
The investment in Wales is consolidating our operations, and we
anticipate one of our three current sites will then become
available for sale later in the 2014/15 year. The net book value of
this site is GBP1.25 million. In addition the Company is in the
second of a five-year period by which a company has the option to
purchase part of another under utilised site (net book value GBP0.8
million) for a price of GBP2.4 million. This is also generating
premium income of GBP0.1 million p.a. over the option period,
recognised within other operating income.
Equity attributable to shareholders has increased to GBP53.5
million from GBP51.9 million predominantly reflecting profits
generated in the year.
Risks and key performance indicators
Our areas of primary focus are:
        *    improved earnings attributable to shareholders, which
             we aim to achieve through top line growth and mix
             management in selected markets and channels together
             with strong cost and gross margin management; and

              *    lower leverage measured as the ratio of net debt to
                   pre-exceptional EBITDA, which we aim to achieve
                   through improved profitability together with close
                   management of our working capital.
Operationally this means a focus on:
        *    nurturing valuable relationships: monitoring the
             profitability, product mix and service delivered in
             respect of our customer base; growing those
             relationships in existing and new territories and
             product categories;

        *    creating a toolbox of expertise: ensuring that we
             have market leading design and product capability in
             our categories, sharing knowledge through common
             platforms;

        *    providing best quality, value and service: monitoring
             and benchmarking the key elements of our cost bases,
             buying or manufacturing as efficiently and
             effectively as possible from a total cost perspective
             across the whole season so that we can deliver great
             value to customers and strong returns to
             shareholders;

        *    balancing our business: we monitor the mix and
             profitability in each of our businesses across season,
             brand and product categories, seeking out those
             opportunities that yield the best returns on our
             scarce capital while rooting out those activities
             that consume resources for little or no gain; and

        *    providing differentiated product offerings: across
             the value, mass and upscale markets.
Foreign Exchange Impact to Profit and Earnings
Our diverse geographical revenue and profit streams continue to
provide us with market resilience but naturally this carries with
it the volatility of currency. As noted above in the context of net
debt, foreign exchange rates impacted significantly in the year on
the translation of our overseas figures relative to prior years
with the US dollar rate moving 10% from 1.52 to 1.67 during the
year and the Australian dollar rate moving 23% from 1.46 to 1.80.
The movement in the Euro rate was more muted at 1.19 to 1.21. This
change in rates placed some pressure on profit against planned
outcomes although this was manageable within 2013/14. However, if
we assume that the significantly weaker rates at the end of the
year continue through calendar 2014, the impact will be more
material in next year's results through the translation of overseas
earnings.
Treasury operations
The Group operates with four supportive bankers, each addressing
one of our geographic segments. The Group's principal bank has
recently extended additional facilities to support the capital
programme in Wales, now almost complete. Current global facilities
comprise:
        *    term facilities at Group level in Sterling and USD,
             repayable in tranches with bullets in May 2016;

        *    leasing facilities for seven and five years
             respectively in the UK and Netherlands for key plant
             and machinery;

        *    asset backed facilities secured on the stock and
             debtors of the relevant operating businesses in each
             segment, all of which have at least one more year to
             run and are usually renewed for two to three years at
             a time; and

        *    a revolving multi-currency credit facility and
             overdraft to manage peak working capital
             requirements; these are renewed in May annually.
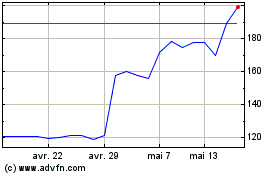
Ig Design (LSE:IGR)
Graphique Historique de l'Action
De Juin 2024 à Juil 2024

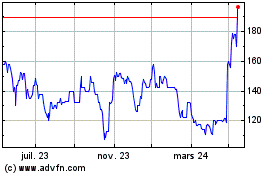
Ig Design (LSE:IGR)
Graphique Historique de l'Action
De Juil 2023 à Juil 2024
