Filed by Captivision Inc.
Pursuant to Rule 425 of the Securities Act of 1933
and deemed filed pursuant to Rule 14a-12
of the Securities Exchange Act of 1934
Subject Company: Jaguar Global Growth Corporation I
Commission File No.: 001-41284
UNITED STATES
SECURITIES
AND EXCHANGE COMMISSION
WASHINGTON, D.C. 20549
FORM 8-K/A
Amendment
No. 1
CURRENT REPORT
PURSUANT
TO SECTION 13 OR 15(d)
OF THE SECURITIES EXCHANGE ACT OF 1934
Date of Report (Date of earliest event reported): August 28, 2023 (August 23, 2023)
JAGUAR GLOBAL GROWTH CORPORATION I
(Exact Name of Registrant as Specified in Charter)
|
|
|
|
|
| Cayman Islands |
|
001-41284 |
|
98-1593783 |
(State or Other Jurisdiction
of Incorporation) |
|
(Commission
File Number) |
|
(IRS Employer
Identification No.) |
|
| 601 Brickell Key Drive, |
| Suite 700 Miami, Florida |
| 33131 |
| (Address of Principal Executive Offices)
(Zip Code) |
(646) 663-4945
(Registrant’s Telephone Number, Including Area Code)
Not Applicable
(Former
Name or Former Address, if Changed Since Last Report)
Check the appropriate box below
if the Form 8-K filing is intended to simultaneously satisfy the filing obligation of the registrant under any of the following provisions:
| ☒ |
Written communications pursuant to Rule 425 under the Securities Act (17 CFR 230.425) |
| ☐ |
Soliciting material pursuant to Rule 14a-12 under the Exchange Act (17 CFR 240.14a-12) |
| ☐ |
Pre-commencement communications pursuant to Rule 14d-2(b) under the Exchange Act (17 CFR 240.14d-2(b))
|
| ☐ |
Pre-commencement communications pursuant to Rule 13e-4(c) under the Exchange Act (17 CFR 240.13e 4(c))
|
Securities registered pursuant to Section 12(b) of the Act:
|
|
|
|
|
| Title of each class |
|
Trading
Symbol(s) |
|
Name of each exchange
on which registered |
| Units, each consisting of one Class A ordinary share, one right and one-half of one redeemable warrant |
|
JGGCU |
|
The Nasdaq Stock Market LLC |
| Class A ordinary shares, par value $0.0001 per share |
|
JGGC |
|
The Nasdaq Stock Market LLC |
| Rights entitling the holder thereof to receive one-twelfth (1/12) of one Class A ordinary share of JGGC |
|
JGGCR |
|
The Nasdaq Stock Market LLC |
| Redeemable warrants, each whole warrant exercisable for one Class A ordinary share at an exercise price of $11.50 |
|
JGGCW |
|
The Nasdaq Stock Market LLC |
Indicate by check mark whether the registrant is an emerging growth company as defined in Rule 405 of the Securities Act of
1933 (§230.405 of this chapter) or Rule 12b-2 of the Securities Exchange Act of 1934 (§240.12b-2 of this chapter).
Emerging growth company
☒
If an emerging growth company, indicate by check mark if the registrant has elected not to use the extended transition period for complying with
any new or revised financial accounting standards provided pursuant to Section 13(a) of the Exchange Act. ☐
Explanatory Note
On August 28, 2023, Jaguar Global Growth Corporation I filed a Current Report on Form 8-K dated
August 25, 2023 (the “Original 8-K”) with the Securities and Exchange Commission. This current report on
Form 8-K/A (the “Amendment”) is being filed solely because an incorrect version of the Management Presentation was inadvertently filed as Exhibit 99.2 to the Original 8-K. The correct Management Presentation is filed as Exhibit 99.2 hereto and supersedes and replaces in its entirety the Management Presentation filed as Exhibit 99.2 to the Original 8-K.
This Amendment contains only the Cover Page to this
Form 8-K/A, this Explanatory Note, Item 9.01, the Signature Page and the correct Exhibit 99.2.
| Item 9.01. |
Financial Statements and Exhibits |
|
|
|
| Exhibit
No. |
|
Exhibit |
|
|
| 99.2* |
|
Revised Management Presentation as of August 2023. |
|
|
| 104 |
|
Cover Page Interactive Data File (embedded within the Inline XBRL document). |
| * |
Furnished but not filed. |
SIGNATURE
Pursuant to the requirements of the Securities Exchange Act of 1934, the registrant has duly caused this report to be signed on its behalf by
the undersigned hereunto duly authorized.
Dated: August 28, 2023
|
|
|
| JAGUAR GLOBAL GROWTH CORPORATION I |
|
|
| By: |
|
/s/ Anthony R. Page |
|
|
Name: Anthony R. Page |
|
|
Title: Chief Financial Officer |

Exhibit 99.2 Investor Presentation August 2023
DISCLAIMER This presentation (this “Presentation”) is
provided for informational purposes only and has been prepared to assist interested parties in making their own evaluation with respect to a potential business combination among GLAAM Co., Ltd. (together with its subsidiaries, GLAAM or the Company
), Captivision Inc. ( New PubCo ) and Jaguar Global Growth Corporation I ( Jaguar or SPAC ) and related transactions (the Potential Business Combination ) and for no other purpose. This presentation supersedes and replaces all previous oral or
written communications between the parties hereto relating to the subject matter hereof. This Presentation and any oral statements made in connection with this Presentation do not constitute an offer to sell or exchange, or a solicitation of an
offer to buy or exchange, or a recommendation to purchase, any securities in any jurisdiction, or the solicitation of any proxy, vote, consent or approval in any jurisdiction with respect to any securities or in connection with the Potential
Business Combination. The securities to which this Presentation relate have not been registered under the US Securities Act of 1933, as amended (the “Securities Act”), or the securities laws of any other jurisdiction. Any offer to sell
securities, if made, would be made only pursuant to a definitive subscription agreement and in reliance upon an exemption from, or in a transaction not subject to, the registration requirements of the Securities Act not involving any public
offering. Jaguar, the Company and New PubCo reserve the right to amend or terminate discussions with any or all potential investors, to accept or reject any proposals and to negotiate with, or cease negotiations with, any party regarding any
transaction involving Jaguar, the Company and New PubCo for any reason. There shall not be any offer, sale or exchange of any securities of New PubCo, the Company or Jaguar in any jurisdiction where, or to any person to whom, such offer, sale or
exchange may be unlawful under the laws of such jurisdiction prior to registration or qualification under the securities laws of any such jurisdiction. The communication of this Presentation is restricted by law; it is not intended for distribution
to, or use by any person in, any jurisdiction where such distribution or use would be contrary to local law or regulation. The distribution of this Presentation may also be restricted by law and persons into whose possession this Presentation comes
should inform themselves about and observe any such restrictions. The recipient acknowledges that it is: (a) aware that the U.S. securities laws prohibit any person who has material, non-public information concerning a company from purchasing or
selling securities of such company or from communicating such information to any other person under circumstances in which it is reasonably foreseeable that such person is likely to purchase or sell such securities, and (b) familiar with the US
Securities Exchange Act of 1934, as amended, and the rules and regulations promulgated thereunder (collectively, the “Exchange Act”), and that the recipient will neither use, nor cause any third party to use, this Presentation or any
information contained herein in contravention of the Exchange Act, including, without limitation, Rule 10b-5 thereunder. No representations or warranties, express or implied, are given in, or in respect of, this Presentation. None of the Company,
Jaguar or New PubCo has verified, or will verify, any part of this Presentation. This Presentation is subject to updating, completion, revision, verification and further amendment. None of Jaguar, the Company, New PubCo or their respective
affiliates has authorized anyone to provide interested parties with additional or different information. No securities regulatory authority has expressed an opinion about the securities discussed in this Presentation and it is an offense to claim
otherwise. To the fullest extent permitted by law, in no circumstances will Jaguar, the Company, New PubCo or any of their respective subsidiaries, shareholders, affiliates, representatives, partners, directors, officers, employees, advisers or
agents be responsible or liable for any direct, indirect or consequential loss or loss of profit arising from the use of this Presentation, its contents, its omissions, reliance on the information contained within it, or on opinions communicated in
relation thereto or otherwise arising in connection therewith. Recipients of this Presentation are not to construe its contents, or any prior or subsequent communications from or with Jaguar, the Company, New PubCo or their respective
representatives as investment, legal or tax advice. In addition, this Presentation does not purport to be all-inclusive or to contain all of the information that may be required to make a full analysis of Jaguar, the Company, New PubCo or the
Potential Business Combination. Recipients of this Presentation should each make their own independent investigation and evaluation of Jaguar, the Company, New PubCo and the Potential Business Combination and their own assessment of the relevance
and adequacy of the information provided, or made available, by the Company, Jaguar, New PubCo or any of their subsidiaries, shareholders, affiliates, representatives, partners, directors, officers, employees, advisers or agents and should make such
other investigations as they deem necessary. Industry and Market Data In this Presentation, the Company may rely on and refer to certain information and statistics obtained from third-party sources which it believes to be reliable. The Company has
not independently verified the accuracy or completeness of any such third-party information. No representation is made as to the reasonableness of the assumptions made within or the accuracy or completeness of any such third-party information.
Recipients are cautioned not to place undue weight on such information. Forward Looking Statements Certain statements included in this Presentation are not historical facts but are forward-looking statements for purposes of the safe harbor
provisions under the United States Private Securities Litigation Reform Act of 1995. Forward-looking statements generally are accompanied by words such as “believe,” “may,” “will,” “estimate,”
“continue,” “anticipate,” “intend,” “expect,” “should,” “would,” “plan,” “predict,” “potential,” “seem,” “seek,”
“future,” “outlook” and similar expressions that predict or indicate future events or trends or that are not statements of historical matters, but the absence of these words does not mean that a statement is not
forward-looking. These forward-looking statements include, but are not limited to, statements regarding estimates and forecasts of other financial and performance metrics and projections of market opportunity. These statements are based on various
assumptions, whether or not identified in this Presentation, and on the current expectations of the Company’s and Jaguar’s management and are not predictions of actual performance. These forward-looking statements are provided for
illustrative purposes only and are not intended to serve as, and must not be relied on by any investor as, a guarantee, an assurance, a prediction or a definitive statement of factor probability. Actual events and circumstances are difficult or
impossible to predict and may differ from assumptions. PRIVATE AND CONFIDENTIAL // 2
DISCLAIMER (CONT.) Many actual events and circumstances are beyond the
control of New PubCo, Jaguar and the Company. Some important factors that could cause actual results to differ materially from those in any forward-looking statements could include changes in domestic and foreign business, market, financial,
political and legal conditions. These forward-looking statements are subject to a number of risks and uncertainties, including the risks presented elsewhere herein. If any of these risks materialize or our assumptions prove incorrect, actual results
could differ materially from the results implied by these forward-looking statements. You should also carefully consider the risk factors presented elsewhere herein along with the risks and uncertainties described in the “Risk Factors”
section of New PubCo’s registration statement on Form F-4, Jaguar’s Annual Report on Form 10-K, Quarterly Reports on Form 10-Q and other documents filed by Jaguar and/or New PubCo from time to time with the U.S. Securities and Exchange
Commission (the “SEC”). There may be additional risks that none of Jaguar, the Company or New PubCo presently know or that Jaguar, the Company and New PubCo currently believe are immaterial that could also cause actual results to differ
from those contained in the forward-looking statements. You are cautioned not to place undue reliance upon any forward-looking statements. Any forward-looking statement speaks only as of the date on which it was made, based on information available
as of the date of this Presentation, and such information may be inaccurate or incomplete. Jaguar, the Company and New PubCo undertake no obligation to publicly update or revise any forward-looking statement, whether as a result of new information,
future events or otherwise, except as required by law. Information regarding performance by, or businesses associated with, the Company’s management team or businesses associated with them is presented for informational purposes only. Past
performance by the Company’s management team and its affiliates is not a guarantee of future performance. Therefore, you should not rely on the historical record of the performance of the Company’s management team or businesses
associated with them as indicative of the Company’s or New PubCo's future performance of an investment or the returns the Company or New PubCo will, or is likely to, generate going forward. Use of Projections This Presentation contains
projected financial information with respect to the Company. The Company’s independent auditors have not studied, reviewed, compiled or performed any procedures with respect to the projections for the purpose of their inclusion in this
Presentation, and accordingly, no independent auditor has expressed an opinion or provided any other form of assurance with respect thereto for the purpose of this Presentation. These projections are for illustrative purposes only and should not be
relied upon as being necessarily indicative of future results. The assumptions and estimates underlying the projected financial information are inherently uncertain and are subject to a wide variety of significant business, economic and competitive
risks and uncertainties that could cause actual results to differ materially from those contained in the projected financial information. Projections are inherently uncertain due to a number of factors outside of Jaguar’s, the Company's and
New PubCo’s control. While all financial projections, estimates and targets are necessarily speculative, Jaguar, the Company and New PubCo believe that the preparation of projected financial information involves increasingly higher levels of
uncertainty the further out the projection, estimate or target extends from the date of preparation. Accordingly, there can be no assurance that the projected results are indicative of future performance or that actual results will not differ
materially from those presented in the projected financial information. Inclusion of the projected financial information in this Presentation should not be regarded as a representation by any person that the results contained in the projected
financial information will be achieved. Presentation of Financial Data Certain financial information and data contained in this Presentation has not been audited in accordance with Public Company Accounting Oversight Board (“PCAOB”)
standards and may not conform to Regulation S-X promulgated by the SEC. Accordingly, such information and data may not be included in, may be adjusted in, or may be presented differently in any proxy statement, prospectus or other report or document
filed or furnished or to be filed or furnished with the SEC by Jaguar, the Company and/or New PubCo through which the Potential Business Combination will be consummated. Certain historical financial data and financial forecast information of the
Company included in this Presentation has been based on the Company’s audited financial statements for the years ended December 31, 2020 and 2019, in accordance with Korean International Financial Reporting Standards (“IFRS”) as
adopted by the Korean Accounting Standards Board, but such financial data has not been, and will not be, audited in accordance with PCAOB standards and may deviate from financial information audited in accordance with PCAOB standards. In addition,
certain other financial data of the Company included in this Presentation is based on the Company’s internal management accounts that have not been reviewed or audited and are subject to further review and updates. Statement Regarding Non IFRS
Financial Measures Certain financial measures in this Presentation, namely EBITDA, EBITDA Margin, Adjusted EBITDA and Adjusted EBITDA Margin, are not calculated pursuant to U.S. Generally Accepted Accounting Principles (“GAAP”) or IFRS.
These non-IFRS financial measures are in addition to, and not as a substitute for or superior to measures of financial performance prepared in accordance with GAAP or IFRS. There are a number of limitations related to the use of these non-IFRS
financial measures as compared to their nearest GAAP or IFRS equivalents. For example, other companies may calculate non-IFRS financial measures differently or may use other measures to evaluate their performance, all of which could reduce the
usefulness of the non-IFRS financial measures herein as tools for comparison. You should review each of Jaguar’s and the Company’s audited financial statements in accordance with GAAP or IFRS and should not rely on any single financial
measure as part of your evaluation. PRIVATE AND CONFIDENTIAL // 3

DISCLAIMER (CONT.) EBITDA and EBITDA Margin are presented for 2019A and
2020A. The Company defines EBITDA as net income before interest, taxes, depreciation and amortization. The Company defines EBITDA Margin as EBITDA divided by revenue. Adjusted EBITDA and Adjusted EBITDA Margin are presented for 2021A and 2022A. The
Company defines Adjusted EBITDA for such periods as net loss before depreciation and amortization, finance income, finance cost, other income, other expense, corporate income tax benefit, bad debt expense, employee share compensation cost, inventory
disposal, and litigation costs, adjusted for (i) certain non-recurring, infrequent, or unusual items that management believes do not reflect the Company's core operating performance and (ii) certain items that may be recurring, frequent or usual,
but that do not reflect the Company's core operating performance and do not and will not require cash settlement. The Company defines Adjusted EBITDA Margin as Adjusted EBITDA divided by revenue. Please see slide 49 for reconciliations to the
nearest IFRS measures. The Company also presents projections of EBITDA and EBITDA Margin for 2023, 2024 and 2025. The Company believes EBITDA, Adjusted EBITDA, EBITDA Margin and Adjusted EBITDA Margin are useful for investors to use in comparing our
financial performance to other companies and from period to period. Each of these non-IFRS measures have limitations as an analytical tool, and you should not consider them in isolation or as a substitute for analysis of the Company's results as
reported under IFRS. For example, although depreciation expense is a non-cash charge, the assets being depreciated may have to be replaced in the future, and EBITDA and Adjusted EBITDA do not reflect cash capital expenditure requirements for such
replacements or for new asset acquisitions. In addition, Adjusted EBITDA excludes stock-based compensation expense, which has been, and will continue to be for the foreseeable future, a significant recurring expense for the Company's business and an
important part of the Company's compensation strategy. EBITDA and Adjusted EBITDA also do not reflect changes in, or cash requirements for, the Company's working capital needs; interest expense, or the cash requirements necessary to service interest
or principal payments on its debt, which reduces the cash available to it; or tax payments that may represent a reduction in cash available to the Company. This Presentation also includes certain projections of non-IFRS measures. Due to the high
variability, uncertainty and inherent difficulty of making accurate forecasts and projections, including predicting the occurrence and financial impact of certain adjustments, and the periods in which such adjustments may be recognized, the Company
is unable to quantify certain amounts that would be required to be included in the most directly comparable IFRS financial measures without unreasonable effort. Consequently, the Company is not providing a reconciliation of its projected or
forward-looking non-GAAP measures to the most directly comparable measure prepared in accordance with IFRS. For the same reasons, the Company is unable to address the probable significance of the unavailable information, which could be material to
future results. Trademarks Jaguar and the Company own or have rights to various trademarks, service marks and trade names that they use in connection with the operation of their respective businesses. This Presentation may also contain trademarks,
service marks, trade names and copyrights of third-parties, which are the property of their respective owners. The use or display of third-parties’ trademarks, service marks, trade names or products in this Presentation is not intended to, and
does not imply, a relationship with Jaguar or the Company, or an endorsement or sponsorship by or of Jaguar or the Company. Solely for convenience, the trademarks, service marks, trade names and copyrights referred to in this Presentation may appear
without the TM, SM, * or © symbols, but such references are not intended to indicate in any way that Jaguar or the Company will not assert to the fullest extent under applicable law their respective rights or the rights of the applicable
licensor(s) to these trademarks, service marks, trade names and copyrights. Additional Information In connection with the Potential Business Combination described herein, New PubCo has filed a registration statement on Form F-4 (File No. 333-271649)
(the Registration Statement ) with the SEC as amended, which includes a document that serves as a joint preliminary prospectus and proxy statement, referred to as a preliminary proxy statement/prospectus. A definitive proxy statement/prospectus will
be sent to all Jaguar shareholders after the Registration Statement becomes effective. Jaguar and New PubCo have filed and will also file other documents regarding the Potential Business Combination with the SEC. This Presentation does not contain
all the information that should be considered concerning the Potential Business Combination and is not intended to form the basis of any investment decision or any other decision in respect of the Business Combination. Before making any voting or
investment decision, investors, security holders of the Company, Jaguar, and other interested persons are urged to read the Registration Statement, the proxy statement/prospectus and all other relevant documents filed or that will be filed with the
SEC in connection with the Potential Business Combination as they become available because they will contain important information about the Potential Business Combination. Investors and security holders will be able to obtain free copies of the
Registration Statement and all other relevant documents filed or that will be filed with the SEC by Jaguar, the Company and/or New PubCo through the website maintained by the SEC at www.sec.gov. The documents filed by Jaguar, the Company and New
PubCo with the SEC also may be obtained free of charge upon written request to Jaguar at Jaguar Global Growth Corporation I, 601 Brickell Key Drive, Suite 700, Miami, FL 33131. Participants in the Solicitation Jaguar, the Company, New PubCo and
their respective directors and executive officers may be deemed to be participants in the solicitation of proxies from Jaguar’s shareholders in connection with the Potential Business Combination. A list of the names of such directors and
executive officers, and information regarding their interests in the Potential Business Combination and their ownership of Jaguar’s securities are, or will be, contained in Jaguar’s filings with the SEC, and such information and names of
the Company’s directors and executive officers are also in the Registration Statement, which will include the proxy statement of Jaguar. INVESTMENT IN ANY SECURITIES DESCRIBED HEREIN HAS NOT BEEN APPROVED OR DISAPPROVED BY THE SEC OR ANY OTHER
REGULATORY AUTHORITY NOR HAS ANY AUTHORITY PASSED UPON OR ENDORSED THE MERITS OF THE OFFERING OR THE ACCURACY OR ADEQUACY OF THE INFORMATION CONTAINED HEREIN. ANY REPRESENTATION TO THE CONTRARY IS A CRIMINAL OFFENSE. PRIVATE AND CONFIDENTIAL //
4
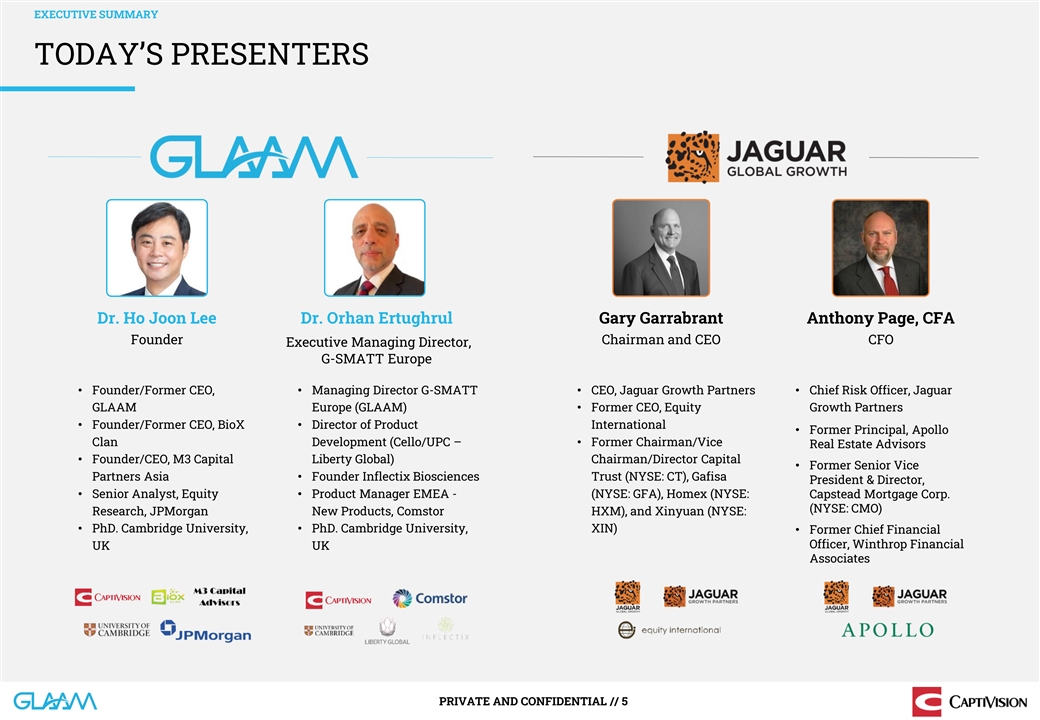
EXECUTIVE SUMMARY TODAY’S PRESENTERS Dr. Ho Joon Lee Dr. Orhan
Ertughrul Gary Garrabrant Anthony Page, CFA Founder Chairman and CEO CFO Executive Managing Director, G-SMATT Europe • Founder/Former CEO, • Managing Director G-SMATT • CEO, Jaguar Growth Partners• Chief Risk Officer, Jaguar
GLAAM Europe (GLAAM)• Former CEO, Equity Growth Partners • Founder/Former CEO, BioX • Director of Product International • Former Principal, Apollo Clan Development (Cello/UPC – • Former Chairman/Vice Real Estate
Advisors • Founder/CEO, M3 Capital Liberty Global) Chairman/Director Capital • Former Senior Vice Partners Asia• Founder Inflectix Biosciences Trust (NYSE: CT), Gafisa President & Director, • Senior Analyst, Equity
• Product Manager EMEA - (NYSE: GFA), Homex (NYSE: Capstead Mortgage Corp. (NYSE: CMO) Research, JPMorgan New Products, Comstor HXM), and Xinyuan (NYSE: • PhD. Cambridge University, • PhD. Cambridge University, XIN) • Former
Chief Financial Officer, Winthrop Financial UK UK Associates PRIVATE AND CONFIDENTIAL // 5

EXECUTIVE SUMMARY GLAAM – A TRUE IT MEDIA PRODUCT Our
Mission… To Turn Buildings into Media Devices Introduction Video PRIVATE AND CONFIDENTIAL // 6
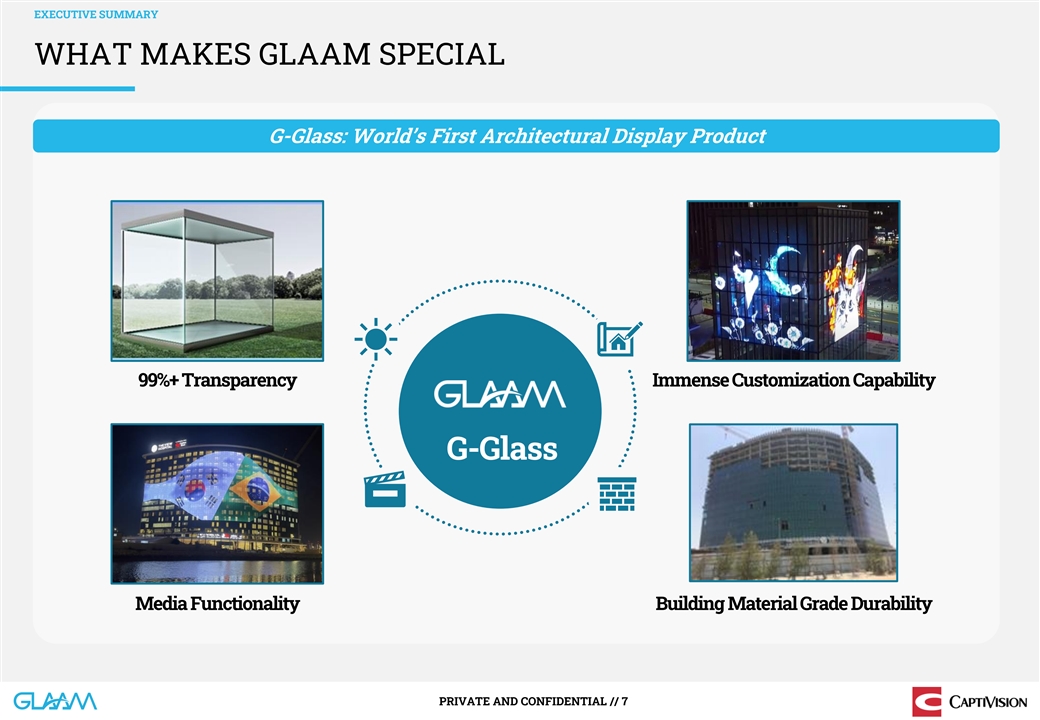
EXECUTIVE SUMMARY WHAT MAKES GLAAM SPECIAL G-Glass: World’s First
Architectural Display Product 99%+ Transparency Immense Customization Capability G-Glass Media Functionality Building Material Grade Durability PRIVATE AND CONFIDENTIAL // 7

EXECUTIVE SUMMARY JAGUAR INVESTMENT THESIS Established & Profitable
Company Strong Pipeline Unique capability of delivering projects of various sizes, including Revenue ($M) EBITDA Margin % 2 Super Large Architectural Media (SLAM) projects $86 2023 2024 38% $52 $45 $29 24% $20 15% $15 $9 15% 6% BUSAN, KOREA BOSTON,
USA INCHEON, KOREA (56%) (110%) 2019A 2020A 2021A 2022A 2023E 2024E 2025E PYEONGTEAK, KOREA MAGOK, KOREA SEOUL LAND, KOREA Global Presence & Potential Continued Growth in DOOH Advertising Market Based upon our Korean sales experience, we
estimate a $1.2 billion revenue Significant additional revenue upside is associated with addressing the 1 potential from our targeted global target markets rapidly growing Digital Out-of-Home (DOOH) advertising market ($ in Millions) 25,008 22,648
19,793 18,033 15,616 14,060 Headquarters Manufacturing Facilities Installations Offices 2020 2021 2022 2023 2024 2025 1. 2021 GDP for Korea and the global target markets were $1.8 billion and $87.8 billion, respectively. Assuming a linear
relationship between G-Glass sales and GDP and extrapolating projected 2023 Korean G-Glass revenues of $24 million to the global target 2 market, we estimate base case total global revenue potential of $1.2 billion per annum; 2. SLAM: Super Large
Architectural Media (20,000-100,000 ft ). Source: PQ Media Global Digital Out-of-Home Media Forecast 2021-2025, World Bank, World Development Indicators, updated 12/22/22. Please see slide 32 for more details on Company financials PRIVATE AND
CONFIDENTIAL // 8
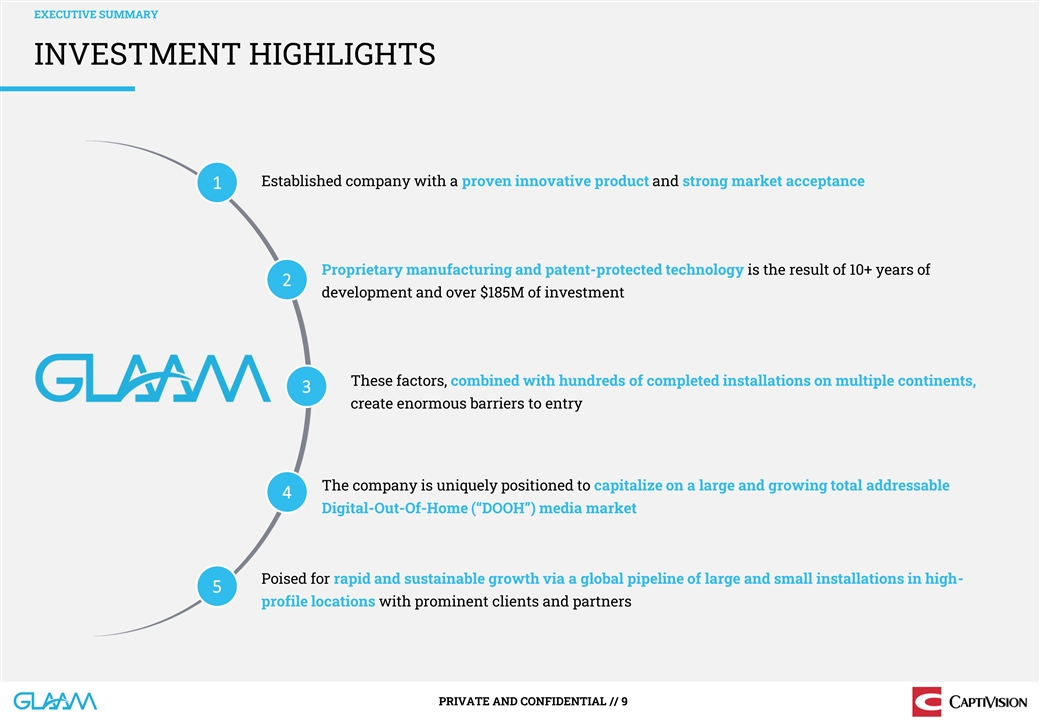
EXECUTIVE SUMMARY INVESTMENT HIGHLIGHTS Established company with a
proven innovative product and strong market acceptance 1 Proprietary manufacturing and patent-protected technology is the result of 10+ years of 2 development and over $185M of investment These factors, combined with hundreds of completed
installations on multiple continents, 3 create enormous barriers to entry The company is uniquely positioned to capitalize on a large and growing total addressable 4 Digital-Out-Of-Home (“DOOH”) media market Poised for rapid and
sustainable growth via a global pipeline of large and small installations in high- 5 profile locations with prominent clients and partners PRIVATE AND CONFIDENTIAL // 9
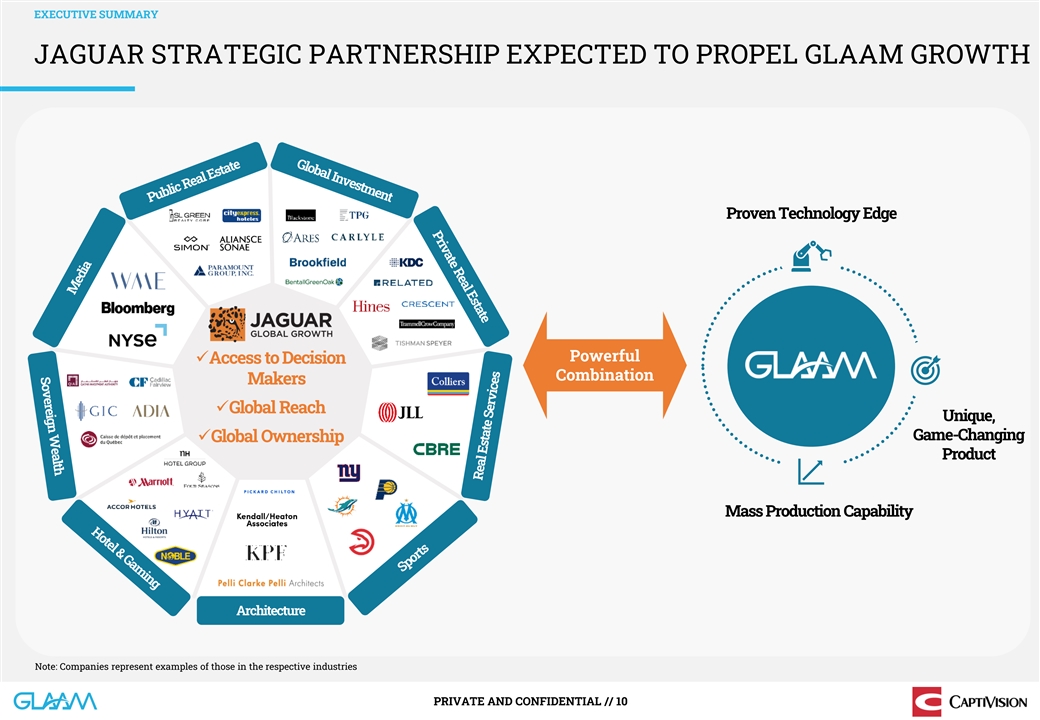
EXECUTIVE SUMMARY JAGUAR STRATEGIC PARTNERSHIP EXPECTED TO PROPEL GLAAM
GROWTH Proven Technology Edge Powerful ✓Access to Decision Combination Makers ✓Global Reach Unique, Game-Changing ✓Global Ownership Product Mass Production Capability Architecture Note: Companies represent examples of those in
the respective industries PRIVATE AND CONFIDENTIAL // 10
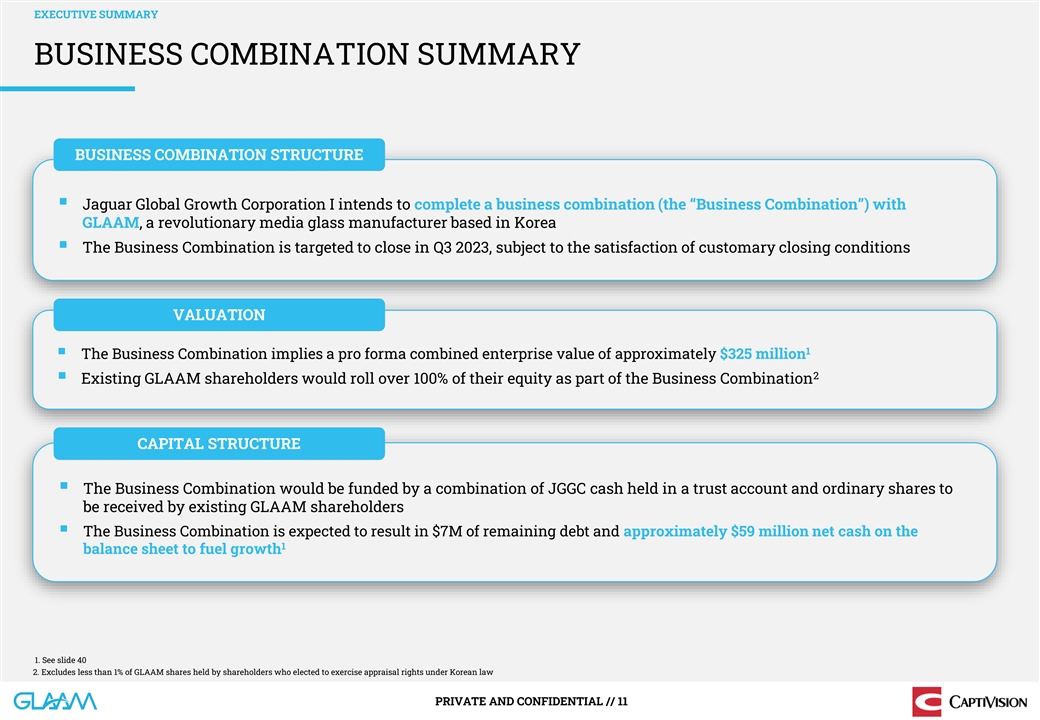
EXECUTIVE SUMMARY BUSINESS COMBINATION SUMMARY BUSINESS COMBINATION
STRUCTURE ▪ Jaguar Global Growth Corporation I intends to complete a business combination (the “Business Combination”) with GLAAM, a revolutionary media glass manufacturer based in Korea ▪ The Business Combination is targeted
to close in Q3 2023, subject to the satisfaction of customary closing conditions VALUATION 1 ▪ The Business Combination implies a pro forma combined enterprise value of approximately $325 million 2 ▪ Existing GLAAM shareholders would
roll over 100% of their equity as part of the Business Combination CAPITAL STRUCTURE ▪ The Business Combination would be funded by a combination of JGGC cash held in a trust account and ordinary shares to be received by existing GLAAM
shareholders ▪ The Business Combination is expected to result in $7M of remaining debt and approximately $59 million net cash on the 1 balance sheet to fuel growth 1. See slide 40 2. Excludes less than 1% of GLAAM shares held by shareholders
who elected to exercise appraisal rights under Korean law PRIVATE AND CONFIDENTIAL // 11

COMPANY OVERVIEW Company Overview
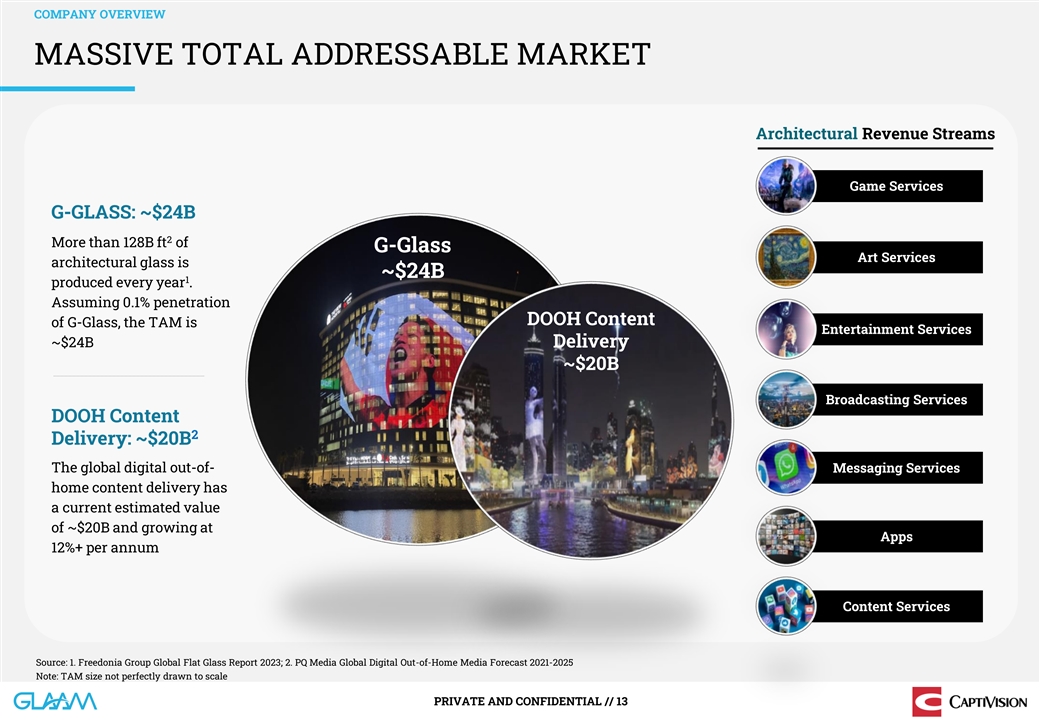
COMPANY OVERVIEW MASSIVE TOTAL ADDRESSABLE MARKET Architectural Revenue
Streams Game Services G-GLASS: ~$24B 2 More than 128B ft of G-Glass Art Services architectural glass is ~$24B 1 produced every year . Assuming 0.1% penetration DOOH Content of G-Glass, the TAM is Entertainment Services ~$24B Delivery ~$20B
Broadcasting Services DOOH Content 2 Delivery: ~$20B The global digital out-of- Messaging Services home content delivery has a current estimated value of ~$20B and growing at Apps 12%+ per annum Content Services Source: 1. Freedonia Group Global
Flat Glass Report 2023; 2. PQ Media Global Digital Out-of-Home Media Forecast 2021-2025 Note: TAM size not perfectly drawn to scale PRIVATE AND CONFIDENTIAL // 13
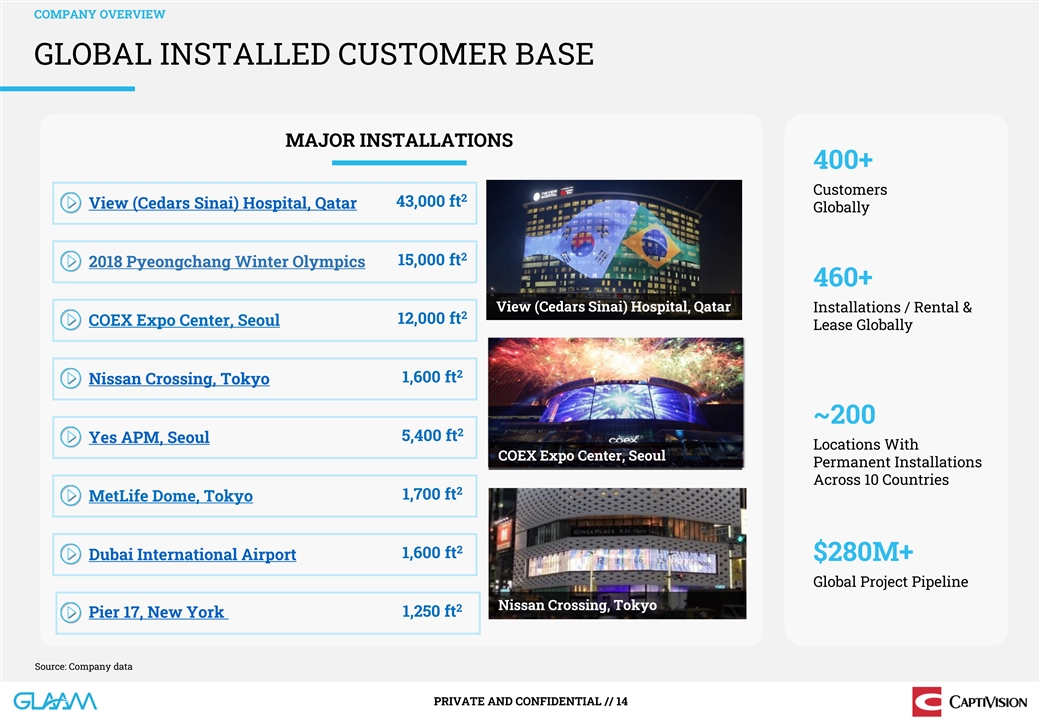
COMPANY OVERVIEW GLOBAL INSTALLED CUSTOMER BASE MAJOR INSTALLATIONS
400+ Customers 2 43,000 ft View (Cedars Sinai) Hospital, Qatar Globally 2 15,000 ft 2018 Pyeongchang Winter Olympics 460+ View (Cedars Sinai) Hospital, Qatar Installations / Rental & 2 12,000 ft COEX Expo Center, Seoul Lease Globally 2 1,600 ft
Nissan Crossing, Tokyo ~200 2 5,400 ft Yes APM, Seoul Locations With COEX Expo Center, Seoul Permanent Installations Across 10 Countries 2 1,700 ft MetLife Dome, Tokyo 2 1,600 ft Dubai International Airport $280M+ Global Project Pipeline Nissan
Crossing, Tokyo 2 1,250 ft Pier 17, New York Source: Company data PRIVATE AND CONFIDENTIAL // 14
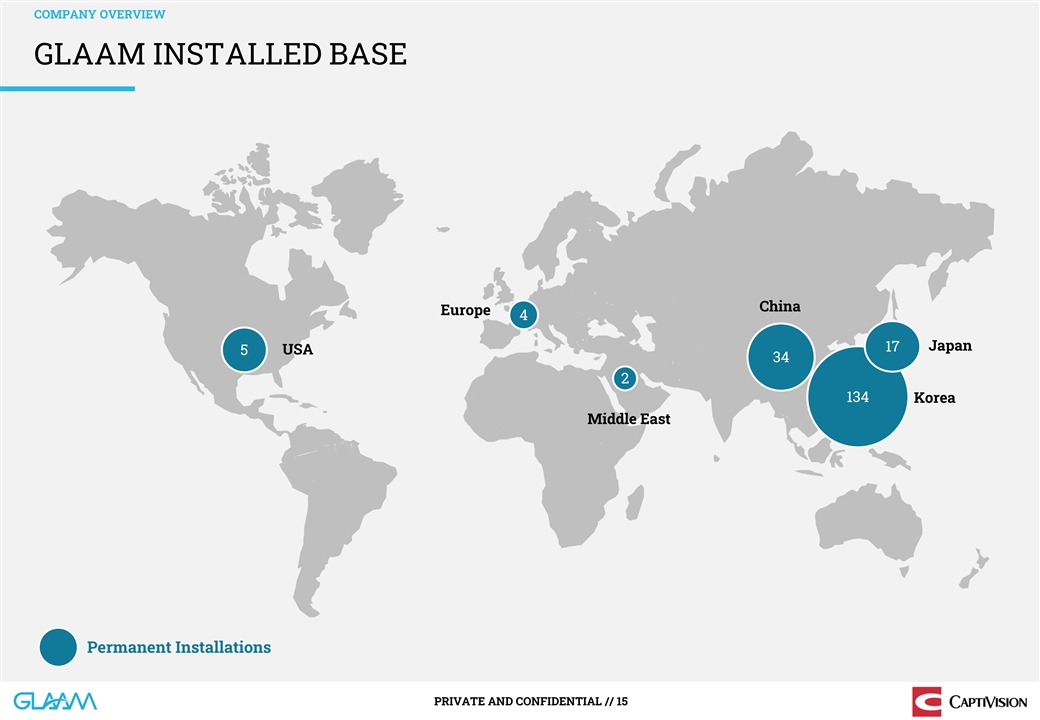
COMPANY OVERVIEW GLAAM INSTALLED BASE China Europe 4 Japan 17 5 USA 34
2 134 Korea Middle East Permanent Installations PRIVATE AND CONFIDENTIAL // 15
COMPANY OVERVIEW PROVEN VALUE CREATION – ARCHITECTURAL AND RETAIL
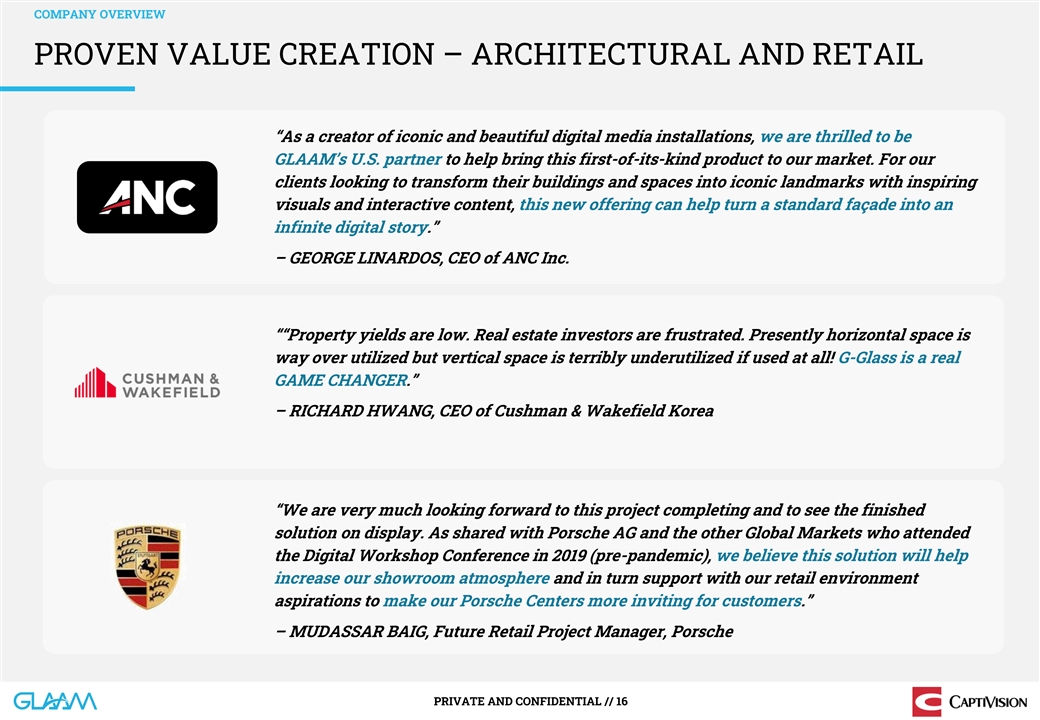
“As a creator of iconic and beautiful digital media installations, we are thrilled to be GLAAM’s U.S. partner to help bring this first-of-its-kind product to our market. For our clients looking to transform their buildings and spaces
into iconic landmarks with inspiring visuals and interactive content, this new offering can help turn a standard façade into an infinite digital story.” – GEORGE LINARDOS, CEO of ANC Inc. ““Property yields are low. Real
estate investors are frustrated. Presently horizontal space is way over utilized but vertical space is terribly underutilized if used at all! G-Glass is a real GAME CHANGER.” – RICHARD HWANG, CEO of Cushman & Wakefield Korea
“We are very much looking forward to this project completing and to see the finished solution on display. As shared with Porsche AG and the other Global Markets who attended the Digital Workshop Conference in 2019 (pre-pandemic), we believe
this solution will help increase our showroom atmosphere and in turn support with our retail environment aspirations to make our Porsche Centers more inviting for customers.” – MUDASSAR BAIG, Future Retail Project Manager, Porsche
PRIVATE AND CONFIDENTIAL // 16
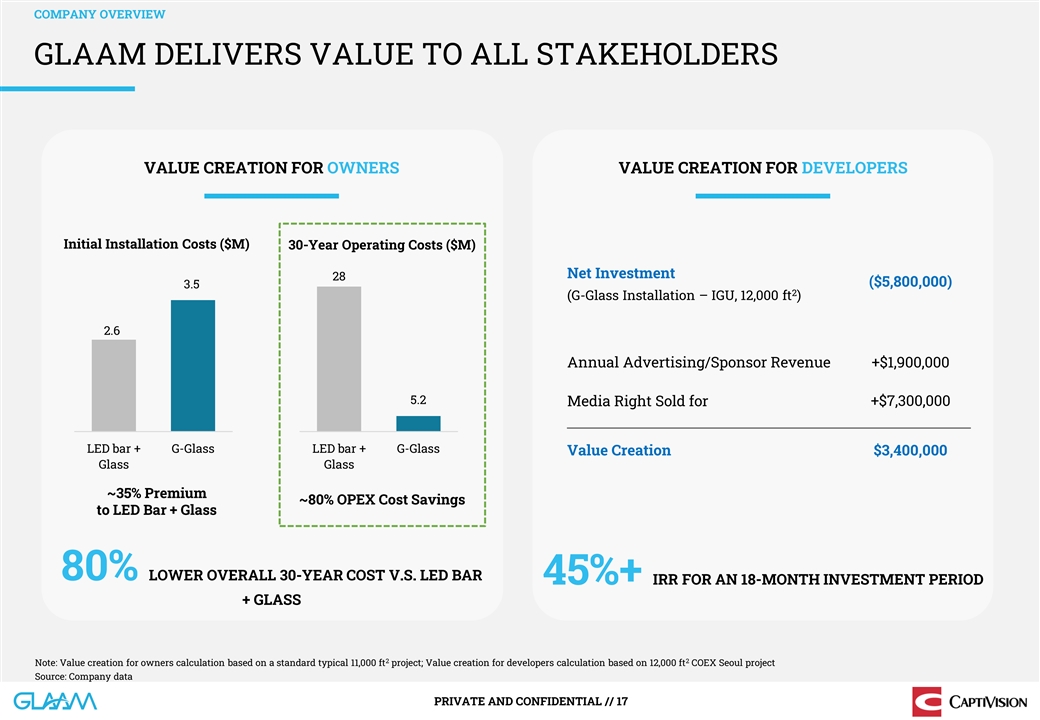
COMPANY OVERVIEW GLAAM DELIVERS VALUE TO ALL STAKEHOLDERS VALUE
CREATION FOR OWNERS VALUE CREATION FOR DEVELOPERS Initial Installation Costs ($M) 30-Year Operating Costs ($M) Net Investment 28 ($5,800,000) 3.5 2 (G-Glass Installation – IGU, 12,000 ft ) 2.6 Annual Advertising/Sponsor Revenue +$1,900,000 5.2
Media Right Sold for +$7,300,000 LED bar + G-Glass LED bar + G-Glass Value Creation $3,400,000 Glass Glass ~35% Premium ~80% OPEX Cost Savings to LED Bar + Glass 80% LOWER OVERALL 30-YEAR COST V.S. LED BAR 45%+ IRR FOR AN 18-MONTH INVESTMENT PERIOD
+ GLASS 2 2 Note: Value creation for owners calculation based on a standard typical 11,000 ft project; Value creation for developers calculation based on 12,000 ft COEX Seoul project Source: Company data PRIVATE AND CONFIDENTIAL // 17
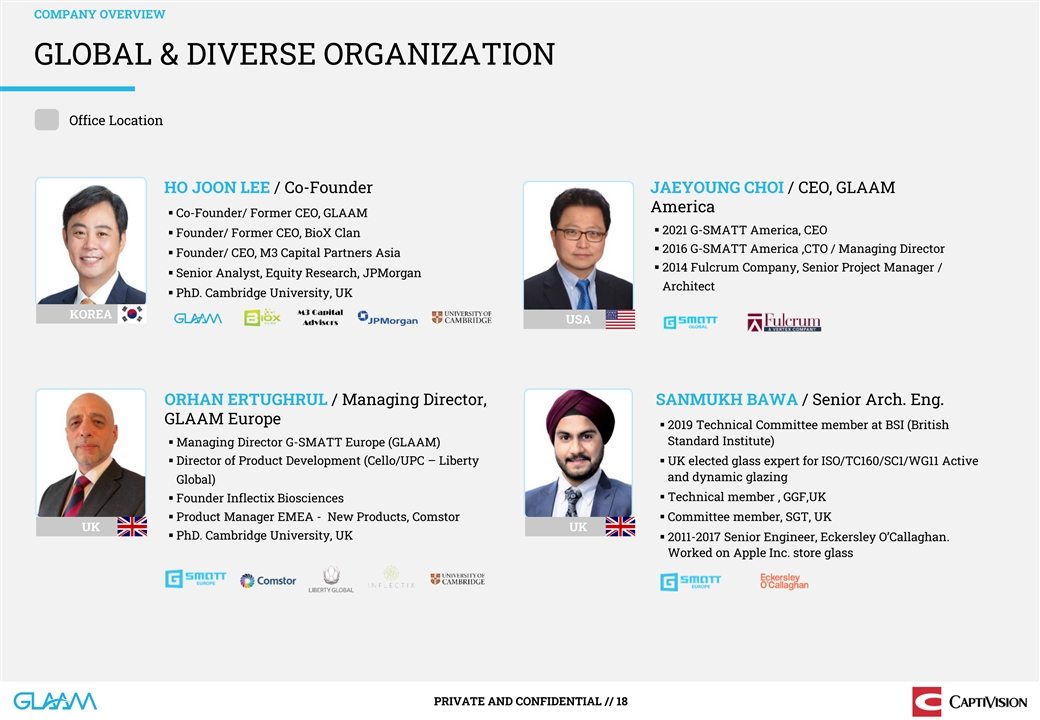
COMPANY OVERVIEW GLOBAL & DIVERSE ORGANIZATION Office Location HO
JOON LEE / Co-Founder JAEYOUNG CHOI / CEO, GLAAM America ▪ Co-Founder/ Former CEO, GLAAM ▪ 2021 G-SMATT America, CEO ▪ Founder/ Former CEO, BioX Clan ▪ 2016 G-SMATT America ,CTO / Managing Director ▪ Founder/ CEO, M3
Capital Partners Asia ▪ 2014 Fulcrum Company, Senior Project Manager / ▪ Senior Analyst, Equity Research, JPMorgan Architect ▪ PhD. Cambridge University, UK KOREA USA ORHAN ERTUGHRUL / Managing Director, SANMUKH BAWA / Senior Arch.
Eng. GLAAM Europe ▪ 2019 Technical Committee member at BSI (British Standard Institute) ▪ Managing Director G-SMATT Europe (GLAAM) ▪ Director of Product Development (Cello/UPC – Liberty ▪ UK elected glass expert for
ISO/TC160/SC1/WG11 Active and dynamic glazing Global) ▪ Technical member , GGF,UK ▪ Founder Inflectix Biosciences ▪ Product Manager EMEA - New Products, Comstor▪ Committee member, SGT, UK UK UK ▪ PhD. Cambridge
University, UK ▪ 2011-2017 Senior Engineer, Eckersley O’Callaghan. Worked on Apple Inc. store glass PRIVATE AND CONFIDENTIAL // 18
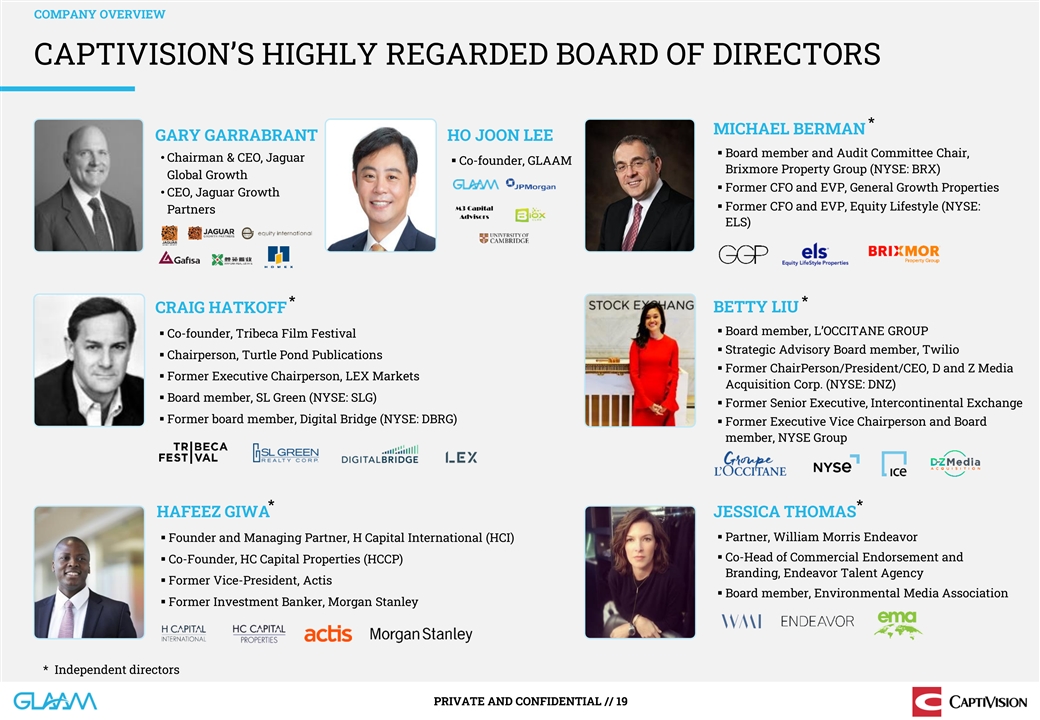
COMPANY OVERVIEW CAPTIVISION’S HIGHLY REGARDED BOARD OF DIRECTORS
* MICHAEL BERMAN GARY GARRABRANT HO JOON LEE ▪ Board member and Audit Committee Chair, • Chairman & CEO, Jaguar ▪ Co-founder, GLAAM Brixmore Property Group (NYSE: BRX) Global Growth ▪ Former CFO and EVP, General Growth
Properties • CEO, Jaguar Growth ▪ Former CFO and EVP, Equity Lifestyle (NYSE: Partners ELS) * * CRAIG HATKOFF BETTY LIU ▪ Board member, L’OCCITANE GROUP ▪ Co-founder, Tribeca Film Festival ▪ Strategic Advisory
Board member, Twilio ▪ Chairperson, Turtle Pond Publications ▪ Former ChairPerson/President/CEO, D and Z Media ▪ Former Executive Chairperson, LEX Markets Acquisition Corp. (NYSE: DNZ) ▪ Board member, SL Green (NYSE: SLG)
▪ Former Senior Executive, Intercontinental Exchange ▪ Former board member, Digital Bridge (NYSE: DBRG) ▪ Former Executive Vice Chairperson and Board member, NYSE Group * * HAFEEZ GIWA JESSICA THOMAS ▪ Partner, William Morris
Endeavor ▪ Founder and Managing Partner, H Capital International (HCI) ▪ Co-Head of Commercial Endorsement and ▪ Co-Founder, HC Capital Properties (HCCP) Branding, Endeavor Talent Agency ▪ Former Vice-President, Actis ▪
Board member, Environmental Media Association ▪ Former Investment Banker, Morgan Stanley * Independent directors PRIVATE AND CONFIDENTIAL // 19
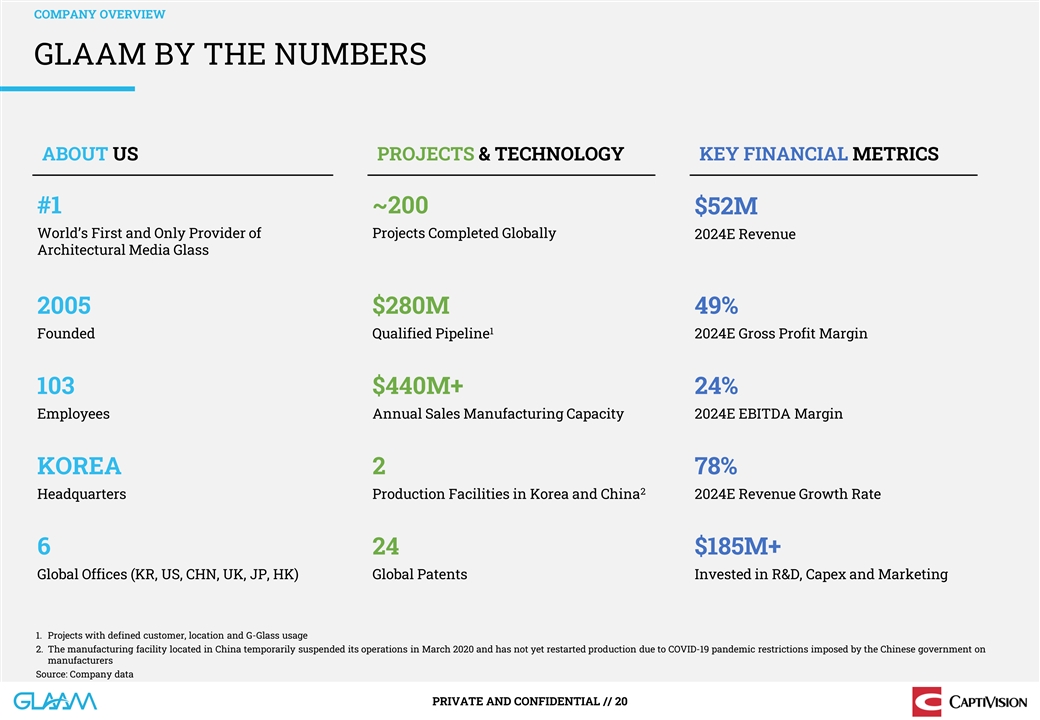
COMPANY OVERVIEW GLAAM BY THE NUMBERS ABOUT US PROJECTS &
TECHNOLOGY KEY FINANCIAL METRICS #1 ~200 $52M World’s First and Only Provider of Projects Completed Globally 2024E Revenue Architectural Media Glass 2005 $280M 49% 1 Founded Qualified Pipeline 2024E Gross Profit Margin 103 $440M+ 24% Employees
Annual Sales Manufacturing Capacity 2024E EBITDA Margin KOREA 2 78% 2 Headquarters Production Facilities in Korea and China 2024E Revenue Growth Rate 6 24 $185M+ Global Offices (KR, US, CHN, UK, JP, HK) Global Patents Invested in R&D, Capex and
Marketing 1. Projects with defined customer, location and G-Glass usage 2. The manufacturing facility located in China temporarily suspended its operations in March 2020 and has not yet restarted production due to COVID-19 pandemic restrictions
imposed by the Chinese government on manufacturers Source: Company data PRIVATE AND CONFIDENTIAL // 20

Product & Operations MANUFACTURING & OPERATIONS

MANUFACTURING & OPERATIONS GLAAM MANUFACTURING OVERVIEW PYEONGTAEK,
KOREA 2 • Capacity 700,000 ft G-Glass per year • Operational since 2012 • Land area: Approx. ~1 Acre • Annual capacity: $220M GLAAM has a manufacturing facility through an existing JV in Tianjin, China, which suspended its
operations as a result of COVID-19 restriction imposed by the Chinese government on manufacturers, with an annual capacity of $220M Source: Company data PRIVATE AND CONFIDENTIAL // 22
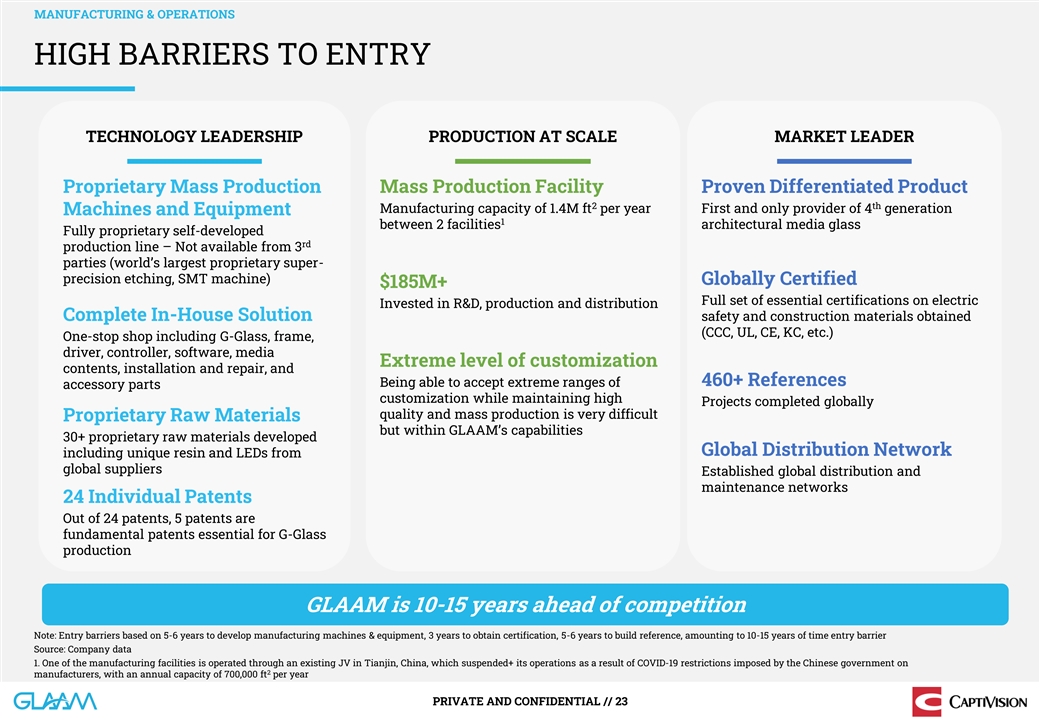
MANUFACTURING & OPERATIONS HIGH BARRIERS TO ENTRY TECHNOLOGY
LEADERSHIP PRODUCTION AT SCALE MARKET LEADER Proprietary Mass Production Mass Production Facility Proven Differentiated Product 2 th Manufacturing capacity of 1.4M ft per year First and only provider of 4 generation Machines and Equipment 1 between
2 facilities architectural media glass Fully proprietary self-developed rd production line – Not available from 3 parties (world’s largest proprietary super- precision etching, SMT machine) Globally Certified $185M+ Full set of essential
certifications on electric Invested in R&D, production and distribution Complete In-House Solution safety and construction materials obtained (CCC, UL, CE, KC, etc.) One-stop shop including G-Glass, frame, driver, controller, software, media
Extreme level of customization contents, installation and repair, and Being able to accept extreme ranges of 460+ References accessory parts customization while maintaining high Projects completed globally quality and mass production is very
difficult Proprietary Raw Materials but within GLAAM’s capabilities 30+ proprietary raw materials developed Global Distribution Network including unique resin and LEDs from global suppliers Established global distribution and maintenance
networks 24 Individual Patents Out of 24 patents, 5 patents are fundamental patents essential for G-Glass production GLAAM is 10-15 years ahead of competition Note: Entry barriers based on 5-6 years to develop manufacturing machines & equipment,
3 years to obtain certification, 5-6 years to build reference, amounting to 10-15 years of time entry barrier Source: Company data 1. One of the manufacturing facilities is operated through an existing JV in Tianjin, China, which suspended+ its
operations as a result of COVID-19 restrictions imposed by the Chinese government on 2 manufacturers, with an annual capacity of 700,000 ft per year PRIVATE AND CONFIDENTIAL // 23
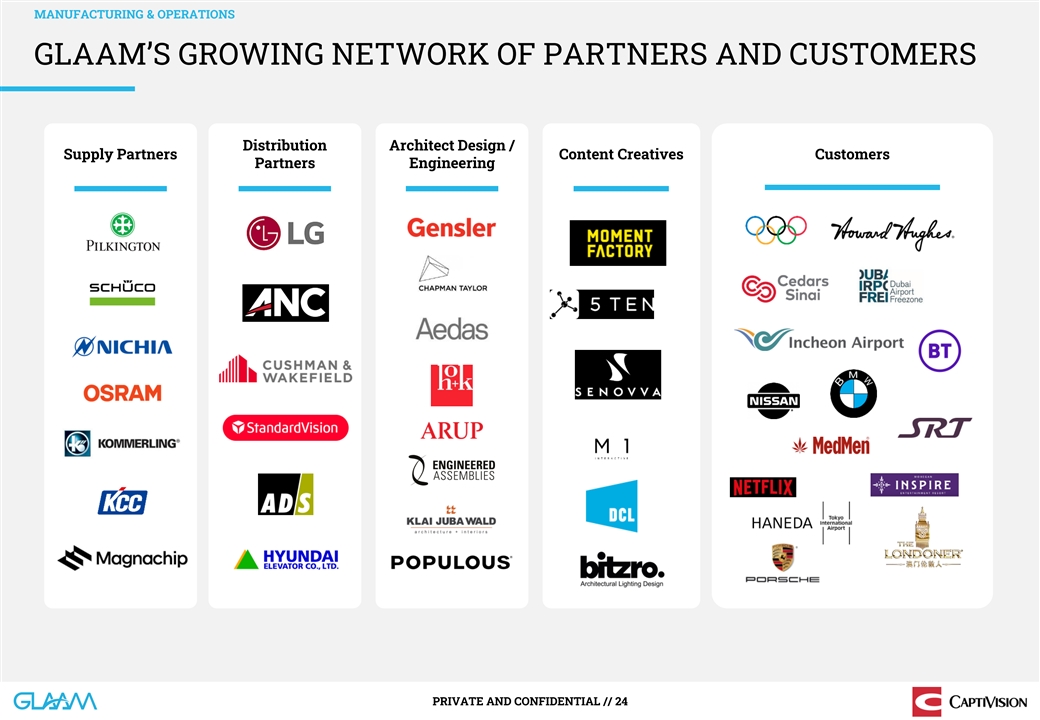
MANUFACTURING & OPERATIONS GLAAM’S GROWING NETWORK OF
PARTNERS AND CUSTOMERS Distribution Architect Design / Supply Partners Content Creatives Customers Partners Engineering PRIVATE AND CONFIDENTIAL // 24
Growth Strategies GROWTH STRATEGY
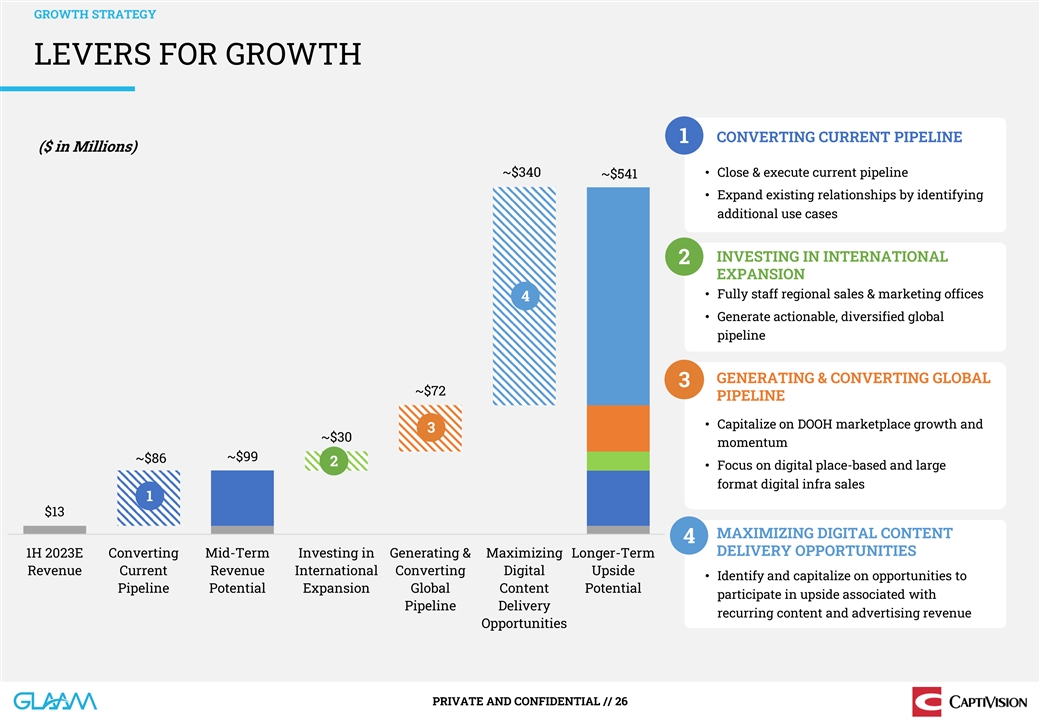
GROWTH STRATEGY LEVERS FOR GROWTH 1 CONVERTING CURRENT PIPELINE ($ in
Millions) ~$340 • Close & execute current pipeline ~$541 • Expand existing relationships by identifying additional use cases INVESTING IN INTERNATIONAL 2 EXPANSION • Fully staff regional sales & marketing offices 4 •
Generate actionable, diversified global pipeline GENERATING & CONVERTING GLOBAL 3 ~$72 PIPELINE • Capitalize on DOOH marketplace growth and 3 ~$30 momentum ~$99 ~$86 2 • Focus on digital place-based and large format digital infra
sales 1 $13 MAXIMIZING DIGITAL CONTENT 4 DELIVERY OPPORTUNITIES 1H 2023E Converting Mid-Term Investing in Generating & Maximizing Longer-Term Revenue Current Revenue International Converting Digital Upside • Identify and capitalize on
opportunities to Pipeline Potential Expansion Global Content Potential participate in upside associated with Pipeline Delivery recurring content and advertising revenue Opportunities PRIVATE AND CONFIDENTIAL // 26
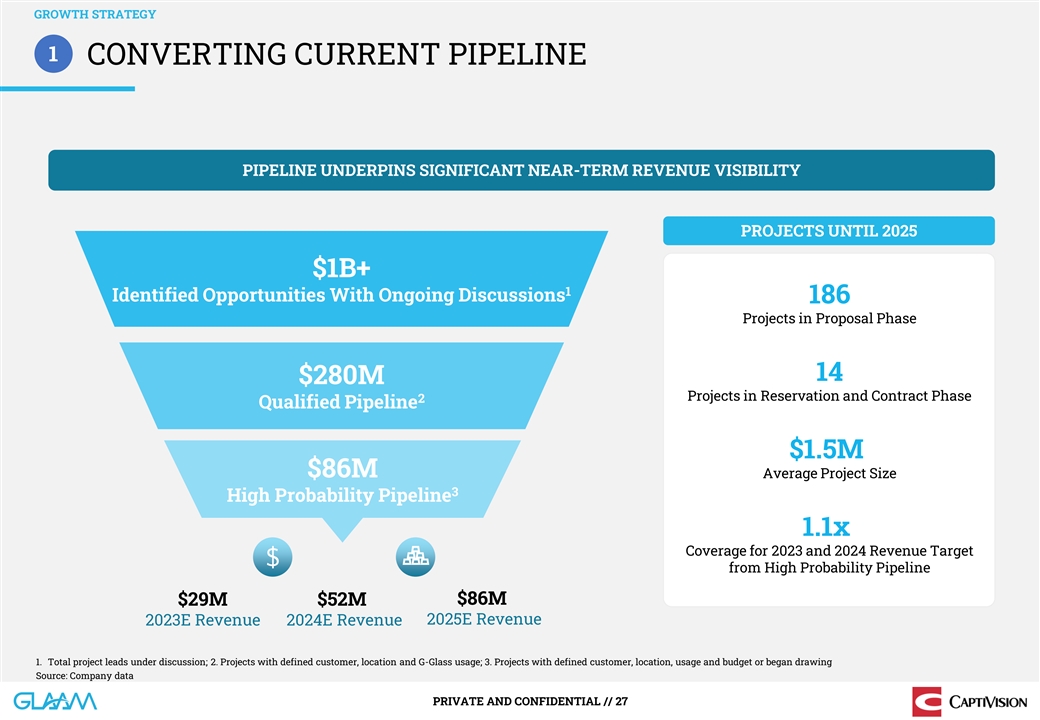
GROWTH STRATEGY 1 CONVERTING CURRENT PIPELINE PIPELINE UNDERPINS
SIGNIFICANT NEAR-TERM REVENUE VISIBILITY PROJECTS UNTIL 2025 $1B+ 1 Identified Opportunities With Ongoing Discussions 186 Projects in Proposal Phase 14 $280M Projects in Reservation and Contract Phase 2 Qualified Pipeline $1.5M $86M Average Project
Size 3 High Probability Pipeline 1.1x Coverage for 2023 and 2024 Revenue Target from High Probability Pipeline $29M $52M $86M 2023E Revenue 2024E Revenue 2025E Revenue 1. Total project leads under discussion; 2. Projects with defined customer,
location and G-Glass usage; 3. Projects with defined customer, location, usage and budget or began drawing Source: Company data PRIVATE AND CONFIDENTIAL // 27
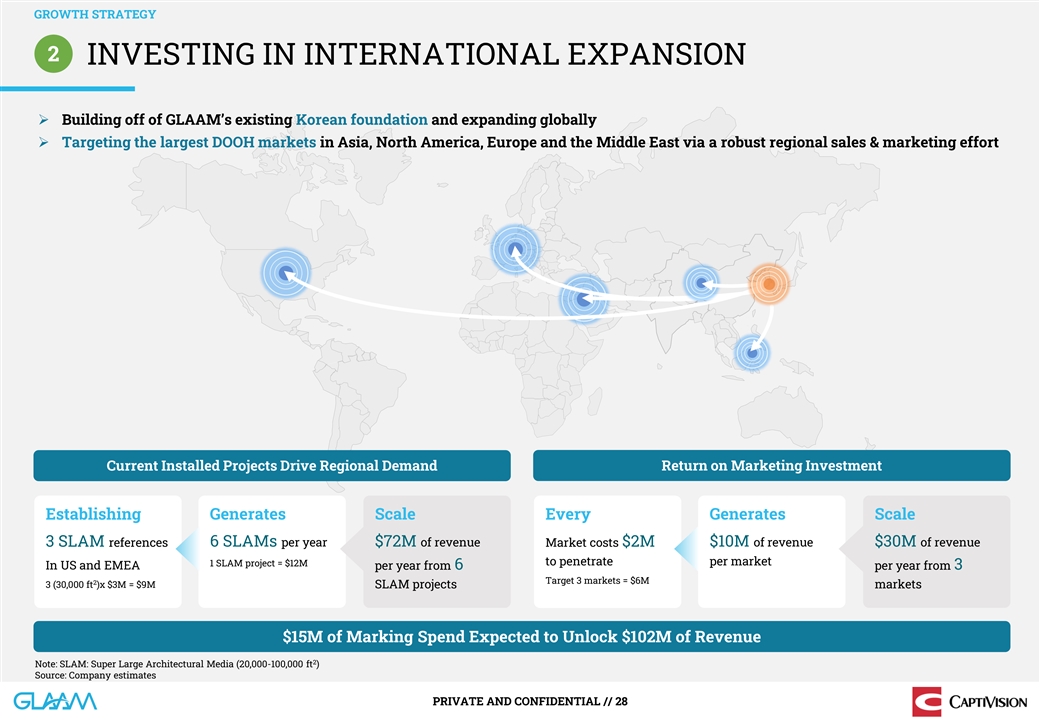
GROWTH STRATEGY 2 INVESTING IN INTERNATIONAL EXPANSION ➢
Building off of GLAAM’s existing Korean foundation and expanding globally ➢ Targeting the largest DOOH markets in Asia, North America, Europe and the Middle East via a robust regional sales & marketing effort Current Installed
Projects Drive Regional Demand Return on Marketing Investment Establishing Generates Scale Every Generates Scale 3 SLAM references 6 SLAMs per year $72M of revenue Market costs $2M $10M of revenue $30M of revenue to penetrate per market 1 SLAM
project = $12M In US and EMEA per year from 6 per year from 3 Target 3 markets = $6M 2 3 (30,000 ft )x $3M = $9M SLAM projects markets $15M of Marking Spend Expected to Unlock $102M of Revenue 2 Note: SLAM: Super Large Architectural Media
(20,000-100,000 ft ) Source: Company estimates PRIVATE AND CONFIDENTIAL // 28

GROWTH STRATEGY 3 GENERATING & CONVERTING GLOBAL PIPELINE Focusing
on Larger Ticket Projects Large Format Digital Urban Wallscapes Multi-Unit Digital Place-Based Networks 2022–2024 2025–beyond MOHEGAN INSPIRE CASINO VIEW HOSPITAL 2022 “M” HOTEL & CASINO 2024 / 2025 RESORT 2023 COMPLETED
UNDER CONSTRUCTION IN PROPOSAL 2 2 2 DOHA, QATAR (43,000 FT ) INCHEON, KOREA (16,000 FT ) LAS VEGAS, USA (100,000+ FT ) MAGOK MICE 2024 OAM FACILITY NEOM CITY 2030 NEAR CONTRACT IN PROPOSAL IN PROPOSAL 2 2 2 SEOUL , KOREA (16,000 FT ) TORONTO,
CANADA (37,000 FT ) NEOM, SAUDI ARABIA (8,000,000 FT ) 2 2 2 2 Note: Multi-Unit Digital Place-Based Networks (200 ft – 500 ft ); Large Format Digital Urban Wallscapes (1,800 ft – 14,400 ft ) PRIVATE AND CONFIDENTIAL // 29
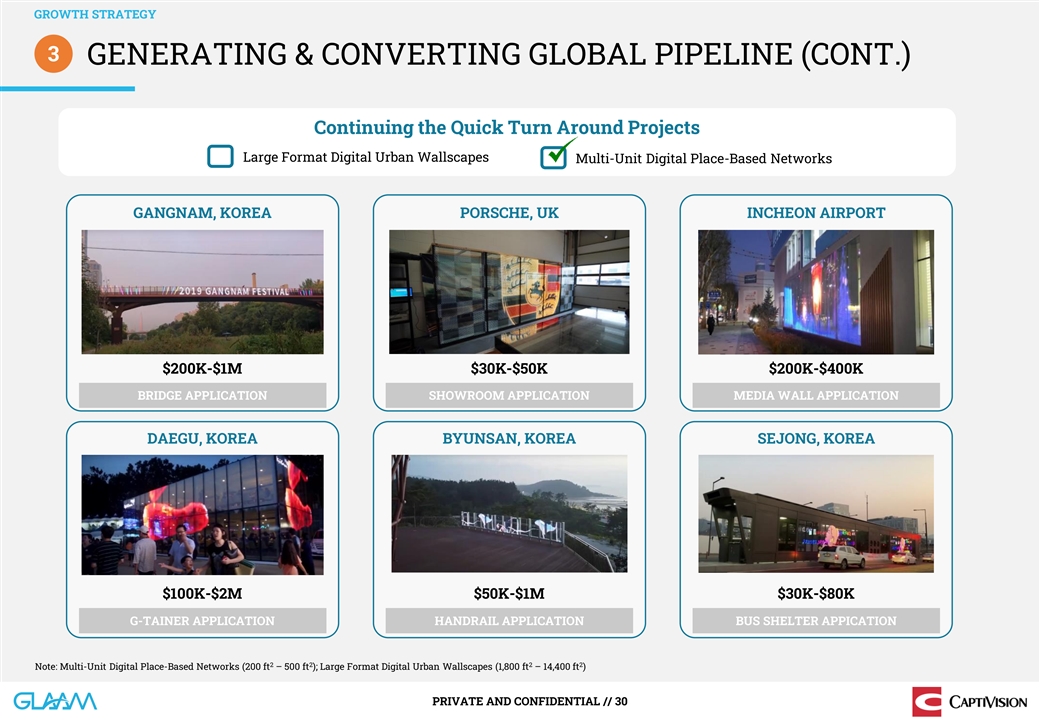
GROWTH STRATEGY 3 GENERATING & CONVERTING GLOBAL PIPELINE (CONT.)
Continuing the Quick Turn Around Projects Large Format Digital Urban Wallscapes Multi-Unit Digital Place-Based Networks GANGNAM, KOREA PORSCHE, UK INCHEON AIRPORT $200K-$1M $30K-$50K $200K-$400K BRIDGE APPLICATION SHOWROOM APPLICATION MEDIA WALL
APPLICATION DAEGU, KOREA BYUNSAN, KOREA SEJONG, KOREA $100K-$2M $50K-$1M $30K-$80K G-TAINER APPLICATION HANDRAIL APPLICATION BUS SHELTER APPICATION 2 2 2 2 Note: Multi-Unit Digital Place-Based Networks (200 ft – 500 ft ); Large Format Digital
Urban Wallscapes (1,800 ft – 14,400 ft ) PRIVATE AND CONFIDENTIAL // 30

GROWTH STRATEGY 4 MAXIMIZING DIGITAL CONTENT DELIVERY OPPORTUNITIES
G-Glass Advertising Potential Proven by COEX Expand Glass as a Service (GaaS) Globally Future Large-Scale Project 2 200,000 ft $18M 3 of G-Glass Delivered CAPEX Yields $1.9M 2 Low 12,000 ft Annual Adverting of G-Glass Installed Operating Cost $10M
$7.4M 1 Revenue 4 5 Annual Revenue Annual EBITDA Large Architectural Media Proven by Burj Khalifa Potential Structure: • For each new installation, GLAAM will split the upfront 2 350,000 ft CapEx / installation costs with the customer, and
agree to maintain the G-Glass rd • In return, GLAAM will license the use of the glass to 3 $25M parties and retain 80% of the media and advertising 2 Annual Revenue 2 revenue the installation brings in ($68,000 per 3 min ) • Win-win
solution: Costumer reduces upfront cost and still High retains upside; GLAAM increases margins via GaaS; Operating Cost monetizes the G-Glass for 30+ years Source: 1. Korea Networks. Data based on actual advertising revenues generated in 2018 by
operator; 2. ArabianBusiness.com, October 5, 2022. Annual revenue based on 3 min per day for 365 days; 3. Procured at cost (material and installation cost); 4. Based on management estimates: average revenue based on 5 accounts of $6,000 per day for
365 days; 5. EBITDA after 20% revenue sharing with building owner and estimated maintenance costs PRIVATE AND CONFIDENTIAL // 31
Financial Overview FINANCIAL OVERVIEW

FINANCIAL OVERVIEW FINANCIAL RESULTS AND PROJECTIONS 1 2 Revenue Gross
Profit Gross Profit ($M) ($M) Gross Profit Margin % $86 57% 49% 44% $49 43% 31% $26 $52 $19 $13 $45 $6 $29 $(1) $20 $(2) $15 $9 (13%) (12%) 2019A 2020A 2021A 2022A 2023E 2024E 2025E 2019A 2020A 2021A 2022A 2023E 2024E 2025E 3,4 3,4 EBITDA EBITDA
Margin ($M) 38% 24% 15% 15% $33 6% $13 $7 $4 $1 (56%) (110%) $(8) $(10) 2019A 2020A 2021A 2022A 2023E 2024E 2025E 2019A 2020A 2021A 2022A 2023E 2024E 2025E Note: Company financials are presented as audited K-IFRS 2019 and 2020; PCAOB audited IFRS
2021 and 2022; and Company projections, K-IFRS basis, 2023, 2024 and 2025. GLAAM recognizes the results of certain subsidiaries on a consolidated basis because it owns a majority, but not 100%, of those entities. Consistent with that accounting
treatment, the projections include 100% of the total revenue, gross profit and EBITDA that is attributable to those subsidiaries. However, notwithstanding the consolidation of those subsidiaries for accounting purposes, GLAAM’s economic
interest in the projected revenue, gross profit and projected EBITDA attributable to those entities is limited to its ownership of those entities. All financial information based on a KRW:USD exchange rate of 1,245:1 for 2019-2020; 1,145 for 2021;
1,292 for 2022; and 1,245 for 2023-2025. 1. Projected revenue attributable to majority, but not wholly, owned subsidiaries is: 2023: $3.8 million, 2024: $4.5 million, and 2025: $37.2 million. GLAAM’s economic interest in the projected revenue
attributable to majority, but not wholly, owned subsidiaries is: 2023: $3.0 million, 2024: $3.0 million, and 2025: $21.3 million. 2. Projected gross profit attributable to majority, but not wholly, owned subsidiaries is: 2023: $1.2 million, 2024:
$1.7 million, and 2025: $13.1 million. GLAAM’s economic interest in the projected revenue attributable to majority, but not wholly, owned subsidiaries is: 2023: $0.9 million, 2024: $1.1 million, and 2025: $7.5 million. 3. EBITDA and EBITDA
Margin are presented for 2019 and 2020. The Company defines EBITDA as net income before interest, taxes, depreciation and amortization. The Company defines EBITDA Margin as EBITDA divided by revenue. Adjusted EBITDA and Adjusted EBITDA Margin are
presented for 2021 and 2022. The Company defines Adjusted EBITDA for such periods as net loss before depreciation and amortization, finance income, finance cost, other income, other expense, corporate income tax benefit, bad debt expense, employee
share compensation cost, inventory disposal, and litigation costs, adjusted for (i) certain non-recurring, infrequent, or unusual items that management believes do not reflect the Company’s core operating performance and (ii) certain items
that may be recurring, frequent or usual, but that do not reflect the Company’s core operating performance and do not and will not require cash settlement. The Company defines Adjusted EBITDA Margin as Adjusted EBITDA divided by revenue. The
Company also presents projections of EBITDA and EBITDA Margin for 2023, 2024 and 2025. 4. Projected EBITDA attributable to majority, but not wholly, owned subsidiaries is: 2023: $(0.4) million, 2024: $(0.8) million, and 2025: $7.4 million.
GLAAM’s economic interest in the projected EBITDA attributable to majority, but not wholly, owned subsidiaries is: 2023: $0.1 million, 2024: $(0.4) million, and 2025: $4.1 million. Please see slide 49 for reconciliations to the nearest IFRS
measures PRIVATE AND CONFIDENTIAL // 33
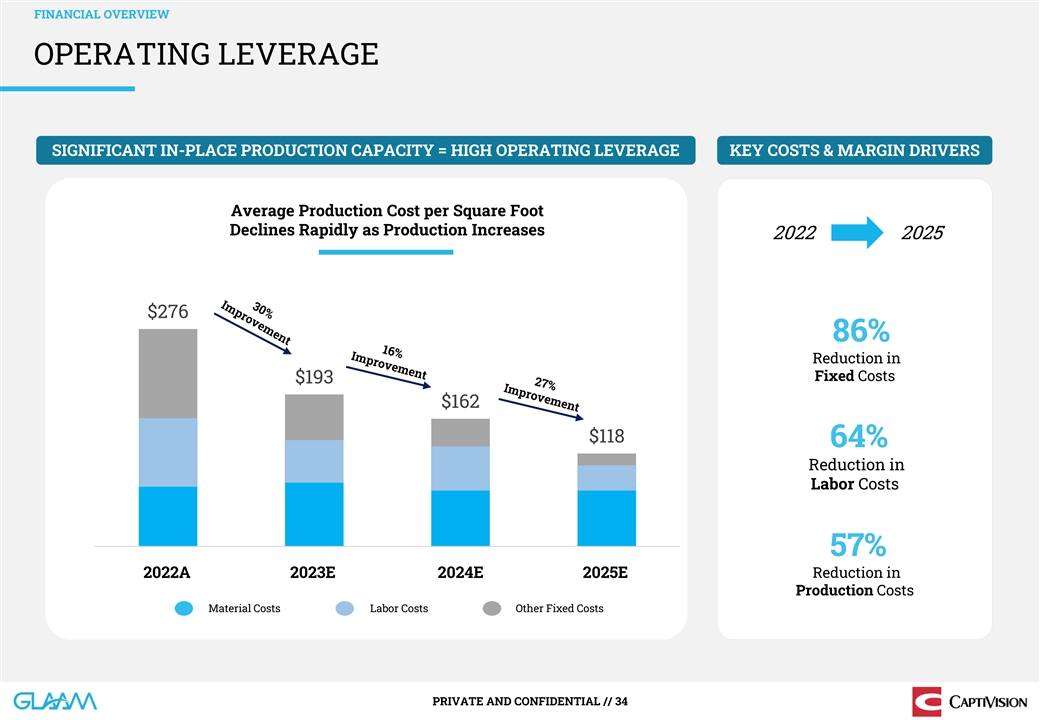
FINANCIAL OVERVIEW OPERATING LEVERAGE SIGNIFICANT IN-PLACE PRODUCTION
CAPACITY = HIGH OPERATING LEVERAGE KEY COSTS & MARGIN DRIVERS Average Production Cost per Square Foot Declines Rapidly as Production Increases 2022 2025 $276 86% Reduction in Fixed Costs $193 $162 $118 64% Reduction in Labor Costs 57% 2022A
2023E 2024E 2025E Reduction in Production Costs Material Costs Labor Costs Other Fixed Costs PRIVATE AND CONFIDENTIAL // 34
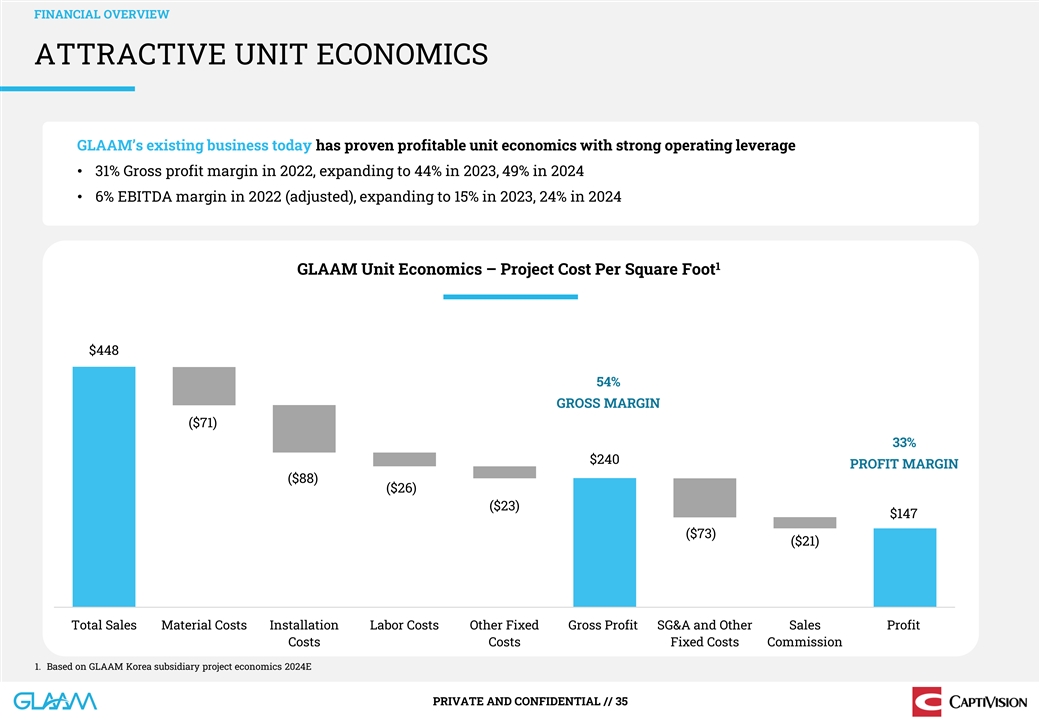
FINANCIAL OVERVIEW ATTRACTIVE UNIT ECONOMICS GLAAM’s existing
business today has proven profitable unit economics with strong operating leverage • 31% Gross profit margin in 2022, expanding to 44% in 2023, 49% in 2024 • 6% EBITDA margin in 2022 (adjusted), expanding to 15% in 2023, 24% in 2024 1
GLAAM Unit Economics – Project Cost Per Square Foot $36.0 $448 54% ($6.0) GROSS MARGIN ($71) 33% $240 ($10.0) PROFIT MARGIN ($1.8) ($88) ($26) $12.2 ($23) $11.2 $147 ($6.0) $9.2 ($73) ($3.0) ($21) Total Sales Installation Cost Fixed CostOther
Variable CostM s aterial Cost Gross Profit Sales Commission Profit EBITDA Total Sales Material Costs Installation Labor Costs Other Fixed Gross Profit SG&A and Other Sales Profit Costs Costs Fixed Costs Commission 1. Based on GLAAM Korea
subsidiary project economics 2024E PRIVATE AND CONFIDENTIAL // 35

Business Combination Overview BUSINESS COMBINATION OVERVIEW

BUSINESS COMBINATION OVERVIEW POSITIONING Digital Media and IT and
Smart Products Advertising ▪ Multinational presence ▪ Strong outdoor advertising ▪ IoT and device focus brands within North American markets ▪ Proprietary technology and patent specializations ▪ Largest digital
advertising companies ▪ Vertical integration ▪ Demonstrated operational expertise ▪ Potential channel leasing partners for GLAAM PRIVATE AND CONFIDENTIAL // 37

BUSINESS COMBINATION OVERVIEW OPERATIONAL BENCHMARKING Digital Media
and Advertising IT and Smart Products 78% Median: 5% Median: 5% 2024E 8% 8% 5% 4% 3% 9% 2% Revenue Growth (2%) Median: 7% Median: 10% >100% 32% 16% 15% 9% 2024E 4% 6% 3% EBITDA Growth (6%) Median: 48% Median: 42% 72% 51% 49% 48% 43% 43% 41% 2024E
Gross 36% Profit Margin NA Note: Metrics for peers based on FactSet consensus estimates; FactSet data as of 8/21/2023 PRIVATE AND CONFIDENTIAL // 38
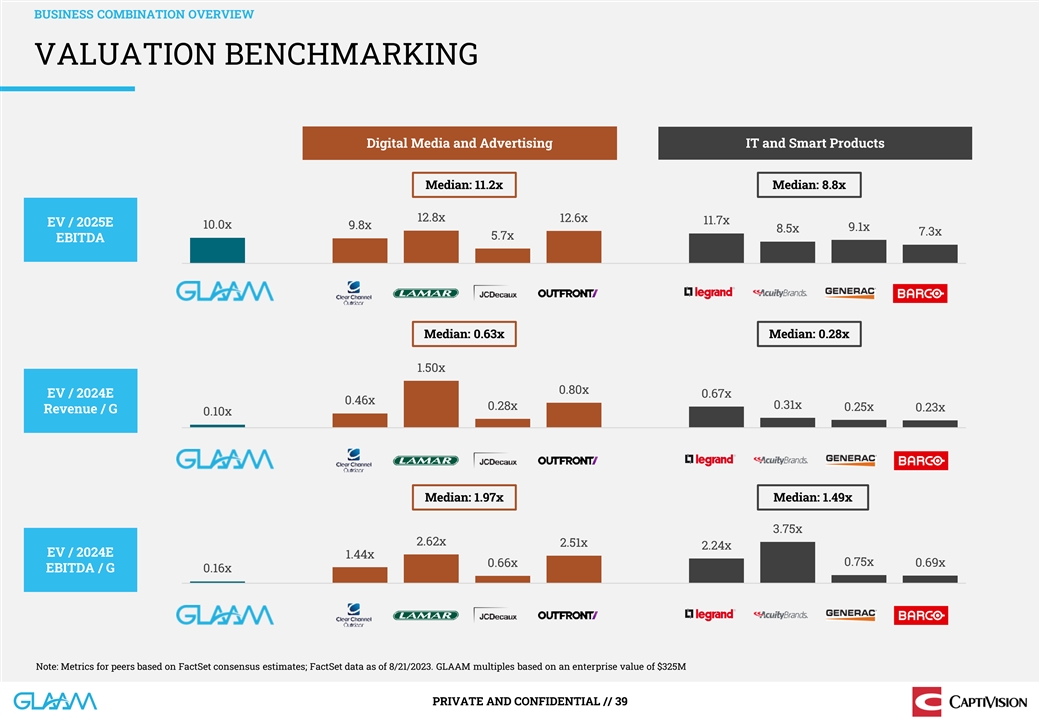
BUSINESS COMBINATION OVERVIEW VALUATION BENCHMARKING Digital Media and
Advertising IT and Smart Products Median: 11.2x Median: 8.8x 12.8x 12.6x 11.7x EV / 2025E 10.0x 9.8x 9.1x 8.5x 7.3x 5.7x EBITDA Median: 0.63x Median: 0.28x 1.50x 0.80x EV / 2024E 0.67x 0.46x 0.31x 0.28x 0.25x 0.23x Revenue / G 0.10x Median: 1.97x
Median: 1.49x 3.75x 2.62x 2.51x 2.24x EV / 2024E 1.44x 0.66x 0.75x 0.69x EBITDA / G 0.16x Note: Metrics for peers based on FactSet consensus estimates; FactSet data as of 8/21/2023. GLAAM multiples based on an enterprise value of $325M PRIVATE AND
CONFIDENTIAL // 39
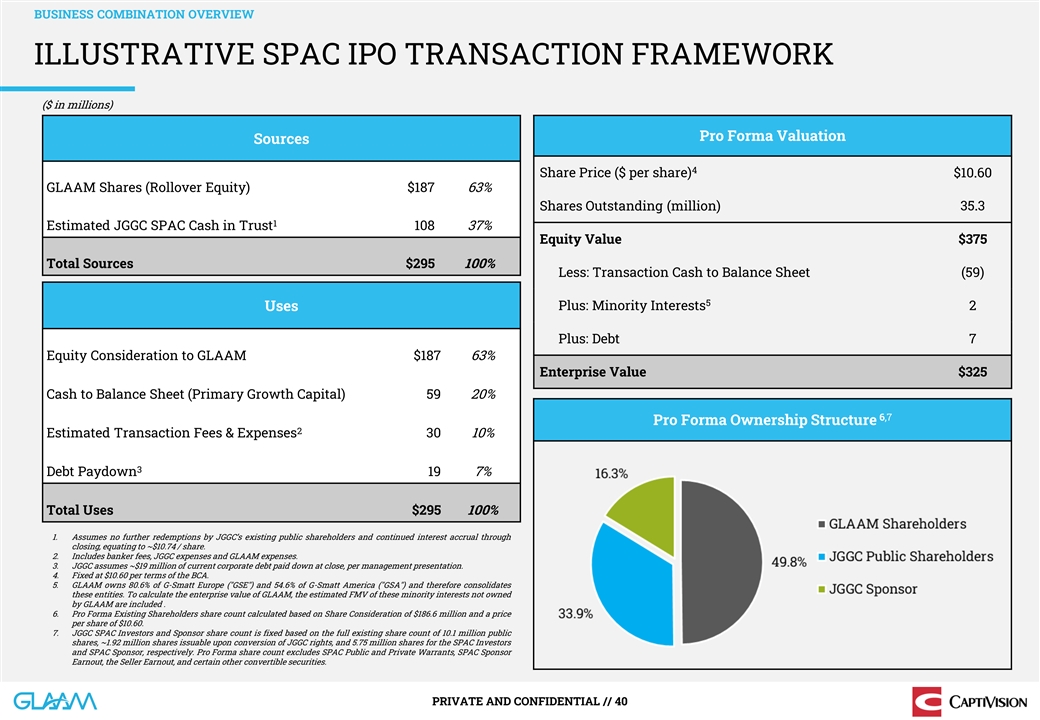
BUSINESS COMBINATION OVERVIEW ILLUSTRATIVE SPAC IPO TRANSACTION
FRAMEWORK ($ in millions) Pro Forma Valuation Sources 4 Share Price ($ per share) $10.60 GLAAM Shares (Rollover Equity) $187 63% Shares Outstanding (million) 35.3 1 Estimated JGGC SPAC Cash in Trust 108 37% Equity Value $375 Total Sources $295 100%
Less: Transaction Cash to Balance Sheet (59) 5 Uses Plus: Minority Interests 2 Plus: Debt 7 Equity Consideration to GLAAM $187 63% Enterprise Value $325 Cash to Balance Sheet (Primary Growth Capital) 59 20% 6,7 Pro Forma Ownership Structure 2
Estimated Transaction Fees & Expenses 30 10% 3 Debt Paydown 19 7% Total Uses $295 100% 1. Assumes no further redemptions by JGGC’s existing public shareholders and continued interest accrual through closing, equating to ~$10.74 / share. 2.
Includes banker fees, JGGC expenses and GLAAM expenses. 3. JGGC assumes ~$19 million of current corporate debt paid down at close, per management presentation. 4. Fixed at $10.60 per terms of the BCA. 5. GLAAM owns 80.6% of G-Smatt Europe ( GSE )
and 54.6% of G-Smatt America ( GSA ) and therefore consolidates these entities. To calculate the enterprise value of GLAAM, the estimated FMV of these minority interests not owned by GLAAM are included . 6. Pro Forma Existing Shareholders share
count calculated based on Share Consideration of $186.6 million and a price per share of $10.60. 7. JGGC SPAC Investors and Sponsor share count is fixed based on the full existing share count of 10.1 million public shares, ~1.92 million shares
issuable upon conversion of JGGC rights, and 5.75 million shares for the SPAC Investors and SPAC Sponsor, respectively. Pro Forma share count excludes SPAC Public and Private Warrants, SPAC Sponsor Earnout, the Seller Earnout, and certain other
convertible securities. PRIVATE AND CONFIDENTIAL // 40
APPENDIX
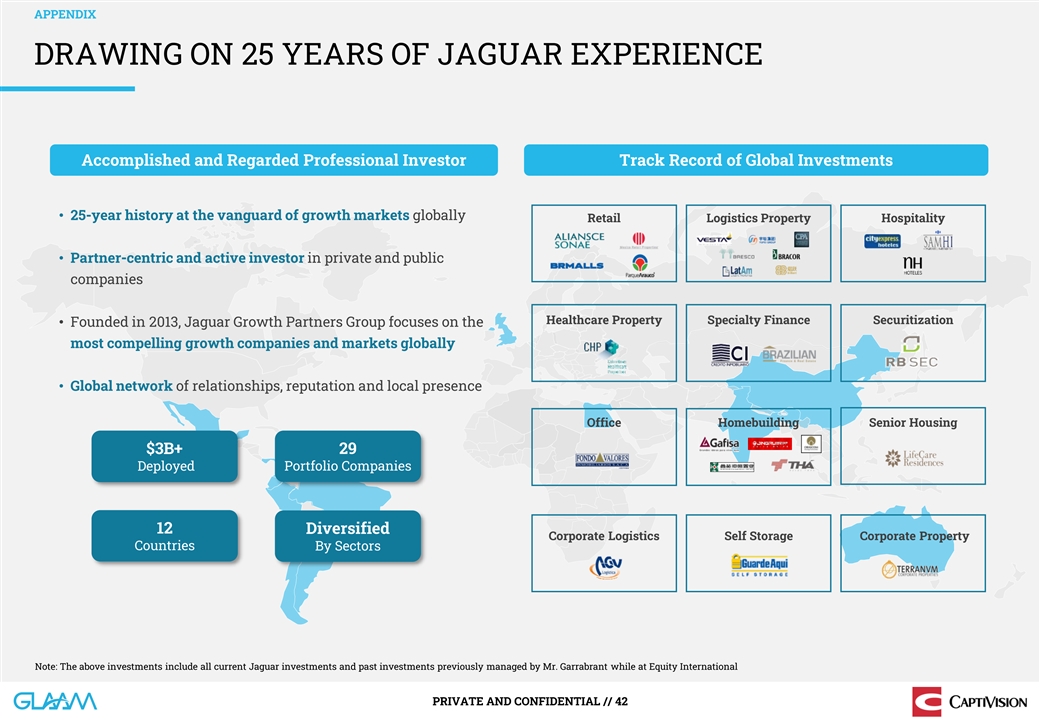
APPENDIX DRAWING ON 25 YEARS OF JAGUAR EXPERIENCE Accomplished and
Regarded Professional Investor Track Record of Global Investments • 25-year history at the vanguard of growth markets globally Retail Logistics Property Hospitality • Partner-centric and active investor in private and public companies
Healthcare Property Specialty Finance Securitization • Founded in 2013, Jaguar Growth Partners Group focuses on the most compelling growth companies and markets globally • Global network of relationships, reputation and local presence
Office Homebuilding Senior Housing $3B+ 29 Deployed Portfolio Companies 12 Diversified Corporate Logistics Self Storage Corporate Property Countries By Sectors Note: The above investments include all current Jaguar investments and past investments
previously managed by Mr. Garrabrant while at Equity International PRIVATE AND CONFIDENTIAL // 42
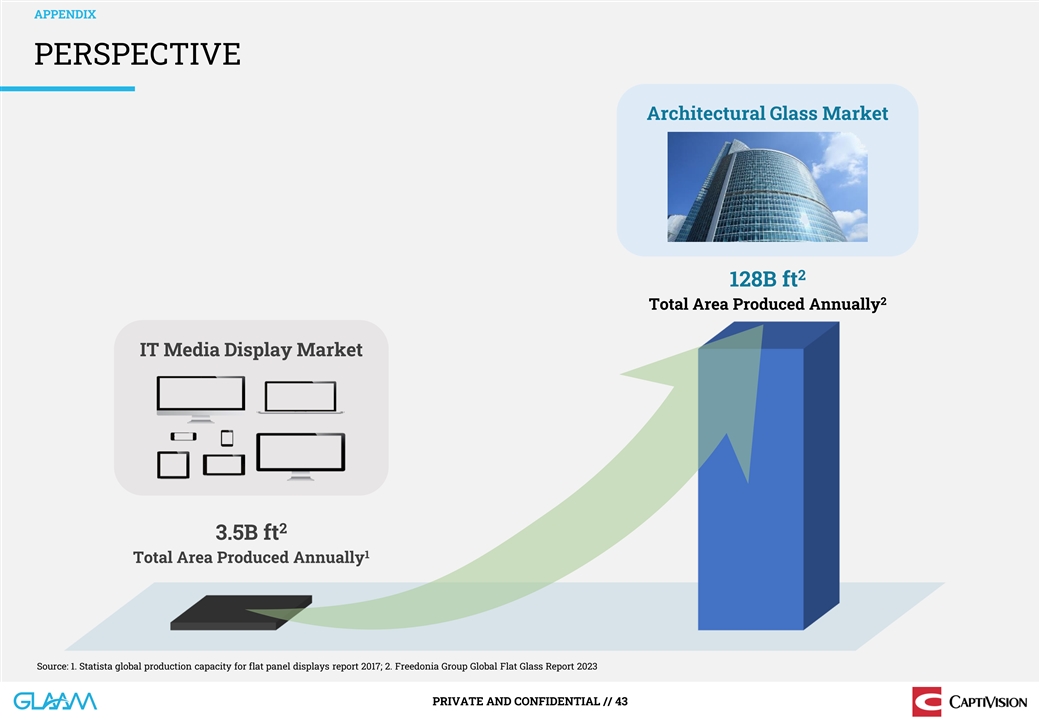
APPENDIX PERSPECTIVE Architectural Glass Market 2 128B ft 2 Total Area
Produced Annually IT Media Display Market 2 3.5B ft 1 Total Area Produced Annually Source: 1. Statista global production capacity for flat panel displays report 2017; 2. Freedonia Group Global Flat Glass Report 2023 PRIVATE AND CONFIDENTIAL //
43

APPENDIX CURRENT ARCHITECTURAL DOOH SOLUTIONS Three Key Requirements:
1. Maintain Real Estate Value (Glass Transparency) 2. Low Maintenance Cost (Architectural Durability) 3. Immense Customization Capability (Architectural Design) LED SCREENS LED MESH LED BARS Poor Transparency Poor Transparency No Transparency
Durability Less Than 5 Years Durability Less Than 5 Years Durability Less Than 5 Years No Customization Very Limited Customization Very Limited Customization PRIVATE AND CONFIDENTIAL // 44
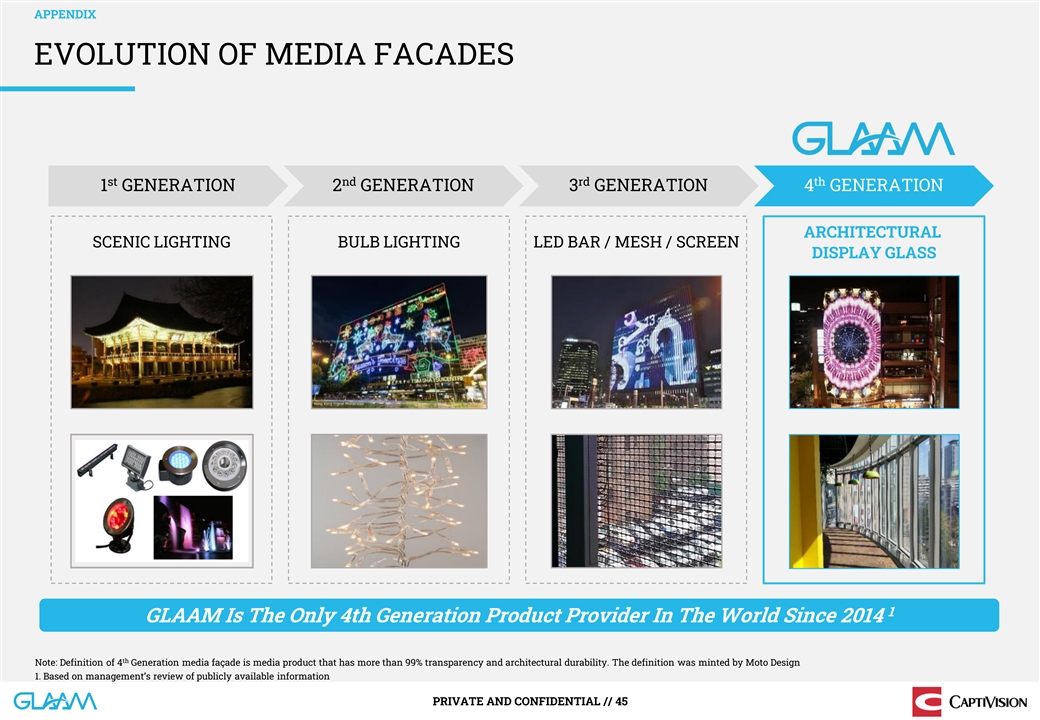
APPENDIX EVOLUTION OF MEDIA FACADES st nd rd th 1 GENERATION 2
GENERATION 3 GENERATION 4 GENERATION ARCHITECTURAL SCENIC LIGHTING BULB LIGHTING LED BAR / MESH / SCREEN DISPLAY GLASS 1 GLAAM Is The Only 4th Generation Product Provider In The World Since 2014 th Note: Definition of 4 Generation media façade
is media product that has more than 99% transparency and architectural durability. The definition was minted by Moto Design 1. Based on management’s review of publicly available information PRIVATE AND CONFIDENTIAL // 45
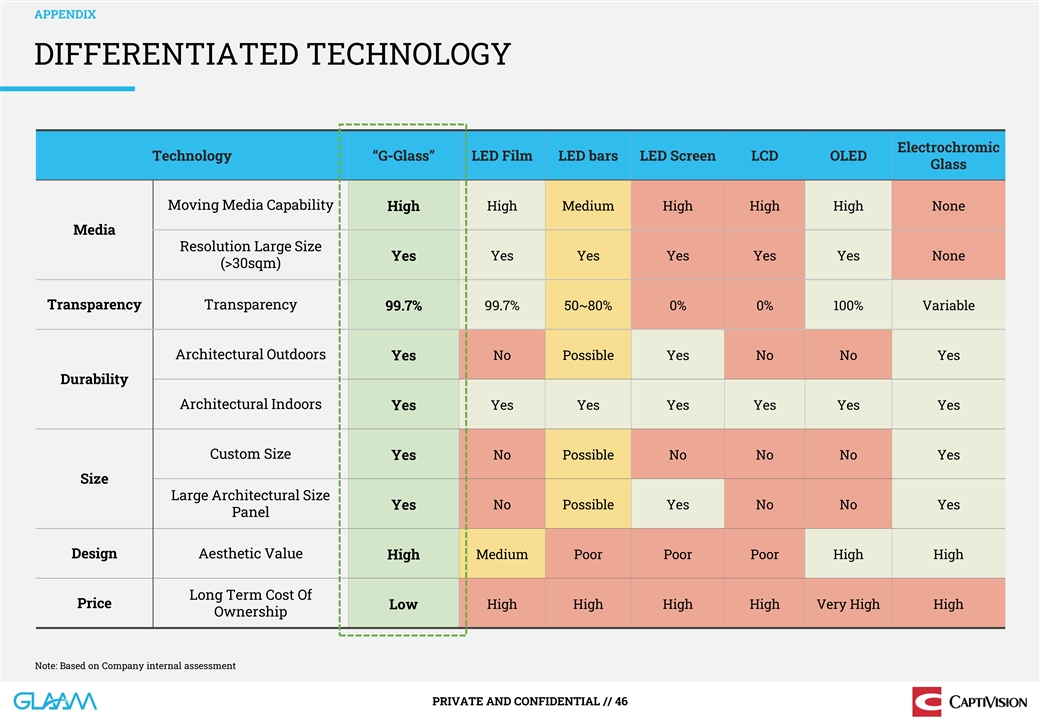
APPENDIX DIFFERENTIATED TECHNOLOGY Electrochromic Technology
“G-Glass” LED Film LED bars LED Screen LCD OLED Glass Moving Media Capability High High Medium High High High None Media Resolution Large Size Yes Yes Yes Yes Yes None Yes (>30sqm) Transparency Transparency 99.7% 99.7% 50~80% 0% 0%
100% Variable Architectural Outdoors Yes No Possible Yes No No Yes Durability Architectural Indoors Yes Yes Yes Yes Yes Yes Yes Custom Size Yes No Possible No No No Yes Size Large Architectural Size No Possible Yes No No Yes Yes Panel Design
Aesthetic Value High Medium Poor Poor Poor High High Long Term Cost Of Price Low High High High High Very High High Ownership Note: Based on Company internal assessment PRIVATE AND CONFIDENTIAL // 46
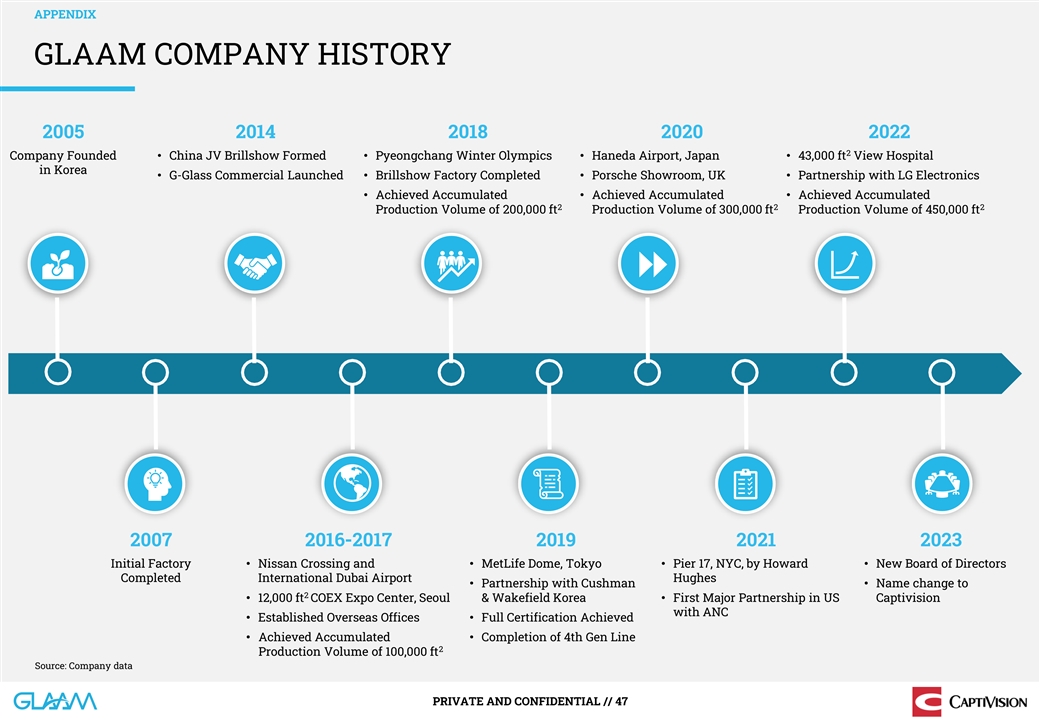
APPENDIX GLAAM COMPANY HISTORY 2005 2014 2018 2020 2022 2 Company
Founded • China JV Brillshow Formed • Pyeongchang Winter Olympics• Haneda Airport, Japan• 43,000 ft View Hospital in Korea • G-Glass Commercial Launched • Brillshow Factory Completed • Porsche Showroom,
UK• Partnership with LG Electronics • Achieved Accumulated • Achieved Accumulated • Achieved Accumulated 2 2 2 Production Volume of 200,000 ft Production Volume of 300,000 ft Production Volume of 450,000 ft 2007 2016-2017
2019 2021 2023 Initial Factory • Nissan Crossing and • MetLife Dome, Tokyo• Pier 17, NYC, by Howard • New Board of Directors Completed International Dubai Airport Hughes • Partnership with Cushman • Name change to
2 • 12,000 ft COEX Expo Center, Seoul & Wakefield Korea• First Major Partnership in US Captivision with ANC • Established Overseas Offices• Full Certification Achieved • Achieved Accumulated • Completion of
4th Gen Line 2 Production Volume of 100,000 ft Source: Company data PRIVATE AND CONFIDENTIAL // 47

APPENDIX GLAAM AWARDS & RECOGNITION 2019 Best Design &
Technology Innovation Award 2018 Best New Technology Use & Product 1 1 Event Technology Awards | Sheffield, UK International Patent Design Expo | Seoul, KR 2018 International Tech Company Award 2018 Inward (Newcomer of the Year) Investment Award
1 1 Thames Valley Tech Awards | London, UK Thames Valley Chamber of Commerce | London, UK st 2018 Company of the Year 2017 1 Prize of Best Exhibition Stand 1 1 Showman’s Show | Bristol, UK SafeHire Awards of Excellence | London, UK 2017
Technology Innovation of the Year Award 2017 World-Class Product of Korea 1 Ministry of Trade, Industry and Energy | Seoul, KR London Build Expo | London, UK 2016 President’s Award for Best Practical New Outstanding Product Certification 1
Technology Korean Public Procurement Agency | Seoul, KR President’s Office | Seoul, KR NEP Certification Suitability of New Industrial Convergence Product Ministry of Trade, Industry and Energy | Seoul, KR Korean Agency for Technology &
Standards | Seoul, KR PRIVATE AND CONFIDENTIAL // 48
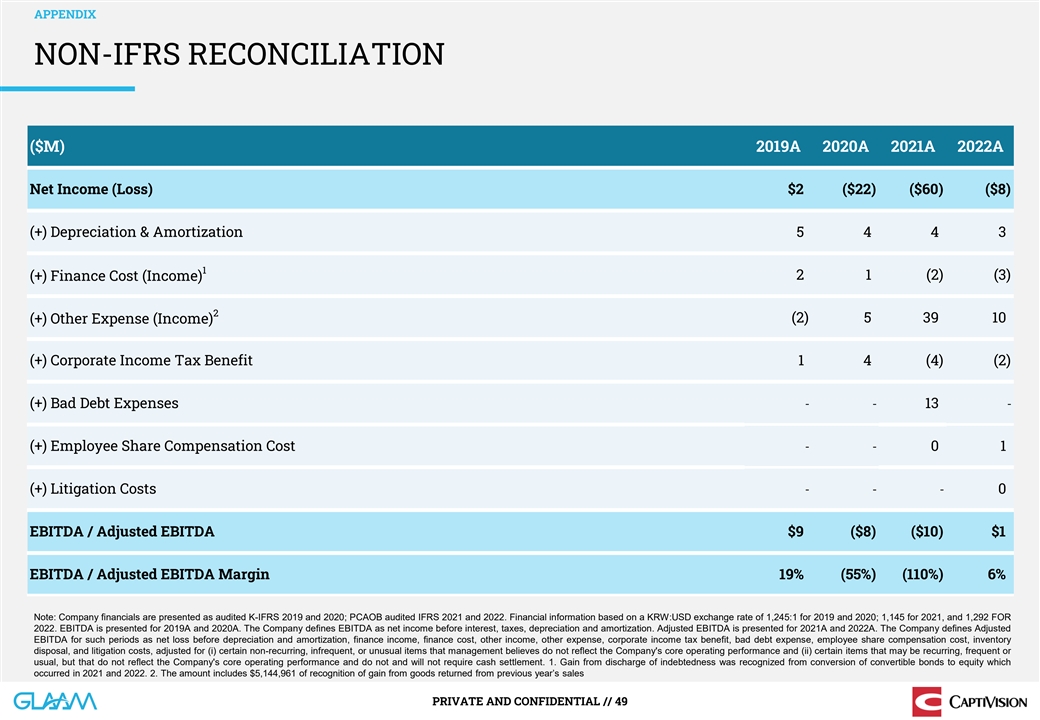
APPENDIX NON-IFRS RECONCILIATION ($M) 2019A 2020A 2021A 2022A Net
Income (Loss) $2 ($22) ($60) ($8) (+) Depreciation & Amortization 5 4 4 3 1 2 1 (2) (3) (+) Finance Cost (Income) 2 (2) 5 39 10 (+) Other Expense (Income) (+) Corporate Income Tax Benefit 1 4 ( 4) (2) (+) Bad Debt Expenses - - 13 - (+) Employee
Share Compensation Cost - - 0 1 (+) Litigation Costs - - - 0 EBITDA / Adjusted EBITDA $9 ($8) ($10) $1 EBITDA / Adjusted EBITDA Margin 19% (55%) (110%) 6% Note: Company financials are presented as audited K-IFRS 2019 and 2020; PCAOB audited IFRS
2021 and 2022. Financial information based on a KRW:USD exchange rate of 1,245:1 for 2019 and 2020; 1,145 for 2021, and 1,292 FOR 2022. EBITDA is presented for 2019A and 2020A. The Company defines EBITDA as net income before interest, taxes,
depreciation and amortization. Adjusted EBITDA is presented for 2021A and 2022A. The Company defines Adjusted EBITDA for such periods as net loss before depreciation and amortization, finance income, finance cost, other income, other expense,
corporate income tax benefit, bad debt expense, employee share compensation cost, inventory disposal, and litigation costs, adjusted for (i) certain non-recurring, infrequent, or unusual items that management believes do not reflect the Company's
core operating performance and (ii) certain items that may be recurring, frequent or usual, but that do not reflect the Company's core operating performance and do not and will not require cash settlement. 1. Gain from discharge of indebtedness was
recognized from conversion of convertible bonds to equity which occurred in 2021 and 2022. 2. The amount includes $5,144,961 of recognition of gain from goods returned from previous year’s sales PRIVATE AND CONFIDENTIAL // 49
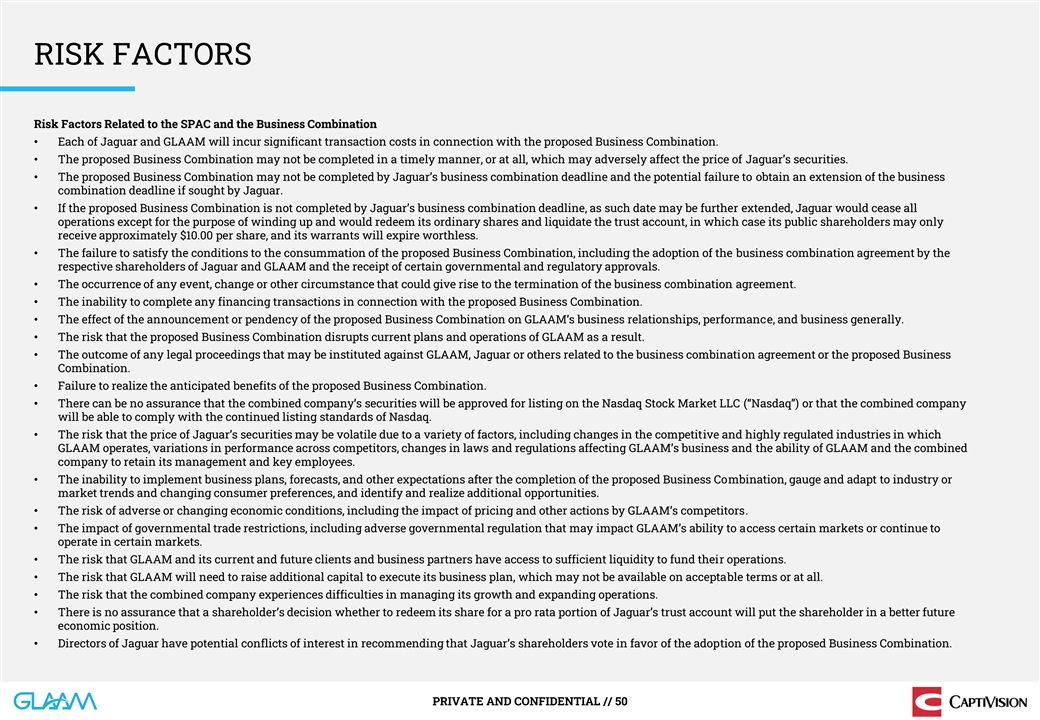
RISK FACTORS Risk Factors Related to the SPAC and the Business
Combination • Each of Jaguar and GLAAM will incur significant transaction costs in connection with the proposed Business Combination. • The proposed Business Combination may not be completed in a timely manner, or at all, which may
adversely affect the price of Jaguar’s securities. • The proposed Business Combination may not be completed by Jaguar’s business combination deadline and the potential failure to obtain an extension of the business combination
deadline if sought by Jaguar. • If the proposed Business Combination is not completed by Jaguar’s business combination deadline, as such date may be further extended, Jaguar would cease all operations except for the purpose of winding up
and would redeem its ordinary shares and liquidate the trust account, in which case its public shareholders may only receive approximately $10.00 per share, and its warrants will expire worthless. • The failure to satisfy the conditions to the
consummation of the proposed Business Combination, including the adoption of the business combination agreement by the respective shareholders of Jaguar and GLAAM and the receipt of certain governmental and regulatory approvals. • The
occurrence of any event, change or other circumstance that could give rise to the termination of the business combination agreement. • The inability to complete any financing transactions in connection with the proposed Business Combination.
• The effect of the announcement or pendency of the proposed Business Combination on GLAAM’s business relationships, performance, and business generally. • The risk that the proposed Business Combination disrupts current plans and
operations of GLAAM as a result. • The outcome of any legal proceedings that may be instituted against GLAAM, Jaguar or others related to the business combination agreement or the proposed Business Combination. • Failure to realize the
anticipated benefits of the proposed Business Combination. • There can be no assurance that the combined company’s securities will be approved for listing on the Nasdaq Stock Market LLC (“Nasdaq”) or that the combined company
will be able to comply with the continued listing standards of Nasdaq. • The risk that the price of Jaguar’s securities may be volatile due to a variety of factors, including changes in the competitive and highly regulated industries in
which GLAAM operates, variations in performance across competitors, changes in laws and regulations affecting GLAAM’s business and the ability of GLAAM and the combined company to retain its management and key employees. • The inability
to implement business plans, forecasts, and other expectations after the completion of the proposed Business Combination, gauge and adapt to industry or market trends and changing consumer preferences, and identify and realize additional
opportunities. • The risk of adverse or changing economic conditions, including the impact of pricing and other actions by GLAAM’s competitors. • The impact of governmental trade restrictions, including adverse governmental
regulation that may impact GLAAM’s ability to access certain markets or continue to operate in certain markets. • The risk that GLAAM and its current and future clients and business partners have access to sufficient liquidity to fund
their operations. • The risk that GLAAM will need to raise additional capital to execute its business plan, which may not be available on acceptable terms or at all. • The risk that the combined company experiences difficulties in
managing its growth and expanding operations. • There is no assurance that a shareholder’s decision whether to redeem its share for a pro rata portion of Jaguar’s trust account will put the shareholder in a better future economic
position. • Directors of Jaguar have potential conflicts of interest in recommending that Jaguar’s shareholders vote in favor of the adoption of the proposed Business Combination. PRIVATE AND CONFIDENTIAL // 50
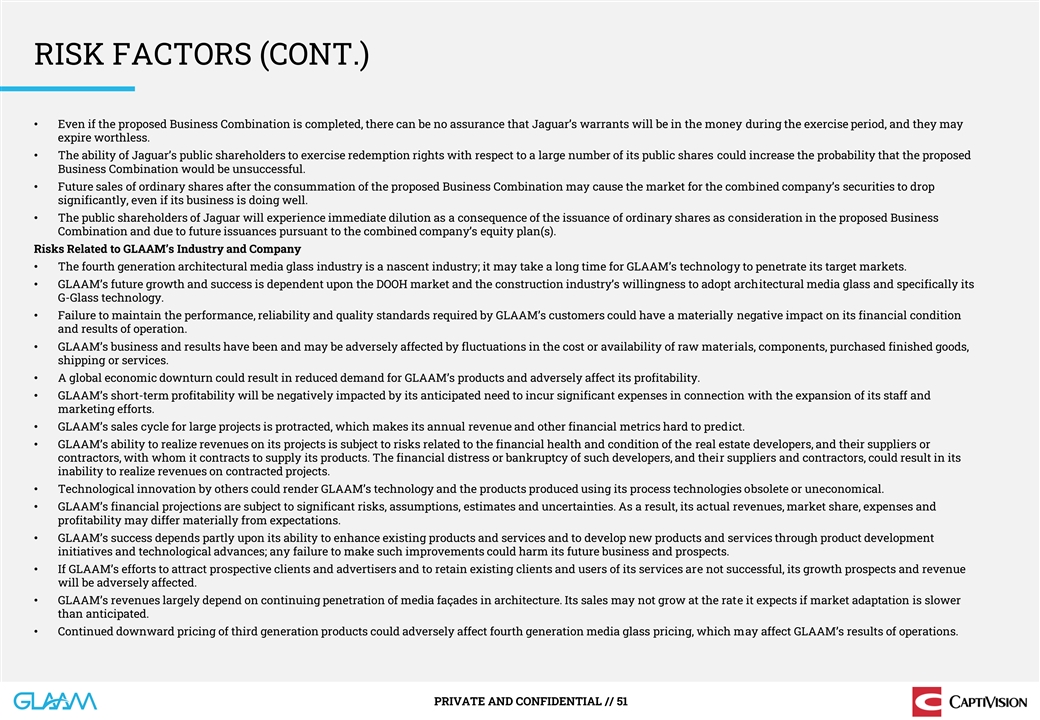
RISK FACTORS (CONT.) • Even if the proposed Business Combination
is completed, there can be no assurance that Jaguar’s warrants will be in the money during the exercise period, and they may expire worthless. • The ability of Jaguar’s public shareholders to exercise redemption rights with respect
to a large number of its public shares could increase the probability that the proposed Business Combination would be unsuccessful. • Future sales of ordinary shares after the consummation of the proposed Business Combination may cause the
market for the combined company’s securities to drop significantly, even if its business is doing well. • The public shareholders of Jaguar will experience immediate dilution as a consequence of the issuance of ordinary shares as
consideration in the proposed Business Combination and due to future issuances pursuant to the combined company’s equity plan(s). Risks Related to GLAAM’s Industry and Company • The fourth generation architectural media glass
industry is a nascent industry; it may take a long time for GLAAM’s technology to penetrate its target markets. • GLAAM’s future growth and success is dependent upon the DOOH market and the construction industry’s willingness
to adopt architectural media glass and specifically its G-Glass technology. • Failure to maintain the performance, reliability and quality standards required by GLAAM’s customers could have a materially negative impact on its financial
condition and results of operation. • GLAAM’s business and results have been and may be adversely affected by fluctuations in the cost or availability of raw materials, components, purchased finished goods, shipping or services. •
A global economic downturn could result in reduced demand for GLAAM’s products and adversely affect its profitability. • GLAAM’s short-term profitability will be negatively impacted by its anticipated need to incur significant
expenses in connection with the expansion of its staff and marketing efforts. • GLAAM’s sales cycle for large projects is protracted, which makes its annual revenue and other financial metrics hard to predict. • GLAAM’s
ability to realize revenues on its projects is subject to risks related to the financial health and condition of the real estate developers, and their suppliers or contractors, with whom it contracts to supply its products. The financial distress or
bankruptcy of such developers, and their suppliers and contractors, could result in its inability to realize revenues on contracted projects. • Technological innovation by others could render GLAAM’s technology and the products produced
using its process technologies obsolete or uneconomical. • GLAAM’s financial projections are subject to significant risks, assumptions, estimates and uncertainties. As a result, its actual revenues, market share, expenses and
profitability may differ materially from expectations. • GLAAM’s success depends partly upon its ability to enhance existing products and services and to develop new products and services through product development initiatives and
technological advances; any failure to make such improvements could harm its future business and prospects. • If GLAAM’s efforts to attract prospective clients and advertisers and to retain existing clients and users of its services are
not successful, its growth prospects and revenue will be adversely affected. • GLAAM’s revenues largely depend on continuing penetration of media façades in architecture. Its sales may not grow at the rate it expects if market
adaptation is slower than anticipated. • Continued downward pricing of third generation products could adversely affect fourth generation media glass pricing, which may affect GLAAM’s results of operations. PRIVATE AND CONFIDENTIAL //
51
RISK FACTORS (CONT.) • GLAAM’s revenue largely depends on
continuing domestic and global demand for architectural glass, large media displays, and associated digital content. Its sales may not grow at the rate it expects. • If new construction levels out and repair and remodeling markets decline,
such market pressures could negatively affect GLAAM’s results of operations. • GLAAM’s government sector sales, which comprise a significant portion of its sales, may be negatively affected by presidential and congressional
elections, policy changes, government land development plan changes and other political local political events. • The IT, vertical real estate and large format wallscape sectors are regulated and any new or modified regulatory restrictions
could negatively affect GLAAM’s sales and results of operations. • Changes in building codes could lower the demand for GLAAM’s G-Glass technology. • GLAAM sometimes manages the installation of its products, which subjects it
to risks and costs that may impact its profit margin. • GLAAM sometimes relies on third-party contractors for the installation of its products, which subjects it to risks and costs that are out of its control. • GLAAM is subject to
labor, health, construction/building and safety regulations, and may be exposed to liabilities and potential costs for lack of compliance. • GLAAM will incur increased costs and become subject to additional regulations and financial reporting
obligations as a result of becoming a newly public company. • GLAAM relies on key researchers and engineers, senior management and production facility operators, and the loss of the services of any such personnel or the inability to attract
and retain them may negatively affect its business. • Equipment failures, delays in deliveries and catastrophic loss at GLAAM’s manufacturing facilities could lead to production curtailments or shutdowns that prevent it from producing
its products. • GLAAM may be adversely affected by disruptions to its manufacturing facilities or disruptions to its customer, supplier or employee base. • GLAAM operates with a modest inventory, which may make it difficult for it to
efficiently allocate capacity on a timely basis in response to changes in demand. • GLAAM may experience losses on inventories. • Any issues or delays in meeting GLAAM’s projected manufacturing costs and production capacity could
adversely impact its business, prospects, operating results and financial condition. • GLAAM’s failure to properly manage the distribution of its products and services could result in the loss of revenues and profits. •
GLAAM’s business involves complex manufacturing processes that may cause personal injury or property damage, subjecting it to liabilities and possible losses or other disruptions of its operations in the future, which may not be covered by
insurance. • GLAAM’s business relies on its patent rights which may be narrowed in scope or found to be invalid or otherwise unenforceable. • Failure to protect its intellectual property rights could impair GLAAM’s
competitiveness and harm its business and future prospects. • GLAAM is subject to potential exposure to environmental liabilities and is subject to environmental regulation and any such liabilities or regulation may negatively affect its costs
and results of operations in the future. • Earthquakes, tsunamis, floods, severe health epidemics (including the ongoing global COVID-19 pandemic and any possible recurrence of other types of widespread infectious diseases) and other natural
calamities could materially adversely affect GLAAM’s business, results of operations or financial condition. • GLAAM’s business, results of operations and financial condition have been, and could continue to be, adversely affected
by the COVID-19 pandemic. • GLAAM continues to face significant risks associated with its international expansion strategy. • GLAAM’s financial results could vary significantly from quarter to quarter and are difficult to predict.
PRIVATE AND CONFIDENTIAL // 52
RISK FACTORS (CONT.) • GLAAM may require substantial additional
financing to fund its operations and complete the development and commercialization of the process technologies that produce each of its products or new aspects of its existing process technologies that produce each of its products, and it may not
be able to do so on favorable terms. • If GLAAM is unable to manage its growth and expand its operations successfully, its reputation and brand may be damaged and its business and results of operations may be harmed. • GLAAM’s
results of operations are subject to exchange rate fluctuations, which may affect its costs and revenues. • Increasing interest rates could materially adversely affect GLAAM’s ability to generate positive cashflows and secure financing
required to carry out its strategic plans. • Government regulation of DOOH advertising may restrict GLAAM’s out-of-home advertising operations. • The advancement of laws and regulations may not keep pace with the accelerating
advancement of the digital signage industry and technology, may have a detrimental effect on the growth of GLAAM’s industry. • Failures or security breaches of GLAAM’s networks or information technology systems could have an
adverse effect on its business. • GLAAM does not have absolute control over the affiliates where it is the minority shareholder nor does it maintain control over the actions of other shareholders. Actions of other shareholders of affiliates
could negatively impact GLAAM’s performance. • GLAAM’s joint distribution agreement with G-SMATT Global, which is in effect until 2025, may adversely affect its financial results. • GLAAM’s Excellent Product designation
of G-Glass by the Public Procurement Service of Korea expires in March 31, 2026, which may materially adversely affect its domestic government sales. Risks Related to South Korea and Other Countries Where GLAAM Operates • If economic
conditions in South Korea deteriorate, GLAAM’s current business and future growth could be materially and adversely affected. • GLAAM is subject to the risks of operations in the United Kingdom, China, Japan, Hong Kong and the United
States. • Increased tensions with North Korea could adversely affect the South Korean economy and, consequently, GLAAM’s results of operations and financial condition in the future. • GLAAM’s businesses and partnerships may
be affected by geopolitical tensions between China and the United States. • Further militarization of the South Pacific in response to the growing military strength of China could destabilize political relationships in the region and impact
regional businesses. • A conflict between Taiwan and China could impact regional businesses. • The armed conflict between Russia and Ukraine, including sanctions and tensions between the United States along with several other countries
and Russia, may adversely affect the results of GLAAM’s operations. • It may be difficult or impossible to enforce judgments of courts of the United States and other jurisdictions against GLAAM. • Changes in South Korea’s
customs, import and export laws and foreign policy, may have an adverse effect on GLAAM’s financial condition and results of operations. • New or higher taxes resulting from changes in tax regulations or the interpretation thereof in
South Korea could adversely affect GLAAM’s results of operations and financial condition in the future In addition to the summary discussion, you should carefully consider the risks and uncertainties described in New PubCo's filings with the
SEC, including in the Risk Factors section of the Registration Statement and of JGGC's final prospectus, dated February 10, 2022 included in the registration statement on Form S-1 (registration No. 260483). PRIVATE AND CONFIDENTIAL // 53
Jaguar Global Growth Cor... (NASDAQ:JGGCU)
Graphique Historique de l'Action
De Avr 2024 à Mai 2024

Jaguar Global Growth Cor... (NASDAQ:JGGCU)
Graphique Historique de l'Action
De Mai 2023 à Mai 2024
