false
0000027904
0000027904
2024-01-11
2024-01-11
iso4217:USD
xbrli:shares
iso4217:USD
xbrli:shares
UNITED STATES
SECURITIES AND EXCHANGE COMMISSION
Washington, D.C. 20549
FORM 8-K
CURRENT REPORT
Pursuant to Section 13 OR 15(d) of the
Securities Exchange Act of 1934
Date of Report (Date of earliest event
reported): January
11, 2024
DELTA AIR LINES,
INC.
(Exact name of
registrant as specified in its charter)
| Delaware | |
001-05424 | |
58-0218548 |
(State or other jurisdiction
of incorporation) | |
(Commission
File Number) | |
(IRS Employer
Identification No.) |
P.O. Box 20706, Atlanta, Georgia 30320-6001
(Address of principal executive offices)
Registrant’s telephone number, including
area code: (404) 715-2600
Registrant’s Web site address: www.delta.com
Check the appropriate box below if the Form 8-K filing is intended
to simultaneously satisfy the filing obligation of the registrant under any of the following provisions (see General Instruction A.2.
below):
☐ Written communications
pursuant to Rule 425 under the Securities Act (17 CFR 230.425)
☐ Soliciting material
pursuant to Rule 14a-12 under the Exchange Act (17 CFR 240.14a-12)
☐ Pre-commencement
communications pursuant to Rule 14d-2(b) under the Exchange Act (17 CFR 240.14d-2(b))
☐ Pre-commencement
communications pursuant to Rule 13e-4(c) under the Exchange Act (17 CFR 240.13e-4(c))
Securities registered
pursuant to Section 12(b) of the Act:
| Title of each class |
Trading Symbol |
Name of each exchange on which registered |
| Common Stock, par value $0.0001 per share |
DAL |
New York Stock Exchange |
Indicate by check mark whether the registrant is an emerging growth
company as defined in Rule 405 of the Securities Act of 1933 (17 CFR 230.405) or Rule 12b-2 of the Securities Exchange Act of 1934 (17
CFR 240.12b-2).
Emerging
growth company ☐
If an emerging growth company, indicate
by check mark if the registrant has elected not to use the extended transition period for complying with any new or revised financial
accounting standards provided pursuant to Section 13(a) of the Exchange Act. ☐
| Item 1.01 | Entry into a Material Definitive Agreement. |
On January 11, 2024, Delta Air Lines, Inc. (“Delta”) entered
into a definitive agreement with Airbus S.A.S. to purchase 20 Airbus A350-1000 aircraft, with an option to purchase up to an additional
20 widebody aircraft. Deliveries of the A350-1000 aircraft will begin in 2026. In addition to improved fuel efficiency, these aircraft
will add higher gauge, including more premium seating and greater cargo capabilities, to Delta’s international widebody fleet. The
order for the aircraft is within Delta’s previously announced capital expenditure and capacity targets.
| Item 2.02 | Results of Operations and Financial Condition. |
Delta today issued a press release reporting financial results for
the quarter ended December 31, 2023 and full year 2023. The press release is furnished as Exhibit 99.1 to this Form 8-K. In addition,
a summary containing supplemental information is being furnished as Exhibit 99.2 to this Form 8-K.
The information furnished in this Form 8-K, including Exhibits 99.1
and 99.2 attached hereto, shall not be deemed incorporated by reference into any other filing with the Securities and Exchange Commission.
| Item 9.01 | Financial Statements and Exhibits. |
(d) Exhibits.
Forward Looking Statements
Statements made in this Form 8-K that are not historical facts,
including statements regarding our estimates, expectations, beliefs, intentions, projections, goals, aspirations, commitments or strategies
for the future, should be considered “forward-looking statements” under the Securities Act of 1933, as amended, the Securities
Exchange Act of 1934, as amended, and the Private Securities Litigation Reform Act of 1995. Such statements are not guarantees or promised
outcomes and should not be construed as such. All forward-looking statements involve a number of risks and uncertainties that could cause
actual results to differ materially from the estimates, expectations, beliefs, intentions, projections, goals, aspirations, commitments
and strategies reflected in or suggested by the forward-looking statements. These risks and uncertainties include, but are not limited
to, the impact of incurring significant debt in response to the COVID-19 pandemic; failure to comply with the financial and other covenants
in our financing agreements; the possible effects of accidents involving our aircraft or aircraft of our airline partners; breaches or
lapses in the security of technology systems on which we rely, which could compromise the data stored within them, as well as failure
to comply with ever-evolving global privacy and security regulatory obligations or adequately address increasing customer focus on privacy
issues and data security; disruptions in our information technology infrastructure; our dependence on technology in our operations; our
commercial relationships with airlines in other parts of the world and the investments we have in certain of those airlines; the effects
of a significant disruption in the operations or performance of third parties on which we rely; failure to realize the full value of intangible
or long-lived assets; labor issues; the effects on our business of seasonality and other factors beyond our control, including severe
weather conditions, natural disasters or other environmental events, including from the impact of climate change; changes in the cost
of aircraft fuel; extended disruptions in the supply of aircraft fuel, including from Monroe Energy, LLC (“Monroe”), a wholly-owned
subsidiary of Delta; failure or inability of insurance to cover a significant liability at Monroe’s Trainer refinery; failure to
comply with existing and future environmental regulations to which Monroe’s refinery operations are subject, including costs related
to compliance with renewable fuel standard regulations; significant damage to our reputation and brand, including from exposure to significant
adverse publicity or inability to achieve certain sustainability goals; our ability to retain senior management and other key employees,
and to maintain our company culture; disease outbreaks, such as the COVID-19 pandemic or similar public health threats, and measures implemented
to combat them; the effects of terrorist attacks, geopolitical conflict or security events; competitive conditions in the airline industry;
extended interruptions or disruptions in service at major airports at which we operate or significant problems associated with types of
aircraft or engines we operate; the effects of extensive government regulation we are subject to; the impact of environmental regulation,
including but not limited to increased regulation to reduce emissions and other risks associated with climate change, and the cost of
compliance with more stringent environmental regulations; and unfavorable economic or political conditions in the markets in which we
operate or volatility in currency exchange rates.
Additional information concerning risks and uncertainties that could
cause differences between actual results and forward-looking statements is contained in our Securities and Exchange Commission filings,
including our Annual Report on Form 10-K for the fiscal year ended December 31, 2022. Caution should be taken not to place undue reliance
on our forward-looking statements, which represent our views only as of the date of this Form 8-K, and which we undertake no obligation
to update except to the extent required by law.
SIGNATURES
Pursuant to the requirements of the Securities
Exchange Act of 1934, the registrant has duly caused this report to be signed on its behalf by the undersigned hereunto duly authorized.
| |
DELTA AIR LINES, INC. |
| |
|
|
| |
|
|
| |
|
|
| |
By: |
/s/ Daniel C. Janki |
| |
|
Daniel C. Janki |
| Date: January 12, 2024 |
|
Executive Vice President & Chief Financial Officer |
Exhibit 99.1

| CONTACT: |
Investor Relations |
Corporate Communications |
| |
404-715-2170 |
404-715-2554 |
| |
InvestorRelations@delta.com |
Media@delta.com |
Delta Air Lines Announces December Quarter and
Full Year 2023 Financial Results
Delivered industry-leading operational performance
and financial results in December quarter
Generated record full year revenue and over
$5 billion of pre-tax income, a near doubling over 2022
Guiding to 2024 free cash flow of $3 to $4
billion, an improvement of up to $2 billion over 2023
Expect record March quarter revenue on improving
domestic environment and continued strength in international demand, with solid profitability
ATLANTA, January 12, 2024 – Delta Air Lines (NYSE: DAL)
today reported financial results for the December quarter and full year 2023 and provided its outlook for the March quarter and full year
2024. Highlights of the December quarter and full year 2023, including both GAAP and adjusted metrics, are on page six and incorporated
here.
“2023 was a great year for Delta with industry-leading operational
and financial performance. Our people and their commitment to deliver unmatched service excellence for our customers is at the foundation
of Delta’s success. We are thrilled to recognize their outstanding work with $1.4 billion in profit sharing payments next month,”
said Ed Bastian, Delta’s chief executive officer. “In 2024, demand for air travel remains strong and our customer base is
in a healthy financial position with travel a top priority. We expect to grow full year earnings to $6 to $7 per share and generate free
cash flow of $3 to $4 billion, further strengthening our financial foundation.”
December Quarter 2023 GAAP Financial Results
| • | Operating revenue of $14.2 billion |
| • | Operating income of $1.3 billion with an operating margin of
9.3 percent |
| • | Pre-tax income of $2.3 billion with a pre-tax margin of 16.0
percent |
| • | Earnings per share of $3.16 |
| • | Operating cash flow of $545 million |
| • | Payments on debt and finance lease obligations of $361 million |
December Quarter 2023 Adjusted Financial Results
| • | Operating revenue of $13.7 billion, 11 percent higher than the
December quarter 2022 |
| • | Operating income of $1.3 billion with an operating margin of
9.7 percent |
| • | Pre-tax income of $1.1 billion with a pre-tax margin of 7.8 percent |
| • | Earnings per share of $1.28 |
| • | Operating cash flow of $499 million |
Full Year 2023 GAAP Financial Results
| • | Operating revenue of $58.0 billion |
| • | Operating income of $5.5 billion with an operating margin of
9.5 percent |
| • | Pre-tax income of $5.6 billion with a pre-tax margin of 9.7 percent |
| • | Earnings per share of $7.17 |
| • | Operating cash flow of $6.5 billion |
| • | Payments on debt and finance lease obligations of $4.1 billion |
| • | Total debt and finance lease obligations of $20.1 billion at
year end |
Full Year 2023 Adjusted Financial Results
| • | Operating revenue of $54.7 billion, 20 percent higher than the
full year 2022 |
| • | Operating income of $6.3 billion with an operating margin of
11.6 percent |
| • | Pre-tax income of $5.2 billion with a pre-tax margin of 9.5 percent |
| • | Earnings per share of $6.25 |
| • | Operating cash flow of $7.2 billion |
| • | Free cash flow of $2.0 billion |
| • | Adjusted debt to EBITDAR of 3.0x, down from 5.0x at the end of
2022 |
| • | Return on invested capital of 13.4 percent, up 5 points over
2022 |
Financial Guidance1
| |
FY 2024 Forecast |
| Earnings Per Share |
$6 - $7 |
| Free Cash Flow ($B) |
$3 - $4 |
| Adjusted Debt to EBITDAR |
2x - 3x |
| |
1Q24 Forecast |
| Total Revenue YoY |
Up 3% - 6% |
| Operating Margin |
Approx. 5% |
| Earnings Per Share |
$0.25 - $0.50 |
| |
|
1Non-GAAP
measures; Refer to Non-GAAP reconciliations for historical comparison figures
|
Additional metrics for financial modeling can be found in the Supplemental
Information section under Quarterly Results on ir.delta.com.
Revenue Environment and Outlook
"With industry-leading operational performance and best-in-class
service delivered by our people, more customers than ever are choosing Delta. In 2023 we delivered a record $54.7 billion in revenue,
20 percent higher than 2022. Premium and non-ticket revenue has reached 55 percent of total revenue, supporting Delta's differentiated
financial results from the industry,” said Glen Hauenstein, Delta’s president. “With strong demand for international
travel and a positive inflection in the domestic environment, we expect March quarter adjusted revenue to be 3 to 6 percent higher than
the prior year.”
“With our outlook for continued revenue growth, we expect March
quarter unit revenues to be flat to down 3 percent over 2023,” Glen said. “The midpoint of this outlook implies a two-point
sequential improvement in unit revenues on a year-over-year basis. The March quarter includes a headwind from higher international mix,
the normalization of travel credit utilization and lapping a competitor’s operational challenges in the year ago period.”
| • | Industry-leading operational results with strong leisure and
business demand continuing: Delta delivered record December quarter revenue with the highest holiday travel volumes in its history.
Operational performance was best-in-class with leading system-wide completion factor and on-time performance. Corporate sales accelerated
into year end, including double-digit year-over-year growth in the month of December. Technology and Financial Services led momentum
for the December quarter, with Media and Auto sectors seeing notable traction following strike resolutions. Recent corporate survey results
indicate that 93 percent of companies surveyed expect their travel volumes to increase sequentially or stay the same in the March quarter
and into 2024. |
| • | International demand remains strong: International passenger
revenue was 25 percent higher versus the December quarter 2022 with double-digit revenue and capacity growth in the Transatlantic, Pacific
and Latin entities. Transatlantic performance led with passenger unit revenues up 9 percent versus the December quarter 2022. Full year
results generated record margins across all three international regions. |
| • | Premium and Loyalty driving revenue diversification: Premium
revenue grew 15 percent versus the December quarter 2022 on record paid load factors, outperforming Main Cabin. Loyalty revenue improved
11 percent, driven by strong co-brand spend growth. Remuneration from American Express for the December quarter was $1.7 billion, approximately
11 percent higher than the December quarter 2022, and full year remuneration of $6.8 billion grew 22 percent year-over-year. For the
full year, diversified revenue streams, including Loyalty, Premium, Cargo, and MRO comprised 55 percent of total revenues. |
Cost Performance and Outlook
“We closed the year strong, with full-year operating margin expanding
by four points to 11.6 percent.” said Dan Janki, Delta’s chief financial officer. “In 2024 we are entering a period
of optimization and expect to unlock efficiencies that will fund continued investment in our people, our operation and our customers.
We expect to deliver earnings and cash flow growth for the full year, with non-fuel unit costs up low-single digits over 2023.”
December Quarter 2023 Cost Performance
| • | Operating expense of $12.9 billion and adjusted operating expense
of $12.3 billion |
| • | Adjusted non-fuel costs of $9.1 billion |
| • | Non-fuel CASM was 1.1 percent higher year-over-year |
| • | Adjusted fuel expense of $2.9 billion was up 6 percent year-over-year |
| • | Adjusted fuel price of $3.00 per gallon declined 6 percent year-over-year
with a breakeven refinery contribution following the planned maintenance at the refinery facilities |
| • | Fuel efficiency, defined as gallons per 1,000 ASMs, was 14.3,
a 2 percent improvement year-over-year |
Full Year 2023 Cost Performance
| • | Operating expense of $52.5 billion and adjusted operating expense
of $48.3 billion |
| • | Adjusted non-fuel costs of $35.8 billion |
| • | Non-fuel CASM was 2.3 percent higher year-over-year |
| • | Adjusted fuel expense of $11.1 billion was down 3 percent year-over-year |
| • | Adjusted fuel price of $2.83 per gallon declined 16 percent year-over-year
and includes a refinery benefit of 10¢ per gallon |
| • | Fuel efficiency, defined as gallons per 1,000 ASMs, was 14.4,
a 1.4 percent improvement year-over-year |
Balance Sheet, Cash and Liquidity
“Delta delivered $2 billion of free cash flow in the year, while
reinvesting in the business and repaying $4.1 billion of gross debt. During the year, we reduced leverage to 3x and reinstated the quarterly
dividend,” Janki said. “We expect 2024 free cash flow of $3 to $4 billion, an up to $2 billion improvement driven by continued
earnings growth, lower capital expenditures and a higher mix of cash sales. With strong cash generation, we expect to continue reducing
debt and growing our unencumbered asset base, progressing our balance sheet towards investment grade.”
| • | Adjusted net debt of $21.4 billion at December quarter end, a
reduction of $879 million from the end of 2022 |
| • | Payments on debt and finance lease obligations for the full year
of $4.1 billion |
| • | Weighted average interest rate of 4.6 percent with 90 percent
fixed rate debt and 10 percent variable rate debt |
| • | Borrowed $878 million in connection with tax-exempt bond financing
to provide a majority of funding to complete the generational terminal transformation at LaGuardia airport |
| • | Adjusted operating cash flow in the December quarter of $499
million and gross capital expenditures of $1.2 billion |
| • | Full year adjusted operating cash flow of $7.2 billion and gross
capital expenditures of $5.3 billion, resulting in $2.0 billion free cash flow |
| • | Air Traffic Liability ended the year at $7.0 billion |
| • | Liquidity* of $6.8 billion at year-end, including $2.9 billion
in undrawn revolver capacity |
*Includes cash and cash equivalents,
short-term investments and undrawn revolving credit facilities
Fleet Update
Today, Delta announced it reached an agreement with Airbus to purchase
twenty A350-1000s, with options for twenty additional widebody aircraft. Deliveries of the aircraft are scheduled to begin in 2026. In
addition to improved fuel efficiency, these aircraft will add higher gauge, more premium seating and greater cargo capabilities to the
international widebody fleet. The company also announced a service agreement with Rolls Royce to service its Trent XWB-97 engines. The
order for the aircraft is within Delta’s previously announced capital expenditure and capacity targets.
December Quarter and Full Year 2023 Highlights
Operations, Network and Fleet
| • | Earned the Cirium Platinum Award for operational excellence for
the third consecutive year, and named the most on-time airline in North America, a demonstration of Delta's commitment to operational
performance and minimizing passenger disruption |
| • | Operated the most reliable airline during the quarter1
with a completion factor of 99.8%, and for the full year, Delta’s network system ranked first among competitors in on-time arrivals2 |
| • | Took delivery of 15 aircraft in the December quarter, bringing
full year aircraft deliveries to 43, including 27 A321neo, 9 A220-300 and 7 A330-900 aircraft |
| • | Building on Delta's partnership with LATAM, launched new and
returning service to Rio de Janeiro from Delta's Atlanta and New York-JFK hubs |
| • | Announced daily nonstop service from Seattle to Taipei beginning
June 2024 |
| • | Launched a long-term codeshare agreement with EL AL Israel airlines
in December with travel beginning January 1st, improving connection for customers flying between the Americas and Tel-Aviv |
| • | Announced the launch of Delta’s codeshare relationship
with airBaltic, providing customers with convenient connections and more flexible booking options between North America and Latvia |
Culture and People
| • | Delta people earned $1.4 billion in profit sharing and $53 million
in Shared Rewards for the year, recognizing the outstanding performance of Delta’s 100,000 employees |
| • | Delta ranked No. 13 in the U.S. on Glassdoor's Best Places to
Work list, the 8th year in a row the company has been named a Best Place to Work by Glassdoor |
| • | Delta volunteers helped build four Habitat for Humanity homes,
bringing the total built or rehabbed by Delta to 283 across 13 countries |
| • | Building on Delta's Propel Program designed to develop the next
generation of pilots, welcomed 61 employees to the program in the year |
| • | Delta celebrated 19 years in partnership with Marine Toys for
Tots, presenting over 1,200 bikes, 1,200 toys and a $50,000 contribution to the organization at its annual holiday event at Delta TechOps.
Delta has contributed $700,000 annually to Toys for Tots system wide. |
Customer Experience and Loyalty
| • | Engagement with Delta and the SkyMiles program reached an all-time
high, with record membership growth, co-brand spend and revenue from travel-adjacent services |
| • | Named the No. 1 airline in the Business Travel News Airline survey
for the 13th consecutive year, citing Delta’s customer service, distribution channels, expansive network and quality of communications |
| • | Delta’s LAX Sky Club was named North America’s Best
Airline Lounge for 2023 by Business Traveler |
| • | Added Walmart+ to the Delta Sync suite of partners to offer customers
the power and convenience of shopping from the air |
| • | Opened the Window Seat Shop at JFK during the holiday season,
where SkyMiles members can shop artisan gifts from small businesses across Delta’s global network while earning Medallion Qualification
Dollars (MQDs) toward 2025 status |
| • | The Fly Delta App crossed 1 billion in annual visits in 2023,
up 25% year-over-year |
Environmental, Social and Governance
| • | Improved fuel efficiency through fleet renewal and saved more
than 8 million gallons of fuel year-over-year through other cross-divisional efforts, coordinated through Delta’s Carbon Council.
Initiatives include catering service weight reduction and enhanced aircraft routing |
| • | Delta retired the CRJ-200, its least fuel-efficient aircraft
type, making Delta the only major U.S. airline with premium seating on every flight |
| • | Began final testing of paper cups onboard, with the opportunity
to eliminate nearly seven million pounds of single-use plastics onboard annually once fully implemented system wide |
| • | Recognized by Forbes in three of its annual lists of America's
Best Employers for Women, America's Best Employers for Veterans and America's Best Employers for Diversity |
| • | Identified by Newsweek as one of America's Greatest Workplaces
for LGBTQ+ and for Veterans |
| • | Delta led the formation of Americans for Clean Aviation Fuels,
a coalition of the largest industrial sectors in America focused on promoting the economic benefits of building a robust market for Sustainable
Aviation Fuel (SAF) |
| • | Delta continues to make progress increasing representation of
women, Black talent and Latin and Hispanic talent in management roles across the company, as outlined in the 2023 Close the Gap update |
1FlightStats preliminary data
for Delta flights system wide and for Delta's competitive set (AA, UA, B6, AS, WN, and DL), from October 1 - December 31, 2023.
2FlightStats preliminary data
for Delta flights system wide and for Delta's competitive set (AA, UA, B6, AS, WN, and DL), from January 1 - December 31, 2023. On-time
is defined as A0.
December Quarter and Full Year 2023 Results
December quarter and full year results have been adjusted primarily
for the third-party refinery sales, unrealized gains on investments, one-time expenses related to the new pilot agreement and loss on
extinguishment of debt as described in the reconciliations in Note A.
| | |
GAAP | | |
Adjusted | | |
GAAP | | |
Adjusted | |
| ($ in millions except per share and unit costs) | |
4Q23 | | |
4Q22 | | |
4Q23 | | |
4Q22 | | |
FY23 | | |
FY22 | | |
FY23 | | |
FY22 | |
| Operating income | |
| 1,323 | | |
| 1,470 | | |
| 1,330 | | |
| 1,422 | | |
| 5,521 | | |
| 3,661 | | |
| 6,334 | | |
| 3,566 | |
| Operating margin | |
| 9.3 | % | |
| 10.9 | % | |
| 9.7 | % | |
| 11.6 | % | |
| 9.5 | % | |
| 7.2 | % | |
| 11.6 | % | |
| 7.8 | % |
| Pre-tax income | |
| 2,275 | | |
| 1,120 | | |
| 1,064 | | |
| 1,242 | | |
| 5,608 | | |
| 1,914 | | |
| 5,220 | | |
| 2,703 | |
| Pre-tax margin | |
| 16.0 | % | |
| 8.3 | % | |
| 7.8 | % | |
| 10.1 | % | |
| 9.7 | % | |
| 3.8 | % | |
| 9.5 | % | |
| 5.9 | % |
| Net income | |
| 2,037 | | |
| 828 | | |
| 826 | | |
| 950 | | |
| 4,609 | | |
| 1,318 | | |
| 4,020 | | |
| 2,053 | |
| Diluted earnings per share | |
| 3.16 | | |
| 1.29 | | |
| 1.28 | | |
| 1.48 | | |
| 7.17 | | |
| 2.06 | | |
| 6.25 | | |
| 3.20 | |
| Operating revenue | |
| 14,223 | | |
| 13,435 | | |
| 13,661 | | |
| 12,292 | | |
| 58,048 | | |
| 50,582 | | |
| 54,669 | | |
| 45,605 | |
| Total revenue per available seat mile (TRASM) (cents) | |
| 20.78 | | |
| 22.58 | | |
| 19.95 | | |
| 20.66 | | |
| 21.34 | | |
| 21.69 | | |
| 20.10 | | |
| 19.55 | |
| Operating expense | |
| 12,900 | | |
| 11,965 | | |
| 12,330 | | |
| 10,871 | | |
| 52,527 | | |
| 46,921 | | |
| 48,335 | | |
| 42,039 | |
| Cost per available seat mile (CASM) (cents) | |
| 18.84 | | |
| 20.11 | | |
| 13.29 | | |
| 13.14 | | |
| 19.31 | | |
| 20.12 | | |
| 13.17 | | |
| 12.87 | |
| Fuel expense | |
| 2,941 | | |
| 2,849 | | |
| 2,933 | | |
| 2,778 | | |
| 11,069 | | |
| 11,482 | | |
| 11,121 | | |
| 11,453 | |
| Average fuel price per gallon | |
| 3.01 | | |
| 3.28 | | |
| 3.00 | | |
| 3.20 | | |
| 2.82 | | |
| 3.36 | | |
| 2.83 | | |
| 3.36 | |
| Operating cash flow | |
| 545 | | |
| 1,189 | | |
| 499 | | |
| 1,211 | | |
| 6,464 | | |
| 6,363 | | |
| 7,216 | | |
| 6,210 | |
| Capital expenditures | |
| 1,602 | | |
| 2,200 | | |
| 1,201 | | |
| 2,113 | | |
| 5,323 | | |
| 6,366 | | |
| 5,305 | | |
| 6,008 | |
| Total debt and finance lease obligations | |
| 20,054 | | |
| 23,030 | | |
| | | |
| | | |
| 20,054 | | |
| 23,030 | | |
| | | |
| | |
| Adjusted net debt | |
| | | |
| | | |
| 21,424 | | |
| 22,303 | | |
| | | |
| | | |
| 21,424 | | |
| 22,303 | |
About Delta Air Lines Through the warmth and service
of Delta Air Lines (NYSE: DAL) people and the power of innovation, Delta never stops looking for ways to make every trip feel tailored
to every customer. 100,000 Delta people lead the way in delivering a world-class customer experience on over 4,000 daily flights to more
than 280 destinations on six continents, connecting people to places and to each other.
Delta served more than 190 million customers in 2023 -- safely,
reliably and with industry-leading customer service innovation – and was again recognized as North
America’s most on-time airline. We remain committed to ensuring that the future of travel is connected, personalized
and enjoyable. Our people’s genuine and enduring motivation is to make every customer feel welcomed and respected across every
point of their journey with us.
Headquartered in Atlanta, Delta operates significant hubs and key
markets in Amsterdam, Atlanta, Bogota, Boston, Detroit, Lima, London-Heathrow, Los Angeles, Mexico City, Minneapolis-St. Paul, New York-JFK
and LaGuardia, Paris-Charles de Gaulle, Salt Lake City, Santiago (Chile), Sao Paulo, Seattle, Seoul-Incheon and Tokyo.
As the leading global airline, Delta's mission to connect the world
creates opportunities, fosters understanding and expands horizons by connecting people and communities to each other and to their own
potential.
Powered by innovative and strategic partnerships with Aeromexico,
Air France-KLM, China Eastern, Korean Air, LATAM, Virgin Atlantic and WestJet, Delta brings more choice and competition to customers worldwide.
Delta’s premium product line is elevated by its unique partnership with Wheels Up Experience.
Delta is America's most-awarded airline thanks to the dedication,
passion and professionalism of its people. It has been recognized by Cirium for operational excellence, as the top U.S. airline by the
Wall Street Journal, among Fast Company's most innovative companies, the World's Most Admired Airline according to Fortune, as one of
Glassdoor's Best Places to Work, and a top employer for diversity, veterans and best workplaces for women by Forbes.
Forward Looking Statements
Statements made in this press release that are not historical facts,
including statements regarding our estimates, expectations, beliefs, intentions, projections, goals, aspirations, commitments or strategies
for the future, should be considered “forward-looking statements” under the Securities Act of 1933, as amended, the Securities
Exchange Act of 1934, as amended, and the Private Securities Litigation Reform Act of 1995. Such statements are not guarantees or promised
outcomes and should not be construed as such. All forward-looking statements involve a number of risks and uncertainties that could cause
actual results to differ materially from the estimates, expectations, beliefs, intentions, projections, goals, aspirations, commitments
and strategies reflected in or suggested by the forward-looking statements. These risks and uncertainties include, but are not limited
to, the impact of incurring significant debt in response to the COVID-19 pandemic; failure to comply with the financial and other covenants
in our financing agreements; the possible effects of accidents involving our aircraft or aircraft of our airline partners; breaches or
lapses in the security of technology systems on which we rely, which could compromise the data stored within them, as well as failure
to comply with ever-evolving global privacy and security regulatory obligations or adequately address increasing customer focus on privacy
issues and data security; disruptions in our information technology infrastructure; our dependence on technology in our operations; our
commercial relationships with airlines in other parts of the world and the investments we have in certain of those airlines; the effects
of a significant disruption in the operations or performance of third parties on which we rely; failure to realize the full value of intangible
or long-lived assets; labor issues; the effects on our business of seasonality and other factors beyond our control, including severe
weather conditions, natural disasters or other environmental events, including from the impact of climate change; changes in the cost
of aircraft fuel; extended disruptions in the supply of aircraft fuel, including from Monroe Energy, LLC (“Monroe”), a wholly-owned
subsidiary of Delta; failure or inability of insurance to cover a significant liability at Monroe’s Trainer refinery; failure to
comply with existing and future environmental regulations to which Monroe’s refinery operations are subject, including costs related
to compliance with renewable fuel standard regulations; significant damage to our reputation and brand, including from exposure to significant
adverse publicity or inability to achieve certain sustainability goals; our ability to retain senior management and other key employees,
and to maintain our company culture; disease outbreaks, such as the COVID-19 pandemic or similar public health threats, and measures implemented
to combat them; the effects of terrorist attacks, geopolitical conflict or security events; competitive conditions in the airline industry;
extended interruptions or disruptions in service at major airports at which we operate or significant problems associated with types of
aircraft or engines we operate; the effects of extensive government regulation we are subject to; the impact of environmental regulation,
including but not limited to increased regulation to reduce emissions and other risks associated with climate change, and the cost of
compliance with more stringent environmental regulations; and unfavorable economic or political conditions in the markets in which we
operate or volatility in currency exchange rates.
Additional information concerning risks and uncertainties that could
cause differences between actual results and forward-looking statements is contained in our Securities and Exchange Commission filings,
including our Annual Report on Form 10-K for the fiscal year ended December 31, 2022. Caution should be taken not to place undue reliance
on our forward-looking statements, which represent our views only as of the date of this press release, and which we undertake no obligation
to update except to the extent required by law.
DELTA AIR LINES, INC.
Consolidated Statements of Operations
(Unaudited)
| | |
Three Months Ended | | |
| | |
| | |
Year Ended | | |
| | |
| |
| | |
December 31, | | |
| | |
| | |
December 31, | | |
| | |
| |
| (in millions, except per share data) | |
2023 | | |
2022 | | |
$ Change | | |
% Change | | |
2023 | | |
2022 | | |
$ Change | | |
% Change | |
| Operating Revenue: | |
| | |
| | |
| | |
| | |
| | |
| | |
| | |
| |
| Passenger | |
$ | 12,174 | | |
$ | 10,889 | | |
$ | 1,285 | | |
| 12 | % | |
$ | 48,909 | | |
$ | 40,218 | | |
$ | 8,691 | | |
| 22 | % |
| Cargo | |
| 188 | | |
| 248 | | |
| (60 | ) | |
| (24 | )% | |
| 723 | | |
| 1,050 | | |
| (327 | ) | |
| (31 | )% |
| Other | |
| 1,861 | | |
| 2,298 | | |
| (437 | ) | |
| (19 | )% | |
| 8,416 | | |
| 9,314 | | |
| (898 | ) | |
| (10 | )% |
| Total operating revenue | |
| 14,223 | | |
| 13,435 | | |
| 788 | | |
| 6 | % | |
| 58,048 | | |
| 50,582 | | |
| 7,466 | | |
| 15 | % |
| | |
| | | |
| | | |
| | | |
| | | |
| | | |
| | | |
| | | |
| | |
| Operating Expense: | |
| | | |
| | | |
| | | |
| | | |
| | | |
| | | |
| | | |
| | |
| Salaries and related costs | |
| 3,769 | | |
| 3,071 | | |
| 698 | | |
| 23 | % | |
| 14,607 | | |
| 11,902 | | |
| 2,705 | | |
| 23 | % |
| Aircraft fuel and related taxes | |
| 2,941 | | |
| 2,849 | | |
| 92 | | |
| 3 | % | |
| 11,069 | | |
| 11,482 | | |
| (413 | ) | |
| (4 | )% |
| Ancillary businesses and refinery | |
| 745 | | |
| 1,308 | | |
| (563 | ) | |
| (43 | )% | |
| 4,172 | | |
| 5,756 | | |
| (1,584 | ) | |
| (28 | )% |
| Contracted services | |
| 1,033 | | |
| 920 | | |
| 113 | | |
| 12 | % | |
| 4,041 | | |
| 3,345 | | |
| 696 | | |
| 21 | % |
| Landing fees and other rents | |
| 683 | | |
| 570 | | |
| 113 | | |
| 20 | % | |
| 2,563 | | |
| 2,181 | | |
| 382 | | |
| 18 | % |
| Aircraft maintenance materials and outside repairs | |
| 572 | | |
| 508 | | |
| 64 | | |
| 13 | % | |
| 2,432 | | |
| 1,982 | | |
| 450 | | |
| 23 | % |
| Depreciation and amortization | |
| 610 | | |
| 554 | | |
| 56 | | |
| 10 | % | |
| 2,341 | | |
| 2,107 | | |
| 234 | | |
| 11 | % |
| Passenger commissions and other selling expenses | |
| 563 | | |
| 507 | | |
| 56 | | |
| 11 | % | |
| 2,334 | | |
| 1,891 | | |
| 443 | | |
| 23 | % |
| Regional carrier expense | |
| 537 | | |
| 504 | | |
| 33 | | |
| 7 | % | |
| 2,200 | | |
| 2,051 | | |
| 149 | | |
| 7 | % |
| Passenger service | |
| 442 | | |
| 403 | | |
| 39 | | |
| 10 | % | |
| 1,750 | | |
| 1,453 | | |
| 297 | | |
| 20 | % |
| Profit sharing | |
| 299 | | |
| 272 | | |
| 27 | | |
| 10 | % | |
| | | |
| 563 | | |
| 820 | | |
| NM | |
| Pilot agreement and related expenses | |
| – | | |
| – | | |
| – | | |
| – | % | |
| 864 | | |
| – | | |
| 864 | | |
| NM | |
| Aircraft rent | |
| 137 | | |
| 128 | | |
| 9 | | |
| 7 | % | |
| 532 | | |
| 508 | | |
| 24 | | |
| 5 | % |
| Other | |
| 569 | | |
| 371 | | |
| 198 | | |
| 53 | % | |
| 2,239 | | |
| 1,700 | | |
| 539 | | |
| 32 | % |
| Total operating expense | |
| 12,900 | | |
| 11,965 | | |
| 935 | | |
| 8 | % | |
| 52,527 | | |
| 46,921 | | |
| 5,606 | | |
| 12 | % |
| | |
| | | |
| | | |
| | | |
| | | |
| | | |
| | | |
| | | |
| | |
| Operating Income | |
| 1,323 | | |
| 1,470 | | |
| (147 | ) | |
| (10 | )% | |
| 5,521 | | |
| 3,661 | | |
| 1,860 | | |
| 51 | % |
| | |
| | | |
| | | |
| | | |
| | | |
| | | |
| | | |
| | | |
| | |
| Non-Operating Income/(Expense): | |
| | | |
| | | |
| | | |
| | | |
| | | |
| | | |
| | | |
| | |
| Interest expense, net | |
| (207 | ) | |
| (238 | ) | |
| 31 | | |
| (13 | )% | |
| (834 | ) | |
| (1,029 | ) | |
| 195 | | |
| (19 | )% |
| Gain/(loss) on investments, net | |
| 1,218 | | |
| (170 | ) | |
| 1,388 | | |
| NM | | |
| 1,263 | | |
| (783 | ) | |
| 2,046 | | |
| NM | |
| Loss on extinguishment of debt | |
| – | | |
| – | | |
| – | | |
| – | % | |
| (63 | ) | |
| (100 | ) | |
| 37 | | |
| (37 | )% |
| Pension and related (expense)/benefit | |
| (61 | ) | |
| 74 | | |
| (135 | ) | |
| NM | | |
| (244 | ) | |
| 292 | | |
| (536 | ) | |
| NM | |
| Miscellaneous, net | |
| 2 | | |
| (16 | ) | |
| 18 | | |
| NM | | |
| (35 | ) | |
| (127 | ) | |
| 92 | | |
| (72 | )% |
| Total non-operating income/(expense), net | |
| 952 | | |
| (350 | ) | |
| 1,302 | | |
| NM | | |
| 87 | | |
| (1,747 | ) | |
| 1,834 | | |
| NM | |
| | |
| | | |
| | | |
| | | |
| | | |
| | | |
| | | |
| | | |
| | |
| Income Before Income Taxes | |
| 2,275 | | |
| 1,120 | | |
| 1,155 | | |
| NM | | |
| 5,608 | | |
| 1,914 | | |
| 3,694 | | |
| NM | |
| | |
| | | |
| | | |
| | | |
| | | |
| | | |
| | | |
| | | |
| | |
| Income Tax Provision | |
| (238 | ) | |
| (292 | ) | |
| 54 | | |
| (18 | )% | |
| (999 | ) | |
| (596 | ) | |
| (403 | ) | |
| 68 | % |
| | |
| | | |
| | | |
| | | |
| | | |
| | | |
| | | |
| | | |
| | |
| Net Income | |
$ | 2,037 | | |
$ | 828 | | |
$ | 1,209 | | |
| NM | | |
$ | 4,609 | | |
$ | 1,318 | | |
$ | 3,291 | | |
| NM | |
| | |
| | | |
| | | |
| | | |
| | | |
| | | |
| | | |
| | | |
| | |
| Basic Earnings Per Share | |
$ | 3.19 | | |
$ | 1.30 | | |
| | | |
| | | |
$ | 7.21 | | |
$ | 2.07 | | |
| | | |
| | |
| Diluted Earnings Per Share | |
$ | 3.16 | | |
$ | 1.29 | | |
| | | |
| | | |
$ | 7.17 | | |
$ | 2.06 | | |
| | | |
| | |
| | |
| | | |
| | | |
| | | |
| | | |
| | | |
| | | |
| | | |
| | |
| Basic Weighted Average Shares Outstanding | |
| 639 | | |
| 638 | | |
| | | |
| | | |
| 639 | | |
| 638 | | |
| | | |
| | |
| Diluted Weighted Average Shares Outstanding | |
| 644 | | |
| 641 | | |
| | | |
| | | |
| 643 | | |
| 641 | | |
| | | |
| | |
DELTA AIR LINES, INC.
Passenger Revenue
(Unaudited)
| | |
Three Months Ended | | |
| | |
Year Ended | | |
| | |
| |
| | |
December 31, | | |
| | |
December 31, | | |
| | |
| |
| (in millions) | |
2023 | | |
2022 | | |
$ Change | | |
% Change | | |
2023 | | |
2022 | | |
$ Change | | |
% Change | |
| Ticket - Main cabin | |
$ | 5,939 | | |
$ | 5,398 | | |
$ | 541 | | |
| 10 | % | |
$ | 24,477 | | |
$ | 20,396 | | |
$ | 4,081 | | |
| 20 | % |
| Ticket - Premium products | |
| 4,856 | | |
| 4,223 | | |
| 633 | | |
| 15 | % | |
| 19,119 | | |
| 15,230 | | |
| 3,889 | | |
| 26 | % |
| Loyalty travel awards | |
| 915 | | |
| 825 | | |
| 90 | | |
| 11 | % | |
| 3,462 | | |
| 2,898 | | |
| 564 | | |
| 19 | % |
| Travel-related services | |
| 464 | | |
| 443 | | |
| 21 | | |
| 5 | % | |
| 1,851 | | |
| 1,694 | | |
| 157 | | |
| 9 | % |
| Passenger revenue | |
$ | 12,174 | | |
$ | 10,889 | | |
$ | 1,285 | | |
| 12 | % | |
$ | 48,909 | | |
$ | 40,218 | | |
$ | 8,691 | | |
| 22 | % |
DELTA AIR LINES, INC.
Other Revenue
(Unaudited)
| | |
Three Months Ended | | |
| | |
| | |
Year Ended | | |
| | |
| |
| | |
December 31, | | |
| | |
| | |
December 31, | | |
| | |
| |
| (in millions) | |
2023 | | |
2022 | | |
$ Change | | |
% Change | | |
2023 | | |
2022 | | |
$ Change | | |
% Change | |
| Refinery | |
$ | 563 | | |
$ | 1,142 | | |
$ | (579 | ) | |
| (51 | )% | |
$ | 3,379 | | |
$ | 4,977 | | |
$ | (1,598 | ) | |
| (32 | )% |
| Loyalty program | |
| 802 | | |
| 720 | | |
| 82 | | |
| 11 | % | |
| 3,093 | | |
| 2,597 | | |
| 496 | | |
| 19 | % |
| Ancillary businesses | |
| 183 | | |
| 182 | | |
| 1 | | |
| 1 | % | |
| 840 | | |
| 846 | | |
| (6 | ) | |
| (1 | )% |
| Miscellaneous | |
| 313 | | |
| 254 | | |
| 59 | | |
| 23 | % | |
| 1,104 | | |
| 894 | | |
| 210 | | |
| 23 | % |
| Other revenue | |
$ | 1,861 | | |
$ | 2,298 | | |
$ | (437 | ) | |
| (19 | )% | |
$ | 8,416 | | |
$ | 9,314 | | |
$ | (898 | ) | |
| (10 | )% |
DELTA AIR LINES, INC.
Total Revenue
(Unaudited)
| | |
| | |
Increase (Decrease) |
| | |
| | |
4Q23 vs 4Q22 |
| Revenue | |
4Q23($M) | | |
Change | |
Unit Revenue | |
Yield | |
Capacity |
| Domestic | |
$ | 8,769 | | |
7% | |
(4)% | |
(2)% | |
12% |
| Atlantic | |
| 1,900 | | |
23% | |
9% | |
6% | |
13% |
| Latin America | |
| 952 | | |
18% | |
(7)% | |
(7)% | |
28% |
| Pacific | |
| 553 | | |
45% | |
1% | |
1% | |
44% |
| Passenger Revenue | |
$ | 12,174 | | |
12% | |
(3)% | |
(2)% | |
15% |
| Cargo Revenue | |
| 188 | | |
(24)% | |
| |
| |
|
| Other Revenue | |
| 1,861 | | |
(19)% | |
| |
| |
|
| Total Revenue | |
$ | 14,223 | | |
6% | |
(8)% | |
| |
|
| Third Party Refinery Sales | |
| (563 | ) | |
| |
| |
| |
|
| Total Revenue, adjusted | |
$ | 13,661 | | |
11% | |
(3)% | |
| |
|
DELTA AIR LINES, INC.
Statistical Summary
(Unaudited)
| | |
Three Months Ended | | |
| | |
Year Ended | | |
| |
| | |
December 31, | | |
| | |
December 31, | | |
| |
| | |
2023 | | |
2022 | | |
Change | | |
2023 | | |
2022 | | |
Change | |
| Revenue passenger miles (millions) | |
| 57,655 | | |
| 50,476 | | |
| 14 | % | |
| 232,241 | | |
| 195,480 | | |
| 19 | % |
| Available seat miles (millions) | |
| 68,462 | | |
| 59,506 | | |
| 15 | % | |
| 272,033 | | |
| 233,226 | | |
| 17 | % |
| Passenger mile yield (cents) | |
| 21.12 | | |
| 21.57 | | |
| (2 | )% | |
| 21.06 | | |
| 20.57 | | |
| 2 | % |
| Passenger revenue per available seat mile (cents) | |
| 17.78 | | |
| 18.30 | | |
| (3 | )% | |
| 17.98 | | |
| 17.24 | | |
| 4 | % |
| Total revenue per available seat mile (cents) | |
| 20.78 | | |
| 22.58 | | |
| (8 | )% | |
| 21.34 | | |
| 21.69 | | |
| (2 | )% |
| TRASM, adjusted - see Note A (cents) | |
| 19.95 | | |
| 20.66 | | |
| (3 | )% | |
| 20.10 | | |
| 19.55 | | |
| 3 | % |
| Cost per available seat mile (cents) | |
| 18.84 | | |
| 20.11 | | |
| (6 | )% | |
| 19.31 | | |
| 20.12 | | |
| (4 | )% |
| CASM-Ex - see Note A (cents) | |
| 13.29 | | |
| 13.14 | | |
| 1.1 | % | |
| 13.17 | | |
| 12.87 | | |
| 2.3 | % |
| Passenger load factor | |
| 84 | % | |
| 85 | % | |
| (1 | )pt | |
| 85 | % | |
| 84 | % | |
| 1 | pt |
| Fuel gallons consumed (millions) | |
| 978 | | |
| 869 | | |
| 13 | % | |
| 3,926 | | |
| 3,412 | | |
| 15 | % |
| Average price per fuel gallon | |
$ | 3.01 | | |
$ | 3.28 | | |
| (8 | )% | |
$ | 2.82 | | |
$ | 3.36 | | |
| (16 | )% |
| Average price per fuel gallon, adjusted - see Note A | |
$ | 3.00 | | |
$ | 3.20 | | |
| (6 | )% | |
$ | 2.83 | | |
$ | 3.36 | | |
| (16 | )% |
DELTA AIR LINES, INC.
Consolidated Statements of Cash Flows
(Unaudited)
| | |
Three Months Ended | |
| | |
December 31, | |
| (in millions) | |
2023 | | |
2022 | |
| Cash Flows From Operating Activities: | |
| | | |
| | |
| Net Income | |
$ | 2,037 | | |
$ | 828 | |
| Depreciation and amortization | |
| 610 | | |
| 554 | |
| (Gain) loss on fair value investments | |
| (1,220 | ) | |
| 165 | |
| Changes in air traffic liability | |
| (1,694 | ) | |
| (837 | ) |
| Changes in profit sharing | |
| 299 | | |
| 272 | |
| Changes in balance sheet and other, net | |
| 513 | | |
| 207 | |
| Net cash provided by operating activities | |
| 545 | | |
| 1,189 | |
| | |
| | | |
| | |
| Cash Flows From Investing Activities: | |
| | | |
| | |
| Property and equipment additions: | |
| | | |
| | |
| Flight equipment, including advance payments | |
| (1,085 | ) | |
| (1,643 | ) |
| Ground property and equipment, including technology | |
| (517 | ) | |
| (557 | ) |
| Purchase of short-term investments | |
| – | | |
| (2,129 | ) |
| Redemption of short-term investments | |
| 1,060 | | |
| 221 | |
| Acquisition of strategic investments | |
| – | | |
| (717 | ) |
| Other, net | |
| 7 | | |
| 89 | |
| Net cash used in investing activities | |
| (535 | ) | |
| (4,736 | ) |
| | |
| | | |
| | |
| Cash Flows From Financing Activities: | |
| | | |
| | |
| Proceeds from long-term obligations | |
| 878 | | |
| – | |
| Payments on debt and finance lease obligations | |
| (361 | ) | |
| (285 | ) |
| Cash dividends | |
| (64 | ) | |
| – | |
| Other, net | |
| (37 | ) | |
| (20 | ) |
| Net cash provided by/(used in) financing activities | |
| 416 | | |
| (305 | ) |
| | |
| | | |
| | |
| Net Increase/(Decrease) in Cash, Cash Equivalents and Restricted Cash Equivalents | |
| 426 | | |
| (3,852 | ) |
| Cash, cash equivalents and restricted cash equivalents at beginning of period | |
| 2,969 | | |
| 7,325 | |
| Cash, cash equivalents and restricted cash equivalents at end of period | |
$ | 3,395 | | |
$ | 3,473 | |
| | |
| | | |
| | |
| The following table provides a reconciliation of cash, cash equivalents and restricted cash reported within the Consolidated Balance Sheets to the total of the same such amounts shown above: | |
| | |
| | |
| |
| Current assets: | |
| | |
| |
| Cash and cash equivalents | |
$ | 2,741 | | |
$ | 3,266 | |
| Restricted cash included in prepaid expenses and other | |
| 199 | | |
| 138 | |
| Other assets: | |
| | | |
| | |
| Restricted cash included in other noncurrent assets | |
| 455 | | |
| 69 | |
| Total cash, cash equivalents and restricted cash equivalents | |
$ | 3,395 | | |
$ | 3,473 | |
DELTA AIR LINES, INC.
Consolidated Balance Sheets
(Unaudited)
| | |
December 31, | | |
December 31, | |
| (in millions) | |
2023 | | |
2022 | |
| ASSETS |
| Current Assets: | |
| | | |
| | |
| Cash and cash equivalents | |
$ | 2,741 | | |
$ | 3,266 | |
| Short-term investments | |
| 1,127 | | |
| 3,268 | |
| Accounts receivable, net | |
| 3,130 | | |
| 3,176 | |
| Fuel inventory, expendable parts and supplies inventories, net | |
| 1,314 | | |
| 1,424 | |
| Prepaid expenses and other | |
| 1,847 | | |
| 1,877 | |
| Total current assets | |
| 10,159 | | |
| 13,011 | |
| | |
| | | |
| | |
| Property and Equipment, Net: | |
| | | |
| | |
| Property and equipment, net | |
| 35,486 | | |
| 33,109 | |
| | |
| | | |
| | |
| Other Assets: | |
| | | |
| | |
| Operating lease right-of-use assets | |
| 6,926 | | |
| 7,036 | |
| Goodwill | |
| 9,753 | | |
| 9,753 | |
| Identifiable intangibles, net | |
| 5,983 | | |
| 5,992 | |
| Equity investments | |
| 3,457 | | |
| 2,128 | |
| Other noncurrent assets | |
| 1,734 | | |
| 1,259 | |
| Total other assets | |
| 27,853 | | |
| 26,168 | |
| Total assets | |
$ | 73,498 | | |
$ | 72,288 | |
| | |
| | | |
| | |
| LIABILITIES AND STOCKHOLDERS' EQUITY |
| Current Liabilities: | |
| | | |
| | |
| Current maturities of debt and finance leases | |
$ | 2,983 | | |
$ | 2,359 | |
| Current maturities of operating leases | |
| 746 | | |
| 714 | |
| Air traffic liability | |
| 7,044 | | |
| 8,160 | |
| Accounts payable | |
| 4,516 | | |
| 5,106 | |
| Accrued salaries and related benefits | |
| 4,564 | | |
| 3,288 | |
| Loyalty program deferred revenue | |
| 3,908 | | |
| 3,434 | |
| Fuel card obligation | |
| 1,100 | | |
| 1,100 | |
| Other accrued liabilities | |
| 1,616 | | |
| 1,779 | |
| Total current liabilities | |
| 26,477 | | |
| 25,940 | |
| | |
| | | |
| | |
| Noncurrent Liabilities: | |
| | | |
| | |
| Debt and finance leases | |
| 17,071 | | |
| 20,671 | |
| Pension, postretirement and related benefits | |
| 3,744 | | |
| 3,707 | |
| Loyalty program deferred revenue | |
| 4,512 | | |
| 4,448 | |
| Noncurrent operating leases | |
| 6,404 | | |
| 6,866 | |
| Deferred income taxes, net | |
| 874 | | |
| 24 | |
| Other noncurrent liabilities | |
| 3,440 | | |
| 4,050 | |
| Total noncurrent liabilities | |
| 36,045 | | |
| 39,766 | |
| | |
| | | |
| | |
| Commitments and Contingencies | |
| | | |
| | |
| | |
| | | |
| | |
| Stockholders' Equity: | |
| 10,976 | | |
| 6,582 | |
| Total liabilities and stockholders' equity | |
$ | 73,498 | | |
$ | 72,288 | |
Note A: The following tables show
reconciliations of non-GAAP financial measures. The reasons Delta uses these measures are described below. Reconciliations may not calculate
due to rounding.
Delta sometimes uses information ("non-GAAP
financial measures") that is derived from the Consolidated Financial Statements, but that is not presented in accordance with accounting
principles generally accepted in the U.S. (“GAAP”). Under the Securities and Exchange Commission rules, non-GAAP financial
measures may be considered in addition to results prepared in accordance with GAAP, but should not be considered a substitute for or
superior to GAAP results. The tables below show reconciliations of non-GAAP financial measures used in this release to the most directly
comparable GAAP financial measures.
Forward Looking Projections. Delta
is not able to reconcile forward looking non-GAAP financial measures without unreasonable effort because the adjusting items such as
those used in the reconciliations below will not be known until the end of the period and could be significant.
Adjustments. These reconciliations
include certain adjustments to GAAP measures that are made to provide comparability between the reported periods, if applicable, and
for the reasons indicated below:
Third-party refinery sales.
Refinery sales to third parties, and related expenses, are not related to our airline segment. Excluding these sales therefore provides
a more meaningful comparison of our airline operations to the rest of the airline industry.
MTM adjustments and settlements
on hedges. Mark-to-market ("MTM") adjustments are defined as fair value changes recorded in periods other than the
settlement period. Such fair value changes are not necessarily indicative of the actual settlement value of the underlying hedge in the
contract settlement period, and therefore we remove this impact to allow investors to better understand and analyze our core performance.
Settlements represent cash received or paid on hedge contracts settled during the applicable period.
Restructuring charges.
During 2020, we recorded restructuring charges for items such as fleet impairments and voluntary early retirement and separation
programs following strategic business decisions in response to the COVID-19 pandemic. During 2022, we recognized adjustments to certain
of those restructuring charges, representing changes in our estimates.
One-time pilot agreement
expenses. In the March 2023 quarter, Delta pilots ratified a new four-year Pilot Working Agreement effective January 1, 2023. The
agreement included a provision for a one-time payment made upon ratification in the March 2023 quarter of $735 million. Additionally,
we recorded adjustments to other benefit-related items of approximately $130 million. Adjusting for these expenses allows investors
to better understand and analyze our core cost performance.
MTM adjustments on investments.
Unrealized gains/losses result from our equity investments that are accounted for at fair value in non-operating expense. The gains/losses
are driven by changes in stock prices, foreign currency fluctuations and other valuation techniques for investments in certain companies,
particularly those without publicly-traded shares. During the December 2023 quarter, Delta recorded an $848 million MTM gain from our
investment in Wheels Up based on the closing price of its shares at the end of the quarter as traded on the New York Stock Exchange.
Adjusting for these gains/losses allows investors to better understand and analyze our core operational performance in the periods shown.
Loss on extinguishment
of debt. This adjustment relates to early termination of a portion of our debt. Adjusting for these losses allows investors to better
understand and analyze our core operational performance in the periods shown.
Operating Revenue, adjusted and Revenue
Per Available Seat Mile ("TRASM"), adjusted
| | |
Three
Months Ended | | |
4Q23 vs 4Q22 | |
| (in millions) | |
December
31, 2023 | | |
March
31, 2023 | | |
December
31, 2022 | | |
% Change | |
| Operating revenue | |
$ | 14,223 | | |
$ | 12,759 | | |
$ | 13,435 | | |
| | |
| Adjusted for: | |
| | | |
| | | |
| | | |
| | |
| Third-party refinery
sales | |
| (563 | ) | |
| (916 | ) | |
| (1,142 | ) | |
| | |
| Operating revenue, adjusted | |
$ | 13,661 | | |
$ | 11,842 | | |
$ | 12,292 | | |
| 11% | |
| | |
Year Ended | | |
| |
| (in millions) | |
December
31, 2023 | | |
December
31, 2022 | | |
% Change | |
| Operating revenue | |
$ | 58,048 | | |
$ | 50,582 | | |
| | |
| Adjusted for: | |
| | | |
| | | |
| | |
| Third-party refinery
sales | |
| (3,379 | ) | |
| (4,977 | ) | |
| | |
| Operating revenue, adjusted | |
$ | 54,669 | | |
$ | 45,605 | | |
| 20% | |
| | |
Three
Months Ended | | |
4Q23 vs 4Q22 | |
| | |
December
31, 2023 | | |
March
31, 2023 | | |
December
31, 2022 | | |
% Change | |
| TRASM (cents) | |
| 20.78 | | |
| 20.80 | | |
| 22.58 | | |
| | |
| Adjusted for: | |
| | | |
| | | |
| | | |
| | |
| Third-party refinery
sales | |
| (0.82 | ) | |
| (1.49 | ) | |
| (1.92 | ) | |
| | |
| TRASM, adjusted | |
| 19.95 | | |
| 19.30 | | |
| 20.66 | | |
| (3 | )% |
| | |
Year Ended | |
| | |
December
31, 2023 | | |
December
31, 2022 | |
| TRASM (cents) | |
| 21.34 | | |
| 21.69 | |
| Adjusted for: | |
| | | |
| | |
| Third-party refinery
sales | |
| (1.24 | ) | |
| (2.13 | ) |
| TRASM, adjusted | |
| 20.10 | | |
| 19.55 | |
Pre-Tax Income, Net Income, and Diluted
Earnings per Share, adjusted
| | |
Three Months Ended | | |
Three Months Ended | |
| | |
December
31, 2023 | | |
December
31, 2023 | |
| | |
Pre-Tax | | |
Income | | |
Net | | |
Earnings | |
| (in millions, except per share data) | |
Income | | |
Tax | | |
Income | | |
Per Diluted
Share | |
| GAAP | |
$ | 2,275 | | |
$ | (238 | ) | |
$ | 2,037 | | |
$ | 3.16 | |
| Adjusted for: | |
| | | |
| | | |
| | | |
| | |
| MTM adjustments and settlements on hedges | |
| 7 | | |
| | | |
| | | |
| | |
| MTM adjustments on
investments | |
| (1,218 | ) | |
| | | |
| | | |
| | |
| Non-GAAP | |
$ | 1,064 | | |
$ | (238 | ) | |
$ | 826 | | |
$ | 1.28 | |
| | |
Three Months Ended | | |
Three Months Ended | |
| | |
December
31, 2022 | | |
December
31, 2022 | |
| | |
Pre-Tax | | |
Income | | |
Net | | |
Earnings | |
| (in millions, except per share data) | |
Income | | |
Tax | | |
Income | | |
Per Diluted
Share | |
| GAAP | |
$ | 1,120 | | |
$ | (292 | ) | |
$ | 828 | | |
$ | 1.29 | |
| Adjusted for: | |
| | | |
| | | |
| | | |
| | |
| MTM adjustments and settlements on hedges | |
| 70 | | |
| | | |
| | | |
| | |
| MTM adjustments on investments | |
| 170 | | |
| | | |
| | | |
| | |
| Restructuring charges | |
| (118 | ) | |
| | | |
| | | |
| | |
| Non-GAAP | |
$ | 1,242 | | |
$ | (292 | ) | |
$ | 950 | | |
$ | 1.48 | |
| | |
Year Ended | | |
Year Ended | |
| | |
December
31, 2023 | | |
December
31, 2023 | |
| | |
Pre-Tax | | |
Income | | |
Net | | |
Earnings | |
| (in millions, except per share data) | |
Income | | |
Tax | | |
Income | | |
Per Diluted
Share | |
| GAAP | |
$ | 5,608 | | |
$ | (999 | ) | |
$ | 4,609 | | |
$ | 7.17 | |
| Adjusted for: | |
| | | |
| | | |
| | | |
| | |
| MTM adjustments and settlements on hedges | |
| (52 | ) | |
| | | |
| | | |
| | |
| MTM adjustments on investments | |
| (1,263 | ) | |
| | | |
| | | |
| | |
| Loss on extinguishment of debt | |
| 63 | | |
| | | |
| | | |
| | |
| One-time pilot agreement
expenses | |
| 864 | | |
| | | |
| | | |
| | |
| Non-GAAP | |
$ | 5,220 | | |
$ | (1,200 | ) | |
$ | 4,020 | | |
$ | 6.25 | |
| | |
Year Ended | | |
Year Ended | |
| | |
December
31, 2022 | | |
December
31, 2022 | |
| | |
Pre-Tax | | |
Income | | |
Net | | |
Earnings | |
| (in millions, except per share data) | |
Income | | |
Tax | | |
Income | | |
Per Diluted
Share | |
| GAAP | |
$ | 1,914 | | |
$ | (596 | ) | |
$ | 1,318 | | |
$ | 2.06 | |
| Adjusted for: | |
| | | |
| | | |
| | | |
| | |
| MTM adjustments and settlements on hedges | |
| 29 | | |
| | | |
| | | |
| | |
| MTM adjustments on investments | |
| 784 | | |
| | | |
| | | |
| | |
| Loss on extinguishment of debt | |
| 100 | | |
| | | |
| | | |
| | |
| Restructuring charges | |
| (124 | ) | |
| | | |
| | | |
| | |
| Non-GAAP | |
$ | 2,703 | | |
$ | (650 | ) | |
$ | 2,053 | | |
$ | 3.20 | |
Free Cash Flow. We present free
cash flow because management believes this metric is helpful to investors to evaluate the company's ability to generate cash that is
available for use for debt service or general corporate initiatives. Free cash flow is also used internally as a component of our 2023
incentive compensation program. Free cash flow is defined as net cash from operating activities and net cash from investing activities,
adjusted for (i) net redemptions of short-term investments, (ii) strategic investments and related, (iii) net cash flows related to certain
airport construction projects and other, (iv) financed aircraft acquisitions and (v) pilot agreement payment. These adjustments are made
for the following reasons:
Net redemptions of short-term
investments. Net redemptions of short-term investments represent the net purchase and sale activity of investments and marketable
securities in the period, including gains and losses. We adjust for this activity to provide investors a better understanding of the
company's free cash flow generated by our operations.
Strategic investments and
related. Certain cash flows related to our investments in and related transactions with other airlines and associated companies are
included in our GAAP investing activities. We adjust for this activity because it provides a more meaningful comparison to our airline
industry peers.
Net cash flows related
to certain airport construction projects and other. Cash flows related to certain airport construction projects are included in our
GAAP operating activities and capital expenditures. We have adjusted for these items, which were primarily funded by cash restricted
for airport construction, to provide investors a better understanding of the company's free cash flow and capital expenditures that are
core to our operations in the periods shown.
Financed aircraft acquisitions.
This adjustment reflects aircraft deliveries that are leased as capital expenditures. The adjustment is based on their original contractual
purchase price or an estimate of the aircraft's fair value and provides a more meaningful view of our investing activities.
Pilot agreement payment.
In March 2023, Delta pilots ratified a new four-year Pilot Working Agreement effective January 1, 2023. The agreement includes a
provision for a one-time payment upon ratification in the March 2023 quarter of $735 million. We adjust for this item to provide investors
a better understanding of our recurring free cash flow generated by our operations.
| | |
Year Ended | |
| (in millions) | |
December
31, 2023 | |
| Net cash provided by operating activities | |
$ | 6,464 | |
| Net cash used in investing activities | |
| (3,148 | ) |
| Adjusted for: | |
| | |
| Net redemptions of short-term investments | |
| (2,235 | ) |
| Strategic investments and related | |
| 152 | |
| Net cash flows related to certain airport construction
projects and other | |
| 496 | |
| Financed aircraft acquisitions | |
| (461 | ) |
| Pilot agreement payment | |
| 735 | |
| Free cash flow | |
$ | 2,003 | |
Operating Income, adjusted
| | |
Three
Months Ended | |
| (in millions) | |
December
31, 2023 | | |
December
31, 2022 | |
| Operating income | |
$ | 1,323 | | |
$ | 1,470 | |
| Adjusted for: | |
| | | |
| | |
| MTM adjustments and settlements on hedges | |
| 7 | | |
| 70 | |
| Restructuring charges | |
| – | | |
| (118 | ) |
| Operating income, adjusted | |
$ | 1,330 | | |
$ | 1,422 | |
| | |
Year Ended | |
| (in millions) | |
December
31, 2023 | | |
December
31, 2022 | |
| Operating Income | |
$ | 5,521 | | |
$ | 3,661 | |
| Adjusted for: | |
| | | |
| | |
| MTM adjustments and settlements on hedges | |
| (52 | ) | |
| 29 | |
| One-time pilot agreement expenses | |
| 864 | | |
| – | |
| Restructuring charges | |
| – | | |
| (124 | ) |
| Operating income, adjusted | |
$ | 6,334 | | |
$ | 3,566 | |
Operating Margin, adjusted
| | |
Three
Months Ended | |
| | |
December
31, 2023 | | |
December
31, 2022 | |
| Operating margin | |
| 9.3% | | |
| 10.9% | |
| Adjusted for: | |
| | | |
| | |
| Third-party refinery sales | |
| 0.4 | | |
| 1.0 | |
| MTM adjustments and settlements on hedges | |
| 0.1 | | |
| 0.5 | |
| Restructuring charges | |
| – | | |
| (0.9 | ) |
| Operating margin, adjusted | |
| 9.7% | | |
| 11.6% | |
| | |
Year Ended | |
| | |
December
31, 2023 | | |
December
31, 2022 | |
| Operating margin | |
| 9.5% | | |
| 7.2% | |
| Adjusted for: | |
| | | |
| | |
| Third-party refinery sales | |
| 0.7 | | |
| 0.8 | |
| MTM adjustments and settlements on hedges | |
| (0.1 | ) | |
| 0.1 | |
| One-time pilot agreement expenses | |
| 1.5 | | |
| – | |
| Restructuring charges | |
| – | | |
| (0.2 | ) |
| Operating margin, adjusted | |
| 11.6% | | |
| 7.8% | |
Pre-Tax Margin, adjusted
| | |
Three
Months Ended | |
| | |
December
31, 2023 | | |
December
31, 2022 | |
| Pre-tax margin | |
| 16.0% | | |
| 8.3% | |
| Adjusted for: | |
| | | |
| | |
| Third-party refinery sales | |
| 0.3 | | |
| 0.9 | |
| MTM adjustments and settlements on hedges | |
| 0.1 | | |
| 0.5 | |
| MTM adjustments on investments | |
| (8.6 | ) | |
| 1.3 | |
| Restructuring charges | |
| – | | |
| (0.9 | ) |
| Pre-tax margin, adjusted | |
| 7.8% | | |
| 10.1% | |
| | |
Year Ended | |
| | |
December
31, 2023 | | |
December
31, 2022 | |
| Pre-tax margin | |
| 9.7% | | |
| 3.8% | |
| Adjusted for: | |
| | | |
| | |
| Third-party refinery sales | |
| 0.6 | | |
| 0.6 | |
| MTM adjustments and settlements on hedges | |
| (0.1 | ) | |
| 0.1 | |
| MTM adjustments on investments | |
| (2.2 | ) | |
| 1.5 | |
| Loss on extinguishment of debt | |
| 0.1 | | |
| 0.2 | |
| One-time pilot agreement expenses | |
| 1.5 | | |
| – | |
| Restructuring charges | |
| – | | |
| (0.2 | ) |
| Pre-tax margin, adjusted | |
| 9.5% | | |
| 5.9% | |
Operating Cash Flow, adjusted.
We present operating cash flow, adjusted because management believes adjusting for the following items provides a more meaningful measure
for investors:
Net cash flows related
to certain airport construction projects and other. Cash flows related to certain airport construction projects are included in our
GAAP operating activities. We have adjusted for these items, which were primarily funded by cash restricted for airport construction,
to provide investors a better understanding of the company's operating cash flow that is core to our operations in the periods shown.
Pilot agreement payment.
In March 2023, Delta pilots ratified a new four-year Pilot Working Agreement effective January 1, 2023. The agreement includes a
provision for a one-time payment upon ratification in the March 2023 quarter of $735 million. We adjust for this item to provide investors
a better understanding of our recurring free cash flow generated by our operations.
| | |
Three
Months Ended | |
| (in millions) | |
December
31, 2023 | | |
December
31, 2022 | |
| Net cash provided by operating activities | |
$ | 545 | | |
$ | 1,189 | |
| Adjusted for: | |
| | | |
| | |
| Net cash flows related
to certain airport construction projects and other | |
| (45 | ) | |
| 22 | |
| Net cash provided by operating activities,
adjusted | |
$ | 499 | | |
$ | 1,211 | |
| | |
Year Ended | |
| (in millions) | |
December
31, 2023 | | |
December
31, 2022 | |
| Net cash provided by operating activities | |
$ | 6,464 | | |
$ | 6,363 | |
| Adjusted for: | |
| | | |
| | |
| Net cash flows related to certain airport construction
projects and other | |
| 17 | | |
| (154 | ) |
| Pilot agreement payment | |
| 735 | | |
| – | |
| Net cash provided by operating activities,
adjusted | |
$ | 7,216 | | |
$ | 6,210 | |
Adjusted Debt to Earnings Before Interest,
Taxes, Depreciation, Amortization and Rent ("EBITDAR"). We present adjusted debt to EBITDAR because management believes
this metric is helpful to investors in assessing the company's overall debt profile. Adjusted debt includes LGA bonds and operating lease
liabilities. We calculate EBITDAR by adding depreciation and amortization to GAAP operating income and adjusting for the fixed portion
of operating lease expense.
| (in billions) | |
December
31, 2023 | | |
December
31, 2022 | |
| Debt and finance lease obligations | |
$ | 20 | | |
$ | 23 | |
| Plus: Operating lease liability | |
| 7 | | |
| 8 | |
| Plus: Sale leaseback liability | |
| 2 | | |
| 2 | |
| Adjusted Debt | |
$ | 29 | | |
$ | 33 | |
| | |
Year Ended | |
| (in billions) | |
December
31, 2023 | | |
December
31, 2022 | |
| GAAP operating income | |
$ | 6 | | |
$ | 4 | |
| Adjusted for: | |
| | | |
| | |
| One-time pilot agreement
expenses | |
| 1 | | |
| – | |
| Operating income, adjusted | |
| 6 | | |
| 4 | |
| Adjusted for: | |
| | | |
| | |
| Depreciation and amortization | |
| 2 | | |
| 2 | |
| Fixed portion of operating
lease expense | |
| 1 | | |
| 1 | |
| EBITDAR | |
$ | 10 | | |
$ | 7 | |
| | |
| | | |
| | |
| Adjusted Debt to EBITDAR | |
| 3.0 | x | |
| 5.0 | x |
After-tax Return on Invested Capital
("ROIC"). We present after-tax return on invested capital as management believes this metric is helpful to investors in
assessing the company's ability to generate returns using its invested capital as a measure against the industry. Return on invested
capital is tax-effected adjusted total pre-tax income divided by average adjusted invested capital. Average adjusted invested capital
represents the sum of the adjusted book value of equity at the end of the last five quarters, adjusted for pension impacts within other
comprehensive income. Average adjusted gross debt is calculated using amounts as of the end of the last five quarters. All adjustments
to calculate ROIC are intended to provide a more meaningful comparison of our results to the airline industry.
| | |
Year Ended | |
| (in millions) | |
December
31, 2023 | | |
December
31, 2022 | |
| Pre-tax income | |
$ | 5,608 | | |
$ | 1,914 | |
| Adjusted for: | |
| | | |
| | |
| MTM adjustments and settlements on hedges | |
| (52 | ) | |
| 29 | |
| MTM adjustments on investments | |
| (1,263 | ) | |
| 784 | |
| Loss on extinguishment of debt | |
| 63 | | |
| 100 | |
| One-time pilot agreement expenses | |
| 864 | | |
| – | |
| Restructuring charges | |
| – | | |
| (124 | ) |
| Amortization of retirement actuarial loss | |
| 246 | | |
| 305 | |
| Interest expense, net
and interest expense included in aircraft rent | |
| 1,176 | | |
| 1,366 | |
| Pre-tax adjusted income | |
$ | 6,642 | | |
$ | 4,374 | |
| Tax effect | |
| (1,507 | ) | |
| (1,052 | ) |
| Tax-effected adjusted total pre-tax
income | |
$ | 5,135 | | |
$ | 3,322 | |
| | |
| | | |
| | |
| Adjusted book value of equity | |
$ | 14,606 | | |
$ | 12,140 | |
| Average adjusted gross debt | |
| 23,636 | | |
| 27,493 | |
| Averaged adjusted invested capital | |
$ | 38,242 | | |
$ | 39,633 | |
| | |
| | | |
| | |
| After-tax Return on Invested Capital | |
| 13.4% | | |
| 8.4% | |
Operating revenue, adjusted related
to premium products and diverse revenue streams
| | |
Year Ended | |
| (in millions) | |
December
31, 2023 | |
| Operating revenue | |
$ | 58,048 | |
| Adjusted for: | |
| | |
| Third-party refinery
sales | |
| (3,379 | ) |
| Operating revenue, adjusted | |
$ | 54,669 | |
| Less: main cabin revenue | |
| (24,477 | ) |
| Operating
revenue, adjusted related to premium products and diverse revenue streams | |
$ | 30,192 | |
| Percent of operating revenue, adjusted
related to premium products and diverse revenue streams | |
| 55% | |
Adjusted Non-Fuel Cost and Non-Fuel
Unit Cost or Cost per Available Seat Mile, ("CASM-Ex")
We adjust operating expense and CASM
for certain items described above, as well as the following items and reasons described below:
Aircraft fuel and related
taxes. The volatility in fuel prices impacts the comparability of year-over-year financial performance. The adjustment for aircraft
fuel and related taxes allows investors to better understand and analyze our non-fuel costs and year-over-year financial performance.
Profit sharing. We
adjust for profit sharing because this adjustment allows investors to better understand and analyze our recurring cost performance and
provides a more meaningful comparison of our core operating costs to the airline industry.
| | |
Three
Months Ended | |
| (in millions) | |
December
31, 2023 | | |
December
31, 2022 | |
| Operating Expense | |
$ | 12,900 | | |
$ | 11,965 | |
| Adjusted for: | |
| | | |
| | |
| Third-party refinery sales | |
| (563 | ) | |
| (1,142 | ) |
| Aircraft fuel and related taxes | |
| (2,941 | ) | |
| (2,849 | ) |
| Profit sharing | |
| (299 | ) | |
| (272 | ) |
| Restructuring charges | |
| – | | |
| 118 | |
| Non-Fuel Cost | |
$ | 9,098 | | |
$ | 7,821 | |
| | |
Year Ended | |
| (in millions) | |
December
31, 2023 | | |
December
31, 2022 | |
| Operating Expense | |
$ | 52,527 | | |
$ | 46,921 | |
| Adjusted for: | |
| | | |
| | |
| Third-party refinery sales | |
| (3,379 | ) | |
| (4,977 | ) |
| Aircraft fuel and related taxes | |
| (11,069 | ) | |
| (11,482 | ) |
| Profit sharing | |
| (1,383 | ) | |
| (563 | ) |
| One-time pilot agreement expenses | |
| (864 | ) | |
| – | |
| Restructuring charges | |
| – | | |
| 124 | |
| Non-Fuel Cost | |
$ | 35,831 | | |
$ | 30,024 | |
| | |
Three
Months Ended | | |
| |
| | |
December
31, 2023 | | |
December
31, 2022 | | |
% Change | |
| CASM (cents) | |
| 18.84 | | |
| 20.11 | | |
| | |
| Adjusted for: | |
| | | |
| | | |
| | |
| Third-party refinery sales | |
| (0.82 | ) | |
| (1.92 | ) | |
| | |
| Aircraft fuel and related taxes | |
| (4.30 | ) | |
| (4.78 | ) | |
| | |
| Profit sharing | |
| (0.44 | ) | |
| (0.46 | ) | |
| | |
| Restructuring charges | |
| – | | |
| 0.20 | | |
| | |
| CASM-Ex | |
| 13.29 | | |
| 13.14 | | |
| 1.1% | |
| | |
Year Ended | | |
| |
| | |
December
31, 2023 | | |
December
31, 2022 | | |
% Change | |
| CASM (cents) | |
| 19.31 | | |
| 20.12 | | |
| | |
| Adjusted for: | |
| | | |
| | | |
| | |
| Third-party refinery sales | |
| (1.24 | ) | |
| (2.13 | ) | |
| | |
| Aircraft fuel and related taxes | |
| (4.07 | ) | |
| (4.92 | ) | |
| | |
| Profit sharing | |
| (0.51 | ) | |
| (0.24 | ) | |
| | |
| One-time pilot agreement expenses | |
| (0.32 | ) | |
| – | | |
| | |
| Restructuring charges | |
| – | | |
| 0.05 | | |
| | |
| CASM-Ex | |
| 13.17 | | |
| 12.87 | | |
| 2.3% | |
Operating Expense, adjusted
| | |
Three
Months Ended | |
| (in millions) | |
December
31, 2023 | | |
December
31, 2022 | |
| Operating expense | |
$ | 12,900 | | |
$ | 11,965 | |
| Adjusted for: | |
| | | |
| | |
| Third-party refinery sales | |
| (563 | ) | |
| (1,142 | ) |
| MTM adjustments and settlements on hedges | |
| (7 | ) | |
| (70 | ) |
| Restructuring charges | |
| – | | |
| 118 | |
| Operating expense, adjusted | |
$ | 12,330 | | |
$ | 10,871 | |
| | |
Year Ended | |
| (in millions) | |
December
31, 2023 | | |
December
31, 2022 | |
| Operating expense | |
$ | 52,527 | | |
$ | 46,921 | |
| Adjusted for: | |
| | | |
| | |
| Third-party refinery sales | |
| (3,379 | ) | |
| (4,977 | ) |
| MTM adjustments and settlements on hedges | |
| 52 | | |
| (29 | ) |
| One-time pilot agreement charges | |
| (864 | ) | |
| – | |
| Restructuring charges | |
| – | | |
| 124 | |
| Operating expense, adjusted | |
$ | 48,335 | | |
$ | 42,039 | |
Total fuel expense, adjusted and Average
fuel price per gallon, adjusted
| | |
| | |
| | |
| | |
Average
Price Per Gallon | | |
| |
| | |
Three
Months Ended | | |
| | |
Three
Months Ended | | |
| |
| | |
December 31, | | |
December 31, | | |
| | |
December 31, | | |
December 31, | | |
| |
| (in millions, except per gallon data) | |
2023 | | |
2022 | | |
% Change | | |
2023 | | |
2022 | | |
% Change | |
| Total fuel expense | |
$ | 2,941 | | |
$ | 2,849 | | |
| | | |
$ | 3.01 | | |
$ | 3.28 | | |
| | |
| Adjusted for: | |
| | | |
| | | |
| | | |
| | | |
| | | |
| | |
| MTM
adjustments and settlements on hedges | |
| (7 | ) | |
| (70 | ) | |
| | | |
| (0.01 | ) | |
| (0.08 | ) | |
| | |
| Total fuel expense,
adjusted | |
$ | 2,933 | | |
$ | 2,778 | | |
| 6% | | |
$ | 3.00 | | |
$ | 3.20 | | |
| (6 | )% |
| | |
| | |
| | |
| | |
Average
Price Per Gallon | | |
| |
| | |
Year Ended | | |
| | |
Year Ended | | |
| |
| | |
December 31, | | |
December 31, | | |
| | |
December 31, | | |
December 31, | | |
| |
| (in millions, except per gallon data) | |
2023 | | |
2022 | | |
% Change | | |
2023 | | |
2022 | | |
% Change | |
| Total fuel expense | |
$ | 11,069 | | |
$ | 11,482 | | |
| | | |
$ | 2.82 | | |
$ | 3.36 | | |
| | |
| Adjusted for: | |
| | | |
| | | |
| | | |
| | | |
| | | |
| | |
| MTM
adjustments and settlements on hedges | |
| 52 | | |
| (29 | ) | |
| | | |
| 0.01 | | |
| (0.01 | ) | |
| | |
| Total fuel expense,
adjusted | |
$ | 11,121 | | |
$ | 11,453 | | |
| (3 | )% | |
$ | 2.83 | | |
$ | 3.36 | | |
| (16 | )% |
Adjusted Net Debt. Delta uses
adjusted total debt, including aircraft rent, in addition to adjusted debt and finance leases, to present estimated financial obligations.
Delta reduces adjusted total debt by cash, cash equivalents, short-term investments and LGA restricted cash, resulting in adjusted net
debt, to present the amount of assets needed to satisfy the debt. Management believes this metric is helpful to investors in assessing
the company's overall debt profile.
| (in millions) | |
December
31, 2023 | | |
December
31, 2022 | | |
Change | |
| Debt and finance lease obligations | |
$ | 20,054 | | |
$ | 23,030 | | |
| | |
| Plus: sale-leaseback financing liabilities | |
| 1,887 | | |
| 2,180 | | |
| | |
| Plus:
unamortized discount/(premium) and debt issue cost, net and other | |
| 83 | | |
| 138 | | |
| | |
| Adjusted debt and finance lease obligations | |
$ | 22,024 | | |
$ | 25,349 | | |
| | |
| Plus: 7x last twelve months' aircraft rent | |
| 3,724 | | |
| 3,558 | | |
| | |
| Adjusted total debt | |
$ | 25,748 | | |
$ | 28,906 | | |
| | |
| Less: cash, cash equivalents and short-term investments | |
| (3,869 | ) | |
| (6,534 | ) | |
| | |
| Less: LGA restricted cash | |
| (455 | ) | |
| (69 | ) | |
| | |
| Adjusted net debt | |
$ | 21,424 | | |
$ | 22,303 | | |
$ | (879 | ) |
Gross Capital Expenditures. We
adjust capital expenditures for the following items to determine gross capital expenditures for the reasons described below:
Net cash flows related
to certain airport construction projects. Cash flows related to certain airport construction projects are included in capital expenditures.
We have adjusted for these items because management believes investors should be informed that a portion of these capital expenditures
from airport construction projects are either funded with restricted cash specific to these projects or reimbursed by a third party.
Financed aircraft acquisitions.
This adjusts capital expenditures to reflect aircraft deliveries that are leased as capital expenditures. The adjustment is based
on their original contractual purchase price or an estimate of the aircraft's fair value and provides a more meaningful view of our investing
activities.
| | |
Three
Months Ended | |
| (in millions) | |
December
31, 2023 | | |
December
31, 2022 | |
| Flight equipment, including advance payments | |
$ | 1,085 | | |
$ | 1,643 | |
| Ground property and equipment, including technology | |
| 517 | | |
| 557 | |
| Adjusted for: | |
| | | |
| | |
| Net cash flows related
to certain airport construction projects | |
| (400 | ) | |
| (87 | ) |
| Gross capital expenditures | |
$ | 1,201 | | |
$ | 2,113 | |
| | |
Year Ended |
| (in millions) | |
December
31, 2023 | |
December
31, 2022 |
| Flight equipment, including advance payments | |
$ | 3,645 | | |
$ | 4,495 | |
| Ground property and equipment, including technology | |
| 1,678 | | |
| 1,871 | |
| Adjusted for: | |
| | | |
| | |
| Financed aircraft acquisitions | |
| 461 | | |
| 206 | |
| Net cash flows related
to certain airport construction projects | |
| (479 | ) | |
| (564 | ) |
| Gross capital expenditures | |
$ | 5,305 | | |
$ | 6,008 | |
Exhibit 99.2
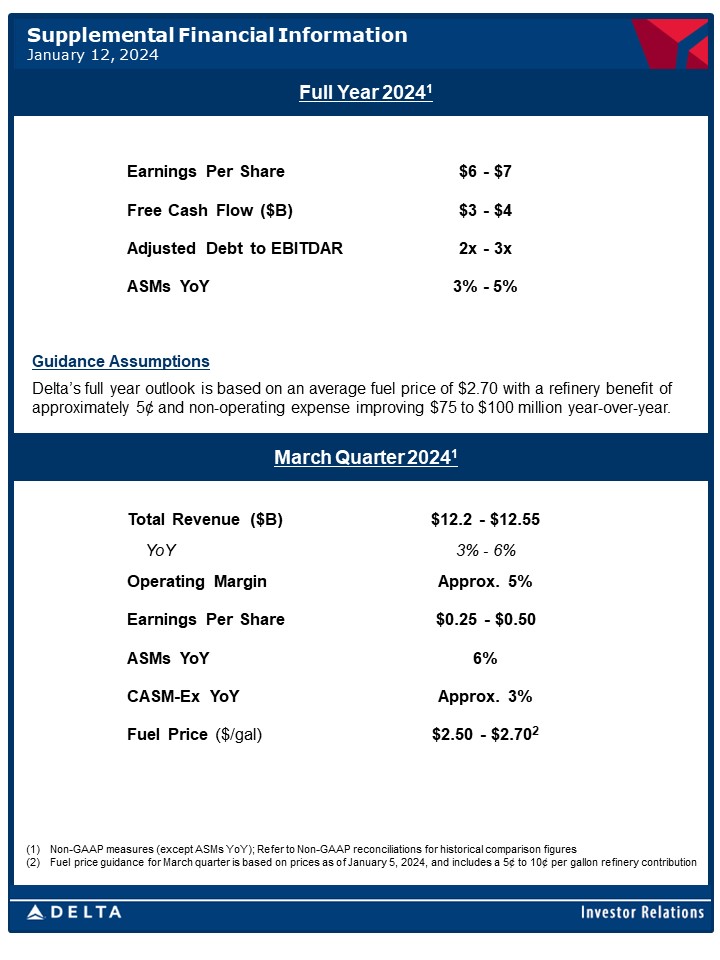
$12.2 - $12.55 Total Revenue ($B) 3% - 6% YoY Approx. 5% Operating Margin $0.25 - $0.50 Earnings Per Share 6% ASMs YoY Approx. 3% CASM - Ex YoY $2.50 - $2.70 2 Fuel Price ($/gal) March Quarter 2024 1 Supplemental Financial Information January 12, 2024 (1) Non - GAAP measures (except ASMs YoY); Refer to Non - GAAP reconciliations for historical comparison figures (2) Fuel price guidance for March quarter is based on prices as of January 5, 2024, and includes a 5¢ to 10¢ per gallon refinery con tribution $6 - $7 Earnings Per Share $3 - $4 Free Cash Flow ($B) 2x - 3x Adjusted Debt to EBITDAR 3% - 5% ASMs YoY Guidance Assumptions Delta’s full year outlook is based on an average fuel price of $2.70 with a refinery benefit of approximately 5 ¢ and non - operating expense improving $75 to $100 million year - over - year. Full Year 2024 1
Supplemental Financial Information January 12, 2024 Profit Sharing Delta’s broad - based employee profit sharing program pays 10% of the company’s adjusted annual profit to all eligible employees up to $2.5 billion and 20% above that amount. Delta incurs employer taxes and other costs which add 2% to 2.5% at the 10% level and 3% to 4% at the 20% level. Adjusted annual profit is calculated as the company’s annual pre - tax income before profit sharing expense, special items, and certain other items. Profit sharing expense is accrued at a blended rate based on the company’s estimated profitability for the full year , weighted by each period's relative profit. Any losses must be fully recovered before profit sharing expense begins accruing.
Forward Looking Statements Statements made in this presentation that are not historical facts, including statements regarding our estimates, expectations, beliefs, intentions, projections, goals, aspirations, commitments or strategies for the future, should be considered “forward - looking statements” under the Securities Act of 1933, as amended, the Securities Exchange Act of 1934, as amended, and the Private Securities Litigation Reform Act of 1995. Such statements are not guarantees or promised outcomes and should not be construed as such. All forward - looking statements involve a number of risks and uncertainties that could cause actual results to differ materially from the estimates, expectations, beliefs, intentions, projections, goals, aspirations, commitments and strategies reflected in or suggested by the forward - looking statements. These risks and uncertainties include, but are not limited to, the impact of incurring significant debt in response to the COVID - 19 pandemic; failure to comply with the financial and other covenants in our financing agreements; the possible effects of accidents involving our aircraft or aircraft of our airline partners; breaches or lapses in the security of techno log y systems on which we rely, which could compromise the data stored within them, as well as failure to comply with ever - evolving global privacy and security regulatory obligations or adequately address increasing customer focus on privacy issues and data security; disruptions in our information technology infrastructure; our dependence on technology in our operations; our commercial relationships with airlines in other parts of the world and the investments we have in certain of those airlines; the effects of a significant disruption in the operations or performance of third parties on which we rely; failure to realize the full value of intangible or long - lived assets; labor issues; the effects on our business of seasonality a nd other factors beyond our control, including severe weather conditions, natural disasters or other environmental events, including from the impact of climate change; changes in the cost of aircraft fuel; extended disruptions in the supply of aircraft fuel, including from Monroe Energy, LLC (“Monroe”), a wholly - owned subsidiary of Delta; failure or inability of insurance to cover a significant liability at Monroe’s Trainer refinery; failure to comply with existing and future environmental regulations to which Monroe’s refinery operations are subject, including costs related to compliance with renewable fuel standard regulations; significant damage to our reputation and brand, including from exposure to significant adverse publicity or inability to achieve certain sustainability goals; our ability to retain senior management and other key employees, and to maintain our company culture; disease outbreaks, such as the COVID - 19 pandemic or similar public health threats, and measures implemented to combat them; the effects of terrorist attacks, geopolitical conflict or security events; competitive conditions in the airline industry; extended interruptions or disruptions in service at major airports at which we operate or significant problems associated with types of aircraft or engines we operate; the effects of extensive government regulation we are subject to; the impact of environmental regulation, including but not limited to increased regulation to reduce emissions and other risks associated with climate change, and the cost of compliance with more stringent environmental regulations; and unfavorable economic or political conditions in the markets in which we operate or volatility in currency exchange rates. Additional information concerning risks and uncertainties that could cause differences between actual results and forward - looking statements is contained in our Securities and Exchange Commission filings, including our Annual Report on Form 10 - K for the fiscal year ended December 31, 2022. Caution should be taken not to place undue reliance on our forward - looking statements, which represent our views only as of the date of this presentation, and which we undertake no obligation to update except to the extent required by law.

Non - GAAP Reconciliations Non - GAAP Financial Measures Delta sometimes uses information ("non - GAAP financial measures") that is derived from the Consolidated Financial Statements, but that is not presented in accordance with accounting principles generally accepted in the U.S. (“GAAP”). Under the U.S. Securities and Exchange Commission rules, non - GAAP financial measures may be considered in addition to results prepared in accordance with GAAP, but should not be considered a substitute for or superior to GAAP results. The tables below show reconciliations of the non - GAAP financial measures used in this update to the most directly comparable GAAP financial measures. The reconciliations may not calculate due to rounding. Delta is not able to reconcile certain forward looking non - GAAP financial measures without unreasonable effort because the adjusting items such as those used in the reconciliations below will not be known until the end of the indicated future periods and could be significant. Adjustments. The following reconciliations include certain adjustments to GAAP measures that are made to provide comparability between the reported periods, if applicable, and for the reasons indicated below: Third - party refinery sales. Refinery sales to third parties, and related expenses, are not related to our airline segment. Excluding these sales therefore provides a more meaningful comparison of our airline operations to the rest of the airline industry. Aircraft fuel and related taxes. The volatility in fuel prices impacts the comparability of year - over - year financial performance. The adjustment for aircraft fuel and related taxes allows investors to better understand and analyze our non - fuel costs and year - over - year financial performance. Profit sharing. We adjust for profit sharing because this adjustment allows investors to better understand and analyze our recurring cost performance and provides a more meaningful comparison of our core operating costs to the airline industry. One - time pilot agreement expenses. In the March 2023 quarter, Delta pilots ratified a new four - year Pilot Working Agreement effective January 1, 2023. The agreement included a provision for a one - time payment made upon ratification in the March 2023 quarter of $735 million. Additionally, we recorded adjustments to other benefit - related items of approximately $130 million. Adjusting for these expenses allows investors to better understand and analyze our core cost performance. Three Months Ended (in billions) March 31, 2023 12.8$ Third-party refinery sales (0.9) 11.8$ Total operating revenue, adjusted Total operating revenue Adjusted for: Total operating revenue, adjusted Three Months Ended (in cents) March 31, 2023 CASM 21.25 Aircraft fuel and related taxes (4.36) Third-party refinery sales (1.49) Profit sharing (0.12) One-time pilot agreement expenses (1.41) 13.86 CASM-Ex Adjusted for: Non-Fuel Unit Cost or Cost per Available Seat Mile, adjusted ("CASM-Ex")
v3.23.4
| X |
- DefinitionBoolean flag that is true when the XBRL content amends previously-filed or accepted submission.
| Name: |
dei_AmendmentFlag |
| Namespace Prefix: |
dei_ |
| Data Type: |
xbrli:booleanItemType |
| Balance Type: |
na |
| Period Type: |
duration |
|
| X |
- DefinitionFor the EDGAR submission types of Form 8-K: the date of the report, the date of the earliest event reported; for the EDGAR submission types of Form N-1A: the filing date; for all other submission types: the end of the reporting or transition period. The format of the date is YYYY-MM-DD.
| Name: |
dei_DocumentPeriodEndDate |
| Namespace Prefix: |
dei_ |
| Data Type: |
xbrli:dateItemType |
| Balance Type: |
na |
| Period Type: |
duration |
|
| X |
- DefinitionThe type of document being provided (such as 10-K, 10-Q, 485BPOS, etc). The document type is limited to the same value as the supporting SEC submission type, or the word 'Other'.
| Name: |
dei_DocumentType |
| Namespace Prefix: |
dei_ |
| Data Type: |
dei:submissionTypeItemType |
| Balance Type: |
na |
| Period Type: |
duration |
|
| X |
- DefinitionAddress Line 1 such as Attn, Building Name, Street Name
| Name: |
dei_EntityAddressAddressLine1 |
| Namespace Prefix: |
dei_ |
| Data Type: |
xbrli:normalizedStringItemType |
| Balance Type: |
na |
| Period Type: |
duration |
|
| X |
- Definition
+ References
+ Details
| Name: |
dei_EntityAddressCityOrTown |
| Namespace Prefix: |
dei_ |
| Data Type: |
xbrli:normalizedStringItemType |
| Balance Type: |
na |
| Period Type: |
duration |
|
| X |
- DefinitionCode for the postal or zip code
| Name: |
dei_EntityAddressPostalZipCode |
| Namespace Prefix: |
dei_ |
| Data Type: |
xbrli:normalizedStringItemType |
| Balance Type: |
na |
| Period Type: |
duration |
|
| X |
- DefinitionName of the state or province.
| Name: |
dei_EntityAddressStateOrProvince |
| Namespace Prefix: |
dei_ |
| Data Type: |
dei:stateOrProvinceItemType |
| Balance Type: |
na |
| Period Type: |
duration |
|
| X |
- DefinitionA unique 10-digit SEC-issued value to identify entities that have filed disclosures with the SEC. It is commonly abbreviated as CIK. Reference 1: http://www.xbrl.org/2003/role/presentationRef
-Publisher SEC
-Name Exchange Act
-Number 240
-Section 12
-Subsection b-2
| Name: |
dei_EntityCentralIndexKey |
| Namespace Prefix: |
dei_ |
| Data Type: |
dei:centralIndexKeyItemType |
| Balance Type: |
na |
| Period Type: |
duration |
|
| X |
- DefinitionIndicate if registrant meets the emerging growth company criteria. Reference 1: http://www.xbrl.org/2003/role/presentationRef
-Publisher SEC
-Name Exchange Act
-Number 240
-Section 12
-Subsection b-2
| Name: |
dei_EntityEmergingGrowthCompany |
| Namespace Prefix: |
dei_ |
| Data Type: |
xbrli:booleanItemType |
| Balance Type: |
na |
| Period Type: |
duration |
|
| X |
- DefinitionCommission file number. The field allows up to 17 characters. The prefix may contain 1-3 digits, the sequence number may contain 1-8 digits, the optional suffix may contain 1-4 characters, and the fields are separated with a hyphen.
| Name: |
dei_EntityFileNumber |
| Namespace Prefix: |
dei_ |
| Data Type: |
dei:fileNumberItemType |
| Balance Type: |
na |
| Period Type: |
duration |
|
| X |
- DefinitionTwo-character EDGAR code representing the state or country of incorporation.
| Name: |
dei_EntityIncorporationStateCountryCode |
| Namespace Prefix: |
dei_ |
| Data Type: |
dei:edgarStateCountryItemType |
| Balance Type: |
na |
| Period Type: |
duration |
|
| X |
- DefinitionThe exact name of the entity filing the report as specified in its charter, which is required by forms filed with the SEC. Reference 1: http://www.xbrl.org/2003/role/presentationRef
-Publisher SEC
-Name Exchange Act
-Number 240
-Section 12
-Subsection b-2
| Name: |
dei_EntityRegistrantName |
| Namespace Prefix: |
dei_ |
| Data Type: |
xbrli:normalizedStringItemType |
| Balance Type: |
na |
| Period Type: |
duration |
|
| X |
- DefinitionThe Tax Identification Number (TIN), also known as an Employer Identification Number (EIN), is a unique 9-digit value assigned by the IRS. Reference 1: http://www.xbrl.org/2003/role/presentationRef
-Publisher SEC
-Name Exchange Act
-Number 240
-Section 12
-Subsection b-2
| Name: |
dei_EntityTaxIdentificationNumber |
| Namespace Prefix: |
dei_ |
| Data Type: |
dei:employerIdItemType |
| Balance Type: |
na |
| Period Type: |
duration |
|
| X |
- DefinitionLocal phone number for entity.
| Name: |
dei_LocalPhoneNumber |
| Namespace Prefix: |
dei_ |
| Data Type: |
xbrli:normalizedStringItemType |
| Balance Type: |
na |
| Period Type: |
duration |
|
| X |
- DefinitionBoolean flag that is true when the Form 8-K filing is intended to satisfy the filing obligation of the registrant as pre-commencement communications pursuant to Rule 13e-4(c) under the Exchange Act. Reference 1: http://www.xbrl.org/2003/role/presentationRef
-Publisher SEC
-Name Exchange Act
-Number 240
-Section 13e
-Subsection 4c
| Name: |
dei_PreCommencementIssuerTenderOffer |
| Namespace Prefix: |
dei_ |
| Data Type: |
xbrli:booleanItemType |
| Balance Type: |
na |
| Period Type: |
duration |
|
| X |
- DefinitionBoolean flag that is true when the Form 8-K filing is intended to satisfy the filing obligation of the registrant as pre-commencement communications pursuant to Rule 14d-2(b) under the Exchange Act. Reference 1: http://www.xbrl.org/2003/role/presentationRef
-Publisher SEC
-Name Exchange Act
-Number 240
-Section 14d
-Subsection 2b
| Name: |
dei_PreCommencementTenderOffer |
| Namespace Prefix: |
dei_ |
| Data Type: |
xbrli:booleanItemType |
| Balance Type: |
na |
| Period Type: |
duration |
|
| X |
- DefinitionTitle of a 12(b) registered security. Reference 1: http://www.xbrl.org/2003/role/presentationRef
-Publisher SEC
-Name Exchange Act
-Number 240
-Section 12
-Subsection b
| Name: |
dei_Security12bTitle |
| Namespace Prefix: |
dei_ |
| Data Type: |
dei:securityTitleItemType |
| Balance Type: |
na |
| Period Type: |
duration |
|
| X |
- DefinitionName of the Exchange on which a security is registered. Reference 1: http://www.xbrl.org/2003/role/presentationRef
-Publisher SEC
-Name Exchange Act
-Number 240
-Section 12
-Subsection d1-1
| Name: |
dei_SecurityExchangeName |
| Namespace Prefix: |
dei_ |
| Data Type: |
dei:edgarExchangeCodeItemType |
| Balance Type: |
na |
| Period Type: |
duration |
|
| X |
- DefinitionBoolean flag that is true when the Form 8-K filing is intended to satisfy the filing obligation of the registrant as soliciting material pursuant to Rule 14a-12 under the Exchange Act. Reference 1: http://www.xbrl.org/2003/role/presentationRef
-Publisher SEC
-Name Exchange Act
-Section 14a
-Number 240
-Subsection 12
| Name: |
dei_SolicitingMaterial |
| Namespace Prefix: |
dei_ |
| Data Type: |
xbrli:booleanItemType |
| Balance Type: |
na |
| Period Type: |
duration |
|
| X |
- DefinitionTrading symbol of an instrument as listed on an exchange.
| Name: |
dei_TradingSymbol |
| Namespace Prefix: |
dei_ |
| Data Type: |
dei:tradingSymbolItemType |
| Balance Type: |
na |
| Period Type: |
duration |
|
| X |
- DefinitionBoolean flag that is true when the Form 8-K filing is intended to satisfy the filing obligation of the registrant as written communications pursuant to Rule 425 under the Securities Act. Reference 1: http://www.xbrl.org/2003/role/presentationRef
-Publisher SEC
-Name Securities Act
-Number 230
-Section 425
| Name: |
dei_WrittenCommunications |
| Namespace Prefix: |
dei_ |
| Data Type: |
xbrli:booleanItemType |
| Balance Type: |
na |
| Period Type: |
duration |
|
Delta Air Lines (NYSE:DAL)
Graphique Historique de l'Action
De Avr 2024 à Mai 2024

Delta Air Lines (NYSE:DAL)
Graphique Historique de l'Action
De Mai 2023 à Mai 2024
