 Hot Features
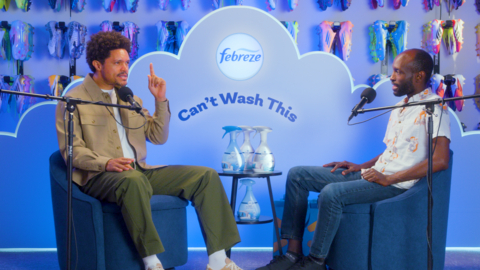
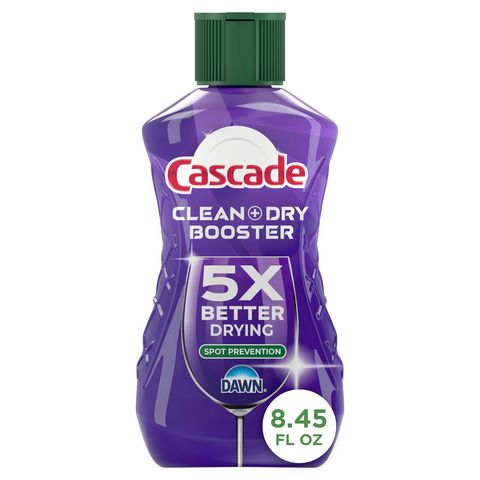
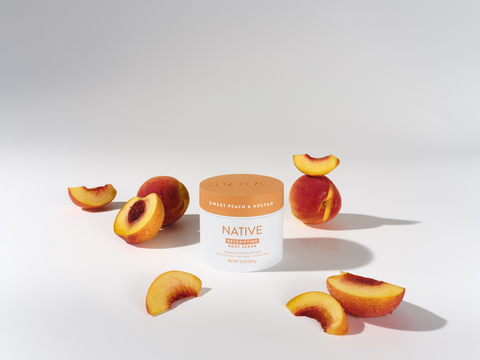
The Procter & Gamble Company provides branded consumer packaged goods worldwide. It operates through Beauty; Grooming; Health Care; Fabric & Home Care; and Baby, Feminine & Family Care segments. The company offers conditioners, shampoos, styling aids, and treatments under the Head & Shoulders, Herba... The Procter & Gamble Company provides branded consumer packaged goods worldwide. It operates through Beauty; Grooming; Health Care; Fabric & Home Care; and Baby, Feminine & Family Care segments. The company offers conditioners, shampoos, styling aids, and treatments under the Head & Shoulders, Herbal Essences, Pantene, and Rejoice brands; antiperspirants, deodorants, and personal cleansing products under the Native, Old Spice, Safeguard, and Secret brands; and facial moisturizers, cleaners, and treatments under the Olay and SK-II brands. It also provides blades, razors, shave products, appliances, and other grooming products under the Braun, Gillette, and Venus brands. In addition, the company offers toothbrushes, toothpastes, and other oral care products under the Crest and Oral-B brands; and gastrointestinal, pain relief, rapid diagnostics, respiratory, vitamins/minerals/supplements, and other personal health care products under the Metamucil, Neurobion, Pepto-Bismol, and Vicks brands. Further, it provides fabric enhancers, and laundry additives and detergents under the Ariel, Downy, Gain, and Tide brands; and air and dish care, P&G professional, and surface care under the Cascade, Dawn, Fairy, Febreze, Mr. Clean, and Swiffer brands. Additionally, the company offers baby wipes, and taped diapers and pants under the Luvs and Pampers brands; adult incontinence and menstrual care products under the Always, Always Discreet, and Tampax brands; and paper towels, tissues, and toilet papers under the Bounty, Charmin, and Puffs brands. It sells its products through mass merchandisers, social and e-commerce channels, grocery and specialty beauty stores, membership club stores, drug and department stores, distributors, wholesalers, airport duty-free and high-frequency stores, pharmacies, electronics stores, and professional channels, as well as directly to consumers. The Procter & Gamble Company was founded in 1837 and is headquartered in Cincinnati, Ohio. Show more

| Période | Variation | Variation % | Ouver. | Haut | Bas | Moyenne Vol. Quot. | VWAP | |
|---|---|---|---|---|---|---|---|---|
| 1 | -3.63 | -2.40907884258 | 150.68 | 153.49 | 145.6 | 9625968 | 149.19788769 | CS |
| 4 | -2.33 | -1.55978042576 | 149.38 | 153.49 | 144.17 | 10018273 | 149.49777578 | CS |
| 12 | 3.64 | 2.53817725403 | 143.41 | 153.49 | 138.86 | 9183600 | 146.39326908 | CS |
| 26 | 4.51 | 3.16402413358 | 142.54 | 167.25 | 138.86 | 10230932 | 149.26427317 | CS |
| 52 | -10.65 | -6.7533291059 | 157.7 | 167.25 | 137.62 | 9284261 | 149.55119629 | CS |
| 156 | -1.68 | -1.12956363881 | 148.73 | 180.43 | 137.62 | 7690971 | 156.84779859 | CS |
| 260 | 10.15 | 7.41417092768 | 136.9 | 180.43 | 122.18 | 7426288 | 153.10280637 | CS |

Transactions différées
Pour obtenir des transactions en temps réel, améliorez votre compte
Passer à la version en temps réel| Aucune Discussion Trouvée |
| Ajouter une Discussion |

Les dernières valeurs consultées apparaîtront dans cette boîte, vous permettant de choisir facilement les titres vus auparavant.
Assistance: support@advfn.fr
En accédant aux services disponibles de ADVFN, vous acceptez les Conditions Générales de ADVFN Conditions Générales
 S'inscrire avec l'e-mail
Vous avez déjà un compte? Connexion
Vous n'avez pas de compte ? Inscription
En m'inscrivant, je confirme avoir lu, compris et accepté les Conditions générales d'ADVFN et j'affirme etre un investisseur privé.


