Exxon Mobil Down Almost 5%, On Pace for Lowest Close Since September 2004 -- Data Talk
06 Mars 2020 - 6:36PM
Dow Jones News
Exxon Mobil Corporation (XOM) is currently at $47.76, down $2.35
or 4.69%
-- Would be lowest close since Sept. 23, 2004, when it closed at
$47.76
-- Currently down three of the past four days
-- Exxon Mobil will reduce its spending on producing natural gas
in North America, according to Neil Chapman, head of Exxon's
upstream business. Due to low U.S. natural gas prices, Chapman said
Exxon would reduce capital expenditure on North American dry
gas
-- Earlier Friday, two firms cut their price target on Exxon,
Benzinga reported
-- Currently down two consecutive days; down 8.89% over this
period
-- Worst two day stretch since the two days ending Feb. 5, 2018,
when it fell 10.5%
-- Down 31.56% year-to-date
-- Down 54.24% from its all-time closing high of $104.38 on June
23, 2014
-- Down 39.55% from 52 weeks ago (March 8, 2019), when it closed
at $79.01
-- Down 42.72% from its 52 week closing high of $83.38 on April
23, 2019
-- Would be a new 52 week closing low
-- Traded as low as $47.30; lowest intraday level since Sept.
16, 2004, when it hit $47.30
-- Down 5.61% at today's intraday low
-- Second worst performer in the DJIA today
-- Eighth most active stock in the S&P 500 today
-- Subtracted 15.93 points from the DJIA so far today
All data as of 11:51:31 AM
Source: Dow Jones Market Data, FactSet
(END) Dow Jones Newswires
March 06, 2020 12:21 ET (17:21 GMT)
Copyright (c) 2020 Dow Jones & Company, Inc.
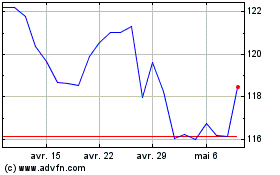
Exxon Mobil (NYSE:XOM)
Graphique Historique de l'Action
De Juin 2024 à Juil 2024

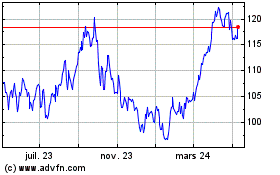
Exxon Mobil (NYSE:XOM)
Graphique Historique de l'Action
De Juil 2023 à Juil 2024
