Dogecoin Crashes 40%, But This Analyst Sees A Bullish Setup
03 Février 2025 - 6:00PM
NEWSBTC
In a dramatic reversal, Dogecoin (DOGE) plunged from around $0.34
as low as $0.20, wiping out nearly 40% of its value before finding
tentative stability near $0.25 at press time. However, crypto
analyst “Coosh” Alemzadeh (@AlemzadehC) maintains a bullish
long-term outlook, sharing a weekly chart of DOGE/USD and
remarking, “DOGE: Looking really good here,” despite the recent
turmoil. Why Dogecoin Is Still Looking Bullish The unexpected news
of new tariffs by the Trump administration on major trading
partners like China, Mexico, and Canada on Friday has sent
shockwaves across financial markets, including cryptocurrencies.
The news has led to a broad sell-off in risk assets, with Dogecoin,
known for its high volatility, being particularly affected. The
fear of an escalating trade war has dampened investor confidence,
pushing many to liquidate their positions in cryptocurrencies.
Related Reading: Dogecoin May Face An ‘Ugly’ Drop Before The
Weekend, Analyst Warns Following the tariff announcement, Dogecoin
saw an immediate and significant drop, within hours of the news
breaking. Over the weekend, the crypto market crash extended as
part of a larger market reaction, where major altcoins like XRP and
Cardano also experienced double-digit percentage losses. The entire
crypto market wiped over $2.2 billion in crypto liquidations.
Alemzadeh chart, drawn on the weekly timeframe, shows DOGE’s price
initially breaking above a descending red trendline in October.
That line has acted as a key resistance zone stretching back to
previous local highs, and the ensuing retreat has brought the
market right below the trendline again. In parallel, Dogecoin is
still positioned above its 30-week moving average (30w), which is
plotted as a pink-dotted curve and currently sits around the
$0.20–$0.22 range. Analysts often regard weekly closes above this
average as a sign of underlying strength, suggesting that DOGE may
yet hold onto its bullish structure if the market steadies above
that threshold. The chart also highlights a series of Fibonacci
retracement and extension levels, each offering insight into
potential support and resistance. At the forefront is the 0.618
Fibonacci retracement around $0.2667, a critical region that the
price now hovers around. This level often draws the attention of
traders looking to identify whether the market is in a standard
pullback or has begun a deeper correction. Related Reading:
Dogecoin (DOGE) Plunges to $0.20: Is This the Bottom or More Pain
Ahead? Next up sits the 0.786 retracement near $0.3467. Beyond
that, full retracement around $0.4843 marks a more distant
objective should DOGE reclaim its bullish momentum. Even loftier
extensions, indicated on Alemzadeh’s chart at $1.27 (1.618) and
$2.30 (2.0), serve as hypothetical targets if the token achieves a
major breakout. An additional element is the Elliott Wave labeling,
depicting what appears to be waves “1, 2, 3,” followed by the
current dip marked as wave “4” near $0.26. In traditional Elliott
Wave theory, wave four commonly retraces into the 0.236–0.618 zone
of the previous wave, so the present price action touching the
0.618 Fibonacci point fits well with that pattern. Should DOGE
confirm wave four support, the next phase—wave five—could drive the
market back above former highs with the main targets being $1.27
and $2.30 if bullish sentiment returns. At press time, DOGE traded
at $0.25. Featured image created with DALL.E, chart from
TradingView.com
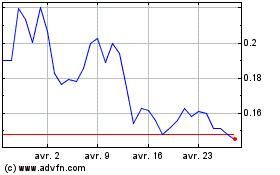
Dogecoin (COIN:DOGEUSD)
Graphique Historique de l'Action
De Jan 2025 à Fév 2025

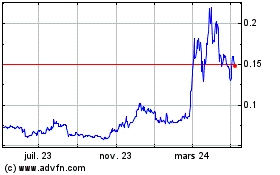
Dogecoin (COIN:DOGEUSD)
Graphique Historique de l'Action
De Fév 2024 à Fév 2025


