Anglesey Mining PLC Drilling Report - LIMs Houston Deposits
11 Février 2011 - 4:05PM
UK Regulatory
TIDMAYM

Anglesey Mining plc LSE:AYM

11 February 2011

New Mineralized Extension at LIM's Houston Deposits

Increases Houston Resource to 20 Million Tonnes

Anglesey Mining's 41% owned associate Labrador Iron Mines Holdings Limited
(TSX: LIM) is pleased to report a new resource estimate for its 100% owned
Houston deposits located in western Labrador following the 2010 exploration
drilling program. The new resource estimate of 19,499,000 million tonnes of
measured and indicated resources represents a significant increase over
previous estimates.

Commenting on the increased resource estimate at the Houston deposits, John F.
Kearney, Chairman and CEO of Labrador Iron Mines said, "As a result of the
exploration success and this significant increase, the Houston deposits are
now of sufficient tonnage to merit evaluation of a stand-alone operation. We
are now assessing the development of a new separate "South Central Zone", with
its own dedicated processing plant, which, subject to environmental assessment,
permitting and detailed engineering, could be brought into production in 2013
at a rate of 2 to 3 million tonnes per year. This would be in addition to LIM's
existing processing plant at Silver Yards scheduled to start up in April and
which with planned expansions will have a similar design capacity."

The Houston 1, 2 and 3 deposits comprise 12 mineral rights licenses
representing 112 mineral claim units that cover approximately 2,800 hectares,
situated 15 km south-east of LIM's James Mine and Silver Yards processing area
and approximately 20 km from the town of Schefferville, Quebec. The Houston
deposits form part of the Stage 1 planned production at LIM's Schefferville
area direct shipping iron ore projects.

The new estimate, prepared in accordance with NI 43-101, represents an
increase in tonnage of over 25% from the previous NI 43-101 estimate announced
in April 2010 and more than double the historical resource (not NI 43-101
compliant) previously estimated by the Iron Ore Company of Canada (IOC) prior
to 1982. The new resource also includes about one million tonnes of
manganiferous ore (Mn) grading about 54.4% Fe and 5% manganese.

The Houston Deposits -Resource Summary - February 2011 (See attached table for
details)

              43-101 (February 2011)       43-101 (April 2010*)        Historical 1982
      Class Tonnes     Fe     Mn   SiO2   Tonnes    Fe    Mn  SiO2 Tonnes   Fe   Mn SiO2
            x 1000      %      %      %   x 1000     %     %     % x 1000    %    %    %

Fe    M+IND 18,582   58.7    0.7   12.2   14,684  59.3   0.6  11.3  9,114 57.4    -  7.1
Ore   INF    1,014   56.3    1.0   15.9    1,498  57.0   0.8  14.7      -    -    -    -

Mn    M+IND    917   54.4    5.4    9.2      831  54.3   5.5   9.1      -    -    -    -
Ore   INF       10   53.2    4.5   11.5       47  54.0   4.6  10.3      -    -    -    -

TOTAL M+IND 19,499   58.3    0.9   12.3   15,515  59.0   0.9  11.2  9,114 57.4    -  7.1
      INF    1,024   55.8    1.0   16.5    1,545  56.9   0.9  14.5      -    -    -    -

*Technical report filed on Sedar on May 25 2010

The updated resource estimate for the Houston deposits is based on an
additional 1,804 metres of drilling in 26 holes and 625 samples carried out by
LIM in 2010. The majority of the additional resource has resulted from the
drilling of a new mineralized zone located between the Houston 1 and 2
deposits, as well as in-fill drilling within the deposit outlines during 2010.
The Houston deposits remain open along strike particularly to the southeast
and further drilling is planned on Houston 3 during 2011.

The classification of resources was completed using the results of drilling
and trenching carried out by LIM during the 2006 to 2010 field seasons, which
comprised twinning, in-fill and step-out drilling and trenching, as well as
drill and trench data previously obtained by IOC.

Block Modeling

LIM used Gemcom GEMS 6.4.2.1 software for the resource estimation. The
ordinary kriging interpolation method was used to estimate the resources by
block modeling with block sizes of 5x5x5 metres and block rotation of 45.6°
which matches with the general strike of the deposit. LIM used the geological
and ore models interpreted in plane and in sections. LIM used different search
ellipses derived from 3D semi-variogram analyses for the classification of the
resources.

Analyses

Analyses for all of the samples from the 2006 to 2010 drilling and trenching
programs were carried out by SGS-Lakefield Laboratory and Activation
Laboratories. The analytical method used was borate fusion whole rock X-Ray
Fluorescence.

Qualified Person

The resource estimates and information of a scientific or technical nature
contained in this release has been prepared by or under the supervision of
Terence McKillen, P.Geo., Executive Vice President of the Corporation and a
Qualified Person within the meaning of National Instrument 43-101 of the
Canadian Securities Administrators.
A Technical Report will be filed on Sedar within the required time frame.

About Labrador Iron Mines Holdings Limited (LIM)

LIM's Schefferville Area project involves the development of twenty direct
shipping iron ore deposits in western Labrador and north-eastern Quebec near
Schefferville, Quebec. The Company's properties are part of the historic
Schefferville area iron ore district where mining of adjacent deposits was
previously carried out by the Iron Ore Company of Canada from 1954 to 1982.

Labrador Iron Mines contemplates mining in stages, the first phase of Stage 1
comprising the James and Redmond deposits, which are located in close
proximity to existing infrastructure, where construction is being completed
and mine start-up is planned to commence in Spring 2011.

About Anglesey Mining plc

Anglesey Mining with its LSE main board listing is primarily focused on its
41% interest in Labrador Iron Mines (TSX:LIM). In addition to any new projects
that may be brought forward the company owns 100% of Parys Mountain in North
Wales with an historical resource in excess of 7 million tonnes at over 9%
combined copper, lead and zinc.

For further information, please contact:

Bill Hooley, Chief Executive +44 (0) 1492 541981

Ian Cuthbertson, Finance Director +44 (0) 1248 361333

Emily Fenton / Charlie Geller,
Tavistock Communications +44 (0) 20 7920 3155 / +44 (0) 7788 554035


Table Attached to LIM Press Release Feb 11, 2011
Houston Deposits - NI 43-101 Compliant Direct Shipping Resources - Feb 2011

Measured and Indicated
Area                   Ore Type   Tonnes   Fe%  Mn% SiO2%
                                 (x 1000)

Houston 1                LNB-NB  4,970.6  61.1  0.7   8.8
                         HiSiO2  1,277.7  52.8  0.6  21.1
                        LMN-HMN    510.8  54.8  5.4   8.8
                          Total  6,759.1  59.0  1.0  11.1

Houston 2N               LNB-NB     55.2  60.2  0.6  11.6
                         HiSiO2    116.9  52.4  0.6  22.8
                        LMN-HMN      9.0  44.8 10.7  13.4
                          Total    181.1  54.4  1.1  18.9

Houston 2S               LNB-NB  5,989.0  60.3  0.7  10.1
                         HiSiO2  2,565.5  52.6  0.8  21.5
                        LMN-HMN    144.2  56.0  4.8   9.5
                          Total  8,698.7  58.0  0.8  13.4

Houston 3                LNB-NB  3,013.6  59.4  0.9  10.0
                         HiSiO2    593.8  52.6  0.7  20.9
                        LMN-HMN    253.0  52.6  5.3  10.2
                          Total  3,860.4  57.9  1.2  11.7

Total                           19,499.3  58.3  0.9  12.3

Inferred

Houston 1                LNB-NB     80.7  58.2  0.6  13.0
                         HiSiO2     86.9  52.4  0.5  20.4
                        LMN-HMN      4.2  54.7  4.2  10.6
                          Total    171.9  55.2  0.7  16.7

Houston 2N               LNB-NB        -     -    -     -
                         HiSiO2      0.4  50.8  0.8  24.3
                        LMN-HMN        -     -    -     -
                          Total      0.4  50.8  0.8  24.3

Houston 2S               LNB-NB    335.9  59.4  1.0  12.0
                         HiSiO2    298.1  52.5  1.3  21.2
                        LMN-HMN        -     -    -     -
                          Total    634.0  56.2  1.1  16.3

Houston 3                LNB-NB    107.6  58.3  1.0  12.4
                         HiSiO2    104.3  52.6  0.6  21.6
                        LMN-HMN      5.3  50.6  4.3  12.8
                          Total    217.2  55.3  0.9  16.8

Total                            1,023.5  55.8  1.0  16.5


Ore Types                      Ore Colours        T_Fe% T_Mn% SiO2% Al2O3%

NB (Non-bessemer)        Blue, Red, Yellow         >=55  <3.5   <10     <5
LNB (Lean non-bessemer)  Blue, Red, Yellow         >=50  <3.5   <18     <5
HiSiO2 (High Silica)                  Blue         >=50  <3.5 18-30     <5
HMN (High Manganiferous) Blue, Red, Yellow (Fe+Mn) >=50   >=6   <18     <5
LMN (Low Manganiferous)  Blue, Red, Yellow (Fe+Mn) >=50 3.5-6   <18     <5

LIM resource definitions includes Hi-SiO2 ores (>=50% Fe <=30% SiO2 dry basis)

The original IOC ore definition was: >=50% Fe, <=18% SiO2 dry basis.


A variable specific gravity (density) was used for the modeled ore blocks
using the following equation previously calculated by LIM based upon 229
specific gravity tests: SG = (2.3388 + Fe x 0.0258) x 0.9

Blue ores, which are composed mainly of the minerals hematite and martite, are
generally coarse grained and friable. They are usually found in the middle
section of the iron formation.

Yellow ores, which are made up of the minerals limonite and goethite, are
located in the lower section of the iron formation in a unit referred to as
the "silicate carbonate iron formation" or SCIF.

Red ore is predominantly a red earthy hematite. It forms the basal layer that
underlies the lower section of the iron formation. Red ore is characterized by
its clay and slate-like texture.


END
February 11, 2011 10:05 ET (15:05 GMT)
Anglesey Mining (LSE:AYM)
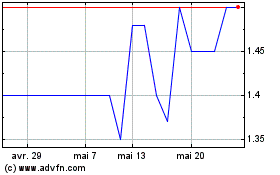
Graphique Historique de l'Action
De Juin 2024 à Juil 2024

Anglesey Mining (LSE:AYM)
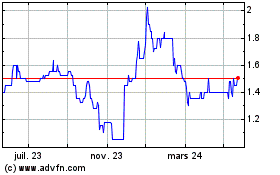
Graphique Historique de l'Action
De Juil 2023 à Juil 2024
