UNITED STATES
SECURITIES AND EXCHANGE COMMISSION
Washington, D.C. 20549
FORM 8-K
CURRENT REPORT
Pursuant to Section 13 or 15(d)
of the Securities Exchange Act of 1934
Date of Report (Date of earliest event reported): January 26, 2024
Autoliv, Inc.
(Exact name of registrant as specified in its charter)
|
|
|
|
|
Delaware |
|
001-12933 |
|
51-0378542 |
(State or other jurisdiction of incorporation) |
|
(Commission File Number) |
|
(IRS Employer Identification No.) |
|
|
|
Klarabergsviadukten 70, Section B, 7th Floor, |
|
|
Box 70381, Stockholm, Sweden |
|
SE-107 24 |
(Address of principal executive offices) |
|
(Zip code) |
+46 8 587 206 00
(Registrant’s telephone number, including area code)
Not Applicable
(Former name or former address, if changed since last report)
Check the appropriate box below if the Form 8-K filing is intended to simultaneously satisfy the filing obligation of the registrant under any of the following provisions (see General Instruction A.2. below):
|
|
☐ |
Written communications pursuant to Rule 425 under the Securities Act (17 CFR 230.425) |
☐ |
Soliciting material pursuant to Rule 14a-12 under the Exchange Act (17 CFR 240.14a-12) |
☐ |
Pre-commencement communications pursuant to Rule 14d-2(b) under the Exchange Act (17 CFR 240.14d-2(b)) |
☐ |
Pre-commencement communications pursuant to Rule 13e-4(c) under the Exchange Act (17 CFR 240.13e-4(c)) |
Securities registered pursuant to Section 12(b) of the Act:
|
|
|
|
|
Title of each class |
|
Trading Symbol(s) |
|
Name of each exchange on which registered |
Common Stock (par value $1.00 per share) |
|
ALV |
|
New York Stock Exchange |
Indicate by check mark whether the registrant is an emerging growth company as defined in Rule 405 of the Securities Act of 1933 (§ 230.405 of this chapter) or Rule 12b-2 of the Securities Exchange Act of 1934 (§ 240.12b-2 of this chapter).
Emerging growth company ☐
If an emerging growth company, indicate by check mark if the registrant has elected not to use the extended transition period for complying with any new or revised financial accounting standards provided pursuant to Section 13(a) of the Exchange Act. ☐
Item 2.02 Results of Operations and Financial Condition.
On January 26, 2024, Autoliv, Inc. (the “Company”) issued a press release announcing its financial results for the fourth quarter of 2023. A copy of the press release is furnished as Exhibit 99.1 to this report and is incorporated herein by reference. This press release contains certain references to financial measures identified as “organic sales,” “adjusted operating income,” “adjusted operating margin,” “trade working capital,” “adjusted earnings per share,” “net debt,” “adjusted EBITDA,” “net cash before financing,” “operating cash flow,” “free cash flow,” “cash conversion,” “leverage ratio,” and “adjusted return on capital employed,” all of which are adjustments from comparable measures calculated and presented in accordance with U.S. generally accepted accounting principles (GAAP). These financial measures, as used herein, differ from financial measures reported under GAAP, and management believes that these financial presentations provide useful supplemental information, which is important to a proper understanding by investors of the Company’s core business results. These presentations should not be viewed as a substitute for results determined in accordance with GAAP, nor are they necessarily comparable to non-GAAP financial measures presented by other companies. For an explanation of the reasons why management uses these figures, see the Company’s Annual Report on Form 10-K for the fiscal year ended December 31, 2022, filed with the SEC on February 16, 2023, and the Press Release regarding its financial results for the fourth quarter of 2023. A copy of the press release is furnished as Exhibit 99.1 to this report.
Item 7.01 Regulation FD Disclosure.
On January 26, 2024, the Company issued a press release announcing its financial results for the fourth quarter of 2023. A copy of the press release is furnished as Exhibit 99.1 to this report and is incorporated herein by reference.
The information in Items 2.02 and 7.01 of this Form 8-K and the exhibit attached hereto as Exhibit 99.1 shall not be deemed “filed” for purposes of Section 18 of the Securities Exchange Act of 1934, as amended (the “Exchange Act”), or otherwise subject to the liabilities of that section, nor shall it be deemed incorporated by reference in any filing under the Securities Act of 1933, as amended, or the Exchange Act, except as shall be expressly set forth by specific reference in such a filing.
Item 9.01 Financial Statements and Exhibits.
(d) EXHIBITS
2(4)
EXHIBIT INDEX
3(4)
SIGNATURES
Pursuant to the requirements of the Securities Exchange Act of 1934, the registrant has duly caused this report to be signed on its behalf by the undersigned hereunto duly authorized.
|
|
|
|
|
AUTOLIV, INC |
|
|
|
|
|
By: |
|
/s/ Anthony J. Nellis |
|
Name: |
|
Anthony J. Nellis |
|
Title: |
|
Executive Vice President, Legal Affairs and General Counsel |
Date: January 26, 2024
4(4)
Exhibit 99.1
Financial Report
October - December 2023
Stockholm, Sweden, January 26, 2024
(NYSE: ALV and SSE: ALIV.sdb)


|
Financial Report October - December 2023 |
Q4 2023: Record sales and strong profitability
|
|
|
Financial highlights Q4 2023 $2,751 million net sales 18% net sales increase 16% organic sales growth* 8.6% operating margin 12.1% adjusted operating margin* $2.71 EPS, 51% increase $3.74 adjusted EPS*, 105% increase |
|
Full year 2024 guidance Around 5% organic sales growth Around 0% FX effect on net sales Around 10.5% adjusted operating margin Around $1.2 billion operating cash flow |
All change figures in this release compare to the same period of the previous year except when stated otherwise.
Key business developments in the fourth quarter of 2023
•Record sales, increased organically* by 16%, which was 7pp better than global LVP growth of 9% (S&P Global January 2024). We outperformed in all regions, except China, mainly due to new product launches and higher prices. LVP in China grew by 31% for domestic OEMs with typically lower safety content but only by 7% for global OEMs with typically higher safety content.
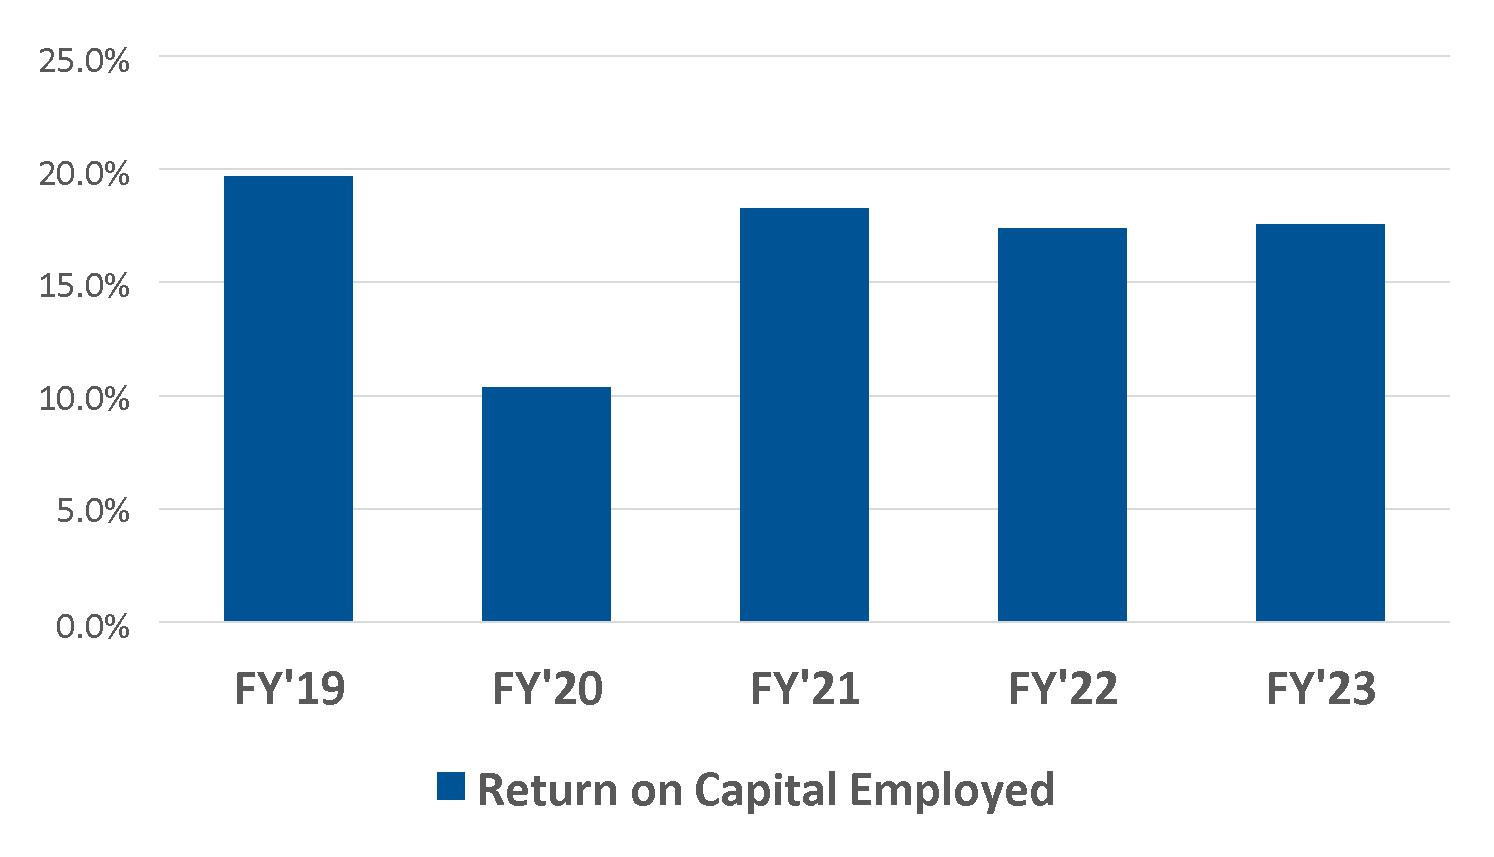
•Profitability improved substantially, positively impacted by price increases, organic growth, and our cost reduction activities. Operating income was $237 million and operating margin was 8.6%. Adjusted operating income* improved from $233 million to $334 million and adjusted operating margin* increased from 10.0% to 12.1%. Return on capital employed was 24% and adjusted return on capital employed* was 33%.
•Operating cash flow remained strong, at $447 million. Free cash flow* was unchanged at $297 million. The leverage ratio* improved to 1.2X compared to 1.3X in the third quarter of 2023, despite returning $207 million to shareholders as dividends and share repurchases. A dividend of $0.68 per share was paid (a 3% increase), and 1.51 million shares were repurchased and retired in the quarter.
|
*For non-U.S. GAAP measures see enclosed reconciliation tables. |
Key Figures
|
|
|
|
|
|
|
(Dollars in millions, except per share data) |
Q4 2023 |
Q4 2022 |
Change |
FY 2023 |
FY 2022 |
Change |
Net sales |
$2,751 |
$2,335 |
18% |
$10,475 |
$8,842 |
18% |
Operating income |
237 |
230 |
3.1% |
690 |
659 |
4.7% |
Adjusted operating income1) |
334 |
233 |
43% |
920 |
598 |
54% |
Operating margin |
8.6% |
9.8% |
(1.2)pp |
6.6% |
7.5% |
(0.9)pp |
Adjusted operating margin1) |
12.1% |
10.0% |
2.2pp |
8.8% |
6.8% |
2.0pp |
Earnings per share2) |
2.71 |
1.80 |
51% |
5.72 |
4.85 |
18% |
Adjusted earnings per share1,2) |
3.74 |
1.83 |
105% |
8.19 |
4.40 |
86% |
Operating cash flow |
$447 |
$462 |
(3.4)% |
$982 |
$713 |
38% |
Return on capital employed3) |
24.4% |
24.3% |
0.1pp |
17.7% |
17.5% |
0.2pp |
Adjusted return on capital employed1,3) |
32.9% |
24.9% |
8.1pp |
23.1% |
16.0% |
7.1pp |
1) Excluding effects from capacity alignments, antitrust related matters and for FY 2023 the Andrews litigation settlement. Non-U.S. GAAP measure, see reconciliation table. 2) Assuming dilution when applicable and net of treasury shares. 3) Annualized operating income and income from equity method investments, relative to average capital employed. |
|
|
|
|
Comments from Mikael Bratt, President & CEO |
|
|

|
As we indicated throughout the year, we finished 2023 strong. We achieved or exceeded all of our 2023 indications. Sales and adjusted operating income hit new records while operating cash flow remained strong. I am pleased that gross margin improved substantially. 2023 order intake was the highest in the past five years, supporting our around 45% market share |
We continue to deliver on our structural cost reductions, with around 75% of the planned indirect workforce reductions detailed and announced. We also see positive effects on direct labor productivity. Our 2023 performance developed very much as we indicated with heavy cost headwinds early in the year, which led to a weak Q1 2023. However, quarter-by-quarter, our performance improved, driven by customer recoveries, efficiencies, and organic growth leading to a substantial full year profitability improvement. Our sustainability agenda is yielding results with good progress in GHG emissions, renewable electricity use and incident rate. The seasonality of past years is likely to be repeated in 2024, with an expected Q1 adjusted operating margin of around 7%, followed by gradual quarterly improvements, leading to a full year 2024 adjusted operating margin of around 10.5%. Key drivers for the full year margin progression are continued improvement in call-off stability, outgrowing LVP and benefits from strategic and structural initiatives. The improving results we expect in 2024 should take us one important step closer to our target of around 12% adjusted operating margin. |
position, with a good mix of new and traditional OEMs as well as EV and ICE platforms. We increased shareholder returns to more than $200 million in the quarter while continuing to improve our leverage ratio. As of the end of 2023, we have repurchased shares close to $0.5 billion under our existing $1.5 billion repurchase program. We outperformed LVP in all regions except China, which had a very strong LVP growth for domestic OEMs with typically lower safety content. We strengthened our market position in China and our order intake was strong in the rapidly changing market, where domestic OEMs are now the drivers behind LVP development. |
2
|
Financial Report October - December 2023 |
Full year 2024 guidance
Our 2024 guidance is mainly based on our customer call-offs, a full year 2024 global LVP decline of around 1%, our achievement of our targeted cost compensation effects, and a reduction in customer call-off volatility.
|
|
|
|
|
Full Year Indication |
|
Full Year Indication |
Organic sales growth |
Around 5% |
Tax rate2) |
Around 28% |
FX impact on net sales |
Around 0% |
Operating cash flow3) |
Around $1.2 billion |
Adjusted operating margin1) |
Around 10.5% |
Capex, net, of sales |
Around 5.5% |
1) Excluding effects from capacity alignments, antitrust related matters and other discrete items. 2) Excluding unusual tax items. 3) Excluding unusual items. |
The forward-looking non-U.S. GAAP financial measures above are provided on a non-U.S. GAAP basis. Autoliv has not provided a U.S. GAAP reconciliation of these measures because items that impact these measures, such as costs and gains related to capacity alignments and antitrust matters, cannot be reasonably predicted or determined. As a result, such reconciliation is not available without unreasonable efforts and Autoliv is unable to determine the probable significance of the unavailable information.
Conference call and webcast
The earnings conference call will be held at 2:00 p.m. CET today, January 26, 2024. Information regarding how to participate is available on www.autoliv.com. The presentation slides for the conference call will be available on our website shortly after the publication of this financial report.
3
|
Financial Report October - December 2023 |
Business and market condition update
Supply Chain
Global light vehicle production growth year-over-year was around 9% (according to S&P Global January 2024) in the fourth quarter, with all major regions growing. We saw continued gradual improvement in call-off volatility as supply chains are less strained compared to a year earlier. However, volatility is still higher than pre-pandemic levels, and low customer demand visibility and changes to customer call-offs with short notice still had a negative impact on our production efficiency and profitability in the quarter. Fourth quarter industry-wide supply chain disruptions improved compared to the average 2023 situation, with the expectation that disruptions will remain unchanged from current situation for 2024. We thereby expect that call-off volatility through 2024 will be lower than in 2023 but remain higher than the pre-pandemic level. The unfolding situation in the Red Sea has not yet had any measurable impact on our own operations but we note near-term trends of extended transit times and increased freight tariffs and surcharges has led to some customers lowering their near term production plans. However, it is too early to estimate what impact this situation will have on our operations, directly or through our customers, going forward.
Inflation
In Q4 2023, cost pressures from labor, logistics, utilities, and other items had a negative impact on our profitability. Most of the inflationary cost pressure was offset by customer price and other compensations in the quarter. Raw material costs had a slightly positive impact on our profitability in Q4 2023. We expect the raw material price changes in 2024 to be largely reflected in price changes in our products, albeit with delays of several months. We also expect continued cost pressure from inflation relating mainly to labor, but also to a lesser extent to utilities and other items, especially in Europe and the Americas. We continue to execute on productivity and cost reduction activities to offset these cost pressures, and we continue to seek inflation compensation from our customers.
Other matters
In June 2023, Autoliv communicated a cost reduction framework which included the intent to reduce our indirect headcount by up to 2,000, and to improve direct labor productivity equivalent to up to a 6,000 direct workforce reduction. We announced more details on these initiatives on July 13, 2023, October 5, 2023, and on October 30, 2023. Based on the intended indirect workforce reductions in these three announcements, we estimate that the annual cost reductions will amount to around $130 million in total annual savings when fully implemented, with around $50 million in savings in 2024, which is expected to increase to around $100 million in 2025. Total accrual for capacity alignment in 2023 amounted to $218 million. We do not expect to announce further major reduction initiative details. Further reduction of global headcount as part of the structural initiative will be through minor actions and natural attrition with limited accruals. At the end of 2023, around 75% of the planned indirect reductions were detailed and announced. We already see positive impact on direct labor efficiency as a result.
The UAW strike had only a limited impact on our sales and profitability in the fourth quarter.
This report includes content supplied by S&P Global; Copyright © Light Vehicle Production Forecast, October 2023 and January 2024. All rights reserved.
4
|
Financial Report October - December 2023 |
Key Performance Trends
|
|
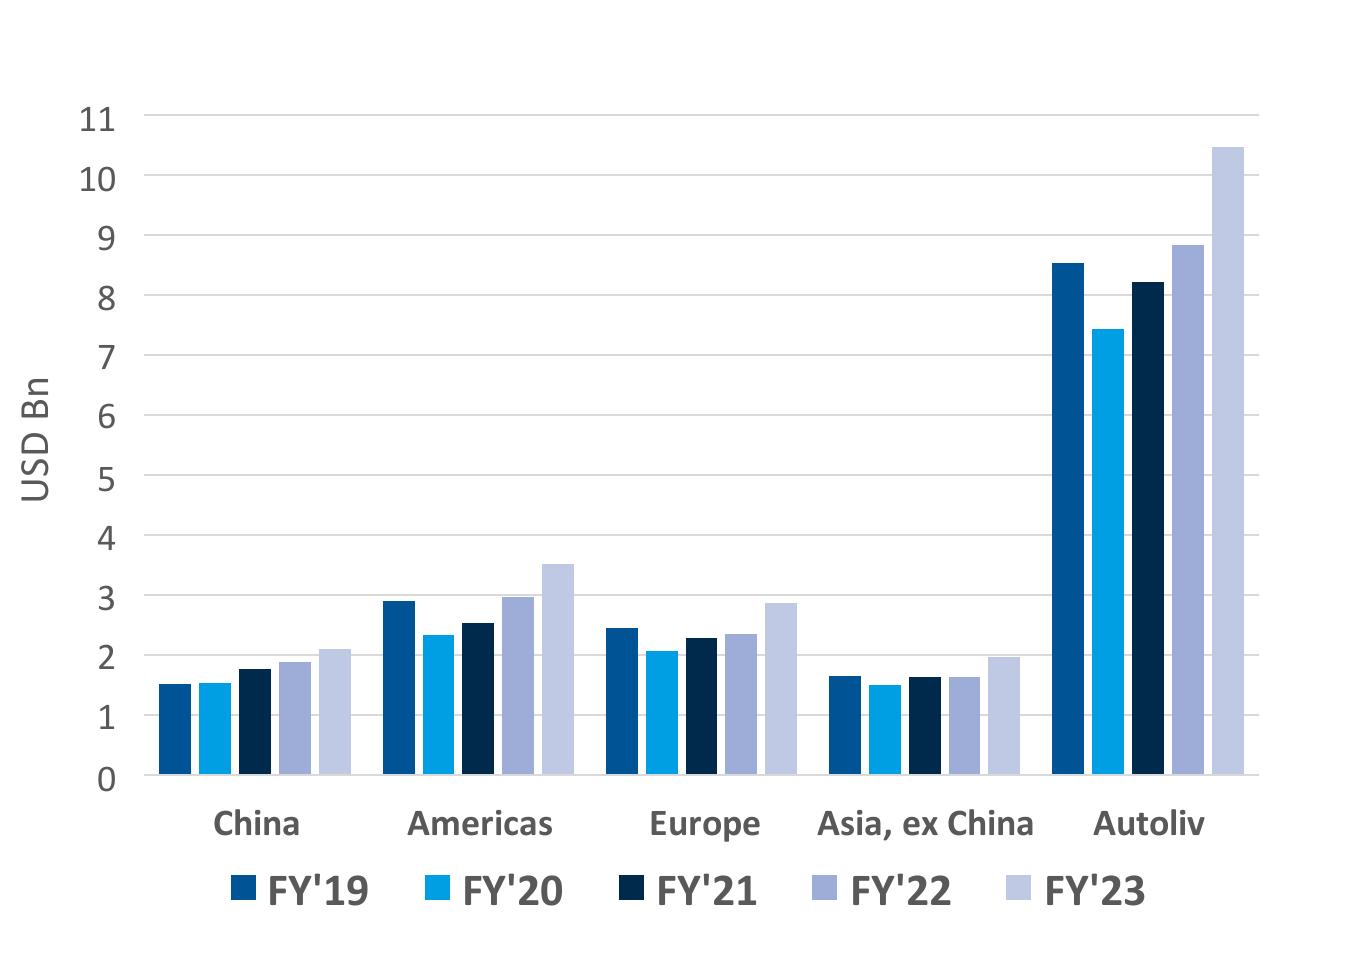
Net Sales Development by region |
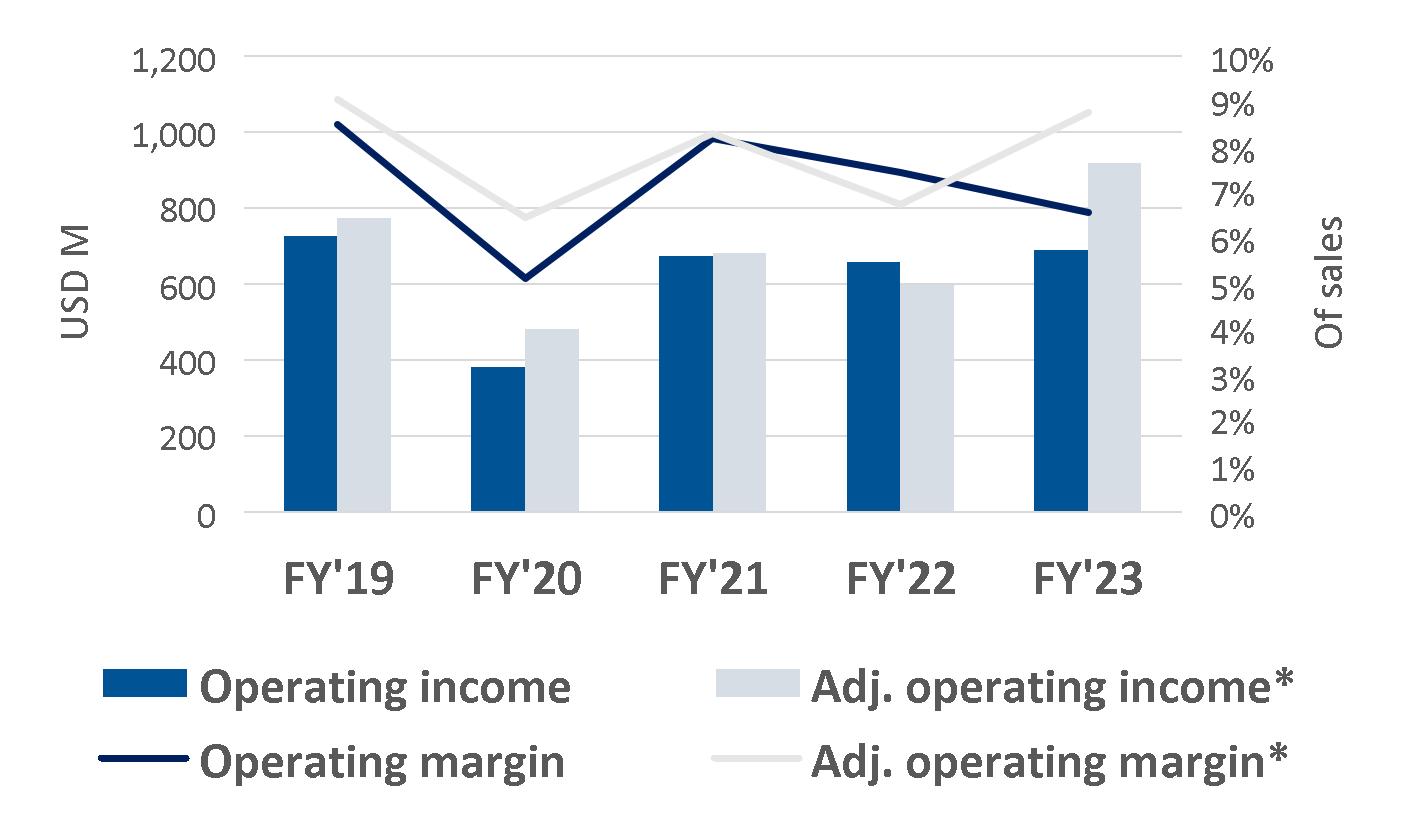
Operating and adjusted operating income and margins |
|
|
|
|
|
|
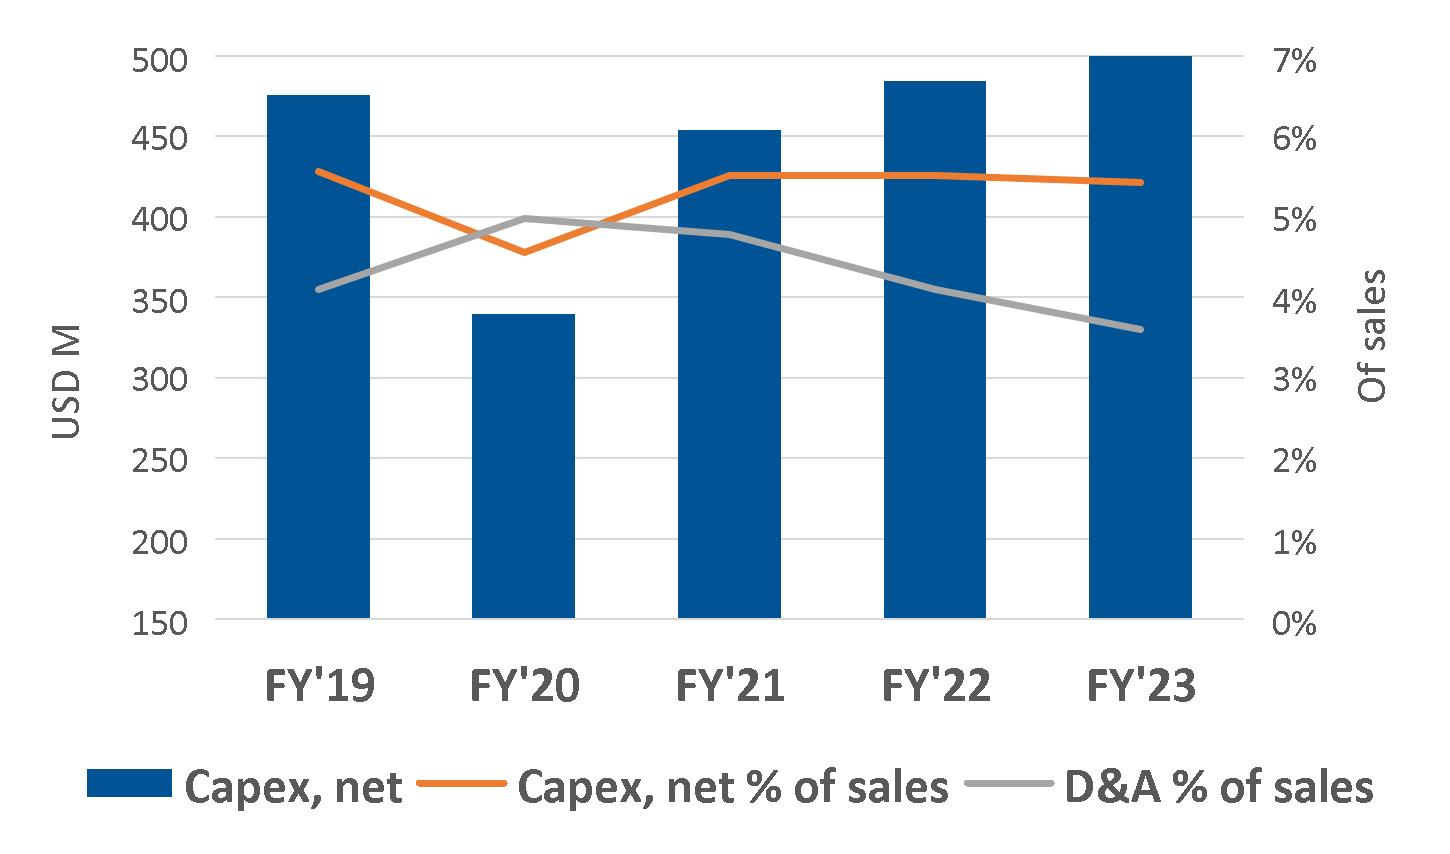
Capex and D&A |
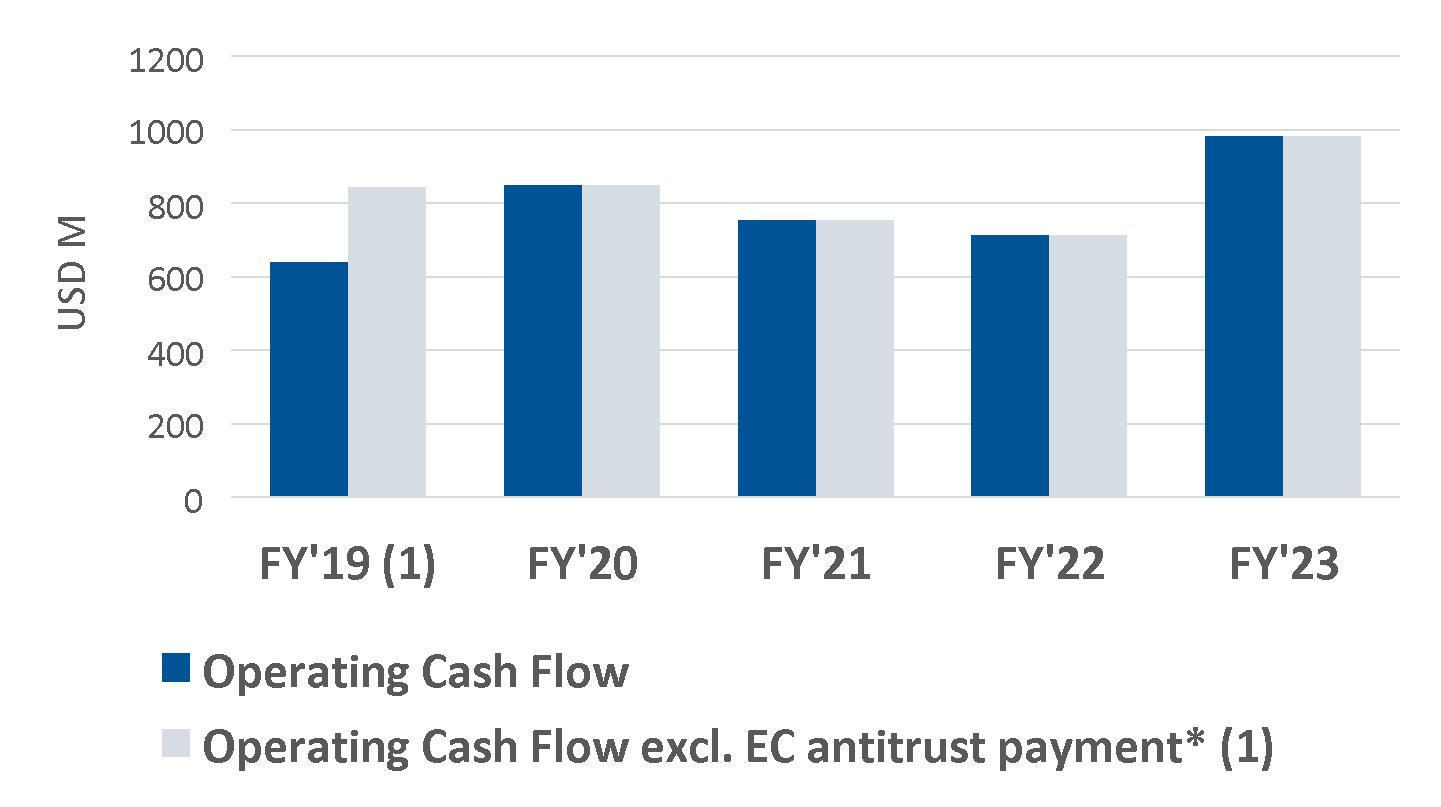
Operating and adjusted operating Cash Flow |
|
|
|
|
|
|
Return on Capital Employed |
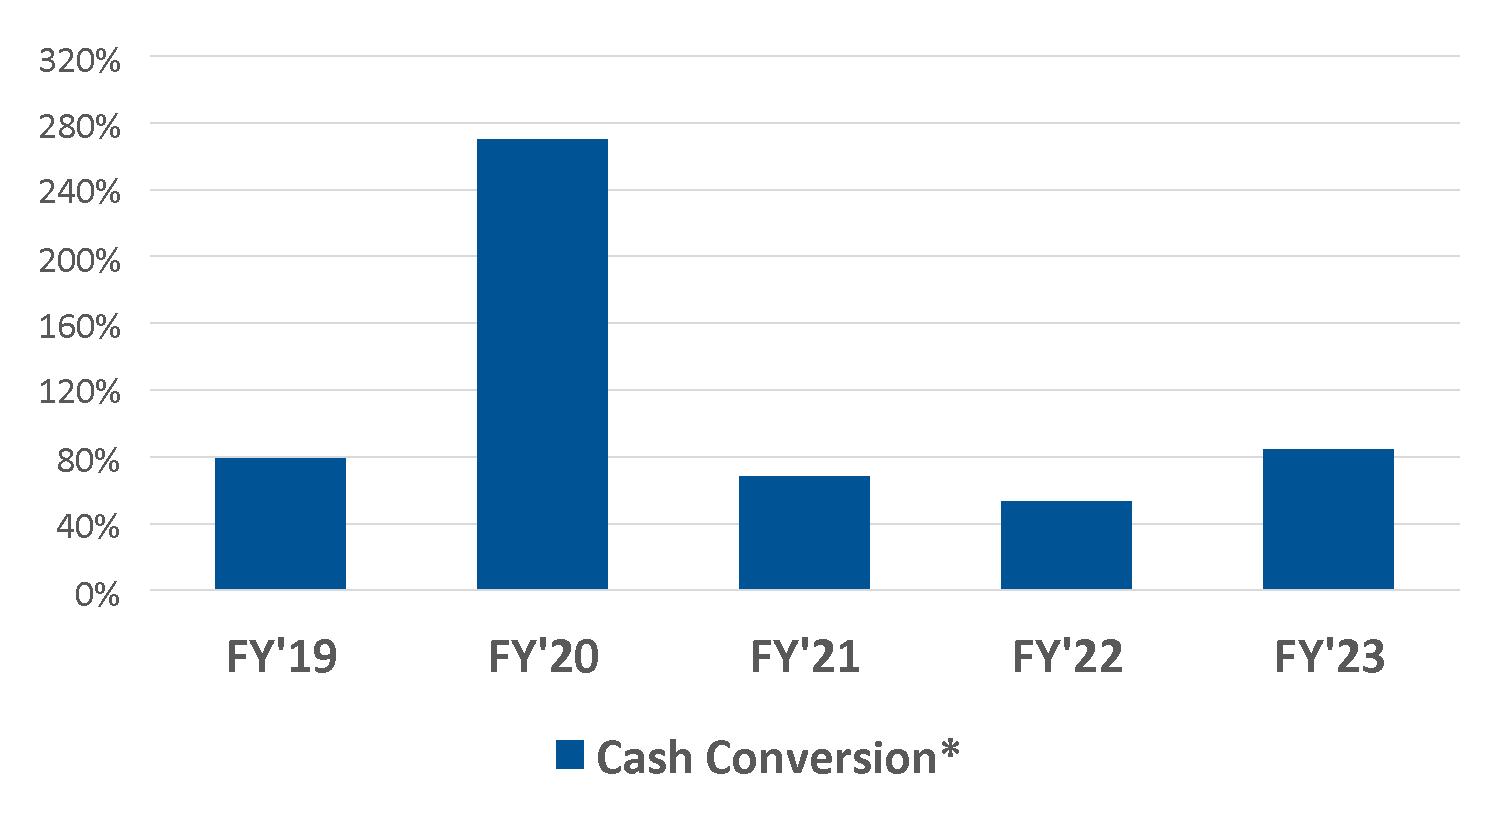
Cash Conversion |
|
|
|
|
Key definitions ------------------------------------------------------------------------------------------------------------
|
|
|
Capex, net: Capital Expenditure, net. D&A: Depreciation and Amortization. Adj. operating income and margin*: Operating income adjusted for capacity alignments, antitrust related matters and for FY 2023 the Andrews litigation settlement. Capacity alignments include non-recurring costs related to our structural efficiency and business cycle management programs |
|
Operating cash flow excluding EC antitrust payment*: Adjusted for EC antitrust payment of $203 million in 2019. Cash conversion*: Free cash flow* in relation to net income adjusted for EC antitrust payment in 2019. Free cash flow defined as operating cash flow less capital expenditure, net. |
5
|
Financial Report October - December 2023 |
Consolidated sales development
Fourth quarter 2023
|
|
|
|
|
|
|
Consolidated sales |
|
Fourth quarter |
Reported change |
Currency |
Organic |
(Dollars in millions) |
|
2023 |
2022 |
(U.S. GAAP) |
effects1) |
change* |
Airbags, Steering Wheels and Other2) |
|
$1,864 |
$1,581 |
18% |
1.9% |
16% |
Seatbelt Products and Other2) |
|
887 |
754 |
18% |
2.7% |
15% |
Total |
|
$2,751 |
$2,335 |
18% |
2.2% |
16% |
|
|
|
|
|
|
|
Asia |
|
$1,135 |
$977 |
16% |
(1.4)% |
18% |
Whereof: |
China |
617 |
536 |
15% |
(1.5)% |
17% |
|
Asia excl. China |
519 |
441 |
18% |
(1.4)% |
19% |
Americas |
|
861 |
742 |
16% |
3.4% |
13% |
Europe |
|
755 |
616 |
23% |
6.4% |
16% |
Total |
|
$2,751 |
$2,335 |
18% |
2.2% |
16% |
1) Effects from currency translations. 2) Including Corporate sales. |
|
|
|
Sales by product – Airbags, Steering Wheels and Other Sales for all major product categories increased organically* in the quarter. The largest contributor to the increase was steering wheels, followed by inflatable curtains, side airbags, and passenger airbags. |
|
Sales by product - Seatbelt Products and Other Sales for Seatbelt Products and Other increased organically* in all major regions in the quarter. The largest contributor to the increase was the Americas, followed by Asia excluding China, China and Europe. |
|
|
|
Sales by region Our global organic sales* increased by 16% compared to the global LVP increase of 9.1% (according to S&P Global, January 2024). The 7pp outperformance was mainly driven by price increases and new product launches. |
|
Autoliv organic sales growth outperformed LVP growth by 17pp in Asia excluding China, by 10pp in Europe and by 8pp in the Americas, while we underperformed LVP by around 2pp in China due to adverse LVP mix in the quarter as LVP growth in China was heavily tilted to domestic OEMs with typically lower safety content. |
|
|
|
|
|
|
Q4 2023 organic growth* |
Americas |
Europe |
China |
Asia excl. China |
Global |
Autoliv |
13% |
16% |
17% |
19% |
16% |
Main growth drivers |
Honda, Mercedes, Toyota |
Mercedes, Stellantis, BMW |
Honda, VW, Great Wall |
Toyota, Hyundai, Honda |
Honda, Mercedes, Toyota |
Main decline drivers |
GM, Stellantis, BMW |
Renault, VW |
BMW, Renault, Hyundai |
Renault, Nissan |
Renault |
Light vehicle production development
Change vs same period last year according to S&P Global
|
|
|
|
|
|
Q4 2023 |
Americas |
Europe |
China |
Asia excl. China |
Global |
LVP (Jan 2024) |
4.2% |
6.6% |
18 % |
2.5% |
9.1% |
LVP (Oct 2023) |
(5.6)% |
6.2% |
6.8% |
3.1% |
3.6% |
6
|
Financial Report October - December 2023 |
Consolidated sales development
Full year 2023
|
|
|
|
|
|
|
Consolidated sales |
|
Full year |
Reported change |
Currency |
Organic |
(Dollars in millions) |
|
2023 |
2022 |
(U.S. GAAP) |
effects1) |
change* |
Airbags, Steering Wheels and Other2) |
|
$7,055 |
$5,807 |
21% |
0.1% |
21% |
Seatbelt Products and Other2) |
|
3,420 |
3,035 |
13% |
0.7% |
12% |
Total |
|
$10,475 |
$8,842 |
18% |
0.3% |
18% |
|
|
|
|
|
|
|
Asia |
|
$4,072 |
$3,521 |
16% |
(4.3)% |
20% |
Whereof: |
China |
2,105 |
1,883 |
12% |
(4.8)% |
17% |
|
Asia excl. China |
1,968 |
1,638 |
20% |
(3.8)% |
24% |
Americas |
|
3,526 |
2,967 |
19% |
3.5% |
15% |
Europe |
|
2,877 |
2,355 |
22% |
3.1% |
19% |
Total |
|
$10,475 |
$8,842 |
18% |
0.3% |
18% |
1) Effects from currency translations. 2) Including Corporate sales. |
|
|
|
Sales by product – Airbags, Steering Wheels and Other Sales for all major product categories increased organically* for the full year. The largest contributor to the increase was steering wheels and inflatable curtains, followed by side airbags and passenger airbags. |
|
Sales by product – Seatbelt Products and Other Sales for seatbelt products and other increased organically* in all major regions for the full year. The main contributor to organic sales growth* was Europe, followed by Asia excluding China, the Americas and China. |
|
|
|
|
Sales by region Our global organic sales* increased by 18% compared to the global LVP increase of 9.4% (according to S&P Global, January 2024). The 9pp outperformance was mainly driven by new product launches and price increases. |
|
Autoliv outperformed LVP by around 15pp in Asia excluding China, by 8pp in China, by 7pp in Europe and 7pp in the Americas. |
|
|
|
|
|
|
FY 2023 organic growth* |
Americas |
Europe |
China |
Asia excl. China |
Global |
Autoliv |
15% |
19% |
17% |
24% |
18% |
Main growth drivers |
Honda, Nissan, Mercedes |
Stellantis, VW, Mercedes |
Honda, Great Wall, Mercedes |
Toyota, Hyundai, Subaru |
Honda, Toyota, Mercedes |
Main decline drivers |
Ford, BMW, Renault |
Mitsubishi |
Nissan, Renault, BMW |
Renault |
Ford |
Light vehicle production development
Change vs same period last year according to S&P Global
|
|
|
|
|
|
Full year 2023 |
Americas |
Europe |
China |
Asia excl. China |
Global |
LVP (Jan 2024) |
8.7% |
13% |
9.1% |
8.6% |
9.4% |
LVP (Jan 2023) |
5.6% |
5.3% |
0.5% |
4.0% |
3.5% |
7
|
Financial Report October - December 2023 |
Key launches in the fourth quarter 2023
|
|
|
|
|
|
Zeekr 007  |
|
Zeekr 001 FR  |
|
Lynk & Co 08 |
|

|
|

|
|

|
|
     |
|
    |
|
    |
|
|
|
|
|
|
|
Suzuki Swift |
|
Xpeng X9 |
|
Mini Countryman |
|

|
|

|
|

|
|
 |
|
     |
|
|
|
|
|
|
|
|
|
Lexus GX |
|
Polestar 4  |
|
Toyota Century |
|

|
|

|
|

|
|
  |
|
 |
|
  |
|
|
|
|
|
|
|
|
|

|
Driver/Passenger Airbags |

|
Seatbelts |

|
Side Airbags |
|

|
Head/Inflatable Curtain Airbags |

|
Steering Wheel |

|
Knee Airbag |
|

|
Front Center Airbag |

|
Bag-in-Belt |

|
Pyrotechnical Safety Switch |
|

|
Pedestrian Airbag |

|
Hood Lifter |

|
Available as EV/PHEV |
8
|
Financial Report October - December 2023 |
Financial development
Selected Income Statement items
|
|
|
|
|
|
|
|
Condensed income statement |
Fourth quarter |
|
Full year |
(Dollars in millions, except per share data) |
2023 |
2022 |
Change |
|
2023 |
2022 |
Change |
Net sales |
$2,751 |
$2,335 |
18% |
|
$10,475 |
$8,842 |
18% |
Cost of sales |
(2,221) |
(1,937) |
15% |
|
(8,654) |
(7,446) |
16% |
Gross profit |
530 |
399 |
33% |
|
1,822 |
1,396 |
30% |
S,G&A |
(119) |
(105) |
14% |
|
(498) |
(437) |
14% |
R,D&E, net |
(81) |
(65) |
24% |
|
(425) |
(390) |
8.8% |
Amortization of intangibles |
(1) |
(0) |
29% |
|
(2) |
(3) |
(24)% |
Other income (expense), net |
(92) |
2 |
n/a |
|
(207) |
93 |
n/a |
Operating income |
237 |
230 |
3.1% |
|
690 |
659 |
4.7% |
Adjusted operating income1) |
334 |
233 |
43% |
|
920 |
598 |
54% |
Financial and non-operating items, net |
(18) |
(16) |
9.3% |
|
(77) |
(56) |
39% |
Income before taxes |
219 |
214 |
2.7% |
|
612 |
603 |
1.5% |
Income taxes |
8 |
(57) |
n/a |
|
(123) |
(178) |
(31)% |
Net income |
$227 |
$156 |
45% |
|
$489 |
$425 |
15% |
Earnings per share2) |
$2.71 |
$1.80 |
51% |
|
$5.72 |
$4.85 |
18% |
Adjusted earnings per share1,2) |
$3.74 |
$1.83 |
105% |
|
$8.19 |
$4.40 |
86% |
|
|
|
|
|
|
|
|
Gross margin |
19.3% |
17.1% |
2.2pp |
|
17.4% |
15.8% |
1.6pp |
S,G&A, in relation to sales |
(4.3)% |
(4.5)% |
0.2pp |
|
(4.8)% |
(4.9)% |
0.2pp |
R,D&E, net in relation to sales |
(3.0)% |
(2.8)% |
(0.2)pp |
|
(4.1)% |
(4.4)% |
0.4pp |
Operating margin |
8.6% |
9.8% |
(1.2)pp |
|
6.6% |
7.5% |
(0.9)pp |
Adjusted operating margin1) |
12.1% |
10.0% |
2.2pp |
|
8.8% |
6.8% |
2.0pp |
Tax Rate |
(3.7)% |
26.8% |
(30.4)pp |
|
20.1% |
29.5% |
(9.4)pp |
|
|
|
|
|
|
|
|
Other data |
|
|
|
|
|
|
|
No. of shares at period-end in millions3) |
82.6 |
86.2 |
(4.1)% |
|
82.6 |
86.2 |
(4.1)% |
Weighted average no. of shares in millions4) |
83.5 |
86.5 |
(3.5)% |
|
85.0 |
87.1 |
(2.4)% |
Weighted average no. of shares in millions, diluted4) |
83.7 |
86.7 |
(3.4)% |
|
85.2 |
87.2 |
(2.3)% |
1) Non-U.S. GAAP measure, excluding effects from capacity alignments, antitrust related matters and for FY 2023 the Andrews litigation settlement. See reconciliation table. 2) Assuming dilution when applicable and net of treasury shares. 3) Excluding dilution and net of treasury shares. 4) Net of treasury shares. |
|
|
|
Fourth quarter 2023 development Gross profit increased by $132 million, and the gross margin increased by 2.2pp compared to the same quarter 2022. The gross profit increase was primarily driven by price increases, volume growth, lower costs for material and premium freight. This was partly offset by increased costs for personnel related to volume growth and wage inflation. S,G&A costs increased by $14 million compared to the prior year, mainly due to increased costs for personnel as well as adverse FX translation effects. S,G&A costs in relation to sales decreased from 4.5% to 4.3%. R,D&E, net costs increased by $16 million compared to the prior year, mainly due to lower engineering income and higher costs for personnel. R,D&E, net, in relation to sales increased from 2.8% to 3.0%. Other income (expense), net was negative $92 million compared to positive $2 million in the same period last year. The difference was mainly related to higher capacity alignment accruals in Q4 2023. Operating income increased by $7 million compared to the same period in 2022, mainly due to the increase in gross profit, partly offset by higher costs for S,G&A and higher capacity alignment accruals. |
|
Adjusted operating income* increased by $101 million compared to the prior year, mainly due to higher gross profit, partly offset by the higher costs for R,D&E, net and S,G&A. Financial and non-operating items, net, was negative $18 million compared to negative $16 million a year earlier. The difference was mainly due to increased interest expense as an effect of higher debt and higher interest rates. Income before taxes increased by $6 million compared to the prior year, mainly due to the increase in operating income, partly offset by larger Financial and non-operating items, net. Tax rate was positive 3.7% compared to negative 26.8% in the same period last year. Discrete tax items, net, decreased the tax rate this quarter by 47.2pp. The decrease is mainly related to a net deferred tax asset recognized in the fourth quarter due to the transfer of certain assets and operations as part of restructuring activities. Discrete tax items increased the tax rate by 9.1pp in the same period last year. Earnings per share, diluted increased by $0.91 compared to a year earlier. The main drivers were $1.09 from lower income taxes and $0.75 from higher adjusted operating income, partly offset by $1.01 from higher capacity alignment accruals. |
9
|
Financial Report October - December 2023 |
|
|
|
Full year 2023 development Gross profit increased by $425 million, and the gross margin increased by 1.6pp compared to the prior year. The gross profit increase was primarily driven by price increases, volume growth and lower costs for premium freight. This was partly offset by increased costs for personnel related to higher volumes and wage inflation as well as higher costs for energy. S,G&A costs increased by $61 million compared to the prior year, mainly due to increased costs for personnel and projects. S,G&A costs in relation to sales decreased from 4.9 % to 4.8%. R,D&E, net costs increased by around $35 million compared to the prior year, mainly due to higher costs for personnel and lower engineering income. R,D&E, net, in relation to sales decreased from 4.4% to 4.1%. Other income (expense), net was negative $207 million compared to positive $93 million in the prior year. The prior year was positively impacted by around an $80 million gain from the sale of a property in Japan and around $20 million from a patent litigation settlement, partly offset by around $10 million in capacity alignment provisions for the closure of a plant in South Korea while 2023 was negatively impacted by around $218 million in accrual for capacity alignment. Operating income increased by $31 million compared to the prior year, mainly due to higher gross profit, partly offset by the changes in Other income (expense), net and the higher costs for S,G&A and R,D&E, net. |
|
Adjusted operating income* increased by $322 million compared to the prior year, mainly due to higher gross profit, partly offset by the higher costs for S,G&A and R,D&E, net. Financial and non-operating items, net, was negative $77 million compared to negative $56 million a year earlier, mainly due to increased interest expense as an effect of higher debt and higher interest rates. Income before taxes increased by $9 million compared to the prior year, mainly due to the higher operating income partly offset by the increased interest expense. Tax rate was 20.1% compared to 29.5% last year. Discrete tax items, net, decreased the tax rate this year by 17.3pp. The decrease is mainly related to a net deferred tax asset recognized in the fourth quarter due to the transfer of certain assets and operations as part of restructuring activities. Discrete tax items, net decreased the tax rate last year by 2.5pp. Earnings per share, diluted increased by $0.87 compared to a year earlier. The main drivers behind the increase were $2.51 from higher adjusted operating income and $1.31 from lower income taxes, partly offset by $2.91 from higher capacity alignment accruals and $0.18 from financial items. |
10
|
Financial Report October - December 2023 |
Selected Balance Sheet and Cash Flow items
|
|
|
|
Selected Balance Sheet items |
Fourth quarter |
(Dollars in millions) |
2023 |
2022 |
Change |
Trade working capital1) |
$1,232 |
$1,183 |
4.2% |
Trade working capital in relation to sales2) |
11.2% |
12.7% |
(1.5)pp |
- Receivables outstanding in relation to sales3) |
20.0% |
20.4% |
(0.4)pp |
- Inventory outstanding in relation to sales4) |
9.2% |
10.4% |
(1.2)pp |
- Payables outstanding in relation to sales5) |
18.0% |
18.1% |
(0.2)pp |
Cash & cash equivalents |
498 |
594 |
(16)% |
Gross Debt6) |
1,862 |
1,766 |
5.5% |
Net Debt7) |
1,367 |
1,184 |
16% |
Capital employed8) |
3,937 |
3,810 |
3.3% |
Return on capital employed9) |
24.4% |
24.3% |
0.1pp |
Total equity |
$2,570 |
$2,626 |
(2.1)% |
Return on total equity10) |
36.0% |
24.5% |
11.5pp |
Leverage ratio11) |
1.2 |
1.4 |
(0.2)pp |
1) Outstanding receivables and outstanding inventory less outstanding payables. 2) Outstanding receivables and outstanding inventory less outstanding payables relative to annualized quarterly sales. 3) Outstanding receivables relative to annualized quarterly sales. 4) Outstanding inventory relative to annualized quarterly sales. 5) Outstanding payables relative to annualized quarterly sales. 6) Short- and long-term interest-bearing debt. 7) Short- and long-term debt less cash and cash equivalents and debt-related derivatives. Non-U.S. GAAP measure. See reconciliation table. 8) Total equity and net debt. 9) Annualized operating income and income from equity method investments, relative to average capital employed. 10) Annualized net income relative to average total equity. 11) Net debt adjusted for pension liabilities in relation to EBITDA. Non-U.S. GAAP measure. See reconciliation table. |
|
|
|
|
|
|
|
Selected Cash Flow items |
Fourth quarter |
Full year |
(Dollars in millions) |
2023 |
2022 |
Change |
2023 |
2022 |
Change |
Net income |
$227 |
$156 |
45% |
$489 |
$425 |
15% |
Changes in operating working capital |
243 |
226 |
7.4% |
235 |
58 |
303% |
Depreciation and amortization |
97 |
90 |
7.7% |
378 |
363 |
4.1% |
Gain on divestiture of property |
- |
- |
- |
- |
(80) |
(100)% |
Other, net |
(120) |
(10) |
n/a |
(119) |
(54) |
123% |
Operating cash flow |
447 |
462 |
(3.4)% |
982 |
713 |
38% |
Capital expenditure, net |
(150) |
(165) |
(9.4)% |
(569) |
(485) |
17% |
Free cash flow1) |
$297 |
$297 |
(0.0)% |
$414 |
$228 |
81% |
Cash conversion2) |
131% |
190% |
(59.2)pp |
85% |
54% |
30.9pp |
Shareholder returns |
|
|
|
|
|
|
- Dividends paid |
(57) |
(57) |
(0.6)% |
(225) |
(224) |
0.4% |
- Share repurchases |
(150) |
(55) |
173% |
(352) |
(115) |
206% |
Cash dividend paid per share |
$(0.68) |
$(0.66) |
3.0% |
$(2.66) |
$(2.58) |
3.3% |
Capital expenditures, net in relation to sales |
5.4% |
7.1% |
(1.6)pp |
5.4% |
5.5% |
(0.1)pp |
1) Operating cash flow less Capital expenditure, net. Non-U.S. GAAP measure. See enclosed reconciliation table. 2) Free cash flow relative to Net income. Non-U.S. GAAP measure. See reconciliation table. |
|
|
|
Fourth quarter 2023 development Other, net was $120 million negative in the fourth quarter 2023 and $119 million negative for the full year 2023, mainly related to a net deferred tax asset recognized in the fourth quarter due to the transfer of certain assets and operations as part of restructuring activities. Operating cash flow decreased by $15 million to $447 million compared to the same period last year, mainly due to that higher net income was more than offset by increased deferred taxes. Capital expenditure, net decreased by $15 million compared to the same period the previous year. Capital expenditure, net in relation to sales was 5.4% versus 7.1% a year earlier. |
|
Free cash flow* was $297 million, unchanged compared to the same period prior year. Cash conversion* defined as free cash flow* in relation to net income, was 131% in the period. |
11
|
Financial Report October - December 2023 |
|
|
|
Full year 2023 development Trade working capital* increased by $49 million compared to the same period last year, where the main drivers were $291 million in higher receivables and $43 million in higher inventories, partly offset by $284 million in higher accounts payable. In relation to sales, trade working capital decreased from 12.7% to 11.2%. Operating cash flow increased by $269 million, compared to the same period last year, to $982 million, mainly due to higher adjusted operating income and more positive working capital effects. Capital expenditure, net increased by $84 million, mainly due to the impact on the prior year of $95 million from the sale of property, plant and equipment in Japan. Capital expenditure, net in relation to sales was 5.4% versus 5.5% for the prior year period. Free cash flow* was $414 million, compared to $228 million in the same period last year. The improvement was due to the higher operating cash flow partly offset by higher capital expenditure, net. |
|
Cash conversion* defined as free cash flow* in relation to net income, was 85% in the period. Net debt* was $1,367 million as of December 31, 2023, which was $184 million higher than a year earlier. Leverage ratio*. As of December 31, 2023, the Company had a leverage ratio of 1.2x compared to 1.4x as of December 31, 2022, as the 12 months trailing adjusted EBITDA* increased more than the net debt* increased. Liquidity position. As of December 31, 2023, our cash balance was around $0.5 billion, and including committed, unused loan facilities, our liquidity position was around $1.6 billion. Total equity as of December 31, 2023, decreased by $56 million compared to December 31, 2022. This was mainly due to $226 million in dividend payments and stock repurchases including taxes of $356 million, partly offset by $489 million from net income and $20 million in positive currency translation effects. |
Headcount
|
|
|
|
|
Dec 31 |
Sep 30 |
Dec 31 |
|
2023 |
2023 |
2022 |
Headcount |
70,300 |
71,200 |
69,100 |
Whereof: Direct headcount in manufacturing |
52,400 |
52,900 |
50,600 |
Indirect headcount |
17,800 |
18,200 |
18,400 |
Temporary personnel |
11% |
11% |
11% |
|
|
|
At December 31, 2023, total headcount (Full Time Equivalent) increased by 1,200 compared to a year earlier. The indirect workforce decreased by 600, or by 3%, reflecting our structural reduction initiatives. The direct workforce increased by 4%, reflecting that sales grew organically by 18% in 2023 compared to a year earlier. |
|
Compared to September 30, 2023, total headcount (FTE) decreased 1%. Indirect headcount decreased by 400, or by 2% while direct headcount decreased by 500, or by 1%. |
12
|
Financial Report October - December 2023 |
|
|
|
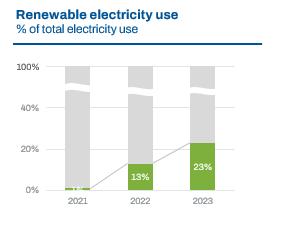
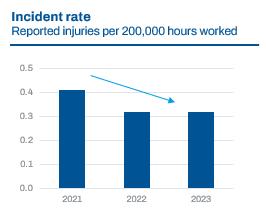
2023 Sustainability Development Sustainability is an integral part of our business strategy and a an important driver for market differentiation and stakeholder value creation. Our sustainability approach is based on four focus areas, with broad ambitions and more specific short-term targets defined for each area. We are a signatory of the UN Global Compact and our work and policies, such as our Code of Conduct, are aligned with international frameworks such as the ILO core conventions and the OECD Guidelines. 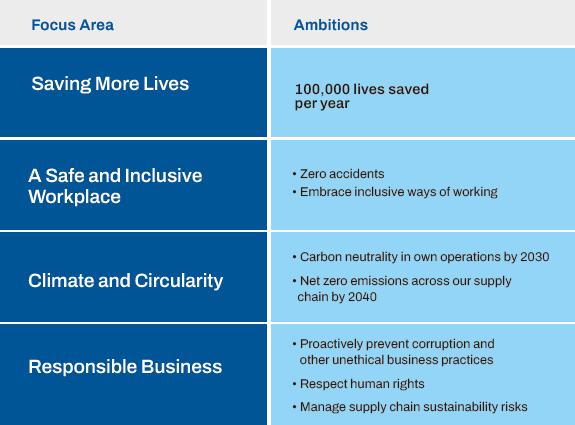
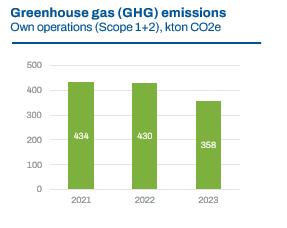
In 2023, our sustainability agenda continued to yield results. Highlighting our core business of Saving More Lives, we are pioneering the emerging area of equity in vehicle safety by broadening test models to include more body shapes and parameters such as age and gender. Within health and safety, we saw continued improvement on our KPIs. Focus during the year continued to be on addressing high-risk areas, where we have global standards and extensive training in place. Renewable electricity and GHG emissions: Despite an increase in total energy consumption as a result of increased production, our efforts in particular in increasing renewable electricity use and SF6 phase-out combined with revised emission factors lead to a 17% decrease in GHG emissions from own operations(Scope 1+2). Also this year we carried out a climate survey to a large number of direct material suppliers, to better understand their readiness to meet our requirements and contribute to meeting Autoliv’s net-zero climate ambitions. Low carbon material: Work continued to assess and increase the use of low-carbon materials in our products. As an example, we made strong progress in increasing the share of recycled magnesium. Corporate compliance and integrity: We launched a number of internal e-learning programs targeted at emphasizing our policies and practices, and further improving the skills of those working in areas with elevated risk. |
|
|
13
|
Financial Report October - December 2023 |
Other Items
|
|
|
•On October 30, 2023, Autoliv announced an update on its ongoing initiatives to reduce its global headcount, to include a downsizing of about 20%, or 320, of its employees in France. •On January 16, 2024, Autoliv announced upcoming changes to the general terms and conditions, ISIN code and Withholding Agent for the Swedish Depository Receipts. The SDRs will receive a new ISIN code as of February 29, 2024, with updated terms and conditions. Skandinaviska Enskilda Banken (SEB) will assume the role as Withholding Agent in its capacity as issuer of Autoliv SDRs. As of the date the new ISIN is effective, it will no longer be possible to hold Autoliv SDRs as owner registered holdings in a CSD account (Swedish: VP konto) with Euroclear Sweden. Such owner registered holdings in CSD accounts must be transferred to a custody account with a bank, or securities institution, which holds the role as nominee in Euroclear Sweden prior to February 29, 2024. If they are not transferred, such Autoliv SDRs will automatically be converted to Autoliv Common Stock which is denominated in U.S. dollars and traded on the New York Stock Exchange. |
|
•In Q4 2023, Autoliv repurchased and retired 1.51 million shares of common stock at an average price of $99.21 per share under the Autoliv 2022-2024 stock purchase program. •The Company set May 10, 2024 as the date for its 2024 annual meeting of stockholders. The meeting will be a hybrid meeting, conducted virtually and in-person in the Detroit metropolitan area. Only the stockholders of record at the close of business on March 15, 2024 will be entitled to be present and vote at the meeting. |
|
|
|
Next Report Autoliv intends to publish the quarterly earnings report for the first quarter of 2024 on Friday, April 26, 2024. |
|
Footnotes *Non-U.S. GAAP measure, see enclosed reconciliation tables. |
Inquiries: Investors and Analysts Anders Trapp Vice President Investor Relations Tel +46 (0)8 5872 0671 Henrik Kaar Director Investor Relations Tel +46 (0)8 5872 0614 Inquiries: Media Gabriella Etemad Senior Vice President Communications Tel +46 (0)70 612 6424 Autoliv, Inc. is obliged to make this information public pursuant to the EU Market Abuse Regulation. The information was submitted for publication, through the agency of the VP of Investor Relations set out above, at 12.00 CET on January 26, 2024. |
Definitions and SEC Filings Please refer to www.autoliv.com or to our Annual Report for definitions of terms used in this report. Autoliv’s annual report to stockholders, annual report on Form 10-K, quarterly reports on Form 10Q, proxy statements, management certifications, press releases, current reports on Form 8-K and other documents filed with the SEC can be obtained free of charge from Autoliv at the Company’s address. These documents are also available at the SEC’s website www.sec.gov and at Autoliv’s corporate website www.autoliv.com. This report includes content supplied by S&P Global; Copyright © Light Vehicle Production Forecast, October 2023 and January 2024. All rights reserved. S&P Global is a global supplier of independent industry information. The permission to use S&P Global copyrighted reports, data and information does not constitute an endorsement or approval by S&P Global of the manner, format, context, content, conclusion, opinion or viewpoint in which S&P Global reports, data and information or its derivations are used or referenced herein. |
14
|
Financial Report October - December 2023 |
“Safe Harbor Statement”
|
|
|
This report contains statements that are not historical facts but rather forward-looking statements within the meaning of the Private Securities Litigation Reform Act of 1995. Such forward-looking statements include those that address activities, events or developments that Autoliv, Inc. or its management believes or anticipates may occur in the future. All forward-looking statements are based upon our current expectations, various assumptions and/or data available from third parties. Our expectations and assumptions are expressed in good faith and we believe there is a reasonable basis for them. However, there can be no assurance that such forward-looking statements will materialize or prove to be correct as forward-looking statements are inherently subject to known and unknown risks, uncertainties and other factors which may cause actual future results, performance or achievements to differ materially from the future results, performance or achievements expressed in or implied by such forward-looking statements. In some cases, you can identify these statements by forward-looking words such as “estimates”, “expects”, “anticipates”, “projects”, “plans”, “intends”, “believes”, “may”, “likely”, “might”, “would”, “should”, “could”, or the negative of these terms and other comparable terminology, although not all forward-looking statements contain such words. Because these forward-looking statements involve risks and uncertainties, the outcome could differ materially from those set out in the forward-looking statements for a variety of reasons, including without limitation, general economic conditions, including inflation; changes in light vehicle production; fluctuation in vehicle production schedules for which the Company is a supplier; global supply chain disruptions, including port, transportation and distribution delays or interruptions; supply chain disruptions and component shortages specific to the automotive industry or the Company; disruptions and impacts relating to the ongoing war between Russia and Ukraine and the Red Sea crisis; changes in general industry and market conditions or regional growth or decline; changes in and the successful execution of our capacity alignment, restructuring, cost reduction and efficiency initiatives and the market reaction thereto; loss of business from increased competition; higher raw material, fuel and energy costs; changes in consumer and customer preferences for end products; customer losses; changes in |
|
regulatory conditions; customer bankruptcies, consolidations, or restructuring or divestiture of customer brands; unfavorable fluctuations in currencies or interest rates among the various jurisdictions in which we operate; market acceptance of our new products; costs or difficulties related to the integration of any new or acquired businesses and technologies; continued uncertainty in pricing and other negotiations with customers; successful integration of acquisitions and operations of joint ventures; successful implementation of strategic partnerships and collaborations; our ability to be awarded new business; product liability, warranty and recall claims and investigations and other litigation, civil judgments or financial penalties and customer reactions thereto; higher expenses for our pension and other postretirement benefits, including higher funding needs for our pension plans; work stoppages or other labor issues; possible adverse results of pending or future litigation or infringement claims and the availability of insurance with respect to such matters; our ability to protect our intellectual property rights; negative impacts of antitrust investigations or other governmental investigations and associated litigation relating to the conduct of our business; tax assessments by governmental authorities and changes in our effective tax rate; dependence on key personnel; legislative or regulatory changes impacting or limiting our business; our ability to meet our sustainability targets, goals and commitments; political conditions; dependence on and relationships with customers and suppliers; the conditions necessary to hit our medium term financial targets; and other risks and uncertainties identified under the headings “Risk Factors” and “Management’s Discussion and Analysis of Financial Condition and Results of Operations” in our Annual Reports and Quarterly Reports on Forms 10-K and 10-Q and any amendments thereto. For any forward-looking statements contained in this or any other document, we claim the protection of the safe harbor for forward-looking statements contained in the Private Securities Litigation Reform Act of 1995, and we assume no obligation to update publicly or revise any forward-looking statements in light of new information or future events, except as required by law. |
15
|
Financial Report October - December 2023 |
Consolidated Statements of Income
|
|
|
|
|
|
|
Fourth quarter |
|
Full year |
(Dollars in millions, except per share data, unaudited) |
2023 |
2022 |
|
2023 |
2022 |
Airbags, Steering Wheels and Other1) |
$1,864 |
$1,581 |
|
$7,055 |
$5,807 |
Seatbelt products and Other1) |
887 |
754 |
|
3,420 |
3,035 |
Total net sales |
$2,751 |
$2,335 |
|
$10,475 |
$8,842 |
|
|
|
|
|
|
Cost of sales |
(2,221) |
(1,937) |
|
(8,654) |
(7,446) |
Gross profit |
$530 |
$399 |
|
$1,822 |
$1,396 |
|
|
|
|
|
|
Selling, general & administrative expenses |
(119) |
(105) |
|
(498) |
(437) |
Research, development & engineering expenses, net |
(81) |
(65) |
|
(425) |
(390) |
Amortization of intangibles |
(1) |
(0) |
|
(2) |
(3) |
Other income (expense), net |
(92) |
2 |
|
(207) |
93 |
Operating income |
$237 |
$230 |
|
$690 |
$659 |
|
|
|
|
|
|
Income from equity method investments |
1 |
1 |
|
5 |
3 |
Interest income |
3 |
2 |
|
13 |
6 |
Interest expense |
(25) |
(19) |
|
(93) |
(60) |
Other non-operating items, net |
3 |
0 |
|
(3) |
(5) |
Income before income taxes |
$219 |
$214 |
|
$612 |
$603 |
|
|
|
|
|
|
Income taxes |
8 |
(57) |
|
(123) |
(178) |
Net income |
$227 |
$156 |
|
$489 |
$425 |
|
|
|
|
|
|
Less: Net income attributable to non-controlling interest |
0 |
0 |
|
1 |
2 |
Net income attributable to controlling interest |
$227 |
$156 |
|
$488 |
$423 |
|
|
|
|
|
|
Earnings per share2) |
$2.71 |
$1.80 |
|
$5.72 |
$4.85 |
1) Including Corporate sales. 2) Assuming dilution when applicable and net of treasury shares. |
16
|
Financial Report October - December 2023 |
Consolidated Balance Sheets
|
|
|
|
|
|
|
|
|
Dec 31 |
Sep 30 |
Jun 30 |
Mar 31 |
Dec 31 |
(Dollars in millions, unaudited) |
|
2023 |
2023 |
2023 |
2023 |
2022 |
Assets |
|
|
|
|
|
|
Cash & cash equivalents |
|
$498 |
$475 |
$475 |
$713 |
$594 |
Receivables, net |
|
2,198 |
2,179 |
2,189 |
2,106 |
1,907 |
Inventories, net |
|
1,012 |
982 |
947 |
986 |
969 |
Prepaid expenses |
|
173 |
180 |
166 |
166 |
160 |
Other current assets |
|
93 |
63 |
120 |
90 |
84 |
Total current assets |
|
$3,974 |
$3,879 |
$3,898 |
$4,061 |
$3,714 |
|
|
|
|
|
|
|
Property, plant & equipment, net |
|
2,192 |
2,067 |
2,047 |
2,045 |
1,960 |
Operating leases right-of-use assets |
|
176 |
162 |
149 |
169 |
160 |
Goodwill |
|
1,378 |
1,372 |
1,375 |
1,376 |
1,375 |
Intangible assets, net |
|
7 |
6 |
6 |
7 |
7 |
Investments and other non-current assets |
|
606 |
500 |
484 |
528 |
502 |
Total assets |
|
$8,332 |
$7,987 |
$7,959 |
$8,185 |
$7,717 |
|
|
|
|
|
|
|
Liabilities and equity |
|
|
|
|
|
|
Short-term debt |
|
538 |
590 |
481 |
577 |
711 |
Accounts payable |
|
1,978 |
1,858 |
1,844 |
1,683 |
1,693 |
Accrued expenses |
|
1,135 |
1,093 |
1,122 |
969 |
915 |
Operating lease liabilities - current |
|
39 |
37 |
35 |
41 |
39 |
Other current liabilities |
|
345 |
274 |
274 |
258 |
283 |
Total current liabilities |
|
$4,035 |
$3,851 |
$3,756 |
$3,529 |
$3,642 |
|
|
|
|
|
|
|
Long-term debt |
|
1,324 |
1,277 |
1,290 |
1,601 |
1,054 |
Pension liability |
|
159 |
152 |
152 |
159 |
154 |
Operating lease liabilities - non-current |
|
135 |
125 |
113 |
127 |
119 |
Other non-current liabilities |
|
109 |
96 |
91 |
128 |
121 |
Total non-current liabilities |
|
$1,728 |
$1,649 |
$1,645 |
$2,015 |
$1,450 |
|
|
|
|
|
|
|
Total parent shareholders’ equity |
|
2,557 |
2,473 |
2,545 |
2,627 |
2,613 |
Non-controlling interest |
|
13 |
13 |
13 |
14 |
13 |
Total equity |
|
$2,570 |
$2,486 |
$2,557 |
$2,641 |
$2,626 |
|
|
|
|
|
|
|
Total liabilities and equity |
|
$8,332 |
$7,987 |
$7,959 |
$8,185 |
$7,717 |
17
|
Financial Report October - December 2023 |
Consolidated Statements of Cash Flow
|
|
|
|
|
|
|
Fourth quarter |
|
Full year |
(Dollars in millions, unaudited) |
2023 |
2022 |
|
2023 |
2022 |
Net income |
$227 |
$156 |
|
$489 |
$425 |
Depreciation and amortization |
97 |
90 |
|
378 |
363 |
Gain on divestiture of property |
- |
- |
|
- |
(80) |
Other, net |
(120) |
(10) |
|
(119) |
(54) |
Changes in operating working capital, net |
243 |
226 |
|
235 |
58 |
Net cash provided by operating activities |
$447 |
$462 |
|
$982 |
$713 |
|
|
|
|
|
|
Expenditures for property, plant and equipment |
(152) |
(168) |
|
(572) |
(585) |
Proceeds from sale of property, plant and equipment |
3 |
2 |
|
4 |
101 |
Net cash used in investing activities |
$(150) |
$(165) |
|
$(569) |
$(485) |
|
|
|
|
|
|
Net cash before financing1) |
$297 |
$297 |
|
$414 |
$228 |
|
|
|
|
|
|
Decrease (increase) in short term debt |
(54) |
(25) |
|
61 |
167 |
Increase in long-term debt |
2 |
- |
|
559 |
- |
Decrease in long-term debt |
- |
(4) |
|
(533) |
(357) |
Dividends paid |
(57) |
(57) |
|
(225) |
(224) |
Share repurchases |
(150) |
(55) |
|
(352) |
(115) |
Common stock options exercised |
0 |
0 |
|
1 |
0 |
Dividend paid to non-controlling interests |
(0) |
(1) |
|
(1) |
(2) |
Net cash used in financing activities |
$(258) |
$(142) |
|
$(490) |
$(531) |
|
|
|
|
|
|
Effect of exchange rate changes on cash |
(16) |
(44) |
|
(20) |
(73) |
Increase (decrease) in cash and cash equivalents |
$23 |
$111 |
|
$(96) |
$(375) |
Cash and cash equivalents at period-start |
475 |
483 |
|
594 |
969 |
Cash and cash equivalents at period-end |
$498 |
$594 |
|
$498 |
$594 |
1) Non-U.S. GAAP measure comprised of "Net cash provided by operating activities" and "Net cash used in investing activities". See reconciliation table. |
18
|
Financial Report October - December 2023 |
RECONCILIATION OF U.S. GAAP TO NON-U.S. GAAP MEASURES
In this report we sometimes refer to non-U.S. GAAP measures that we and securities analysts use in measuring Autoliv's performance. We believe that these measures assist investors and management in analyzing trends in the Company's business for the reasons given below. Investors should not consider these non-U.S. GAAP measures as substitutes, but rather as additions, to financial reporting measures prepared in accordance with U.S. GAAP. It should be noted that these measures, as defined, may not be comparable to similarly titled measures used by other companies.
Components in Sales Increase/Decrease
Since the Company historically generates approximately 75% of sales in currencies other than in the reporting currency (i.e., U.S. dollars) and currency rates have been volatile, we analyze the Company's sales trends and performance as changes in organic sales growth. This presents the increase or decrease in the overall U.S. dollar net sales on a comparable basis, allowing separate discussions of the impact of acquisitions/divestitures and exchange rates. The tables on pages 6 and 7 present changes in organic sales growth as reconciled to the change in the total U.S. GAAP net sales.
Trade Working Capital
Due to the need to optimize cash generation to create value for shareholders, management focuses on operationally derived trade working capital as defined in the table below. The reconciling items used to derive this measure are, by contrast, managed as part of our overall management of cash and debt, but they are not part of the responsibilities of day-to-day operations' management.
|
|
|
|
|
|
|
Dec 31 |
Sep 30 |
Jun 30 |
Mar 31 |
Dec 31 |
(Dollars in millions) |
2023 |
2023 |
2023 |
2023 |
2022 |
Receivables, net |
$2,198 |
$2,179 |
$2,189 |
$2,106 |
$1,907 |
Inventories, net |
1,012 |
982 |
947 |
986 |
969 |
Accounts payable |
(1,978) |
(1,858) |
(1,844) |
(1,683) |
(1,693) |
Trade Working capital |
$1,232 |
$1,303 |
$1,292 |
$1,409 |
$1,183 |
Net Debt
Autoliv from time to time enters into “debt-related derivatives” (DRDs) as a part of its debt management and as part of efficiently managing the Company’s overall cost of funds. Creditors and credit rating agencies use net debt adjusted for DRDs in their analyses of the Company’s debt, therefore we provide this non-U.S. GAAP measure. DRDs are fair value adjustments to the carrying value of the underlying debt. Also included in the DRDs is the unamortized fair value adjustment related to a discontinued fair value hedge that will be amortized over the remaining life of the debt. By adjusting for DRDs, the total financial liability of net debt is disclosed without grossing debt up with currency or interest fair values.
|
|
|
|
|
|
|
Dec 31 |
Sep 30 |
Jun 30 |
Mar 31 |
Dec 31 |
(Dollars in millions) |
2023 |
2023 |
2023 |
2023 |
2022 |
Short-term debt |
$538 |
$590 |
$481 |
$577 |
$711 |
Long-term debt |
1,324 |
1,277 |
1,290 |
1,601 |
1,054 |
Total debt |
$1,862 |
$1,867 |
$1,771 |
$2,179 |
$1,766 |
Cash & cash equivalents |
(498) |
(475) |
(475) |
(713) |
(594) |
Debt issuance cost/Debt-related derivatives, net |
3 |
(17) |
4 |
12 |
12 |
Net debt |
$1,367 |
$1,375 |
$1,299 |
$1,477 |
$1,184 |
|
|
|
|
Dec 31 |
Dec 31 |
Dec 31 |
(Dollars in millions) |
|
|
2021 |
2020 |
2019 |
Short-term debt |
|
|
$346 |
$302 |
$368 |
Long-term debt |
|
|
1,662 |
2,110 |
1,726 |
Total debt |
|
|
$2,008 |
$2,411 |
$2,094 |
Cash & cash equivalents |
|
|
(969) |
(1,178) |
(445) |
Debt issuance cost/Debt-related derivatives, net |
|
|
13 |
(19) |
0 |
Net debt |
|
|
$1,052 |
$1,214 |
$1,650 |
19
|
Financial Report October - December 2023 |
Leverage ratio
The non-U.S. GAAP measure “net debt” is also used in the non-U.S. GAAP measure “Leverage ratio”. Management uses this measure to analyze the amount of debt the Company can incur under its debt policy. Management believes that this policy also provides guidance to credit and equity investors regarding the extent to which the Company would be prepared to leverage its operations. Autoliv’s policy is to maintain a leverage ratio commensurate with a strong investment grade credit rating. The Company measures its leverage ratio as net debt* adjusted for pension liabilities in relation to adjusted EBITDA*. The long-term target is to maintain a leverage ratio of around 1.0x within a range of 0.5x to 1.5x.
|
|
|
|
|
|
|
Dec 31 |
Sep 30 |
Jun 30 |
Mar 31 |
Dec 31 |
(Dollars in millions) |
2023 |
2023 |
2023 |
2023 |
2022 |
Net debt1) |
$1,367 |
$1,375 |
$1,299 |
$1,477 |
$1,184 |
Pension liabilities |
159 |
152 |
152 |
159 |
154 |
Debt per the Policy |
$1,527 |
$1,527 |
$1,451 |
$1,636 |
$1,338 |
|
|
|
|
|
|
Net income2) |
489 |
418 |
390 |
416 |
425 |
Income taxes2) |
123 |
188 |
168 |
176 |
178 |
Interest expense, net2, 3) |
80 |
75 |
67 |
60 |
54 |
Other non-operating items, net2) |
3 |
5 |
1 |
4 |
5 |
Income from equity method investments2) |
(5) |
(4) |
(4) |
(4) |
(3) |
Depreciation and amortization of intangibles2) |
378 |
371 |
363 |
359 |
363 |
Adjustments2), 4) |
230 |
136 |
127 |
10 |
(61) |
EBITDA per the Policy (Adjusted EBITDA) |
$1,297 |
$1,189 |
$1,112 |
$1,021 |
$961 |
|
|
|
|
|
|
Leverage ratio |
1.2 |
1.3 |
1.3 |
1.6 |
1.4 |
1) Short- and long-term debt less cash and cash equivalents and debt-related derivatives. 2) Latest 12 months. 3) Interest expense including cost for extinguishment of debt, if any, less interest income. 4) Capacity alignments, antitrust related matters and the Andrews litigation settlement. See Items Affecting Comparability below. |
20
|
Financial Report October - December 2023 |
Free Cash Flow, Net Cash Before Financing and Cash Conversion
Management uses the non-U.S. GAAP measure “free cash flow” to analyze the amount of cash flow being generated by the Company’s operations after capital expenditure, net. This measure indicates the Company’s cash flow generation level that enables strategic value creation options such as dividends or acquisitions. For details on free cash flow, see the reconciliation table below. Management uses the non-U.S. GAAP measure “net cash before financing” to analyze and disclose the cash flow generation available for servicing external stakeholders such as shareholders and debt stakeholders. For details on net cash before financing, see the reconciliation table below. Management uses the non-U.S. GAAP measure “cash conversion” to analyze the proportion of net income that is converted into free cash flow. The measure is a tool to evaluate how efficiently the Company utilizes its resources. For details on cash conversion, see the reconciliation table below.
|
|
|
|
|
|
|
Fourth quarter |
|
Full year |
(Dollars in millions) |
2023 |
2022 |
|
2023 |
2022 |
Net income |
$227 |
$156 |
|
$489 |
$425 |
Changes in operating working capital |
243 |
226 |
|
235 |
58 |
Depreciation and amortization |
97 |
90 |
|
378 |
363 |
Gain on divestiture of property |
- |
- |
|
- |
(80) |
Other, net |
(120) |
(10) |
|
(119) |
(54) |
Operating cash flow |
$447 |
$462 |
|
$982 |
$713 |
Capital expenditure, net |
(150) |
(165) |
|
(569) |
(485) |
Free cash flow1) |
$297 |
$297 |
|
$414 |
$228 |
Net cash before financing |
$297 |
$297 |
|
$414 |
$228 |
Cash conversion2) |
131% |
190% |
|
85% |
54% |
1) Operating cash flow less Capital expenditure, net. 2) Free cash flow relative to Net income. |
|
|
|
|
|
|
Full year |
Full year |
|
Full year |
(Dollars in millions) |
2021 |
2020 |
|
2019 |
Net income |
$437 |
$188 |
|
$463 |
Changes in operating assets and liabilities |
(63) |
277 |
|
47 |
Depreciation and amortization |
394 |
371 |
|
351 |
Other, net1) |
(15) |
13 |
|
(220) |
Operating cash flow |
$754 |
$849 |
|
$641 |
EC antitrust payment |
- |
- |
|
(203) |
Operating cash flow excl antitrust |
$754 |
$849 |
|
$844 |
Capital expenditure, net |
(454) |
(340) |
|
(476) |
Free cash flow2) |
$300 |
$509 |
|
$165 |
Free cash flow excl antitrust payment3) |
$300 |
$509 |
|
$368 |
Net cash before financing |
$300 |
$509 |
|
$165 |
Cash conversion4) |
69% |
270% |
|
36% |
Cash conversion excl antitrust5) |
69% |
270% |
|
79% |
1) Including EC antitrust payment 2019. 2) Operating cash flow less Capital expenditure, net. 3) For 2019, Operating cash flow excluding EC antitrust payment less Capital expenditures, net. 4) Free cash flow relative to Net income. 5) For 2019, Free cash flow excluding EC antitrust payment relative to Net income. |
21
|
Financial Report October - December 2023 |
Items Affecting Comparability
We believe that comparability between periods is improved through the exclusion of certain items. To assist investors in understanding the operating performance of Autoliv's business, it is useful to consider certain U.S. GAAP measures exclusive of these items.
The following table reconciles Income before income taxes, Net income attributable to controlling interest, capital employed, which are inputs utilized to calculate Return on Capital Employed (“ROCE”), adjusted ROCE and Return on Total Equity (“ROE”). The Company believes this presentation may be useful to investors and industry analysts who utilize these adjusted non-U.S. GAAP measures in their ROCE and ROE calculations to exclude certain items for comparison purposes across periods. Autoliv’s management uses the ROCE, adjusted ROCE and ROE measures for purposes of comparing its financial performance with the financial performance of other companies in the industry and providing useful information regarding the factors and trends affecting the Company’s business.
As used by the Company, ROCE is annualized operating income and income from equity method investments, relative to average capital employed. Adjusted ROCE is annualized operating income and income from equity method investments, relative to average capital employed as adjusted to exclude certain non-recurring items. The Company believes ROCE and adjusted ROCE are useful indicators of long-term performance both absolute and relative to the Company's peers as it allows for a comparison of the profitability of the Company’s capital employed in its business relative to that of its peers.
ROE is the ratio of annualized income (loss) relative to average total equity for the periods presented. The Company’s management believes that ROE is a useful indicator of how well management creates value for its shareholders through its operating activities and its capital management.
With respect to the Andrews litigation settlement, the Company has treated this specific settlement as a non-recurring charge because of the unique nature of the lawsuit, including the facts and legal issues involved.
Accordingly, the tables below reconcile from U.S. GAAP to the equivalent non-U.S. GAAP measure.
|
|
|
|
|
|
|
|
|
Fourth quarter 2023 |
|
Fourth quarter 2022 |
(Dollars in millions, except per share data) |
Reported
U.S. GAAP |
Adjust-ments1) |
Non-U.S.
GAAP |
|
Reported
U.S. GAAP |
Adjust-ments1) |
Non-U.S.
GAAP |
Operating income |
$237 |
$97 |
$334 |
|
$230 |
$3 |
$233 |
Operating margin |
8.6% |
3.5% |
12.1% |
|
9.8% |
0.1% |
10.0% |
Income before taxes |
219 |
97 |
316 |
|
214 |
3 |
217 |
Net income attributable to controlling interest |
227 |
86 |
313 |
|
156 |
2 |
158 |
Return on capital employed2) |
24.4% |
8.5% |
32.9% |
|
24.3% |
0.6% |
24.9% |
Return on total equity3) |
36.0% |
10.6% |
46.6% |
|
24.5% |
0.7% |
25.2% |
Earnings per share4) |
$2.71 |
$1.03 |
$3.74 |
|
$1.80 |
$0.02 |
$1.83 |
1) Effects from capacity alignments and antitrust related matters. 2) Annualized operating income and income from equity method investments, relative to average capital employed. 3) Annualized income relative to average total equity. 4) Assuming dilution and net of treasury shares. |
|
|
|
|
|
|
|
|
|
Full year 2023 |
|
Full year 2022 |
|
Reported
U.S. GAAP |
Adjust-ments1) |
Non-U.S.
GAAP |
|
Reported
U.S. GAAP |
Adjust-ments1) |
Non-U.S.
GAAP |
Operating income |
$690 |
$230 |
$920 |
|
$659 |
$(61) |
$598 |
Operating margin |
6.6% |
2.2% |
8.8% |
|
7.5% |
(0.7)% |
6.8% |
Income before taxes |
612 |
230 |
842 |
|
603 |
(61) |
542 |
Net income attributable to controlling interest |
488 |
210 |
697 |
|
423 |
(39) |
384 |
Capital employed |
3,937 |
210 |
4,147 |
|
3,810 |
(39) |
3,771 |
Return on capital employed2) |
17.7% |
5.3% |
23.1% |
|
17.5% |
(1.5)% |
16.0% |
Return on total equity3) |
19.0% |
7.2% |
26.2% |
|
16.3% |
(1.3)% |
15.0% |
Earnings per share4) |
$5.72 |
$2.46 |
$8.19 |
|
$4.85 |
$(0.45) |
$4.40 |
1) Effects from capacity alignments, antitrust related matters and for FY 2023 the Andrews litigation settlement. 2) Annualized operating income and income from equity method investments, relative to average capital employed. 3) Annualized income relative to average total equity. 4) Assuming dilution and net of treasury shares. |
22
|
Financial Report October - December 2023 |
|
|
|
|
|
|
|
|
|
Full year 2021 |
|
Full year 2020 |
|
Reported
U.S. GAAP |
Adjust-ments1) |
Non-U.S.
GAAP |
|
Reported
U.S. GAAP |
Adjust-ments1) |
Non-U.S.
GAAP |
Operating income |
$675 |
$8 |
$683 |
|
$382 |
$99 |
$482 |
Operating margin |
8.2% |
0.1% |
8.3% |
|
5.1% |
1.4% |
6.5% |
1) Costs for capacity alignments and antitrust related matters. |
|
|
|
|
|
|
|
|
|
|
|
Full year 2019 |
(Dollars in millions, except per share data) |
|
|
|
|
Reported
U.S. GAAP |
Adjust-ments1) |
Non-U.S.
GAAP |
Operating income |
|
|
|
|
$726 |
$49 |
$774 |
Operating margin, % |
|
|
|
|
8.5% |
0.6% |
9.1% |
1) Costs for capacity alignments and antitrust related matters. |
|
|
|
|
|
|
Items included in non-U.S. GAAP adjustments |
Fourth quarter 2023 |
|
Fourth quarter 2022 |
|
Adjustment
Million |
Adjustment
Per share |
|
Adjustment
Million |
Adjustment
Per share |
Capacity alignments |
$96 |
1.13 |
|
$3 |
$0.04 |
Antitrust related matters |
1 |
0.01 |
|
- |
- |
Total adjustments to operating income |
$97 |
$1.14 |
|
$3 |
$0.04 |
Tax on non-U.S. GAAP adjustments1) |
(10) |
(0.12) |
|
(1) |
(0.00) |
Total adjustments to net income |
$86 |
1.01 |
|
$2 |
$0.02 |
|
|
|
|
|
|
Average number of shares outstanding - diluted2) |
|
85.2 |
|
|
87.2 |
|
|
|
|
|
|
Annualized adjustment on return on capital employed |
388 |
|
|
12 |
|
Adjustment on return on capital employed |
8.5% |
|
|
0.6% |
|
|
|
|
|
|
|
Annualized adjustment on return on total equity |
$346 |
|
|
$8 |
|
Adjustment on return on total equity |
10.6% |
|
|
0.7% |
|
1) The tax is calculated based on the tax laws in the respective jurisdiction(s) of the adjustment(s). 2) Annualized average number of outstanding shares |
|
|
|
|
|
|
Items included in non-GAAP adjustments |
Full year 2023 |
|
Full year 2022 |
|
Adjustment
Million |
Adjustment
Per share |
|
Adjustment
Million |
Adjustment
Per share |
Capacity alignments |
$218 |
2.56 |
|
$(61) |
$(0.70) |
The Andrews litigation settlement |
8 |
0.09 |
|
- |
- |
Antitrust related matters |
4 |
0.05 |
|
- |
- |
Total adjustments to operating income |
$230 |
$2.70 |
|
$(61) |
$(0.70) |
Tax on non-U.S. GAAP adjustments1) |
(20) |
(0.24) |
|
22 |
0.25 |
Total adjustments to net income |
$210 |
2.46 |
|
$(39) |
$(0.45) |
|
|
|
|
|
|
Average number of shares outstanding - diluted2) |
|
85.2 |
|
|
87.2 |
|
|
|
|
|
|
Annualized adjustment on return on capital employed |
230 |
|
|
(61) |
|
Adjustment on return on capital employed |
5.3% |
|
|
(1.5)% |
|
|
|
|
|
|
|
Annualized adjustment on return on total equity |
$210 |
|
|
$(39) |
|
Adjustment on return on total equity |
7.2% |
|
|
(1.3)% |
|
1) The tax is calculated based on the tax laws in the respective jurisdiction(s) of the adjustment(s). 2) Annualized average number of outstanding shares |
23
|
Financial Report October - December 2023 |
|
|
|
|
|
|
(Dollars in millions, except per share data, unaudited) |
2023 |
2022 |
2021 |
2020 |
2019 |
Sales and Income |
|
|
|
|
|
Net sales |
$10,475 |
$8,842 |
$8,230 |
$7,447 |
$8,548 |
Airbag sales1) |
7,055 |
5,807 |
5,380 |
4,824 |
5,676 |
Seatbelt sales |
3,420 |
3,035 |
2,850 |
2,623 |
2,871 |
Operating income |
690 |
659 |
675 |
382 |
726 |
Net income attributable to controlling interest |
488 |
423 |
435 |
187 |
462 |
Earnings per share – basic |
5.74 |
4.86 |
4.97 |
2.14 |
5.29 |
Earnings per share – assuming dilution2) |
5.72 |
4.85 |
4.96 |
2.14 |
5.29 |
Gross margin3) |
17.4% |
15.8% |
18.4% |
16.7% |
18.5% |
S,G&A in relation to sales |
(4.8)% |
(4.9)% |
(5.3)% |
(5.2)% |
(4.7)% |
R,D&E net in relation to sales |
(4.1)% |
(4.4)% |
(4.7)% |
(5.0)% |
(4.7)% |
Operating margin4) |
6.6% |
7.5% |
8.2% |
5.1% |
8.5% |
Adjusted operating margin5,6) |
8.8% |
6.8% |
8.3% |
6.5% |
9.1% |
Balance Sheet |
Trade working capital7) |
1,232 |
1,183 |
1,332 |
1,366 |
1,417 |
Trade working capital in relation to sales8) |
11.2% |
12.7% |
15.7% |
13.6% |
16.2% |
Receivables outstanding in relation to sales9) |
20.0% |
20.4% |
20.0% |
18.1% |
18.6% |
Inventory outstanding in relation to sales10) |
9.2% |
10.4% |
9.2% |
7.9% |
8.5% |
Payables outstanding in relation to sales11) |
18.0% |
18.1% |
13.5% |
12.5% |
10.8% |
Total equity |
2,570 |
2,626 |
2,648 |
2,423 |
2,122 |
Total parent shareholders’ equity per share |
30.93 |
30.30 |
30.10 |
27.56 |
24.19 |
Current assets excluding cash |
3,475 |
3,119 |
2,705 |
3,091 |
2,557 |
Property, plant and equipment, net |
2,192 |
1,960 |
1,855 |
1,869 |
1,816 |
Intangible assets (primarily goodwill) |
1,385 |
1,382 |
1,395 |
1,412 |
1,410 |
Capital employed |
3,937 |
3,810 |
3,700 |
3,637 |
3,772 |
Net debt6) |
1,367 |
1,184 |
1,052 |
1,214 |
1,650 |
Total assets |
8,332 |
7,717 |
7,537 |
8,157 |
6,771 |
Long-term debt |
1,324 |
1,054 |
1,662 |
2,110 |
1,726 |
Return on capital employed12) |
17.7% |
17.5% |
18.3% |
10.0% |
20.0% |
Return on total equity13) |
19.0% |
16.3% |
17.1% |
9.0% |
23.0% |
Total equity ratio |
31% |
34% |
35% |
30% |
31% |
Cash flow and other data |
Operating Cash flow |
982 |
713 |
754 |
849 |
641 |
Depreciation and amortization |
378 |
363 |
394 |
371 |
351 |
Capital expenditures, net |
569 |
485 |
454 |
340 |
476 |
Capital expenditures, net in relation to sales |
5.4% |
5.5% |
5.5% |
4.6% |
5.6% |
Free Cash flow6,14) |
414 |
228 |
300 |
509 |
165 |
Cash conversion6,15) |
85% |
54% |
69% |
270% |
36% |
Direct shareholder return16) |
577 |
339 |
165 |
54 |
217 |
Cash dividends paid per share |
2.66 |
2.58 |
1.88 |
0.62 |
2.48 |
Number of shares outstanding (millions)17) |
82.6 |
86.2 |
87.5 |
87.4 |
87.2 |
Number of employees, December 31 |
62,900 |
61,700 |
55,900 |
61,000 |
58,900 |
1) Including steering wheels, inflators and initiators. 2) Assuming dilution and net of treasury shares. 3) Gross profit relative to sales. 4) Operating income relative to sales. 5) Excluding effects from capacity alignments, antitrust related matters and Andrews litigation settlement. 6) Non-US GAAP measure, for reconciliation see tables above. 7) Outstanding receivables and outstanding inventory less outstanding payables. 8) Outstanding receivables and outstanding inventory less outstanding payables relative to annualized fourth quarter sales. 9) Outstanding receivables relative to annualized fourth quarter sales. 10) Outstanding inventory relative to annualized fourth quarter sales. 11) Outstanding payables relative to annualized fourth quarter sales. 12) Operating income and income from equity method investments, relative to average capital employed. 13) Income relative to average total equity. 14) Operating cash flow less Capital expenditures, net. 15) Free cash flow relative to Net income. 16) Dividends paid and Shares repurchased. 17) At year end, excluding dilution and net of treasury shares. |
24