UNITED STATES
SECURITIES AND EXCHANGE COMMISSION
Washington, D.C. 20549
FORM 6-K
REPORT OF FOREIGN PRIVATE ISSUER PURSUANT TO
RULE 13a-16 OR 15d-16
UNDER THE SECURITIES EXCHANGE ACT OF 1934
February 1, 2024
| Commission File Number 001-16125 |
| |
|
| ASE Technology Holding Co., Ltd. |
| (Translation of registrant’s name into English) |
| |
|
|
26, Chin 3rd Road
Kaohsiung, Taiwan
Republic of China |
| (Address of principal executive offices) |
Indicate by check mark whether the registrant files or will file annual
reports under cover of Form 20-F or Form 40-F.
SIGNATURES
Pursuant to the requirements of the Securities
Exchange Act of 1934, the registrant has duly caused this report to be signed on its behalf by the undersigned, thereunto duly authorized.
| |
ASE TECHNOLOGY HOLDING CO., LTD. |
| |
|
| |
|
| Date: February 1,
2024
|
By: |
/s/ Joseph Tung |
| |
|
Name: Joseph Tung |
| |
|
Title: Chief Financial Officer |

Fourth Quarter 2023 Earnings Release 1 February, 2024 ASE Technology Holding

Safe Harbor Notice This presentation contains "forward - looking statements" within the meaning of Section 27A of the United States Securities Act of 1933, as amended, and Section 21E of the United States Securities Exchange Act of 1934, as amended. Although these forward - looking statements, which may include statements regarding our future results of operations, financial condition or business prospects, are based on our own information and information from other sources we believe to be reliable, you should not place undue reliance on these forward - looking statements, which apply only as of the date of this press release. The words “anticipate,” “believe,” “estimate,” “expect,” “intend,” “plan” and similar expressions, as they relate to us, are intended to identify these forward - looking statements in this presentation. These forward - looking statements are necessarily estimates reflecting the best judgment of our senior management and our actual results of operations, financial condition or business prospects may differ materially from those expressed or implied by the forward - looking statements for reasons including, among others, risks associated with cyclicality and market conditions in the semiconductor or electronic industry; changes in our regulatory environment, including our ability to comply with new or stricter environmental regulations and to resolve environmental liabilities; demand for the outsourced semiconductor packaging, testing and electronic manufacturing services we offer and for such outsourced services generally; the highly competitive semiconductor or manufacturing industry we are involved in; our ability to introduce new technologies in order to remain competitive; international business activities; our business strategy; our future expansion plans and capital expenditures; the strained relationship between the Republic of China and the People’s Republic of China; general economic and political conditions; the recent shift in United States trade policies; possible disruptions in commercial activities caused by natural or human - induced disasters; fluctuations in foreign currency exchange rates; and other factors. The announced results of the full year of 2023 are preliminary and subject to audit adjustments . For a discussion of these risks and other factors, please see the documents we file from time to time with the Securities and Exchange Commission, including the 2022 Annual Report on Form 20 - F filed on April 10, 2023 . 2
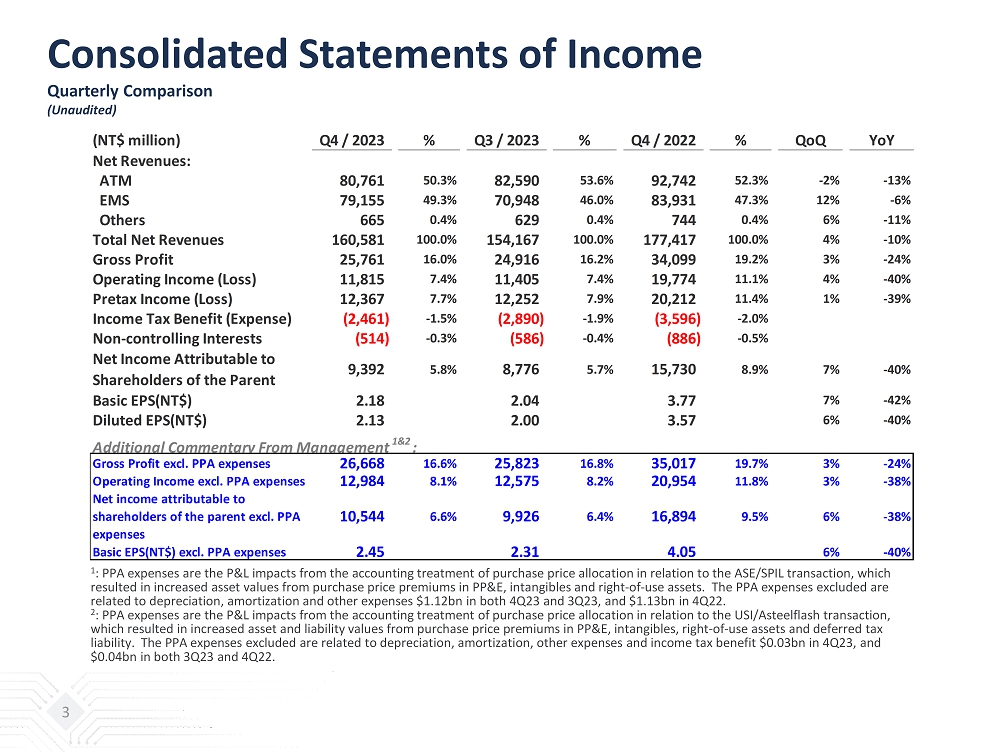
Consolidated Statements of Income Quarterly Comparison (Unaudited) 3 (NT$ million) Q4 / 2023 % Q3 / 2023 % Q4 / 2022 % QoQ YoY Net Revenues: ATM 80,761 50.3% 82,590 53.6% 92,742 52.3% -2% -13% EMS 79,155 49.3% 70,948 46.0% 83,931 47.3% 12% -6% Others 665 0.4% 629 0.4% 744 0.4% 6% -11% Total Net Revenues 160,581 100.0% 154,167 100.0% 177,417 100.0% 4% -10% Gross Profit 25,761 16.0% 24,916 16.2% 34,099 19.2% 3% -24% Operating Income (Loss) 11,815 7.4% 11,405 7.4% 19,774 11.1% 4% -40% Pretax Income (Loss) 12,367 7.7% 12,252 7.9% 20,212 11.4% 1% -39% Income Tax Benefit (Expense) (2,461) -1.5% (2,890) -1.9% (3,596) -2.0% Non-controlling Interests (514) -0.3% (586) -0.4% (886) -0.5% Net Income Attributable to Shareholders of the Parent 9,392 5.8% 8,776 5.7% 15,730 8.9% 7% -40% Basic EPS(NT$) 2.18 2.04 3.77 7% -42% Diluted EPS(NT$) 2.13 2.00 3.57 6% -40% Additional Commentary From Management 1&2 : Gross Profit excl. PPA expenses 26,668 16.6% 25,823 16.8% 35,017 19.7% 3% -24% Operating Income excl. PPA expenses 12,984 8.1% 12,575 8.2% 20,954 11.8% 3% -38% Net income attributable to shareholders of the parent excl. PPA expenses 10,544 6.6% 9,926 6.4% 16,894 9.5% 6% -38% Basic EPS(NT$) excl. PPA expenses 2.45 2.31 4.05 6% -40% 1 : PPA expenses are the P&L impacts from the accounting treatment of purchase price allocation in relation to the ASE/SPIL trans act ion, which resulted in increased asset values from purchase price premiums in PP&E, intangibles and right - of - use assets. The PPA expenses excluded are related to depreciation, amortization and other expenses $1.12bn in both 4Q23 and 3Q23, and $1.13bn in 4Q22. 2 : PPA expenses are the P&L impacts from the accounting treatment of purchase price allocation in relation to the USI/ Asteelflash transaction, which resulted in increased asset and liability values from purchase price premiums in PP&E, intangibles, right - of - use assets an d deferred tax liability. The PPA expenses excluded are related to depreciation, amortization, other expenses and income tax benefit $0.03bn in 4Q23, and $0.04bn in both 3Q23 and 4Q22.

Consolidated Statements of Income Yearly Comparison (unaudited) (NT$ million) FY / 2023 % FY / 2022 % YoYNet Revenues: ATM 311,131 53.5% 365,589 54.5% -15% EMS 268,218 46.1% 301,967 45.0% -11% Others 2,565 0.4% 3,317 0.5% -23% Total Net Revenues 581,914 100.0% 670,873 100.0% -13% Gross Profit 91,757 15.8% 134,930 20.1% -32% Operating Income (Loss) 40,328 6.9% 80,176 12.0% -50% Pretax Income (Loss) 42,600 7.3% 81,626 12.2% -48% Income Tax Benefit (Expense) (9,043) -1.6% (16,399) -2.4% Non-controlling Interest (1,832) -0.3% (3,137) -0.5% Net Income Attributable to Shareholders of the Parent 31,725 5.5% 62,090 9.3% -49% Basic EPS 7.39 14.53 -49% Diluted EPS 7.18 13.94 -48% Additional Commentary From Management 1&2 : Gross Profit excl. PPA expenses 95,401 16.4% 138,603 20.7% -31% Operating Income excl. PPA expenses 45,021 7.7% 84,894 12.7% -47% Net income attributable to shareholders of the parent excl. PPA expenses 36,352 6.2% 66,754 10.0% -46% Basic EPS excl. PPA expenses 8.46 15.62 -46% 1 : PPA expenses are the P&L impacts from the accounting treatment of purchase price allocation in relation to the ASE/SPIL tra nsa ction, which resulted in increased asset values from purchase price premiums in PP&E, intangibles and right - of - use assets. The PPA expenses excluded are related to depreciation, amortization and other expenses $4.51bn in 2023 and $4.53bn in 2022. 2 : PPA expenses are the P&L impacts from the accounting treatment of purchase price allocation in relation to the USI/ Asteelflash transaction, which resulted in increased asset and liability values from purchase price premiums in PP&E, intangibles, right - of - use assets an d deferred tax liability. The PPA expenses excluded are related to depreciation, amortization, other expenses and income tax benefit $0.15bn in 2023 and $0.17bn in 2022. 4

Consolidated Operations (Unaudited) 5 82,355 93,355 97,137 92,742 72,524 75,256 82,590 80,761 61,163 66,213 90,660 83,931 57,731 60,384 70,948 79,155 873 871 829 744 636 635 629 665 19.7% 21.4% 20.1% 19.2% 14.8% 16.0% 16.2% 16.0% 11.2% 12.8% 12.6% 11.1% 5.9% 6.9% 7.4% 7.4% 0% 10% 20% 30% 0 50,000 100,000 150,000 200,000 Q1/22 Q2/22 Q3/22 Q4/22 Q1/23 Q2/23 Q3/23 Q4/23 NT$ million ATM Revenue EMS Revenue Other Revenue Gross Margin Operating Margin

ATM Statements of Income Quarterly Comparison (Unaudited) 6 (NT$ million) Q4 / 2023 % Q3 / 2023 % Q4 / 2022 % QoQ YoY Net Revenues: Packaging 67,378 82.1% 69,731 83.3% 78,119 82.8% -3% -14% Testing 13,363 16.3% 12,819 15.3% 14,676 15.6% 4% -9% Direct Material 1,205 1.5% 1,098 1.3% 1,486 1.6% 10% -19% Others 58 0.1% 36 0.1% 41 0.0% 61% 41% Total Net Revenues 82,004 100.0% 83,684 100.0% 94,322 100.0% -2% -13% Gross Profit 19,218 23.4% 18,590 22.2% 26,193 27.8% 3% -27% Operating Income (Loss) 9,212 11.2% 8,820 10.5% 15,778 16.7% 4% -42% Additional Commentary From Management 1 : Gross Profit excl. PPA expenses 20,091 24.5% 19,463 23.3% 27,069 28.7% 3% -26% Operating Income excl. PPA expenses 10,335 12.6% 9,943 11.9% 16,904 17.9% 4% -39% 1 : PPA expenses are the P&L impacts from the accounting treatment of purchase price allocation in relation to the ASE/SPIL transacti on, which resulted in increased asset values from purchase price premiums in PP&E, intangibles and right - of - use assets. The PPA expenses e xcluded are related to depreciation and amortization $1.12bn in both 4Q23 and 3Q23, and $1.13bn in 4Q22.

ATM Statements of Income Yearly Comparison (unaudited) (NT$ million) FY / 2023 % FY / 2022 % YoYNet Revenues: Packaging 260,486 82.7% 310,024 83.3% -16% Testing 49,881 15.8% 55,960 15.0% -11% Direct Material 4,574 1.4% 6,018 1.6% -24% Others 174 0.1% 174 0.1% 0% Total Net Revenues 315,115 100.0% 372,176 100.0% -15% Gross Profit 68,718 21.8% 105,893 28.5% -35% Operating Income (Loss) 31,846 10.1% 66,447 17.9% -52% Additional Commentary From Management 1 : Gross Profit excl. PPA expenses 72,214 22.9% 109,400 29.4% -34% Operating Profit excl. PPA expenses 36,342 11.5% 70,954 19.1% -49% 1 : PPA expenses are the P&L impacts from the accounting treatment of purchase price allocation in relation to the ASE/SPIL tra nsa ction, which resulted in increased asset values from purchase price premiums in PP&E, intangibles and right - of - use assets. The PPA expenses excluded are related to depreciation, amortization and other expenses $4.51bn in both 2023 and 2022. 7

ATM Operations (Unaudited) 8 23,101 27,768 28,832 26,193 14,749 16,161 18,590 19,218 84,025 94,998 98,831 94,322 73,319 76,108 83,684 82,004 27.5% 29.2% 29.2% 27.8% 20.1% 21.2% 22.2% 23.4% 0% 10% 20% 30% 40% 50% 0 20,000 40,000 60,000 80,000 100,000 Q1/22 Q2/22 Q3/22 Q4/22 Q1/23 Q2/23 Q3/23 Q4/23 NT$ million Gross Profit Gross Margin Revenue

ATM Revenues by Application (Unaudited) 9 52% 52% 53% 53% 50% 49% 52% 53% 16% 16% 16% 16% 17% 18% 19% 17% 32% 32% 31% 31% 33% 33% 29% 30% 0% 20% 40% 60% 80% 100% Q1/22 Q2/22 Q3/22 Q4/22 Q1/23 Q2/23 Q3/23 Q4/23 Communication Computing Automotive, Consumer & Others

ATM Revenues by Type (Unaudited) 10 43% 43% 42% 43% 41% 41% 44% 44% 34% 35% 34% 33% 34% 34% 32% 30% 6% 6% 7% 7% 8% 7% 8% 8% 15% 15% 15% 15% 16% 16% 15% 16% 2% 1% 2% 2% 1% 2% 1% 2% 0% 20% 40% 60% 80% 100% Q1/22 Q2/22 Q3/22 Q4/22 Q1/23 Q2/23 Q3/23 Q4/23 Material Testing Others Wirebonding Bump/FC/WL P/SiP

EMS Operations Quarterly/Yearly Comparison (unaudited) (NT$ million) Q4 / 2023 % Q3 / 2023 % Q4 / 2022 % QoQ YoY EMS Net Revenues 79,182 100.0% 70,970 100.0% 83,933 100.0% 12% -6% Gross Profit 6,686 8.4% 6,470 9.1% 7,803 9.3% 3% -14% Operating Income (Loss) 2,799 3.5% 2,767 3.9% 3,959 4.7% 1% -29% (NT$ million) FY / 2023 % FY / 2022 % YoY EMS Net Revenues 268,309 100.0% 301,982 100.0% -11% Gross Profit 23,362 8.7% 29,031 9.6% -20% Operating Income (Loss) 8,980 3.3% 13,956 4.6% -36% 11

EMS Operations Quarterly Revenues by Application (unaudited) 12 40% 35% 37% 38% 35% 34% 34% 40% 10% 13% 9% 9% 8% 8% 8% 11% 29% 28% 36% 34% 29% 33% 37% 28% 13% 15% 11% 12% 17% 15% 12% 11% 6% 8% 6% 6% 9% 8% 7% 8% 2% 1% 1% 1% 2% 2% 2% 2% 0% 20% 40% 60% 80% 100% Q1/22 Q2/22 Q3/22 Q4/22 Q1/23 Q2/23 Q3/23 Q4/23 Communication Computing Consumer Industrial Automotive Others

Key Balance Sheet Items & Indices (Unaudited) 13 (NT$ million) Dec. 31, 2023 Sept. 30, 2023 Cash and cash equivalent $67,284 $62,812 Financial assets - current 4,683 9,055 Financial assets - non current & investments - equity method 29,698 28,402 Property, plant & equipment 264,812 267,316 Total assets 666,575 701,084 Short-term loans 53,042 69,639 Current portion of bonds payable 24,520 21,696 Current portion of long-term loans 4,096 2,523 Bonds payable 20,489 23,589 Long-term loans & long-term bills payable 81,365 94,322 Total interest bearing debts 191,734 219,224 Total liabilities 348,465 385,448 Total equity (Including non-controlling interest) 318,110 315,636 Quarterly EBITDA 28,606 27,822 2023 Full Year EBITDA 105,963 Current ratio 1.18 1.21 Net debt to equity ratio 0.38 0.47

Equipment Capital Expenditures vs. EBITDA (Unaudited) 14 443 515 400 339 231 209 239 234 1,100 1,203 1,283 1,141 781 843 885 895 0 200 400 600 800 1,000 1,200 1,400 Q1/22 Q2/22 Q3/22 Q4/22 Q1/23 Q2/23 Q3/23 Q4/23 US$ million Capex EBITDA

Semiconductor Landscape Opportunities: Likely to reach $1T in the next decade driven by AI, Robotics, EV, ADAS, Energy, XR, IoT Responsibilities: Net Zero, ESG, circular economy/recycling Challenges : Geopolitical tensions, Regionalization, Market bifurcation, Added - cost , Reduced - scale To do’s More innovation with higher value Structural improvement of efficiency and cost Align talent and workforce with complexities of doing businesses 15
ASE’s Competitive Advantages Technology HPC/AI: Taiwan ecosystem and technology leadership SiP : Heterogeneous integration, embedded devices Optical: Silicon Photonics, CPO Automation: Software/Data/Design Ecosystems Scale efficiencies Strong financial performance and cash flow Flexibility/agility to handle business model evolutions Geographical diversity 16
2024 Outlook (1/2) Revenues recovery with faster pace of advanced packaging and testing Coming out of inventory adjustment in 1H24. Expect growth to accelerate in 2H24 with full year ATM revenues to grow at a similar rate with the logic semiconductor market Expect a higher revenue mix of Advanced Packaging on technology leadership and Testing on increasing turnkey ratio Target higher investments in machinery, building, and smart factory compared to 2023 as we are entering into a new industry upcycle and increasing adoption of advanced technology 17
2024 Outlook (2/2) Well - positioned to participate in the AI boom On track to double leading - edge advanced packaging revenues from existing customers with at least an additional 250 million USD revenues in 2024; we expect momentum to continue A comprehensive technology toolbox (3D, 2.5D, Fanout, SIP, CPO, automation) and scale advantages make ASE the preferred partner for customers ASE will not only benefit from the adoption of leading - edge advanced packaging, but also the expansion of mainstream packaging, which will be utilized to address the growing semiconductor demands for all the surrounding chips of the booming AI ecosystem 18

First Quarter 2024 Outlook Based on our current business outlook and exchange rate assumptions, management projects overall performance for the first quarter of 2024 to be as follows: In NT dollar terms, our ATM 1st quarter 2024 revenues and gross margin should be similar to the 1st quarter 2023 ; In NT dollar terms, our EMS 1st quarter 2024 revenues should be similar to the 1st quarter 2023; Our EMS 1st quarter 2024 operating margin should approach 1st quarter 2023 operating margin. 19
Thank you

Appendix 1 Consolidated Statements of Comprehensive Income (Unaudited) 21 (NT$ thousand) Q1/2022 Q2/2022 Q3/2022 Q4/2022 FY/2022 Q1/2023 Q2/2023 Q3/2023 Q4/2023 FY/2023 Revenues 144,390,827 160,439,019 188,625,557 177,417,239 670,872,642 130,891,073 136,275,353 154,166,844 160,581,201 581,914,471 COGS 115,919,599 126,051,460 150,653,584 143,317,989 535,942,632 111,551,750 114,534,530 129,251,183 134,819,876 490,157,339 PPA under COGS 920,316 918,661 916,426 917,737 3,673,140 917,384 913,036 907,151 906,818 3,644,389 Gross profit 28,471,228 34,387,559 37,971,973 34,099,250 134,930,010 19,339,323 21,740,823 24,915,661 25,761,325 91,757,132 Gross profit excl. PPA 29,391,544 35,306,220 38,888,399 35,016,987 138,603,150 20,256,707 22,653,859 25,822,812 26,668,143 95,401,521 OPEX 12,358,395 13,782,006 14,289,270 14,324,758 54,754,429 11,643,749 12,328,656 13,510,320 13,946,699 51,429,424 PPA under OPEX 261,477 261,428 261,109 261,723 1,045,737 261,948 262,147 262,426 262,460 1,048,981 Operating income 16,112,833 20,605,553 23,682,703 19,774,492 80,175,581 7,695,574 9,412,167 11,405,341 11,814,626 40,327,708 Operating income excl. PPA 17,294,626 21,785,642 24,860,238 20,953,952 84,894,458 8,874,906 10,587,350 12,574,918 12,983,904 45,021,078 Non Op gain/(loss) 549,787 529,795 (67,443) 437,990 1,450,129 174,771 698,626 846,651 552,592 2,272,640 PPA under Non Op gain/ (loss) 3,637 20,922 7,038 6,268 37,865 6,270 7,693 69 1,423 15,455 Non Op gain/ (loss) excl. PPA 553,424 550,717 (60,405) 444,258 1,487,994 181,041 706,319 846,720 554,015 2,288,095 Pretax income 16,662,621 21,135,348 23,615,261 20,212,482 81,625,712 7,870,345 10,110,793 12,251,993 12,367,218 42,600,349 PPA under Pretax income 1,185,430 1,201,011 1,184,573 1,185,728 4,756,742 1,185,602 1,182,876 1,169,646 1,170,701 4,708,825 Pretax income excl. PPA 17,848,051 22,336,359 24,799,834 21,398,210 86,382,454 9,055,947 11,293,669 13,421,639 13,537,919 47,309,174 Tax expenses 3,277,505 4,478,602 5,046,341 3,596,127 16,398,575 1,777,556 1,913,865 2,890,485 2,461,045 9,042,951 PPA under Tax expense (13,081) (16,957) (12,653) (13,164) (55,855) (13,652) (12,466) (11,470) (11,278) (48,866) Tax expense excl. PPA 3,290,586 4,495,559 5,058,994 3,609,291 16,454,430 1,791,208 1,926,331 2,901,955 2,472,323 9,091,817 Non-controlling interests 477,834 668,595 1,104,295 885,919 3,136,643 275,624 456,505 585,666 514,200 1,831,995 PPA under Non-controlling interests 9,074 10,913 8,619 9,015 37,621 9,332 8,517 7,814 7,709 33,372 Non-controlling interests excl. PPA 486,908 679,508 1,112,914 894,934 3,174,264 284,956 465,022 593,480 521,909 1,865,367 Net income attributable to shareholders of the parent 12,907,282 15,988,151 17,464,625 15,730,436 62,090,494 5,817,165 7,740,423 8,775,842 9,391,973 31,725,403 PPA expenses under Net income attributable to shareholders of the parent 1,163,275 1,173,141 1,163,301 1,163,549 4,663,266 1,162,618 1,161,893 1,150,362 1,151,714 4,626,587 Net income attributable to shareholders of the parent excl. PPA 14,070,557 17,161,292 18,627,926 16,893,985 66,753,760 6,979,783 8,902,316 9,926,204 10,543,687 36,351,990 Total PPA expenses 1,172,349 1,184,054 1,171,920 1,172,564 4,700,887 1,171,950 1,170,410 1,158,176 1,159,423 4,659,959 Basic EPS (NT$) 3.01 3.69 4.03 3.77 14.53 1.36 1.80 2.04 2.18 7.39 Basic EPS (NT$) excl. PPA 3.28 3.97 4.30 4.05 15.62 1.63 2.07 2.31 2.45 8.46 Diluted EPS (NT$) 2.92 3.61 3.92 3.57 13.94 1.30 1.76 2.00 2.13 7.18 Diluted EPS (NT$) excl. PPA 3.19 3.88 4.18 3.84 15.02 1.57 2.03 2.27 2.40 8.25
ASE Technology (NYSE:ASX)
Graphique Historique de l'Action
De Mar 2024 à Avr 2024

ASE Technology (NYSE:ASX)
Graphique Historique de l'Action
De Avr 2023 à Avr 2024
