UNITED STATES
SECURITIES AND EXCHANGE COMMISSION
Washington, D.C. 20549
FORM 6-K
REPORT OF
FOREIGN ISSUER
PURSUANT TO RULE 13a-16 OR 15d-16
UNDER SECURITIES EXCHANGE ACT OF 1934
For the month of February 2024
Commission File No. 001-39000
Vista Energy, S.A.B. de C.V.
(Exact Name of the Registrant as Specified in the Charter)
N.A.
(Translation of
Registrant’s Name into English)
Pedregal 24, Floor 4,
Colonia Molino del Rey, Alcaldía Miguel Hidalgo
Mexico City, 11040
Mexico
(Address of
Principal Executive Office)
Indicate by check mark whether the registrant files or will file annual reports under cover of Form 20-F or Form 40-F.
Form 20-F ☒ Form
40-F ☐
Indicate by check mark if the registrant is submitting the Form
6-K in paper as permitted by Regulation S-T Rule 101(b)(1): ☐
Indicate by check mark if the registrant is submitting the Form 6-K in paper as permitted by Regulation S-T Rule 101(b)(7): ☐
Indicate by check mark whether the registrant by furnishing the information contained
in this Form is also thereby furnishing the information to the Commission pursuant to Rule 12g3-2(b) under the Securities Exchange Act of 1934:
Yes ☐ No ☒
If “Yes” is marked, indicate below the file number assigned to the registrant in connection with Rule
12g3-2(b): Not applicable.

Contents of this Form 6-K
This Form 6-K for Vista Energy, S.A.B. de C.V. (“Vista” or the “Company”) contains the following
exhibit:
Exhibit 1: Fourth Quarter and Full Year 2023 Earnings Webcast Presentation.
Forward-Looking Statements
Any statements contained
herein or in the attachments hereto regarding Vista that are not historical or current facts are forward-looking statements. These forward-looking statements convey Vista’s current expectations or forecasts of future events. Forward-looking
statements regarding Vista involve known and unknown risks, uncertainties and other factors that may cause Vista’s actual results, performance or achievements to be materially different from any future results, performances or achievements
expressed or implied by the forward-looking statements. Certain of these risks and uncertainties are described in the “Risk Factors,” “Forward-Looking Statements” and other applicable sections of Vista’s annual report filed
with the United States Securities and Exchange Commission (“SEC”) on Form 20-F and other applicable filings with the SEC and Vista’s latest annual report available on the Mexican Stock
Exchange’s (Bolsa Mexicana de Valores, S.A.B. de C.V.) website: www.bmv.com.mx, the Mexican National Banking and Securities Commission (Comisión Nacional Bancaria y de Valores) website: www.gob.mx/cnbv and our website:
www.vistaenergy.com.
Enquiries:
Investor
Relations:
ir@vistaenergy.com
Argentina: +54 11 3754
8500
Mexico: +52 55 8647 0128
SIGNATURE
Pursuant to the requirements of the Securities Exchange Act of 1934, the registrant has duly caused this report to be signed on its behalf by
the undersigned, thereunto duly authorized.
Date: February 21, 2024
|
|
|
| VISTA ENERGY, S.A.B. DE C.V. |
|
|
| By: |
|
/s/ Alejandro Cherñacov |
| Name: |
|
Alejandro Cherñacov |
| Title: |
|
Strategic Planning and Investor Relations Officer |

Exhibit 1 Fourth Quarter and Full Year 2023 Earnings Webcast February 21,
2024

02 About projections and forward-looking statements Additional information
about Vista Energy, S.A.B. de C.V., a sociedad anónima bursátil de capital variable organized under the laws of Mexico (the“Company” or“Vista”) can be found in the“Investors” section on the website at
www.vistaenergy.com. This presentation does not constitute an offer to sell or the solicitation of any offer to buy any securities of the Company, in any jurisdiction. Securities may not be offered or sold in the United States absent registration
with the U.S. Securities Exchange Commission(“SEC”), the Mexican National Securities Registry held by the Mexican National Banking and Securities Commission(“CNBV”) or an exemption from such registrations. This presentation
does not contain all theCompany’s financial information. As a result, investors should read this presentation in conjunction with theCompany’s consolidated financial statements and other financial information available on
theCompany’s website. All the amounts contained herein are unaudited. Rounding amounts and percentages: Certain amounts and percentages included in this presentation have been rounded for ease of presentation. Percentage figures included in
this presentation have not in all cases been calculated on the basis of such rounded figures, but on the basis of such amounts prior to rounding. For this reason, certain percentage amounts in this presentation may vary from those obtained by
performing the same calculations using the figures in the financial statements. In addition, certain other amounts that appear in this presentation may not sum due to rounding. This presentation contains certain metrics that do not have standardized
meanings or standard methods of calculation and therefore such measures may not be comparable to similar measures used by other companies. Such metrics have been included herein to provide readers with additional measures to evaluate
theCompany’s performance; however, such measures are not reliable indicators of the future performance of the Company and future performance may not compare to the performance in previous periods. No reliance may be placed for any purpose
whatsoever on the information contained in this document or on its completeness. Certain information contained in this presentation has been obtained from published sources, which may not have been independently verified or audited. No
representation or warranty, express or implied, is given or will be given by or on behalf of the Company, or any of its affiliates (within the meaning of Rule 405 under the Act,“Affiliates”), members, directors, officers or employees or
any other person (the“RelatedParties”) as to the accuracy, completeness or fairness of the information or opinions contained in this presentation or any other material discussed verbally, and any reliance you place on them will be at
your sole risk. Any opinions presented herein are based on general information gathered at the time of writing and are subject to change without notice. In addition, no responsibility, obligation or liability (whether direct or indirect, in
contract, tort or otherwise) is or will be accepted by the Company or any of its Related Parties in relation to such information or opinions or any other matter in connection with this presentation or its contents or otherwise arising in connection
therewith. This presentation also includes certain non-IFRS (International Financial Reporting Standards) financial measures which have not been subject to a financial audit for any period. The information and opinions contained in this presentation
are provided as at the date of this presentation and are subject to verification, completion and change without notice. This presentation includes“forward-lookingstatements” concerning the future. The words such
as“believes,”“thinks,”“forecasts,”“expects,”“anticipates,”“intends,”“should,”“seeks,”“estimates,”“future” or similar expressions
are included with the intention of identifying statements about the future. For the avoidance of doubt, any projection, guidance or similar estimation about the future or future results, performance or achievements is a forward-looking statement.
Although the assumptions and estimates on which forward-looking statements are based are believed by our management to be reasonable and based on the best currently available information, such forward-looking statements are based on assumptions that
are inherently subject to significant uncertainties and contingencies, many of which are beyond our control. There will be differences between actual and projected results, and actual results may be materially greater or materially less than those
contained in the projections. Projections related to production results as well as costs estimations– includingVista’s anticipated performance and guidance for 2024 included in this presentation– are based on information as of the
date of this presentation and reflect numerous assumptions including assumptions with respect to type curves for new well designs and certain frac spacing expectations, all of which are difficult to predict and many of which are beyond our control
and remain subject to several risks and uncertainties. The inclusion of the projected financial information in this document should not be regarded as an indication that we or our management considered or consider the projections to be a reliable
prediction of future events. As such, no representation can be made as to the attainability of projections, guidances or other estimations of future results, performance or achievements. We have not warranted the accuracy, reliability,
appropriateness or completeness of the projections to anyone. Neither our management nor any of our representatives has made or makes any representation to any person regarding our future performance compared to the information contained in the
projections, and none of them intends to or undertakes any obligation to update or otherwise revise the projections to reflect circumstances existing after the date when made or to reflect the occurrence of future events in the event that any or all
of the assumptions underlying the projections are shown to be in error. We may or may not refer back to these projections in our future periodic reports filed under the Exchange Act. These expectations and projections are subject to significant
known and unknown risks and uncertainties which may cause our actual results, performance or achievements, or industry results, to be materially different from any expected or projected results, performance or achievements expressed or implied by
such forward-looking statements. Many important factors could cause our actual results, performance or achievements to differ materially from those expressed or implied in our forward looking statements, including, among other things uncertainties
relating to future government concessions and exploration permits; adverse outcomes in litigation that may arise in the future; general political, economic, social, demographic and business conditions in Argentina, Mexico and in other countries in
which we operate; the impact of political developments and uncertainties relating to political and economic conditions in Argentina, including the policies of the newly elected government in Argentina; significant economic or political developments
in Mexico and the United States; uncertainties relating to the upcoming Mexican presidential and congressional elections in June 2024; changes in law, rules, regulations and interpretations and enforcements thereto applicable to the Argentine and
Mexican energy sectors and throughout Latin America, including changes to the regulatory environment in which we operate and changes to programs established to promote investments in the energy industry; any unexpected increases in financing costs
or an inability to obtain financing and/or additional capital pursuant to attractive terms; any changes in the capital markets in general that may affect the policies or attitude in Argentina and/or Mexico, and/or Argentine and Mexican companies
with respect to financings extended to or investments made in Argentina and Mexico or Argentine and Mexican companies; fines or other penalties and claims by the authorities and/or customers; any future restrictions on the ability to exchange
Mexican or Argentine Pesos into foreign currencies or to transfer funds abroad; the revocation or amendment of our respective concession agreements by the granting authority; our ability to implement our capital expenditures plans or business
strategy, including our ability to obtain financing when necessary and on reasonable terms; government intervention, including measures that result in changes to the Argentine and Mexican, labor markets, exchange markets or tax systems; continued
and/or higher rates of inflation and fluctuations in exchange rates, including the devaluation of the Mexican Peso or Argentine Peso; any force majeure events, or fluctuations or reductions in the value of Argentine public debt; changes to the
demand for energy; the effects of a pandemic or epidemic and any subsequent mandatory regulatory restrictions or containment measures; environmental, health and safety regulations and industry standards that are becoming more stringent; energy
markets, including the timing and extent of changes and volatility in commodity prices, and the impact of any protracted or material reduction in oil prices from historical averages; our relationship with our employees and our ability to retain key
members of our senior management and key technical employees; the ability of our directors and officers to identify an adequate number of potential acquisition opportunities; our expectations with respect to the performance of our recently acquired
businesses; our expectations for future production, costs and crude oil prices used in our projections; uncertainties inherent in making estimates of our oil and gas reserves, including recently discovered oil and gas reserves; increased market
competition in the energy sectors in Argentina and Mexico; potential changes in regulation and free trade agreements as a result of U S Mexican or other Latin American political conditions; environmental regulations and internal policies to achieve
global climate targets; and the ongoing conflict involving Russia and Ukraine; and more recently, the Israel-Hamas conflict. Forward looking statements speak only as of the date on which they were made, and we undertake no obligation to release
publicly any updates or revisions to any forward looking statements contained herein because of new information, future events or other factors. In light of these limitations, undue reliance should not be placed on forward looking statements
contained in this presentation. Further information concerning risks and uncertainties associated with these forward looking statements andVista’s business can be found inVista’s public disclosures filed on EDGAR(www.sec.gov) or at the
web page of the Mexican Stock Exchange (www.bmv.com.mx). You should not take any statement regarding past trends or activities as a representation that the trends or activities will continue in the future. Accordingly, you should not put undue
reliance on these statements. This presentation is not intended to constitute and should not be construed as investment advice. Other Information. Vista routinely posts important information for investors in the Investor Relations support section on
its website, www.vistaenergy.com. From time to time, Vista may use its website as a channel of distribution of material information. Accordingly, investors should monitorVista’s Investor Relations website, in addition to followingVista’s
press releases, SEC filings, public conference calls and webcasts.

03 Consistently delivering strong operational and financial performance Q4
2023 HIGHLIGHTS (1) (3) (4) Production Oil Production Revenues Lifting Cost Free Cash Flow 107 $MM 56.4 Mboe/d 48.5 Mbbl/d 309 $MM 4.3 $/boe (2) (2) 86% y-o-y 16% y-o-y pro forma 18% y-o-y pro forma (3)% y-o-y (40)% y-o-y 14% q-o-q 17% q-o-q 2%
q-o-q (11)% q-o-q (5) (6) (7) (8) (9) Adj. EBITDA Adj. Net Income Adj. EPS CAPEX Net Leverage Ratio 288 $MM 240 $MM 2.5 $/sh 212 $MM 0.46 x 43% y-o-y 40% y-o-y 29% y-o-y 46% y-o-y 16% y-o-y 27% q-o-q 96% q-o-q 95% q-o-q 17% q-o-q (30)% q-o-q (1)
Includes natural gas liquids (NGL) and excludes flared gas, injected gas and gas consumed in operations expenses + Gain related to the transfer of conventional assets + Other non-cash costs related to the transfer of (2) Pro forma production
reflects production net of assets transferred to Aconcagua on March 1, 2023 (shows production as conventional assets + Impairment (recovery) of long-lived assets + other adj. if the transaction had occurred on March 1, 2022) (6) Adjusted net
income/loss = Net (loss)/profit + Deferred income tax + Changes in fair value of warrants + Gain related to (3) Lifting cost includes production, transportation, treatment and field support services; excludes crude stock fluctuations, the transfer
of conventional assets + Other non-cash costs related to the transfer of conventional assets + impairment depreciation, royalties, direct taxes, commercial, exploration, G&A costs and Other non-cash costs related to the transfer (recovery) of
long-lived assets of conventional assets (7) Adj. EPS = Adj. Net Income divided by weighted average number of ordinary shares (4) Free cash flow = Operating activities cash flow + Investing activities cash flow (8) Property, plant and equipment
additions (5) Adj. EBITDA = Net (loss) / profit for the period + Income tax (expense) / benefit + Financial results, net + Depreciation, (9) Net leverage ratio = LTM Adj. EBITDA / Net debt depletion and amortization + Transaction costs related to
business combinations + Restructuring and reorganization

04 Activity ramp-up drove double-digit sequential production growth (1) (2)
(2) (2) TOTAL PRODUCTION OIL PRODUCTION NATURAL GAS PRODUCTION Mboe/d Mbbl/d MMm3/d +16% +18% +3% +14% +17% (2)% 56.4 54.7 48.5 1.35 45.7 49.5 1.22 1.19 41.5 48.7 41.0 1.15 Q4-22 Q3-23 Q4-23 Q4-22 Q3-23 Q4-23 Q4-22 Q3-23 Q4-23 (3) (4) Production
from transferred assets Pro forma Actuals ▪ Interannual production growth reflects strong performance of shale oil wells, more than offsetting impact of transaction to fully focus on shale operations as of March 1, 2023 ▪ Sequential
production increase driven by tie-in of 11 new wells in Bajada del Palo Oeste during the quarter ▪ Sequential decrease in gas production driven by the tie-in of two pads in the Northeast of BPO, which has lower gas-to-oil ratio than other
parts of our acreage (1) Includes oil, gas and LPG production. LPG production in Q4 2023 totaled 409 boe/d, compared to 304 boe/d in Q3 2023 and 460 boe/d in Q4 2022 (2) Excluding the pro froma adjustment, total production increased 3%, oil
production increased 6% and gas production decreased 12%, in all cases comparing Q4-23 to Q4-22 (3) Includes Entre Lomas, Jarilla Quemada, Charco del Palenque, Jagüel de los Machos and 25 de Mayo-Medanito SE concessions transferred to
Aconcagua, effective as of March 1, 2023. Since that date Vista remains entitled to 40% of crude oil and natural gas production, and 100% of LPG and condensates production, of such concessions (4) Pro forma production reflects production net of
assets transferred to Aconcagua on March 1, 2023 (shows production as if the transaction had occurred on March 1, 2022)
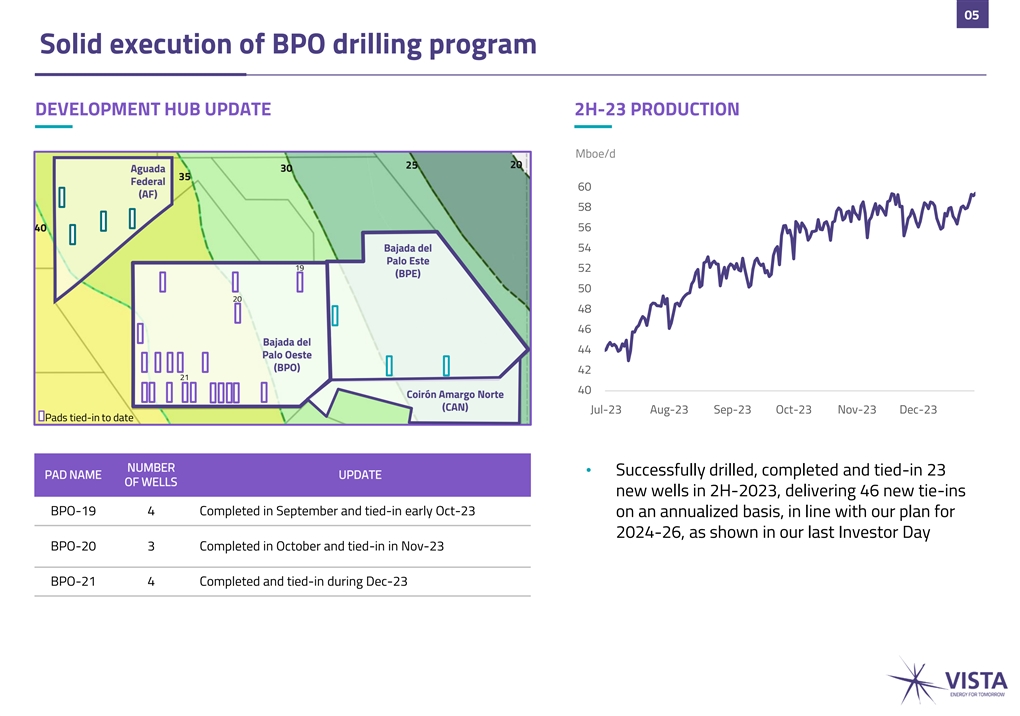
05 Solid execution of BPO drilling program DEVELOPMENT HUB UPDATE 2H-23
PRODUCTION Mboe/d 25 20 30 Aguada 35 Federal 60 (AF) 58 40 56 Bajada del 54 Palo Este 19 52 (BPE) 50 20 48 46 Bajada del 44 Palo Oeste (BPO) 42 21 40 Coirón Amargo Norte (CAN) Jul-23 Aug-23 Sep-23 Oct-23 Nov-23 Dec-23 Pads tied-in to date
NUMBER • Successfully drilled, completed and tied-in 23 PAD NAME UPDATE OF WELLS new wells in 2H-2023, delivering 46 new tie-ins BPO-19 4 Completed in September and tied-in early Oct-23 on an annualized basis, in line with our plan for
2024-26, as shown in our last Investor Day BPO-20 3 Completed in October and tied-in in Nov-23 BPO-21 4 Completed and tied-in during Dec-23

06 Stable revenues, as oil production growth offsets lower prices (1)
REVENUES AVERAGE CRUDE OIL PRICE AVERAGE NATURAL GAS PRICE $MM $/bbl $/MMBtu 2.2 2.2 2.0 (2)% (50)% (3)% 320.3 4.5 68.9 309.2 67.6 67.8 302.8 3.3 2.2 57% 55% 52% Q4-22 Q3-23 Q4-23 Q4-22 Q3-23 Q4-23 Q4-22 Q3-23 Q4-23 Total revenues % of export in
total revenues Oil exports (MMbbl) (2) ▪ Exported 2.0 MMbbl of crude oil, ▪ Realized oil prices of 63.7$/bbl▪ Decrease in industrial gas representing 49% of total oil sales in the domestic market and prices from 3.0 $/MMBtu in Q4
(3) volumes and 53% of total oil 74.2$/bbl in the export market 2022 to 1.3 $/MMBtu in Q4 revenues 2023 ▪ Gas revenues decreased by 9.2 $MM ▪ Decrease in export gas prices y-o-y from 8.8 $/MMBtu in Q4 2022 to 7.6 $/MMBtu in Q4 2023 (1)
Revenues include export duties: 12.2 $MM in Q4-22, 13.1 $MM in Q3-23 and 12.4 $MM Q4-23 (2) Does not include trucking transportation cost from sales point to refinery. Total realized oil price net of this cost is 61.8 $/bbl in Q4-23 (3) Net of
export tax. Export price before export tax was 80.1 $/bbl in Q4-23

07 Strong cost reduction driven by economies of scale (1) (1)(2) LIFTING
COST LIFTING COST PER BOE $MM $/boe (40)% (38)% 36.1 7.2 (11)% 4.8 22.3 21.9 4.3 56.4 54.7 49.5 Q4-22 Q3-23 Q4-23 Q4-22 Q3-23 Q4-23 Lifting cost per boe Total production (Mboe/d) ▪ Sequential improvement in cost per boe as we continue to
dilute fixed costs through additional production volumes ▪ Peso devaluation had a positive impact on lifting cost only during the second half of December (1) Lifting cost includes production, transportation, treatment and field support
services; excludes crude stock fluctuations, depreciation, royalties, direct taxes, commercial, exploration, G&A costs and Other non-cash costs related to the transfer of conventional assets (2) Lifting cost is shown as Operating costs in our
Income Statement. Lifting cost per boe = Operating costs / Total production. Lifting cost for Q4-23 (4.3 $/boe) = Operating costs (22.3 $MM) / Total production (5.2 MMboe)

08 Strong increase in Adj. EBITDA (1) (2) (3) ADJ. EBITDA ADJ. EBITDA
MARGIN NETBACK $MM % $/boe +7pp +43% +39% p.p. +27% p.p. 288.1 55.6 78% 49.8 226.4 73% 201.7 65% 40.1 68.9 67.6 67.8 Q4-22 Q3-23 Q4-23 Q4-22 Q3-23 Q4-23 Q4-22 Q3-23 Q4-23 Adj. EBITDA margin Realized crude oil price ($/bbl) ▪ Improvement in
Adj. EBITDA driven by increase in production amid lower lifting costs ▪ Q4-23 Adj. EBITDA includes 81 $MM, accounted for as Other operating income, corresponding to the repatriation of 27% of export proceeds at the blue-chip swap FX (1) Adj.
EBITDA = Net (loss) / profit for the period + Income tax (expense) / benefit + Financial results, net + Depreciation, depletion and amortization + Transaction costs related to business combinations + Restructuring and reorganization expenses + Gain
related to the transfer of conventional assets + Other non-cash costs related to the transfer of conventional assets + Impairment (recovery) of long-lived assets + other adj. (2) Adj. EBITDA Margin = Adj. EBITDA / (Total Revenues + Gain from exports
increase program) (3) Netback = Adj. EBITDA / Total production volumes

09 9 Positive free cash flow quarter (1) (3) Q4 2023 CASH FLOW EVOLUTION
FREE CASH FLOW $MM $MM 107 57 (43) Beginning of period Operating activities Investing activities Financing activities End of period (2) cash position cash flow cash flow cash flow cash position Q4-22 Q3-23 Q4-23 ▪ Operating activities cash
flow positively impacted by normalization of working capital from revenue collections (49.2 $MM decrease) ▪ Cash flow used in investing activities reflects capex of 212.1 $MM for the quarter and 16.8 $MM increase in capex-related working
capital ▪ Cash flow used in financing activities reflects the prepayments of Peso-inflation-adjusted bond series VIII and X for an equivalent of 46.7 $MM and the prepayment of bond series III for 9.5 $MM ▪ Maintained low leverage ratios
with NLR at 0.46x Adj. EBITDA (1) Cash is defined as Cash, bank balances and other short-term investments (2) For the purpose of this graph, cash flow used in financing activities is the sum of: (i) cash flow used in financing activities for (69.9)
$MM; (ii) effect of exposure to changes in the foreign currency rate of cash and cash equivalents and other financial results for 2.0 $MM; and (iii) the variation in Government bonds for 0.8 $MM (3) Free cash flow = Operating activities cash flow +
Investing activities cash flow

10 Full year 2023 highlights Increased P1 reserves Delivered solid
operating Progressed in Delivered robust total and well inventory performance sustainability metrics shareholder returns (2) (3) P1 Reserves Production GHGE intensity Adj. EBITDA 319 MMboe 51.1 Mboe/d 15.6 kgCO e/boe 871 $MM 2 (1) 18% y-o-y pro
forma 27% y-o-y (13)% y-o-y 14% y-o-y 5% y-o-y (4) (5) (6) Inventory Lifting cost TRIR Stock price performance 1,150 wells 5.1 $/boe 0.2 +115% Below 1.0 for the fourth From December 31, 2022, 28% y-o-y (33)% y-o-y consecutive year to February 16,
2024 Transfer of conventional assets transformed Vista into a fully-focused Vaca Muerta company with stronger financial and operational metrics (1) Pro forma production reflects production net of assets transferred to Aconcagua on March 1, 2023
(shows + Other non-cash costs related to the transfer of conventional assets + Impairment (recovery) of long-lived production as if the transaction had occurred on March 1, 2022) assets + other adj. (2) Scope 1 & 2 GHG emissions (4) Includes 99
wells tied-in at YE 2023 (3) Adj. EBITDA = Net (loss) / profit for the period + Income tax (expense) / benefit + Financial results, net + (5) Lifting cost includes production, transportation, treatment and field support services; excludes crude
stock Depreciation, depletion and amortization + Transaction costs related to business combinations + fluctuations, depreciation, royalties, direct taxes, commercial, exploration and G&A costs Restructuring and reorganization expenses + Gain
related to the transfer of conventional assets (6) TRIR (Total recordable injury rate): Number of recordable incidents x 1,000,000 / total number of hs worked

11 Increased proved reserves by 27% (1) Proved reserves as of December 31,
2023 Key drivers MMboe ▪ Added 40 new well locations in Bajada del Palo Oeste, 26 in Bajada del Palo Este, 19 in Aguada Federal and 2 in Águila Mora, resulting in a total of 297 booked P1 well locations Proved reserves breakdown (3) In
MMboe Oil Gas Total Bajada del Palo Oeste 188.0 33.9 221.8 36.7 3.5 40.1 Bajada del Palo Este Aguada Federal 33.7 5.6 39.3 1.1 0.2 1.3 Aguila Mora Coirón Amargo Norte 0.2 0.0 0.3 Acambuco 0.1 0.5 0.6 7.3 2.8 10.1 CS-01 (2) (5) Conv. Transferred
assets 2.5 2.5 5.0 269.6 48.9 318.5 Total % Certified present value at 10% % 458 485 17.1 years attributable to Vista’s interest in P1 (4) (3) Total RRR reserves of 3.3 $Bn Oil RRR Reserves life (1) Proved reserves were certified by DeGolyer
& MacNaughton, under SEC methodology. 1 cubic meter of oil = 6.2898 barrels of oil; 1,000 cubic meters of gas = 6.2898 barrels of oil equivalent (2) Net additions are calculated as the difference between: (i) YE 2023 proved reserves and (ii) YE
2022 proved reserves minus 2023 total production (3) Includes crude oil and condensate, and NGL; NGLs represent less than 1% of total reserves (4) Based on reserves certification reports performed by DeGolyer & McNaughton for Argentina and
Mexico, under SEC guidelines. Realized oil price assumption of 66.5 $/bbl for Argentina (5) Transferred Conventional Assets operated by Aconcagua, effective as of March 1, 2023

12 Achieved significant operating milestones during 2023 Activity Tied-in
31 new wells Total production was Added 250 new well locations to our PPP during the year, of 51.1 Mboe/d, an 18% drilling inventory which 23 were tied-in y-o-y increase on a o Added 100 new wells in Aguila Mora (1) during 2H-23 pro forma basis o
De-risked eastern section of Bajada del Palo Este, adding 100 new wells and 50 wells in Coirón Amargo Norte Treatment and take-away capacity Secured enough midstream capacity to deliver Oil exports increased Initiated exports to PPP Chile with
4.7 Mbbl/d on our updated 2026 production target to 52% of total exported during Q4- volumes in 2023, o Obtained 31.5 Mbbl/d of oil pipeline from 44% in 2022 23 capacity in Oldelval expansion, and 12.5 Mbbl/d in VM Norte pipeline o Upgraded
treatment plant in our development hub to process up to 70 Mbbl/d of crude oil (1) Pro forma production reflects production net of assets transferred to Aconcagua on March 1, 2023 (shows production as if the transaction had occurred on March 1,
2022)

13 Solid progress in our emissions reduction and NBS projects
Decarbonizing our operations NBS projects progress Aike has made solid progress in the development of nature-based (1) (1) GHG EMISSIONS GHG EMISSIONS INTENSITY solutions projects for Vista in Argentina MtCO2e kg CO2e/boe ▪ Mixed Forestry:
Completed planting in Rolón Cue (2,300 ha, 2.5 million trees). Initiated soil preparation activities in Villa Zenaida (13)% (13)% (1,400 ha). Completed social baseline and definition of socio- 18.1 355 environmental impact plan 15.6 308 ▪
Forest Conservation: Requested permits for firebreaks, initiated construction of fences, water wells and housing in Q1-24. Initiated social and biodiversity baseline studies ▪ Regenerative Livestock: 5,740 ha added in 2023, reaching a total of
7,640 ha ▪ Regenerative Agriculture: 4,300 ha added in 2023, reaching a total of 6,950 ha 2022 2023 2022 2023 ▪ Filed Afforestation, Conservation, and Regenerative Livestock projects with Verra Rolón Cue project Key decarbonization
projects: Province of Corrientes, Argentina ▪ Installation of new vapor recovery units ▪ Optimization of glycol dehydration process ▪ Electrification of Coirón Amargo Norte block ▪ Addition of renewables to our energy
matrix ▪ Construction of electric line to feed electric gas compressors and drilling rigs (1) Scope 1 and Scope 2 GHG emissions
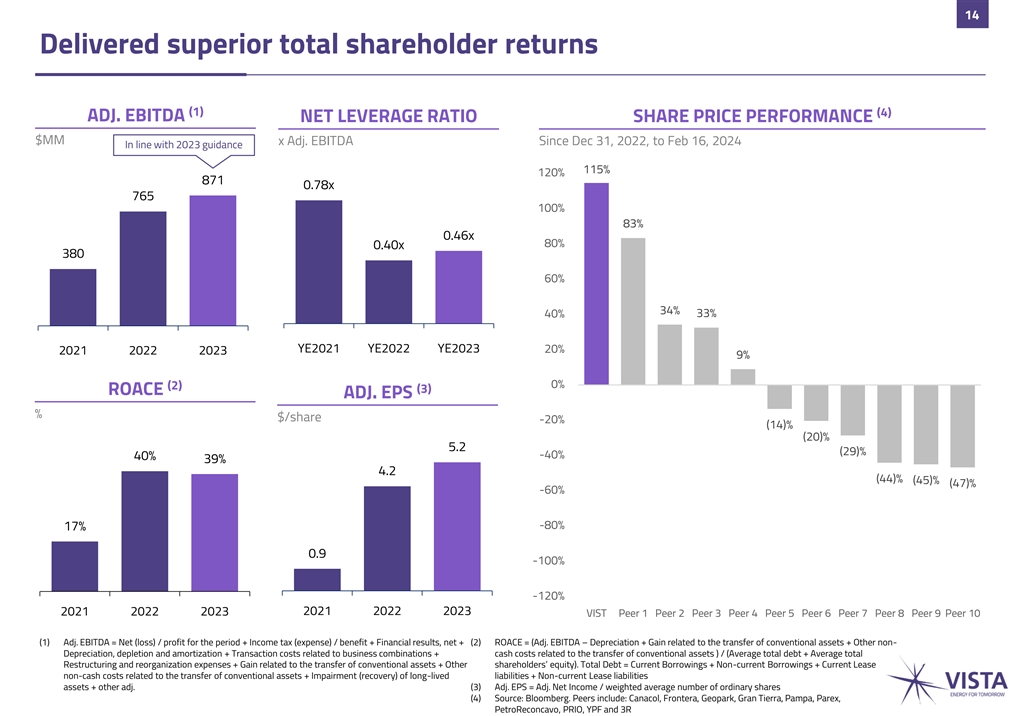
14 Delivered superior total shareholder returns (1) (4) ADJ. EBITDA NET
LEVERAGE RATIO SHARE PRICE PERFORMANCE $MM x Adj. EBITDA Since Dec 31, 2022, to Feb 16, 2024 In line with 2023 guidance 115% 120% 871 0.78x 765 100% 83% 0.46x 80% 0.40x 380 60% 34% 33% 40% YE2021 YE2022 YE2023 20% 2021 2022 2023 9% 0% (2) (3) ROACE
ADJ. EPS % $/share -20% (14)% (20)% 5.2 (29)% -40% 40% 39% 4.2 (44)% (45)% (47)% -60% -80% 17% 0.9 -100% -120% 2021 2022 2023 2021 2022 2023 VIST Peer 1 Peer 2 Peer 3 Peer 4 Peer 5 Peer 6 Peer 7 Peer 8 Peer 9 Peer 10 (1) Adj. EBITDA = Net (loss) /
profit for the period + Income tax (expense) / benefit + Financial results, net + (2) ROACE = (Adj. EBITDA – Depreciation + Gain related to the transfer of conventional assets + Other non- Depreciation, depletion and amortization + Transaction
costs related to business combinations + cash costs related to the transfer of conventional assets ) / (Average total debt + Average total Restructuring and reorganization expenses + Gain related to the transfer of conventional assets + Other
shareholders’ equity). Total Debt = Current Borrowings + Non-current Borrowings + Current Lease non-cash costs related to the transfer of conventional assets + Impairment (recovery) of long-lived liabilities + Non-current Lease liabilities
assets + other adj. (3) Adj. EPS = Adj. Net Income / weighted average number of ordinary shares (4) Source: Bloomberg. Peers include: Canacol, Frontera, Geopark, Gran Tierra, Pampa, Parex, PetroReconcavo, PRIO, YPF and 3R

15 (1) 2024 Guidance (2) ACTIVITY CAPEX PRODUCTION # of wells tied-in $MM
Mboe/d (5) +23% +35% +48% 68-70 900 46 734 51 31 2023A 2024F 2023A 2024F 2023A 2024F ▪ Activity focused in BPO, BPE, and Aguada▪ Driven by higher D&C activity and upfront ▪ Forecasting solid y-o-y growth every Federa
investments in facilities and midstream for quarter future growth (3) (4) LIFTING COST ADJ. EBITDA $/boe $MM (11)% (5) +23% We plan to continue 1,000-1,150 implementing projects 5.1 4.5 871 to reduce our GHG emissions intensity (6) during 2024 2023A
2024F 2023A 2024F ▪ Mainly driven by production growth▪ Based on 68-70 Mboe/d production and 65-70 $/bbl avg. realized oil price. On 2023 avg. realized oil price was 66.7 $/bbl (1) See “About projections and forward-looking
statements” on slide 2 (4) Adj. EBITDA = Net (loss) / profit for the period + Income tax (expense) / benefit + Financial results, net (2) Does not include upfront capacity payments to Oldelval or OTE + Depreciation + Restructuring and
Reorganization expenses + Impairment of long-lived assets + (3) Lifting cost includes production, transportation, treatment and field support services; excludes crude Other adj. stock fluctuations, depreciation, royalties, direct taxes, commercial,
exploration and G&A costs (5) Percentage increase calculated with the midpoint of the guidance range (6) Scope 1 & 2 GHG emissions

16 Closing remarks Delivered on our superior Consolidated fully Completed
a year of total shareholder returns focused Vaca Muerta robust operational and proposition, reflected in a company, with lower cost financial performance peer-leading stock and higher margins performance Issued 2024 guidance, Issued updated
strategic targeting 35% growth in plan, targeting to double production and 23% increase in production by 2026 while Adj. EBITDA funded with own generating free cash flow cash flow generation Limay River Province of Neuquén, Argentina

THANKS! Q&A
Vista Energy SAB de CV (NYSE:VIST)
Graphique Historique de l'Action
De Mar 2024 à Avr 2024

Vista Energy SAB de CV (NYSE:VIST)
Graphique Historique de l'Action
De Avr 2023 à Avr 2024
